
Numerical Investigation on the Mechanical Properties of Vault Void Lining and Steel Plate Strengthening

Abstract
:1. Introduction
2. Experimental Background
3. Numerical Model Settings
3.1. Material Constitutive Model
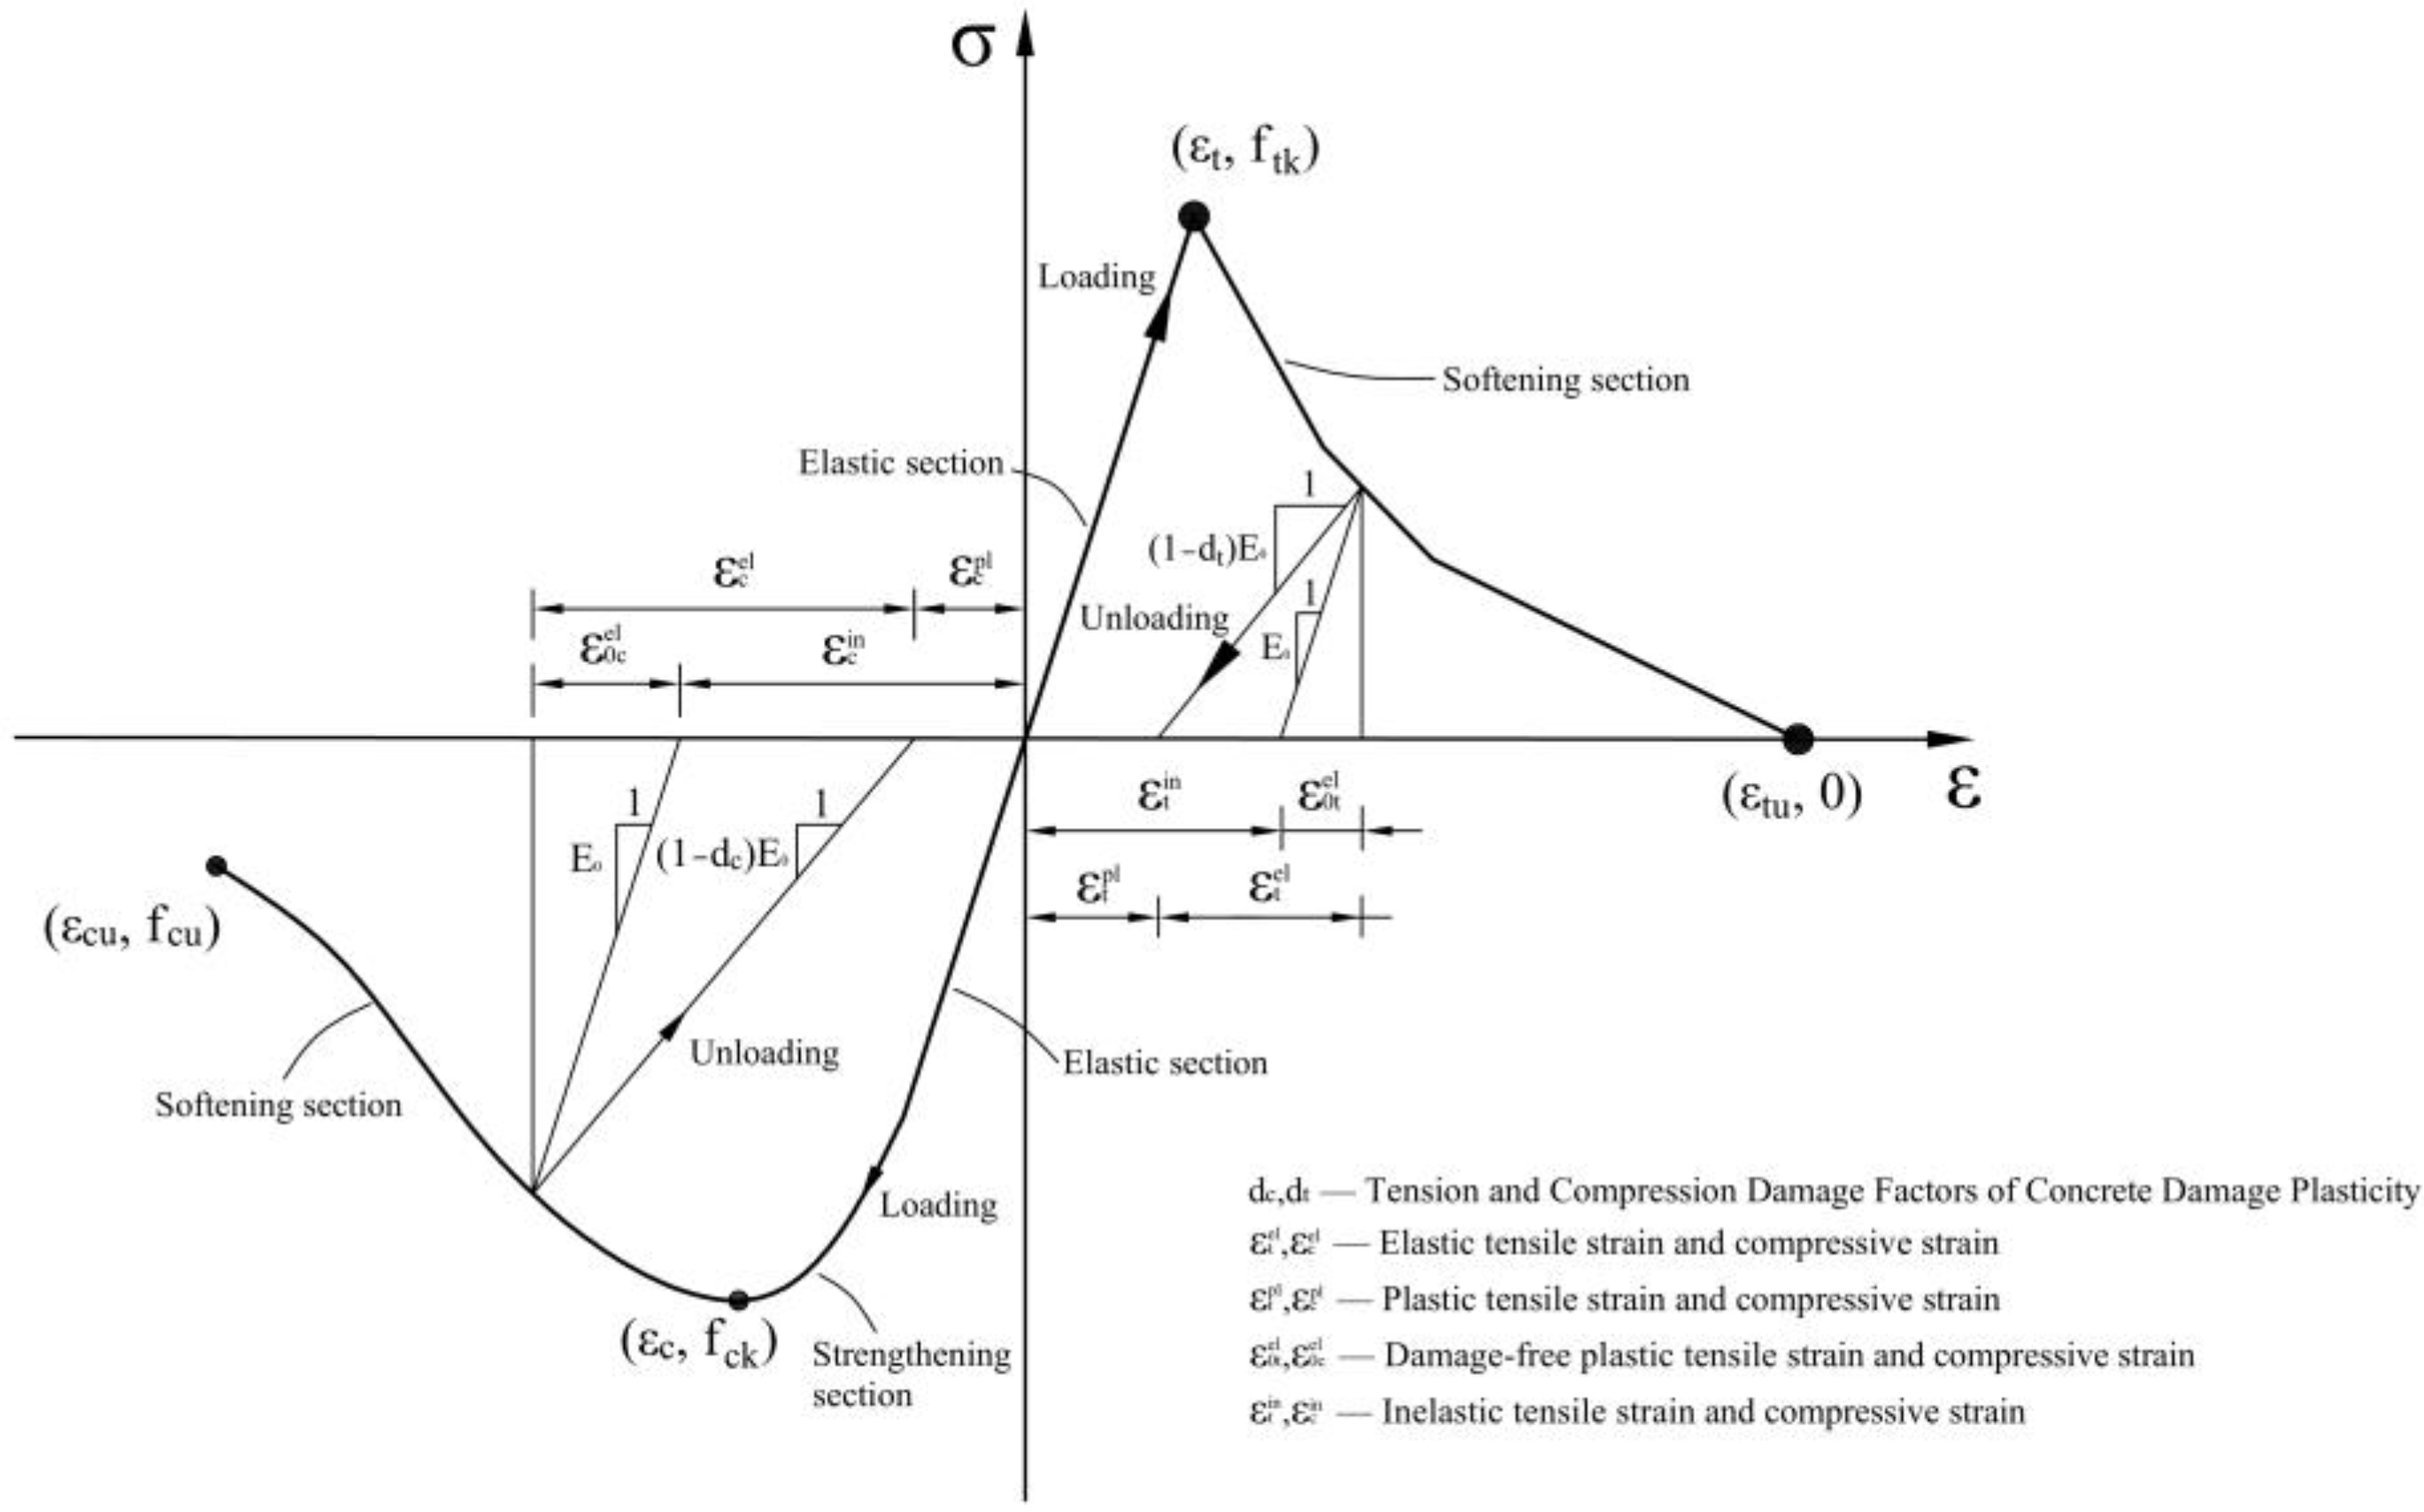
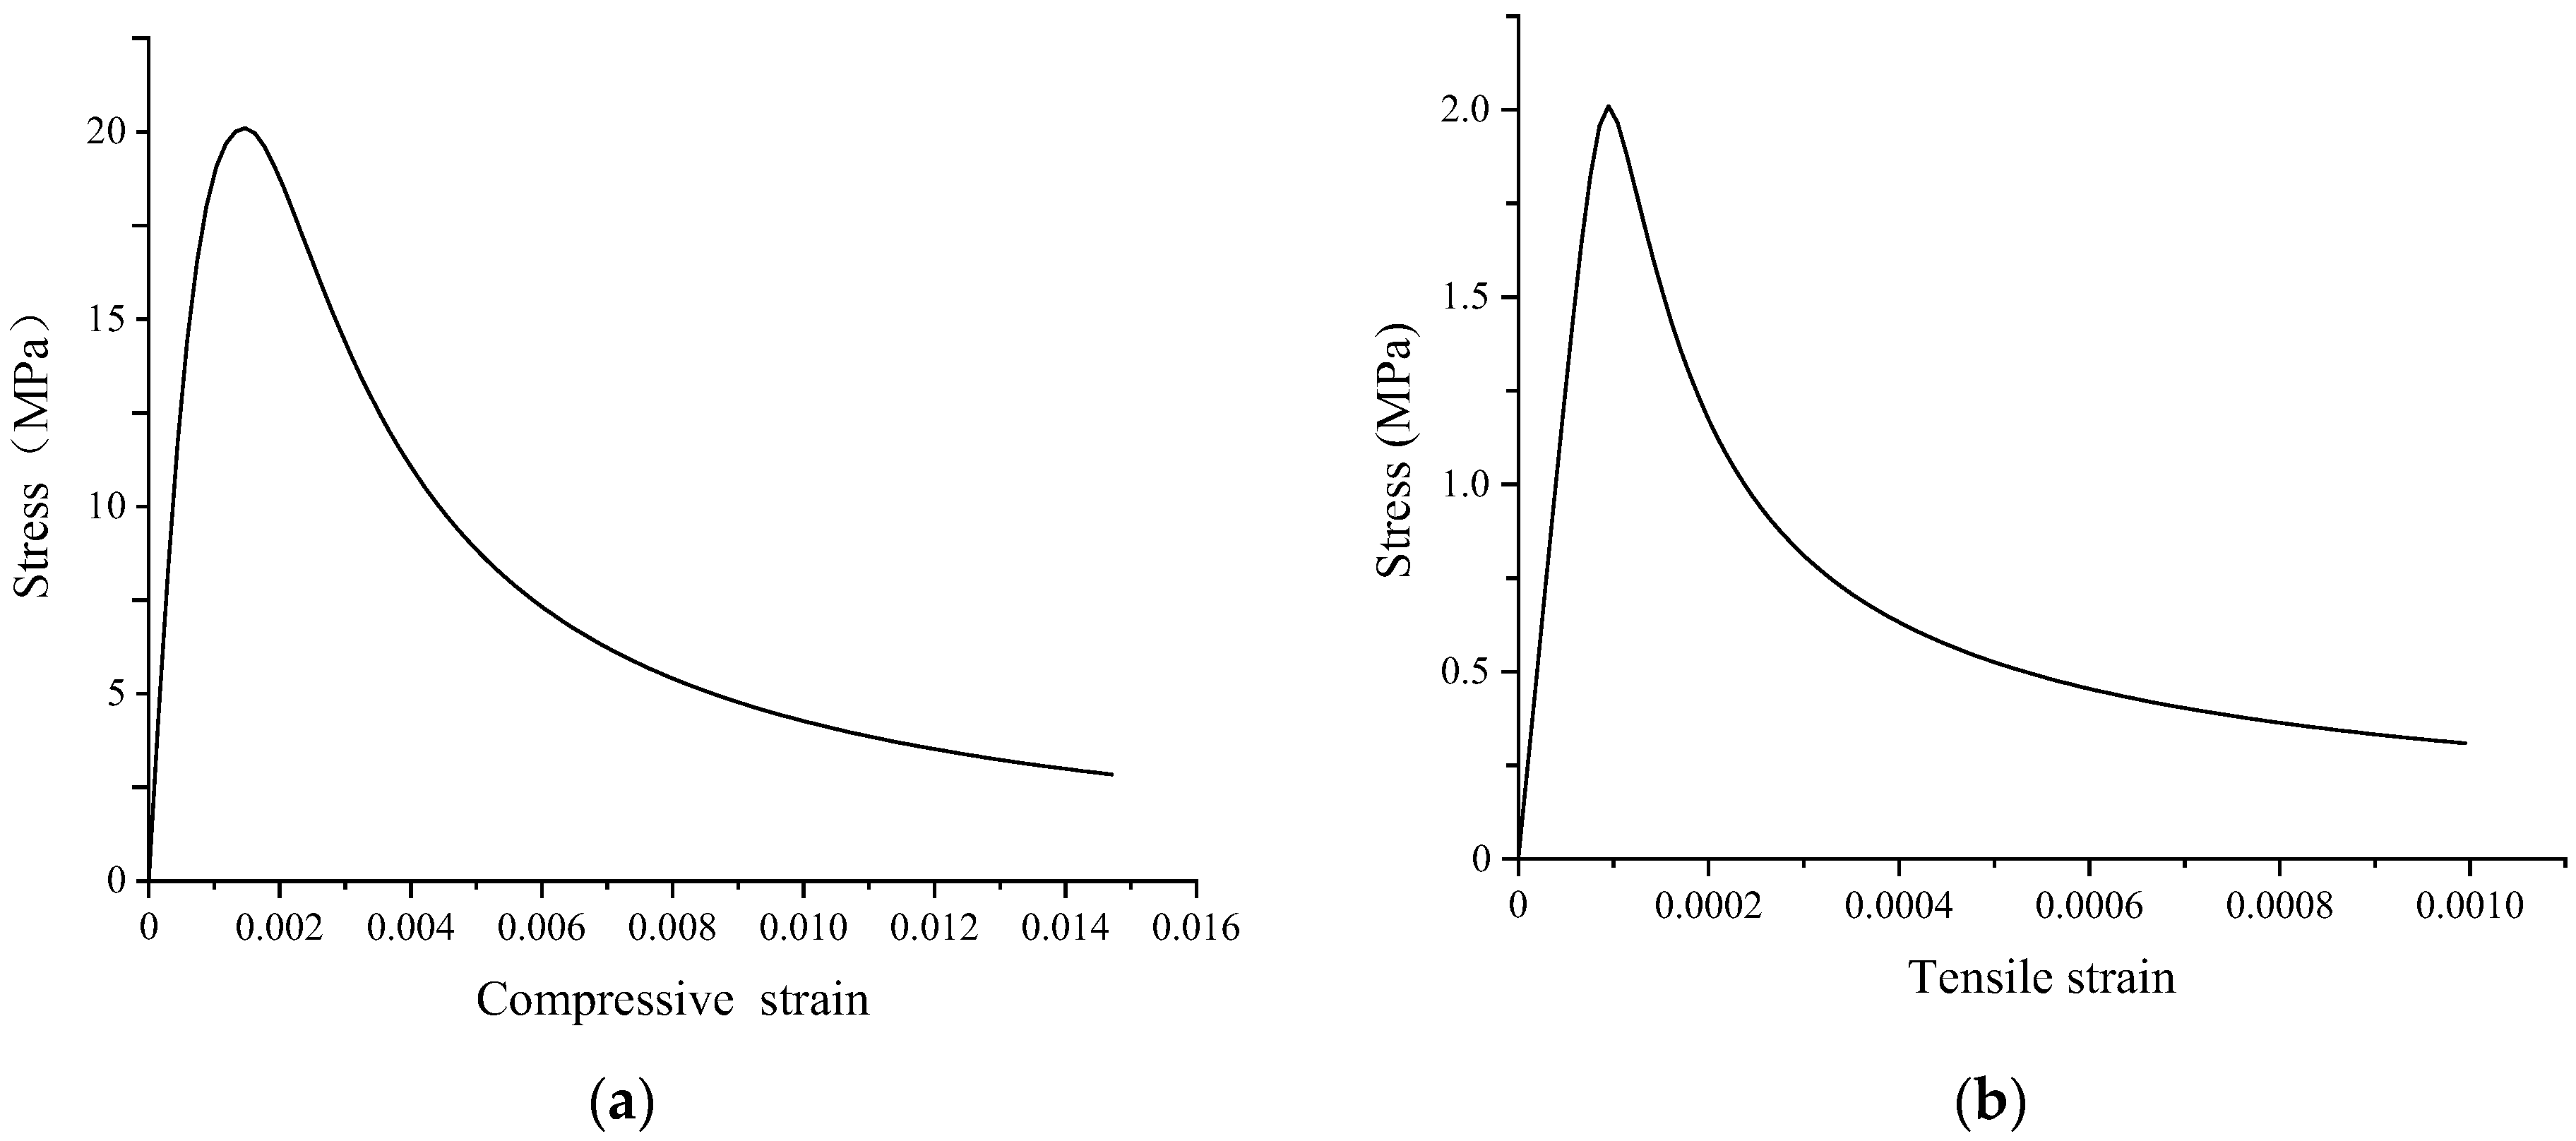
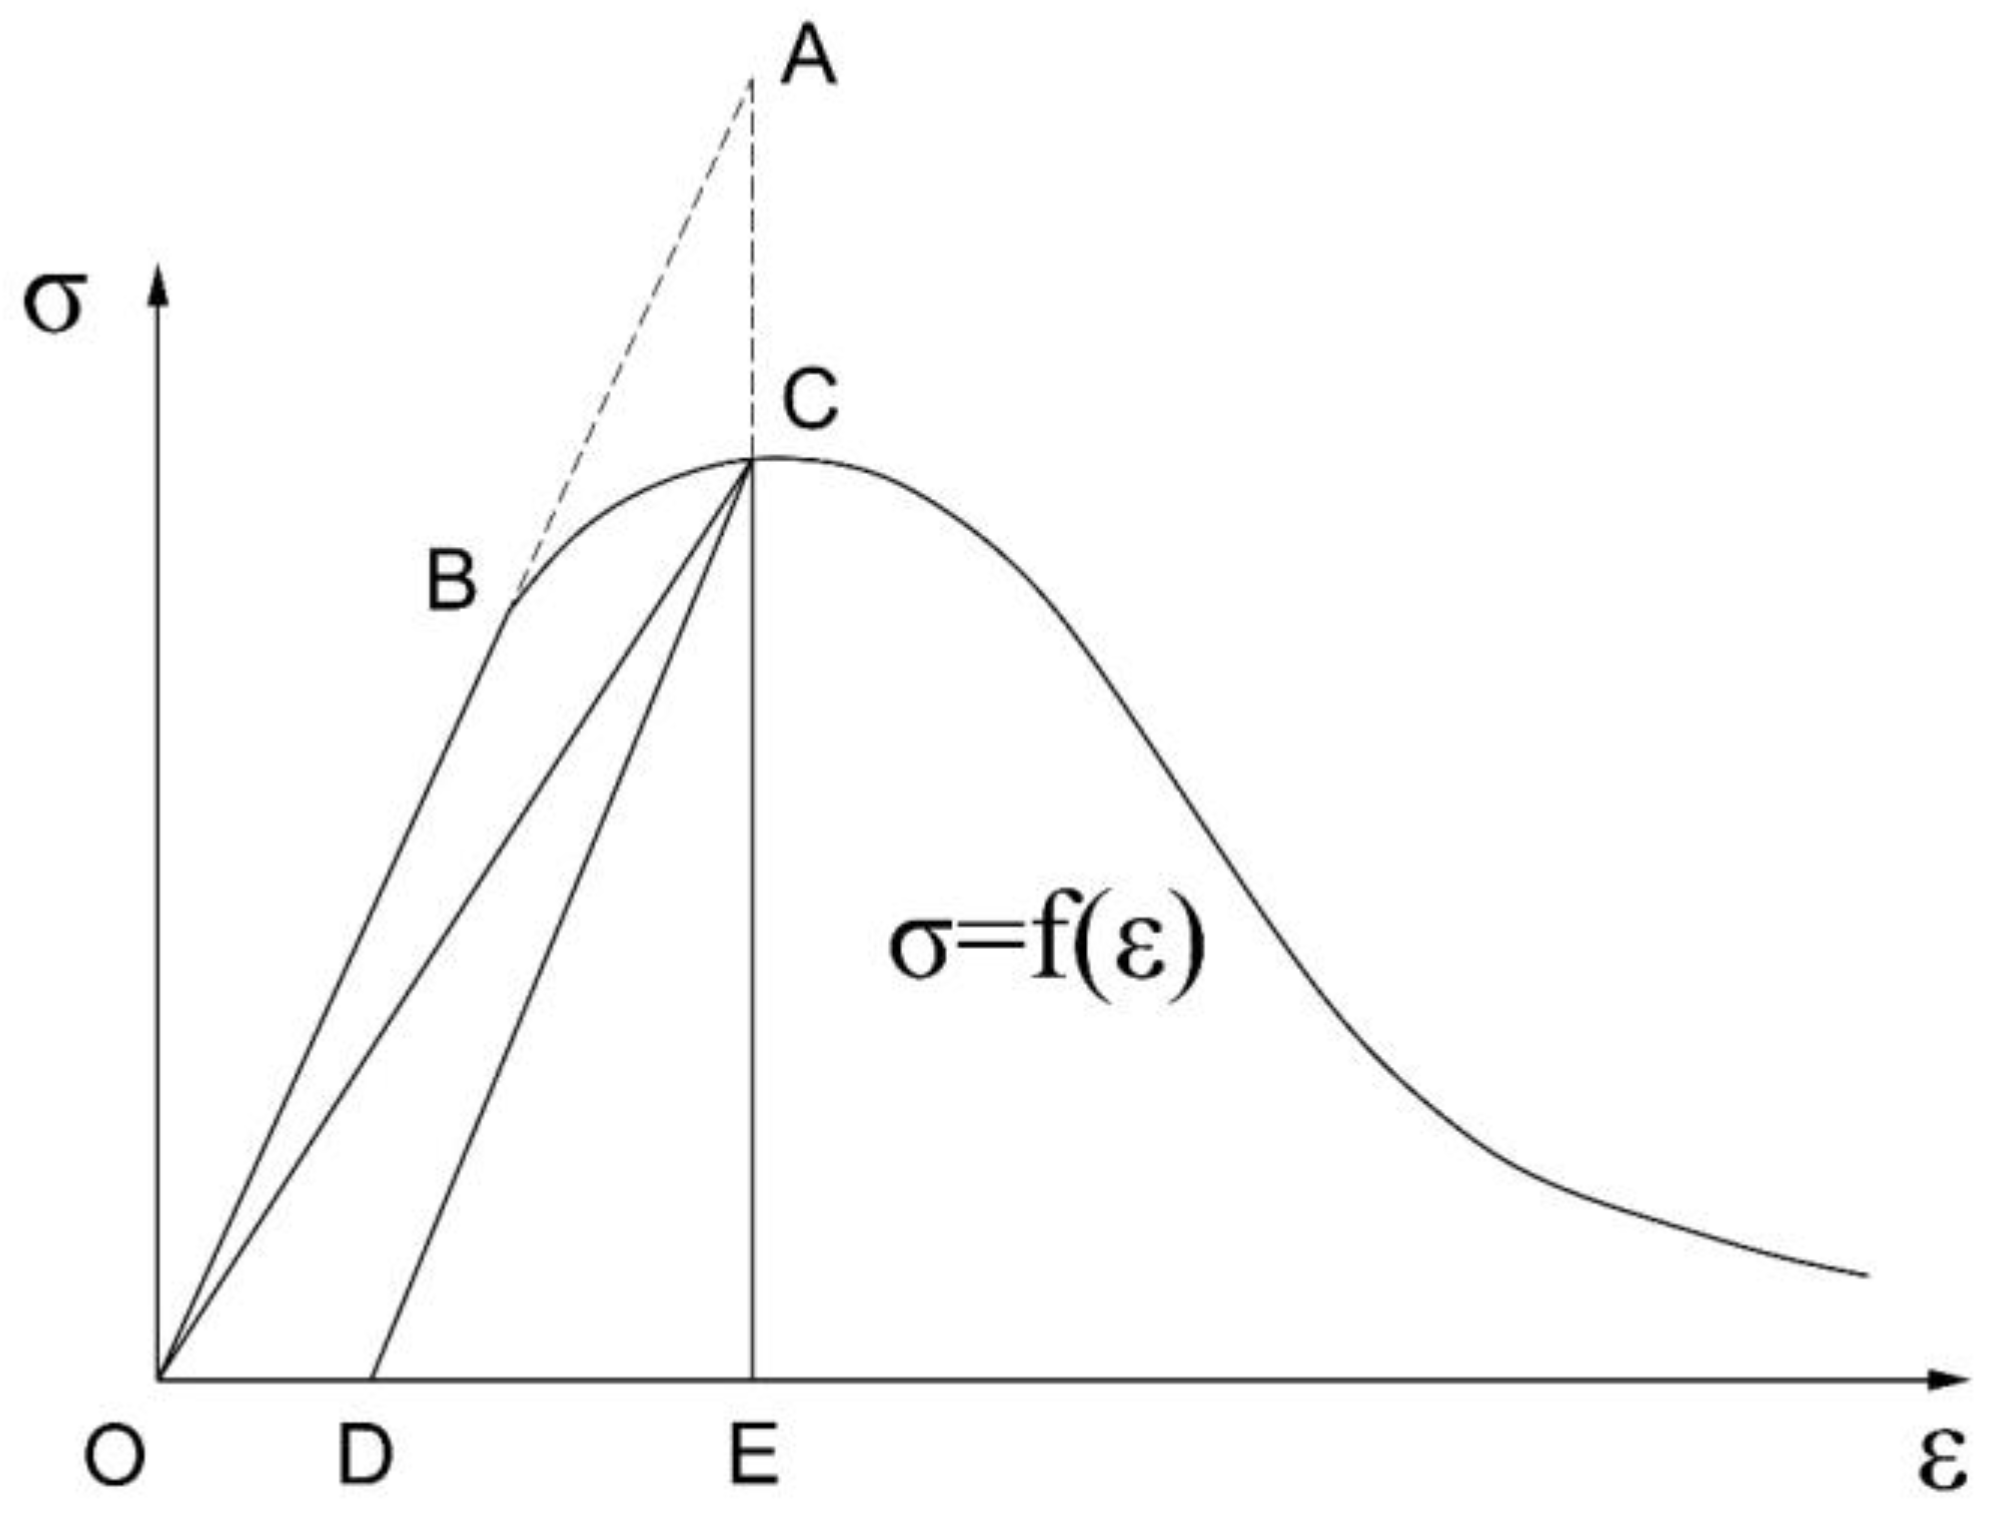
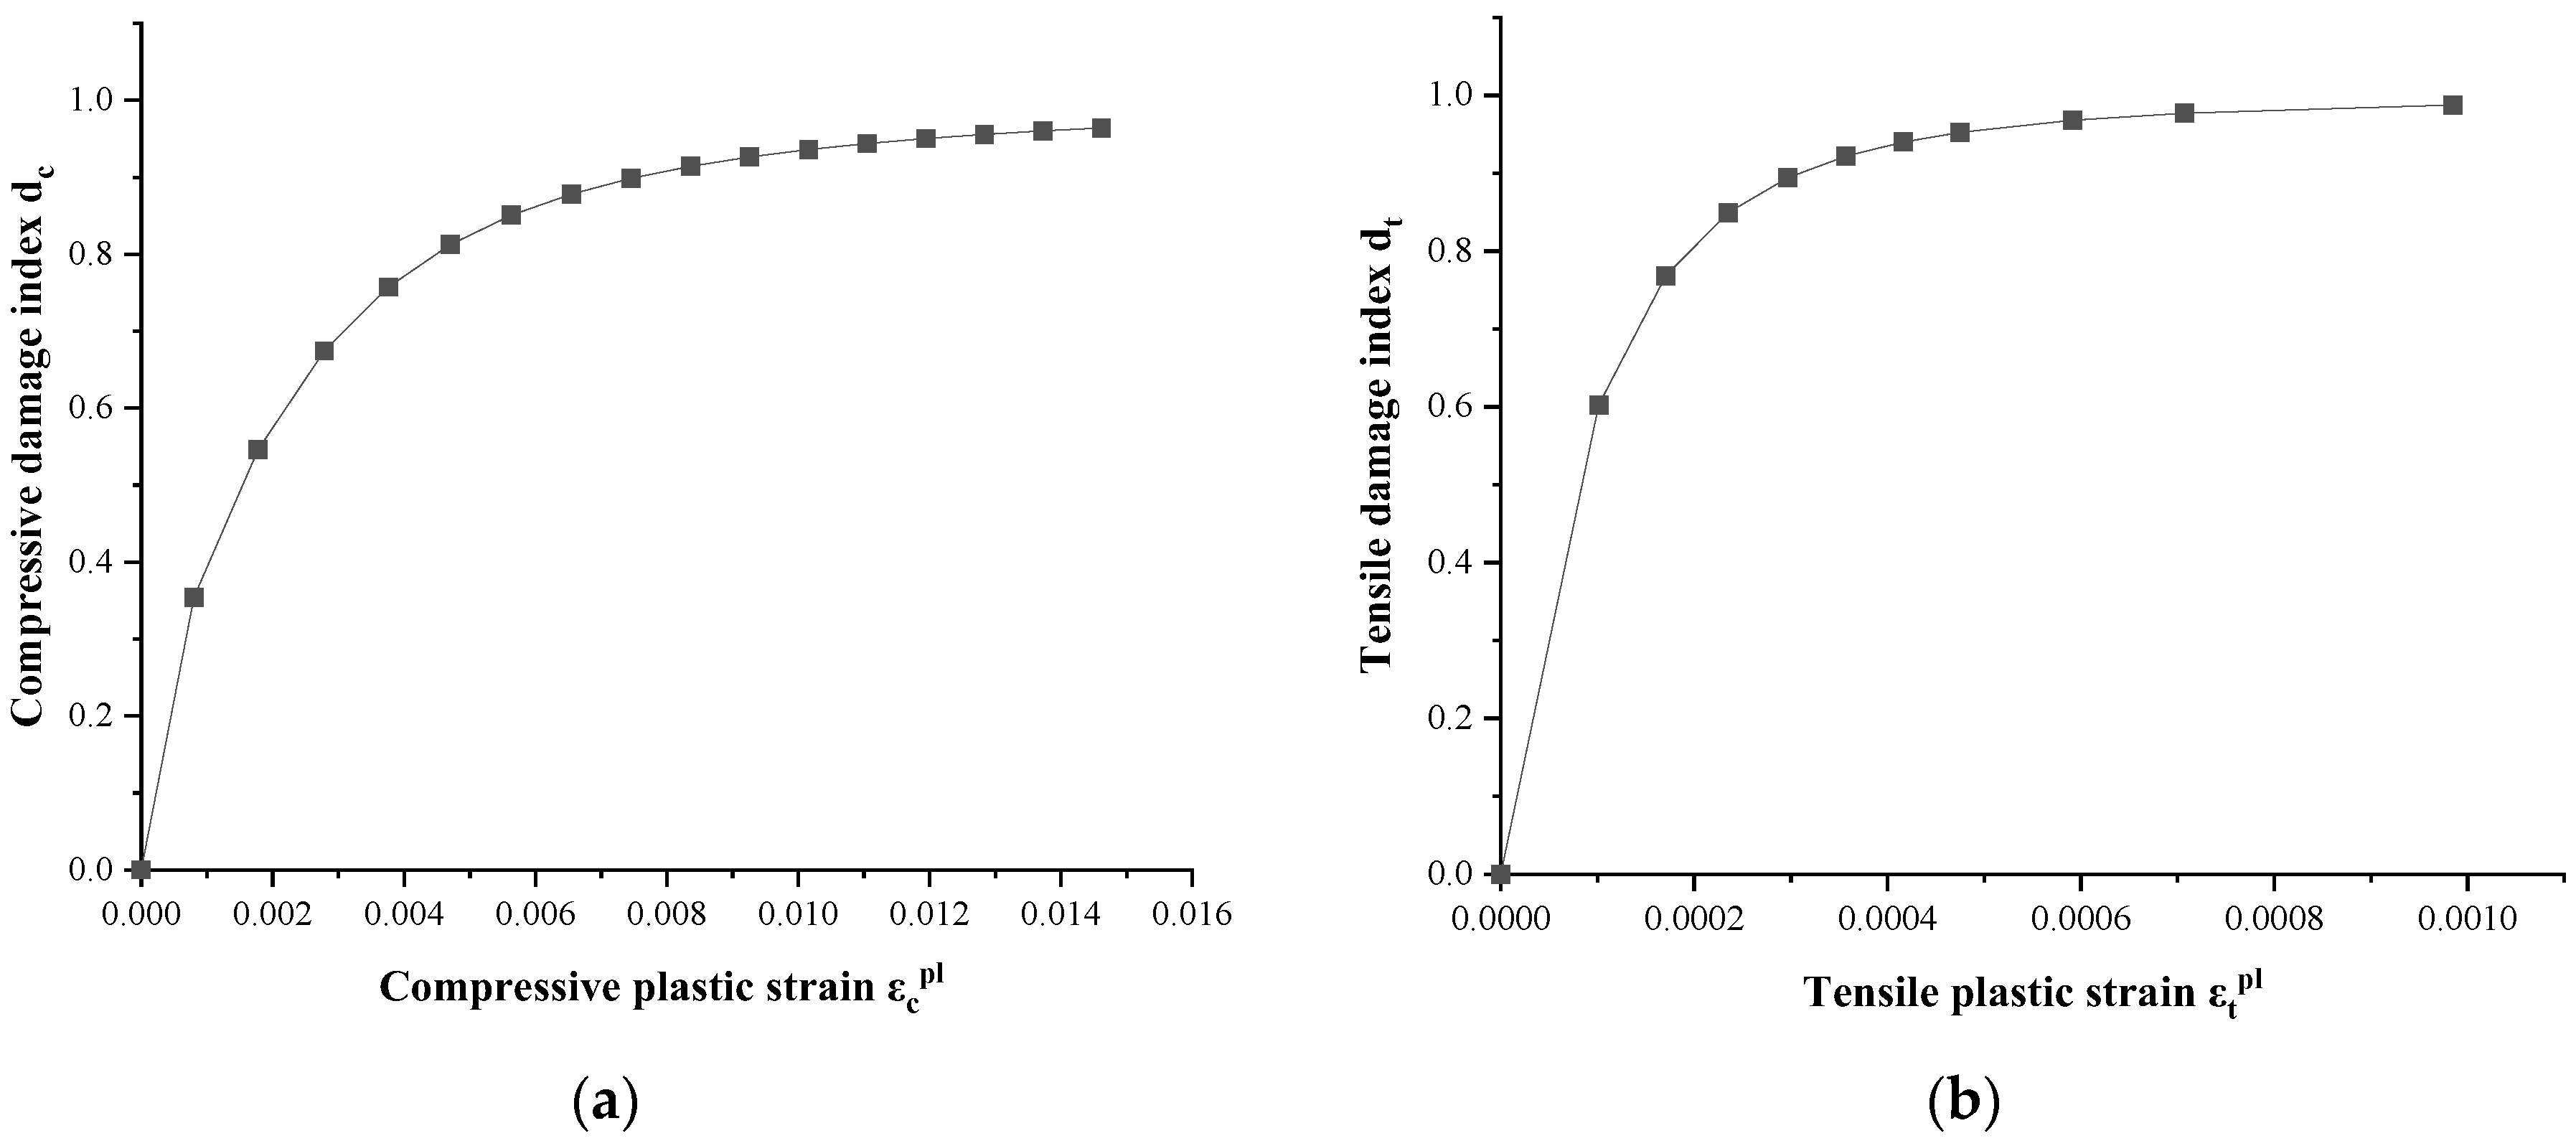
3.1.1. Constitutive Relation of Concrete
- (a)
- CDP
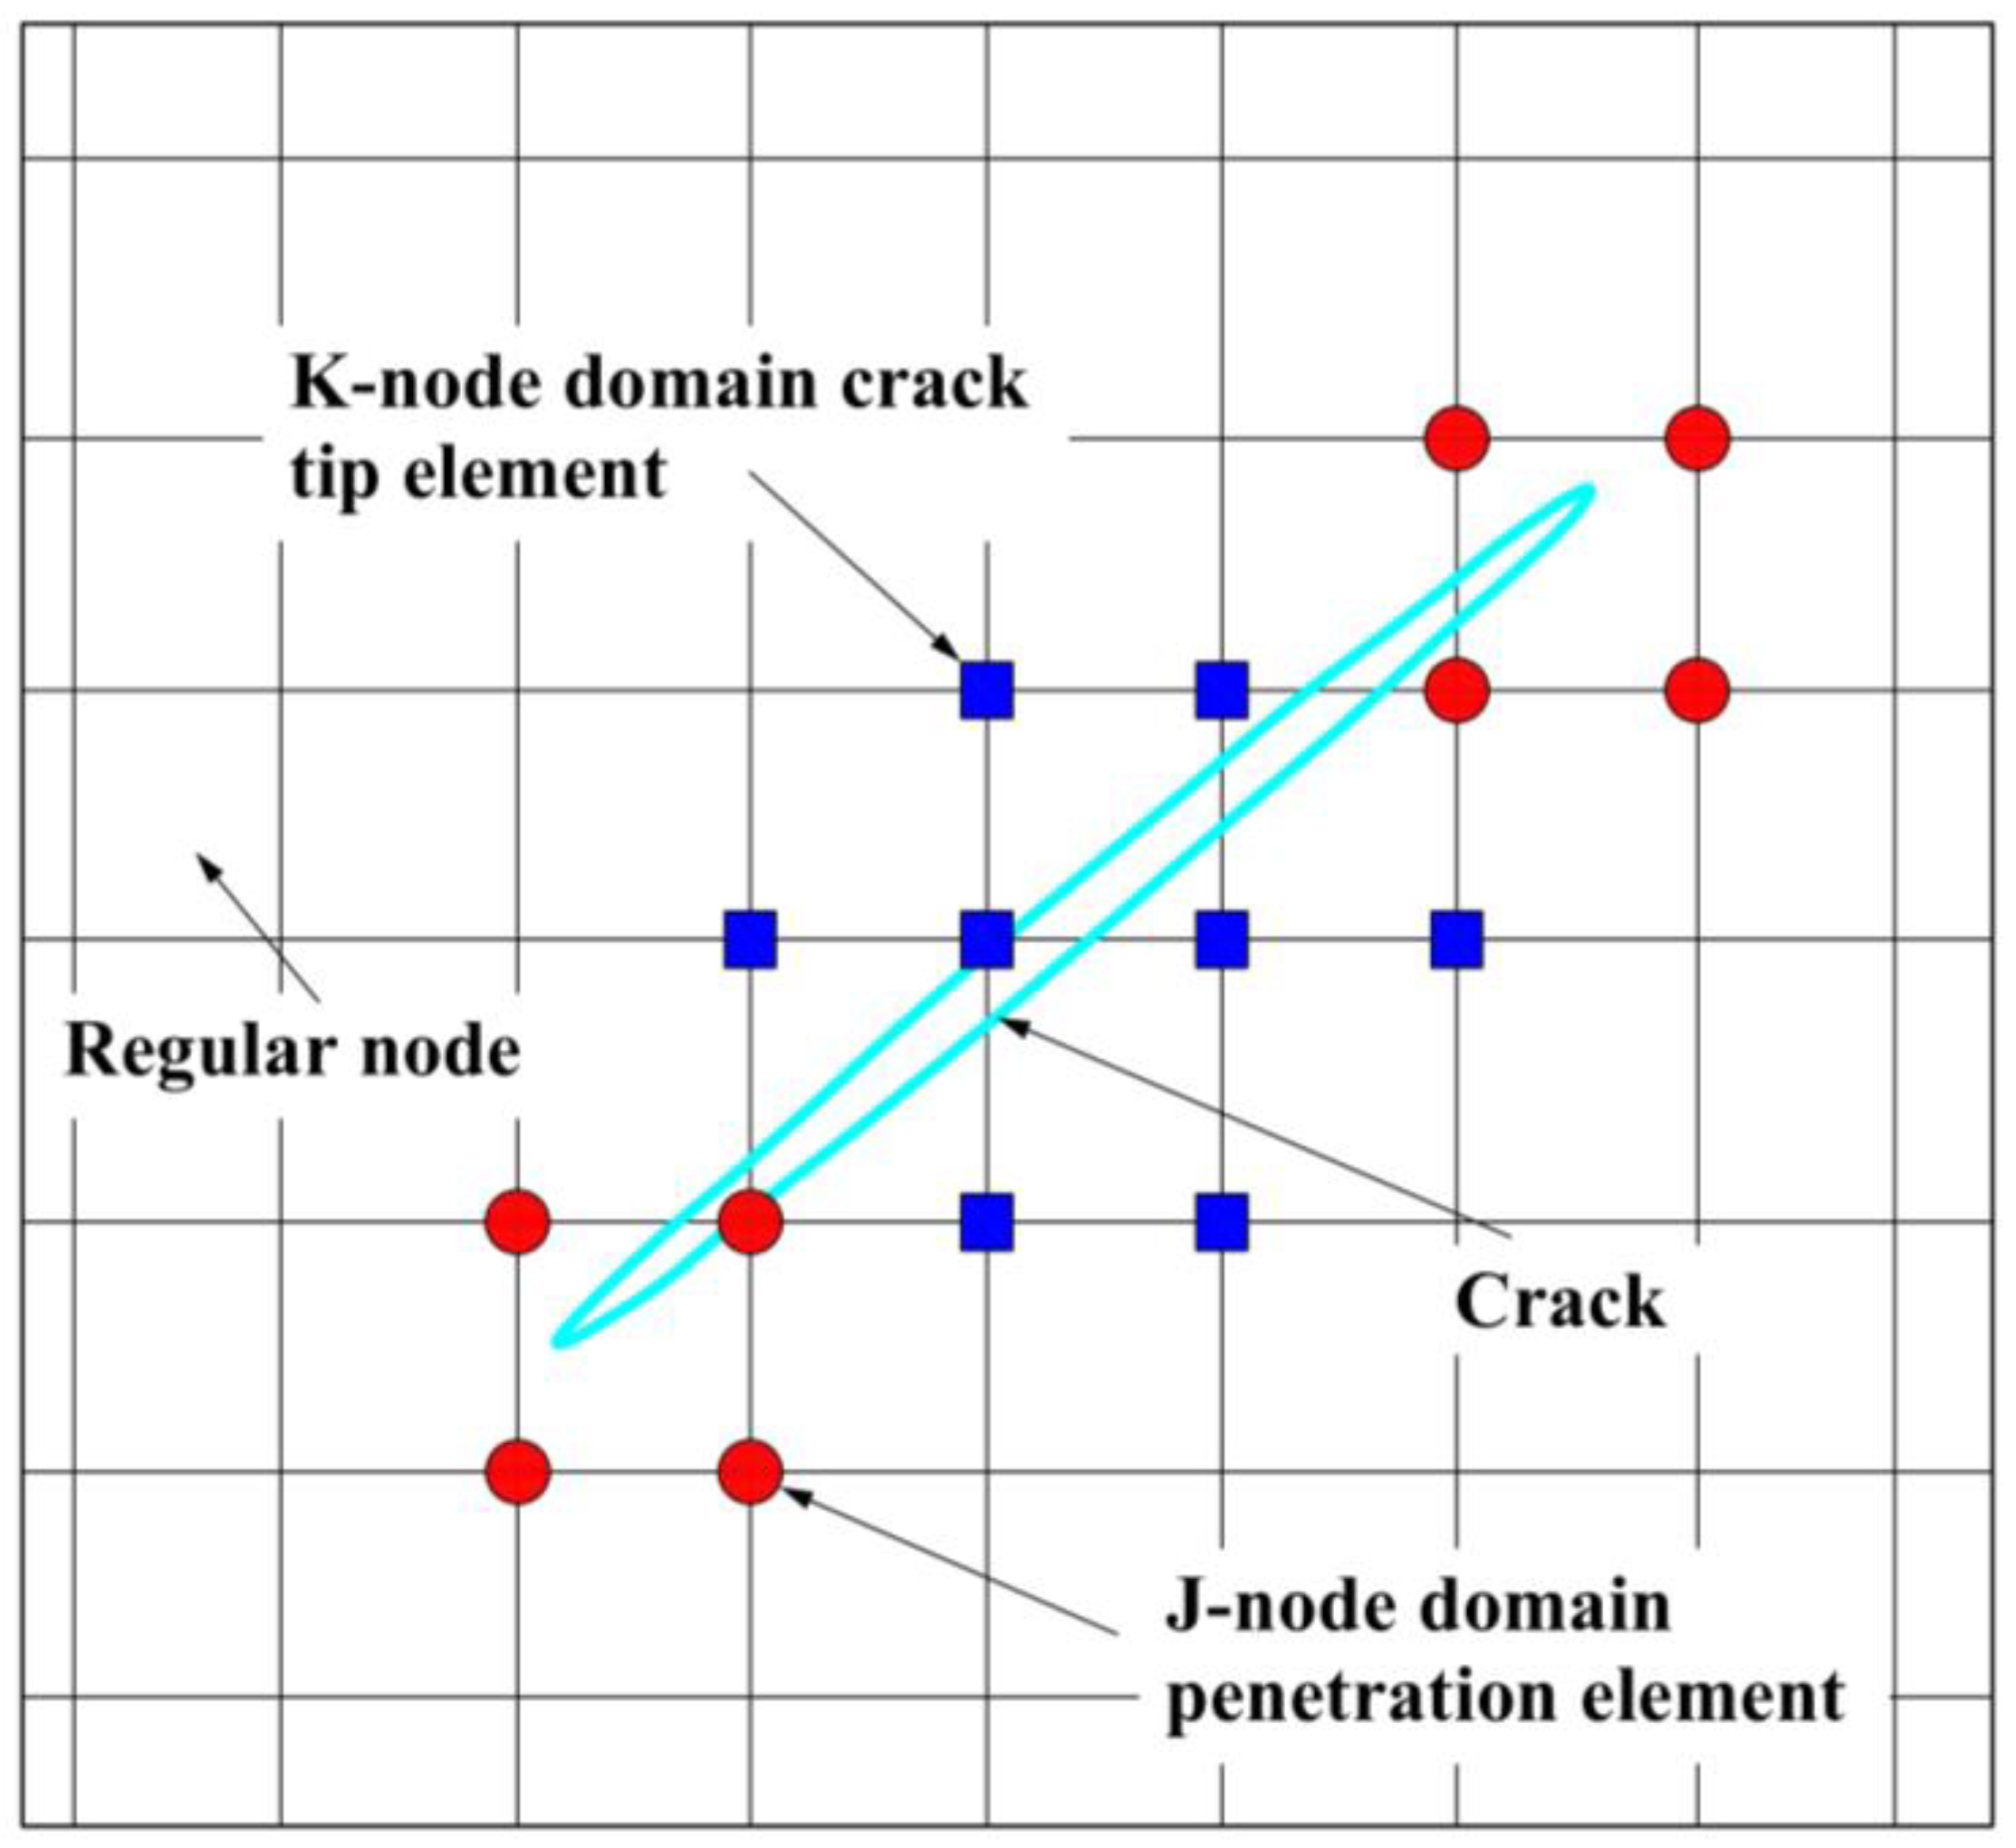
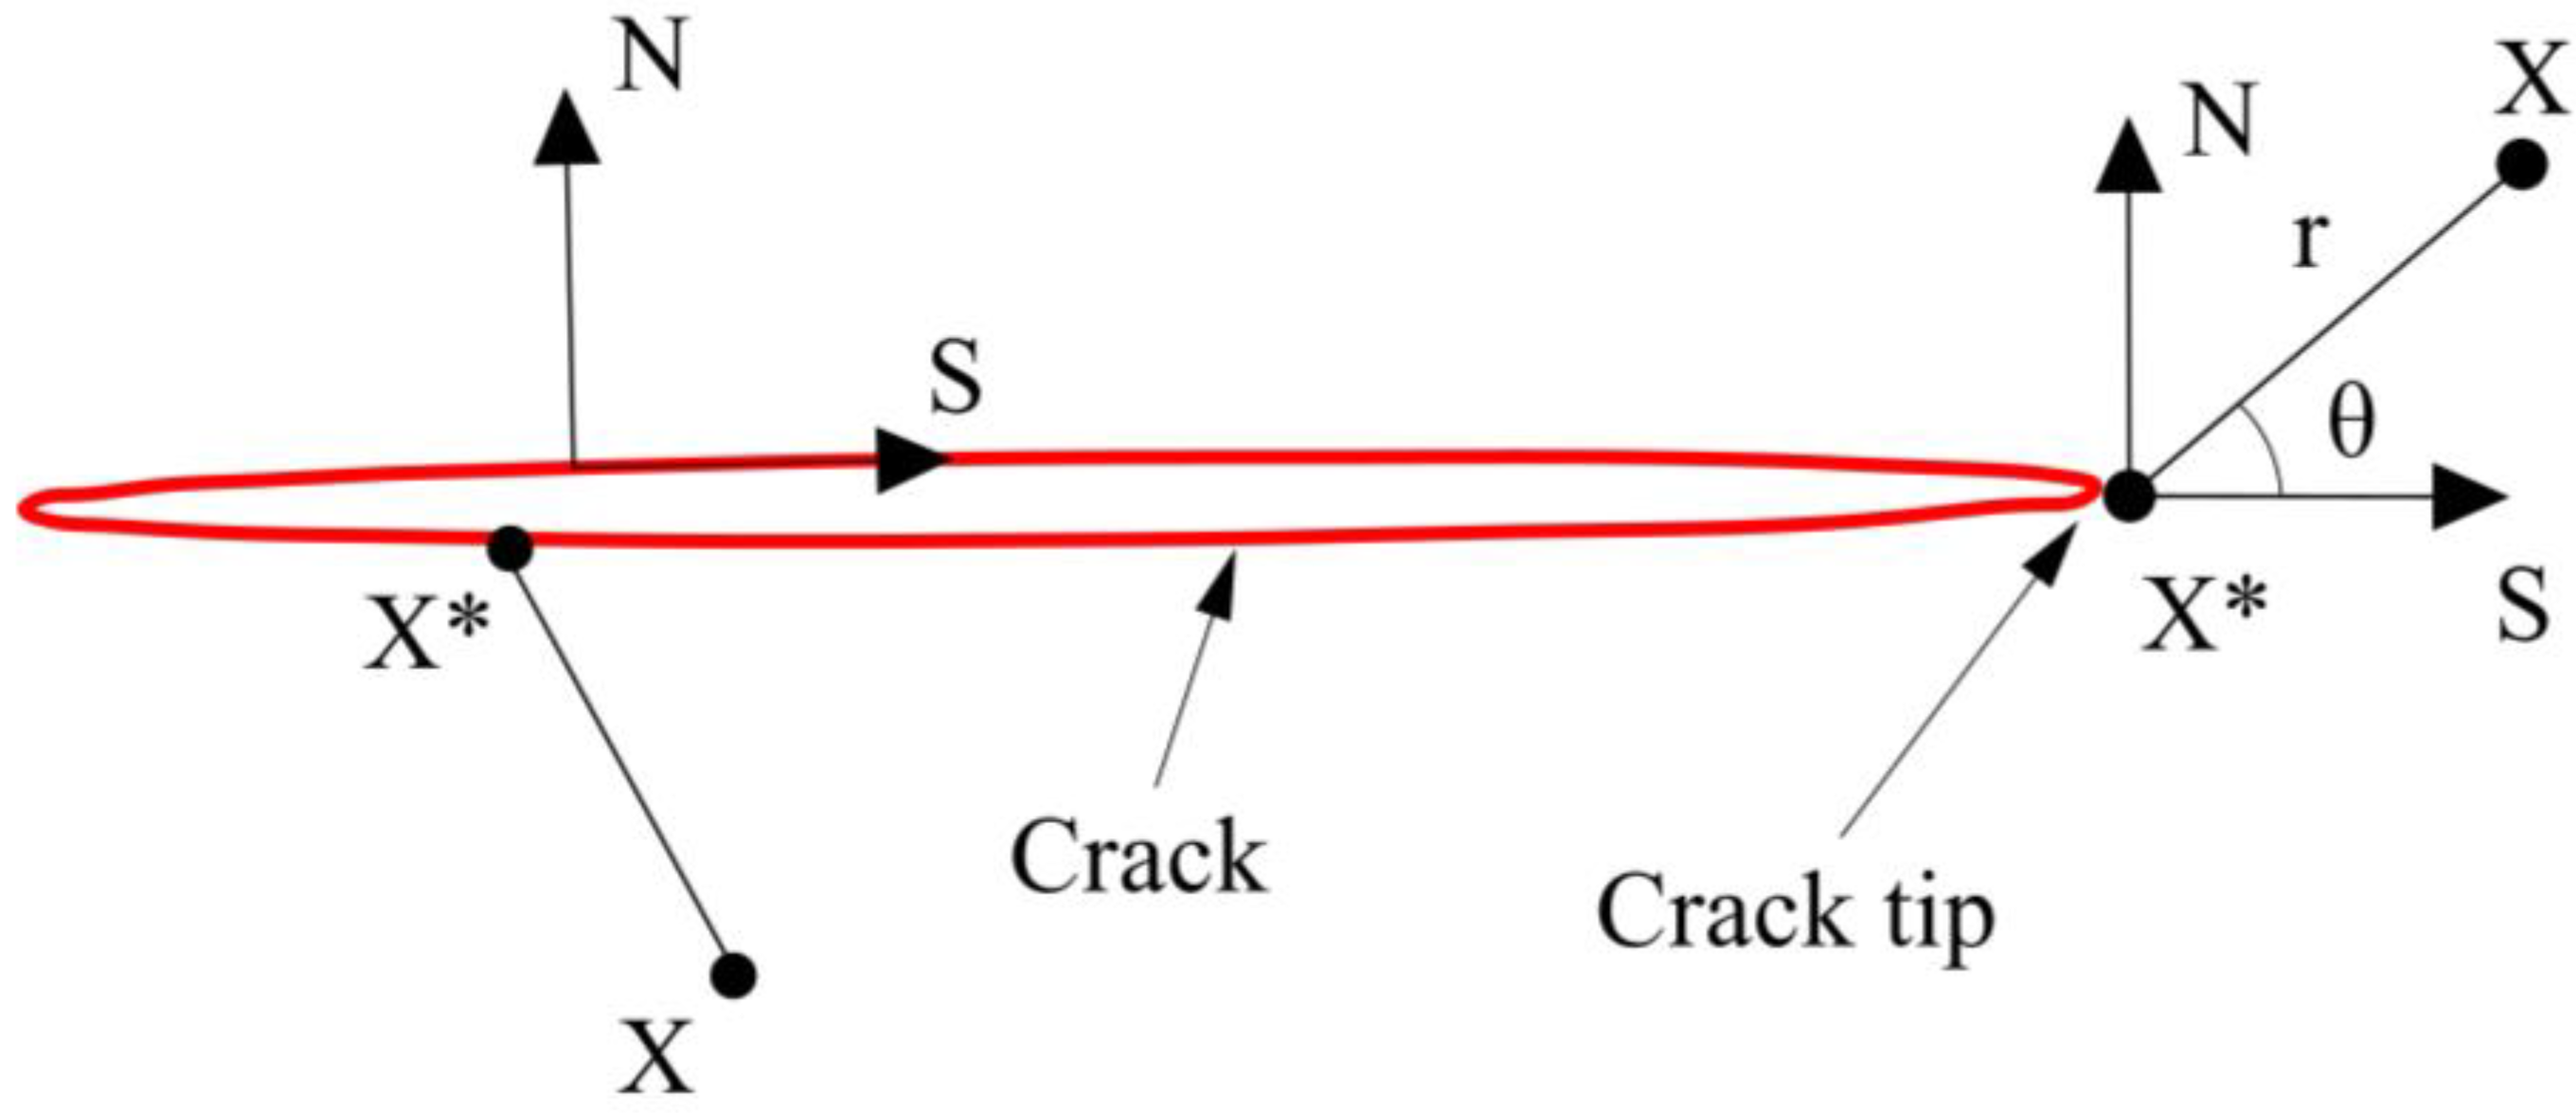
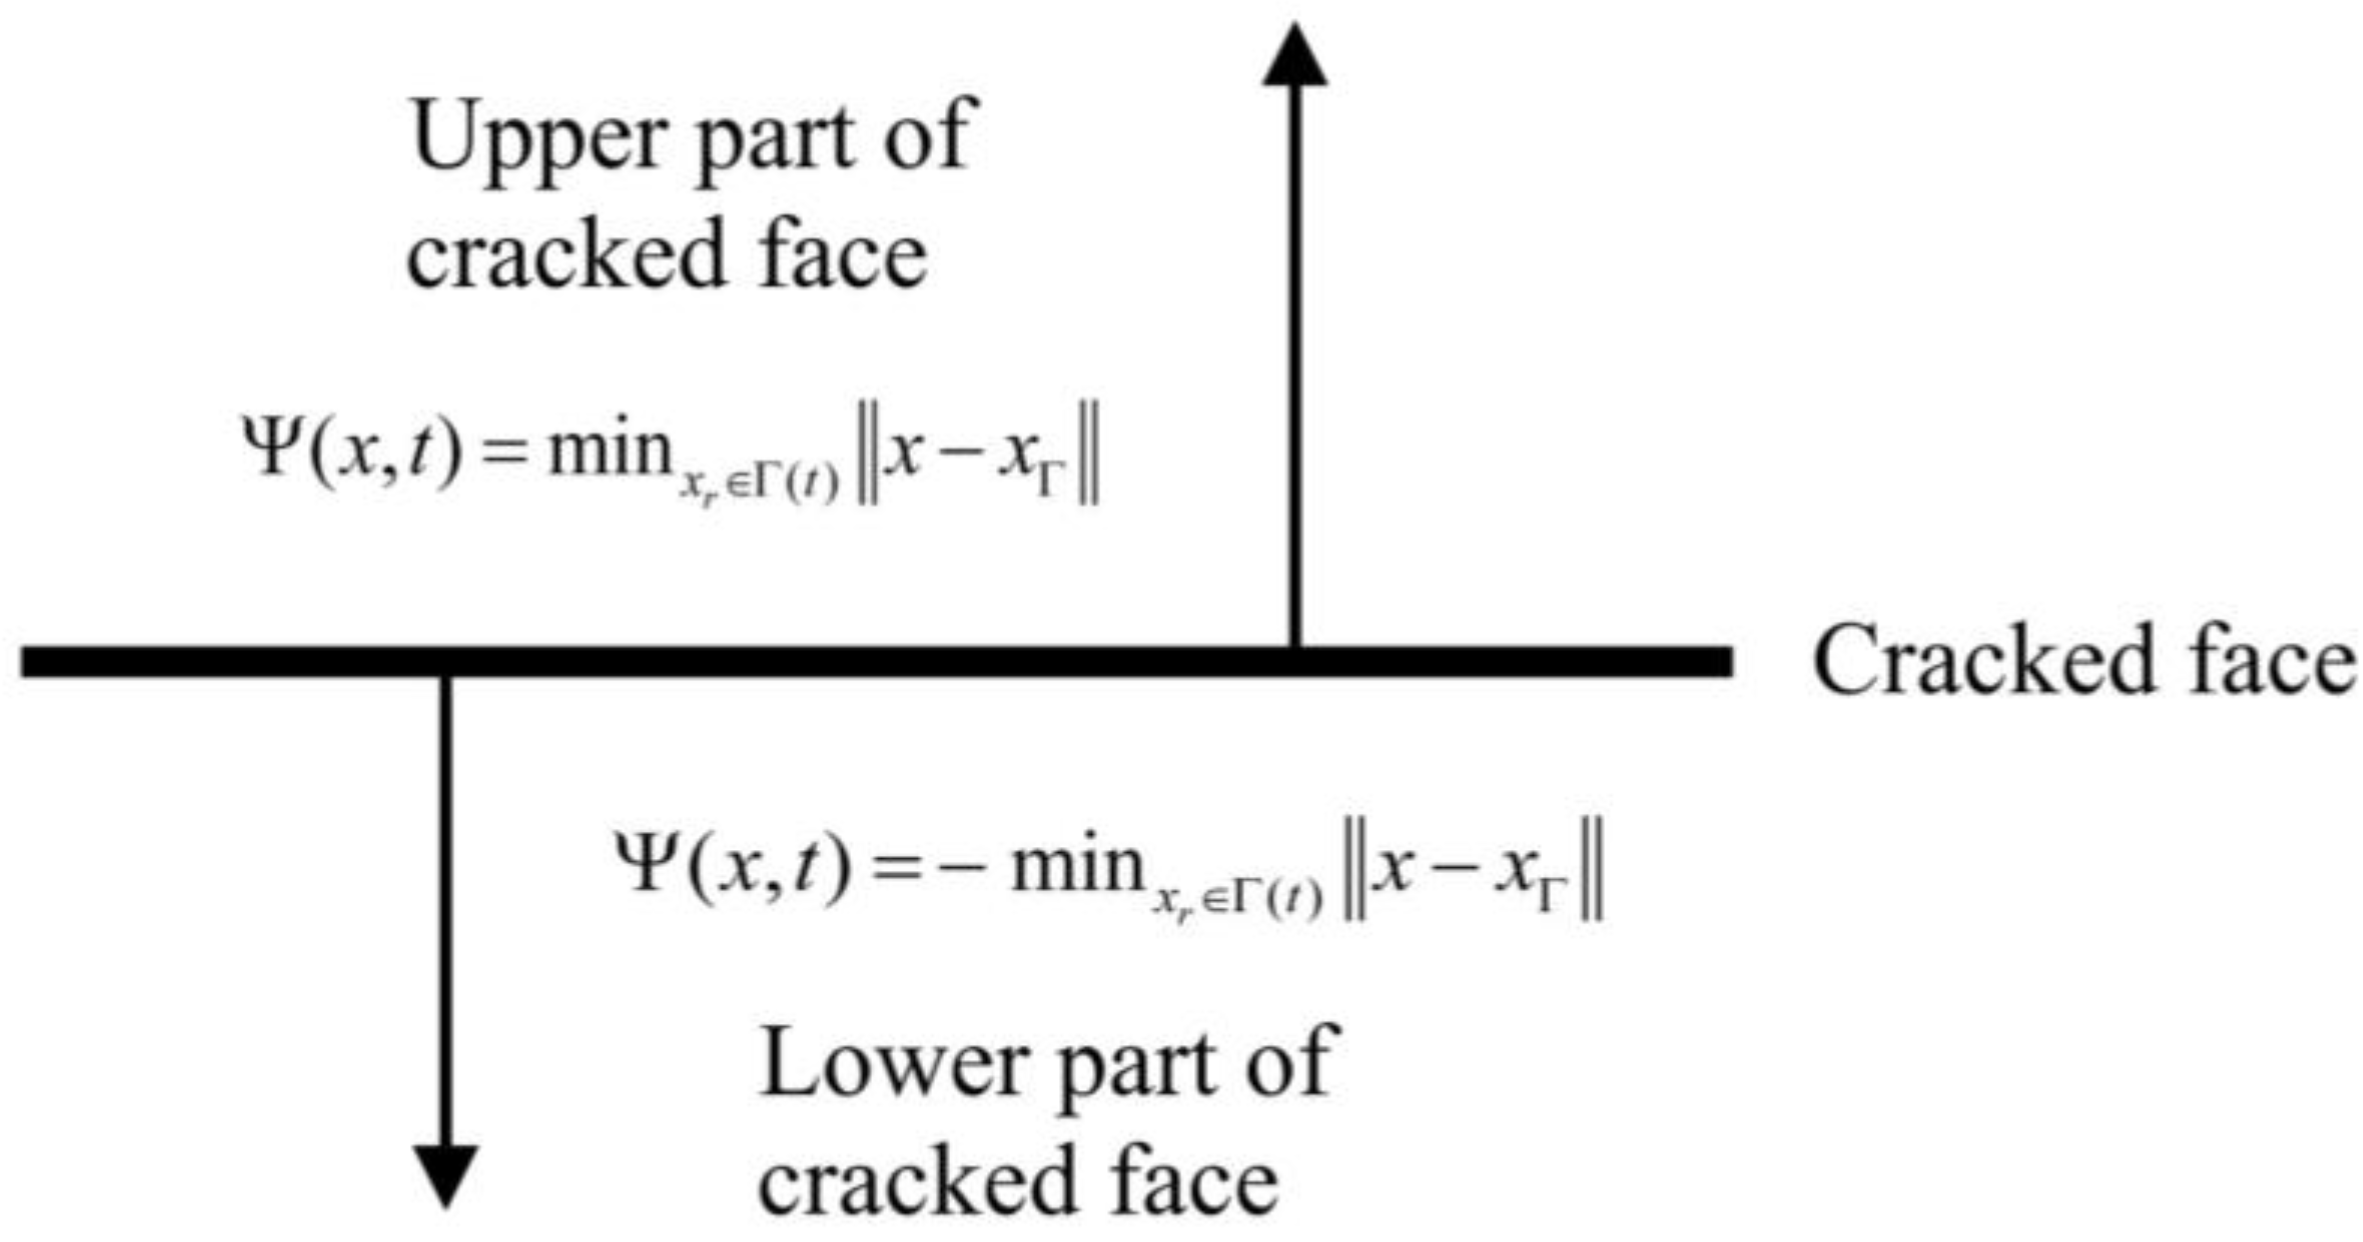
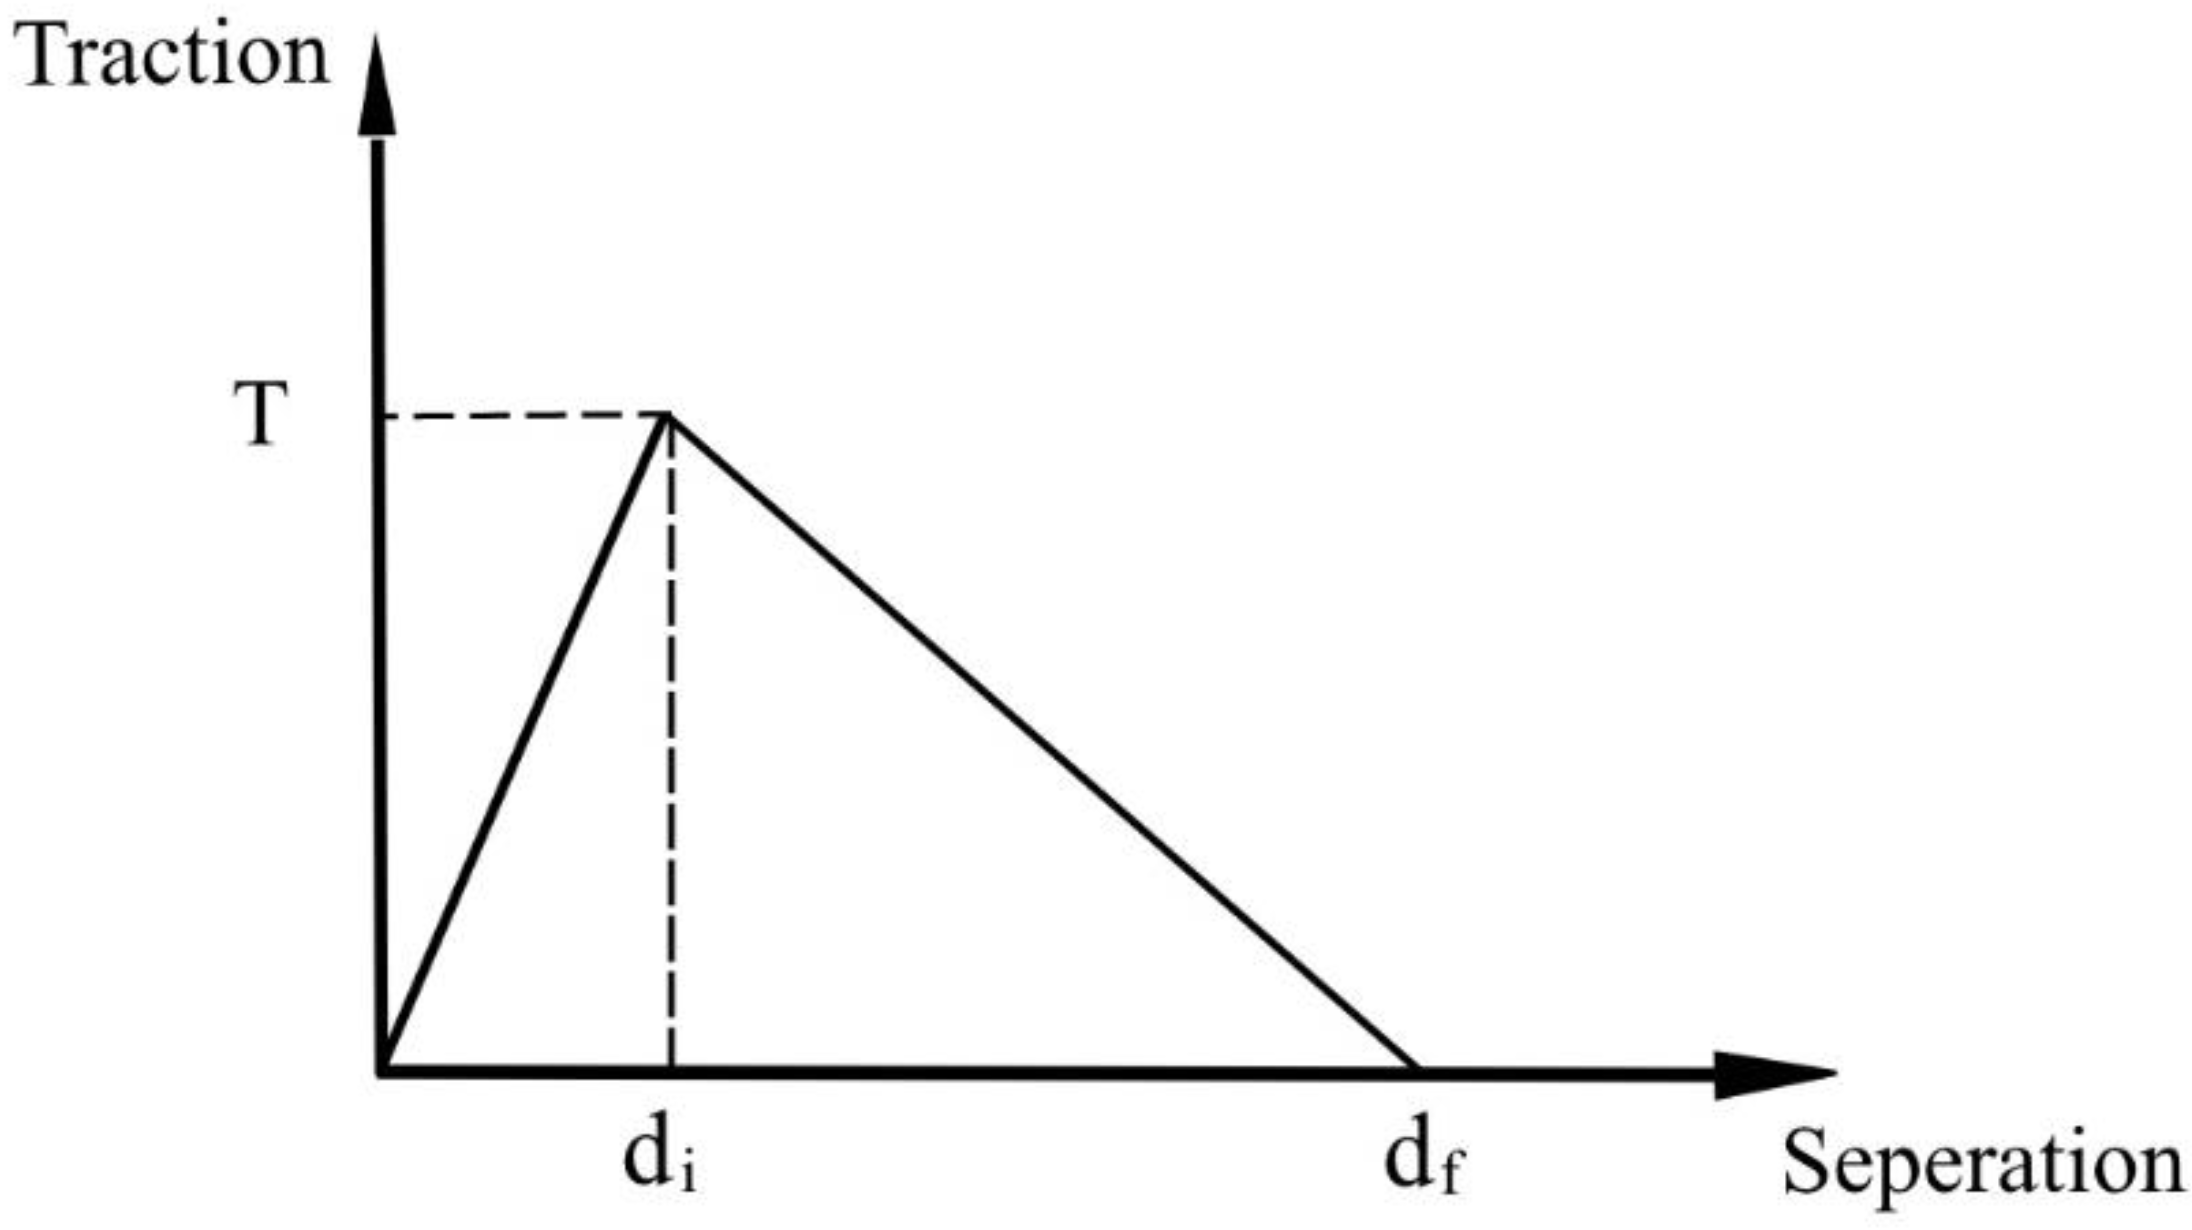
- (b) XFEM
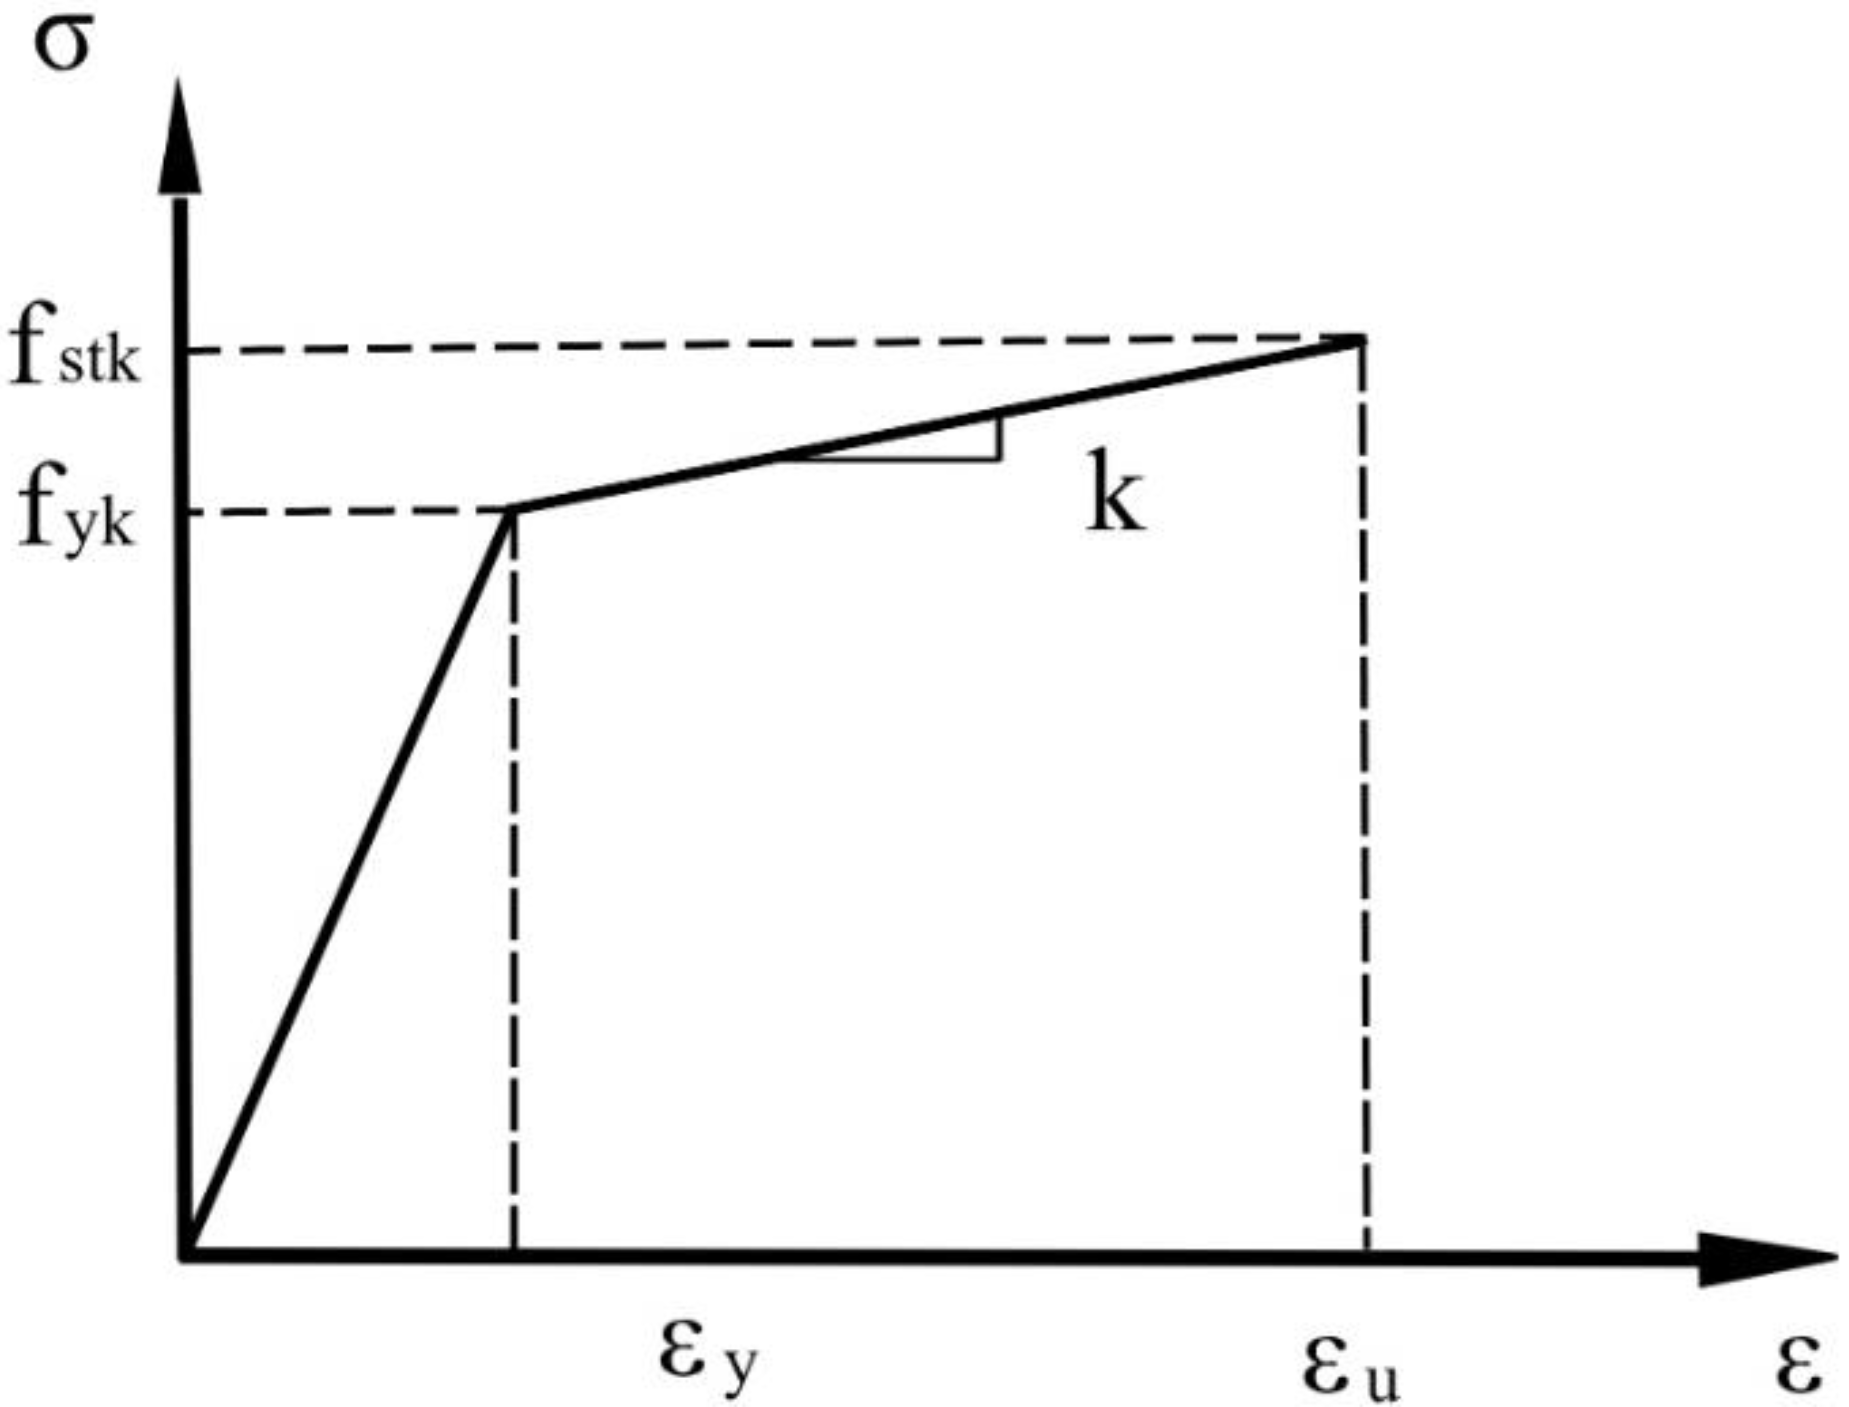
3.1.2. Constitutive Relation of Steel
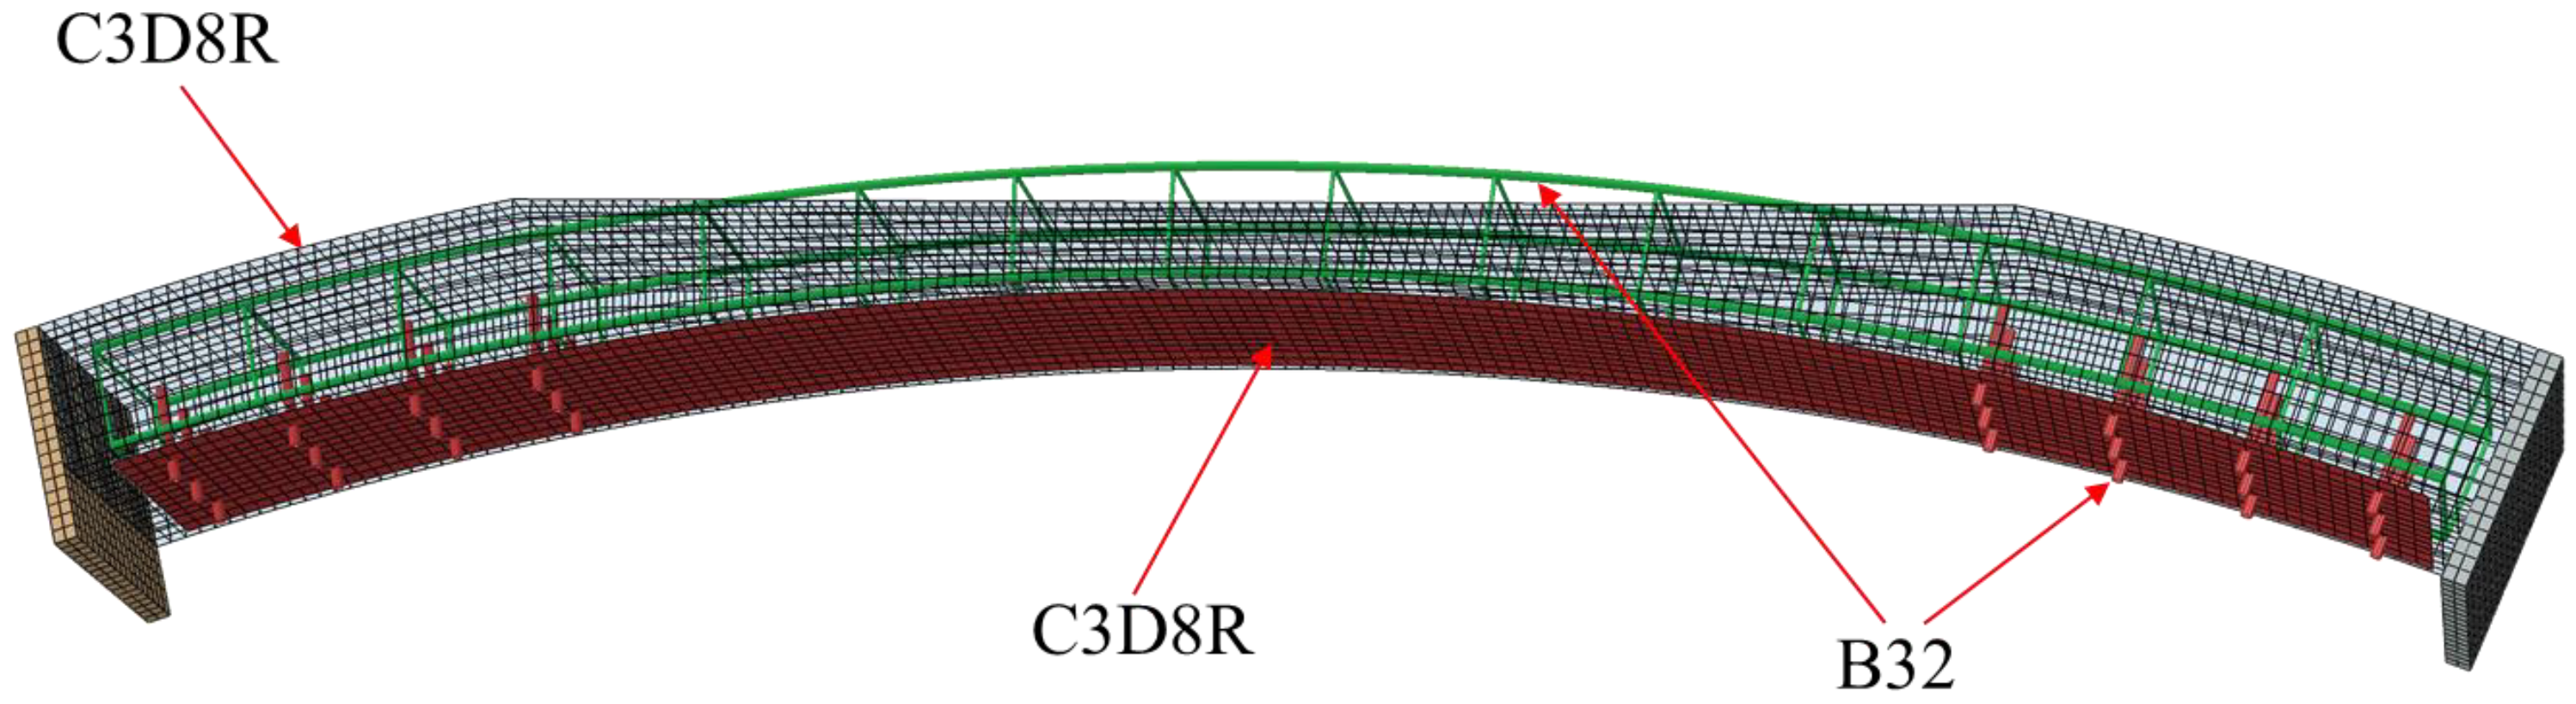
3.2. Element Types and Mesh Sizes
3.3. Contact Models and Boundary Conditions
4. Analysis of Simulation Results
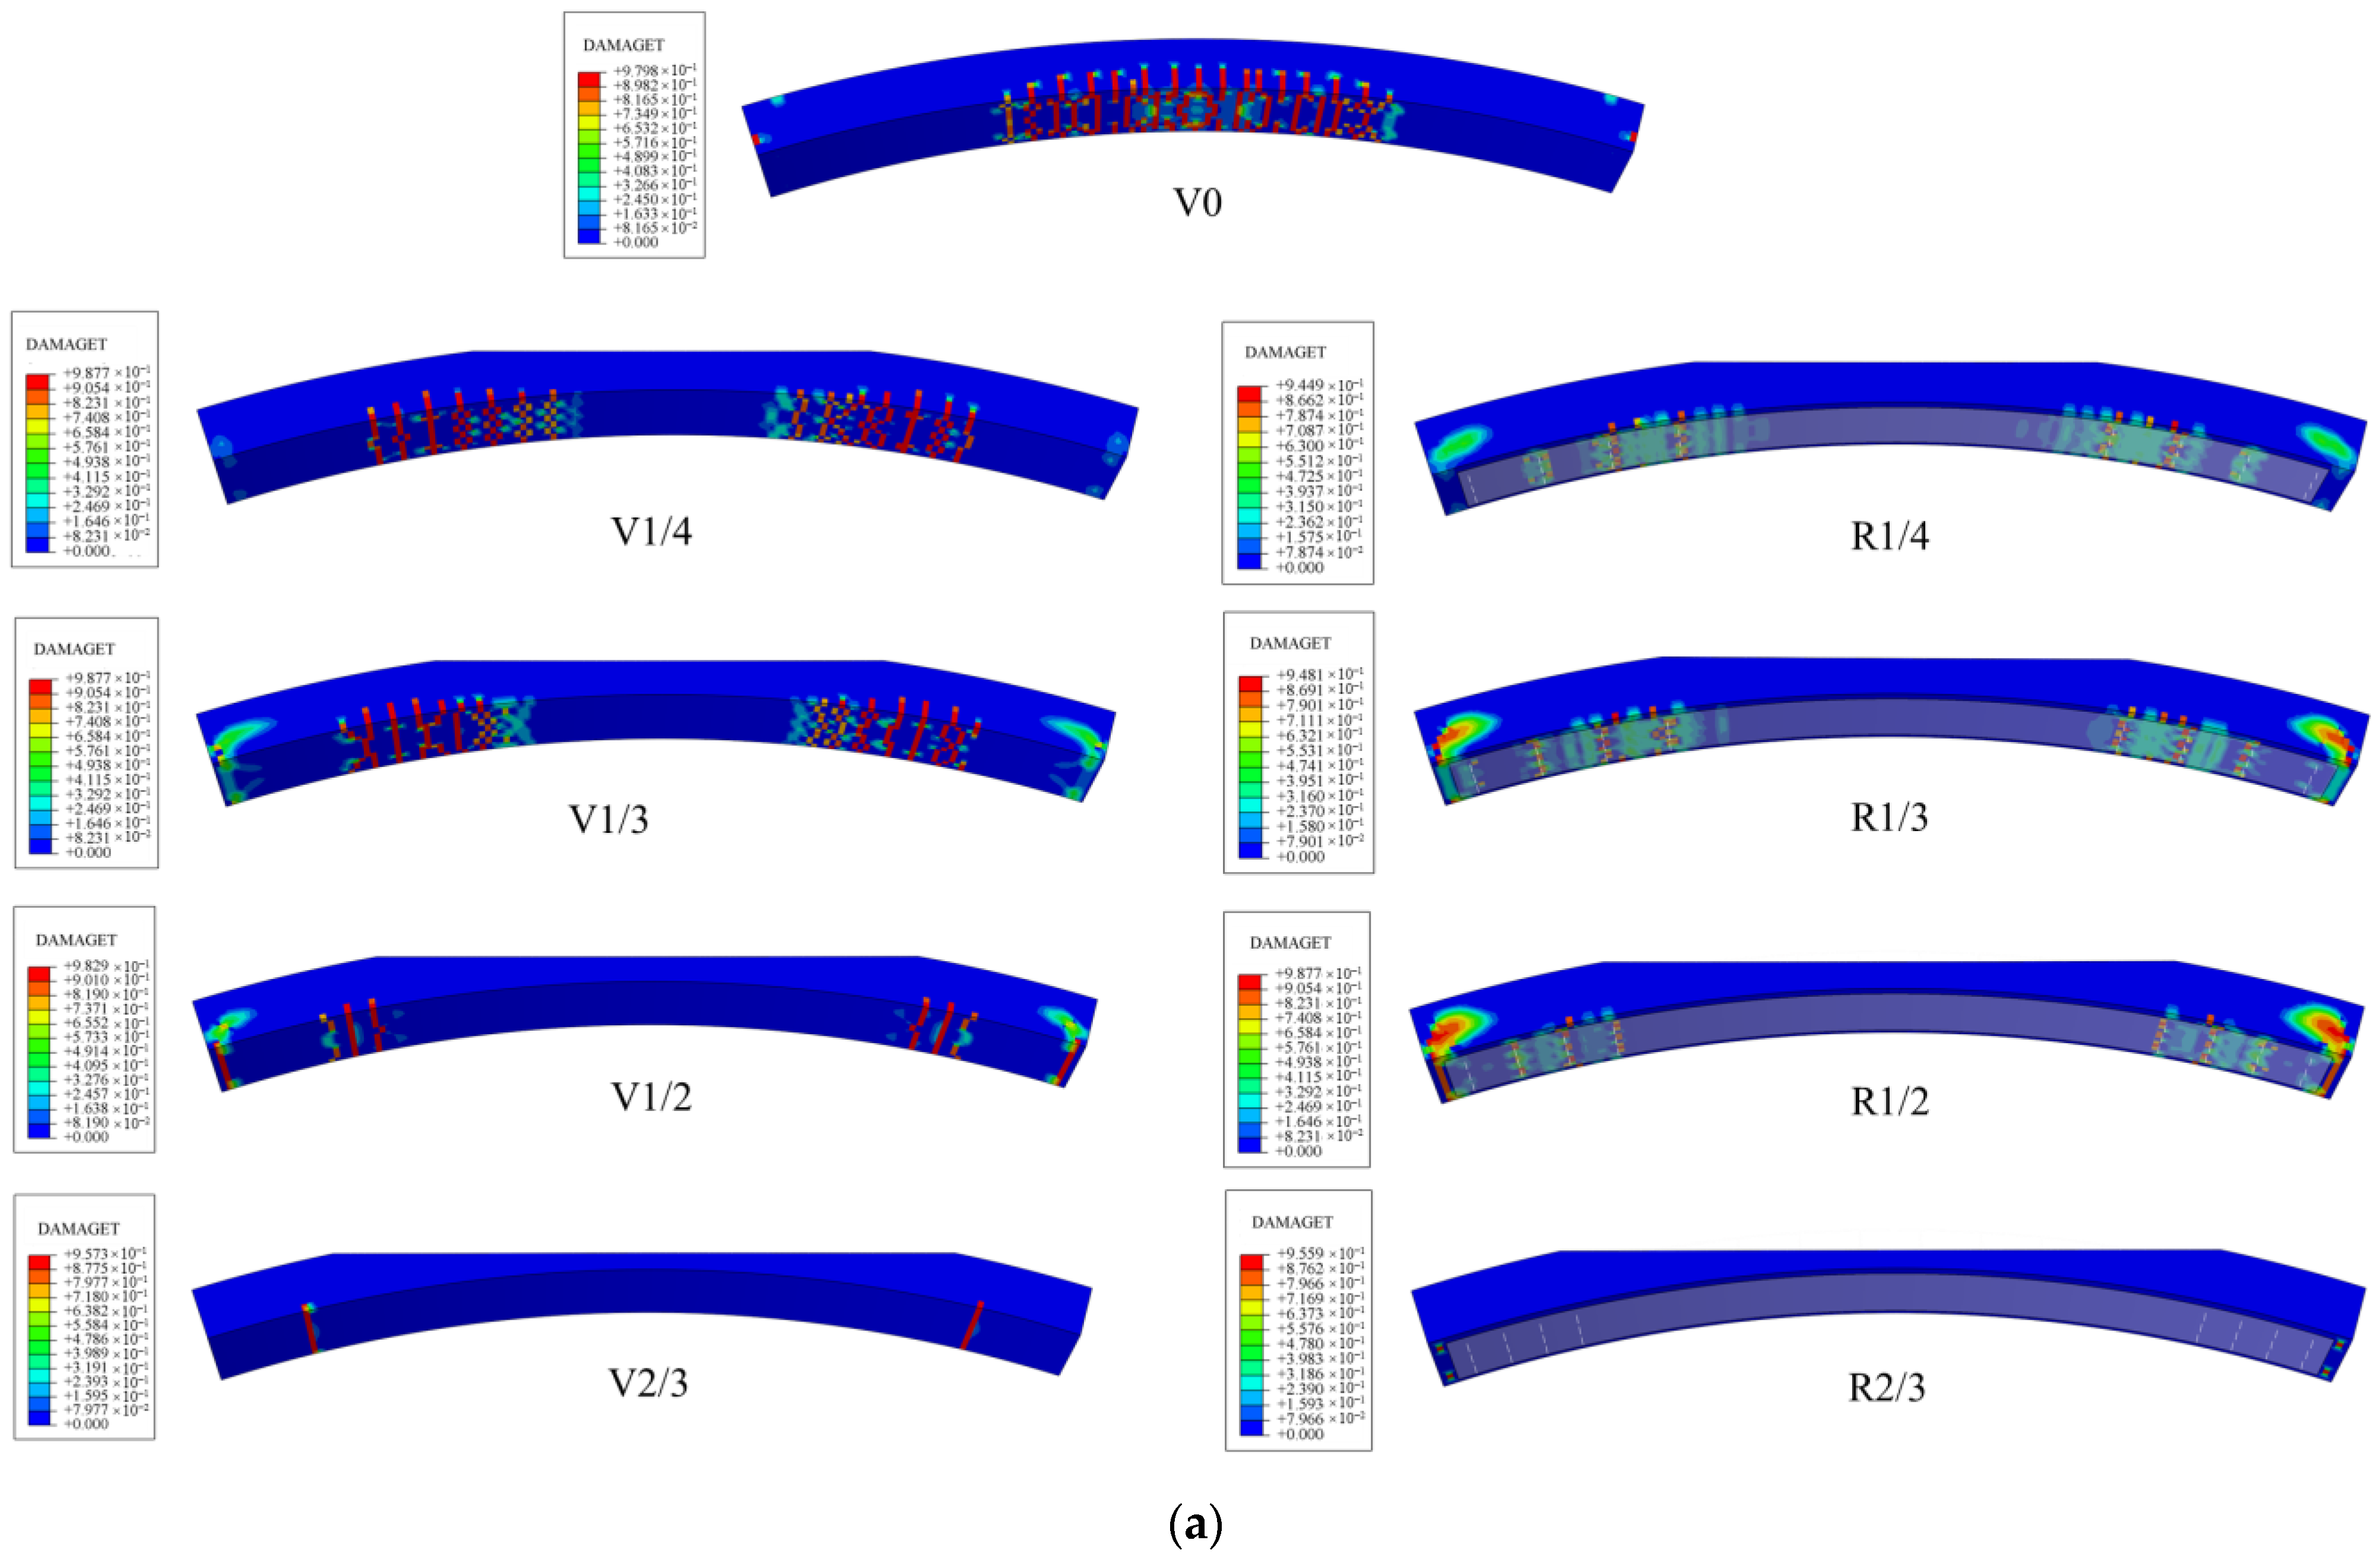
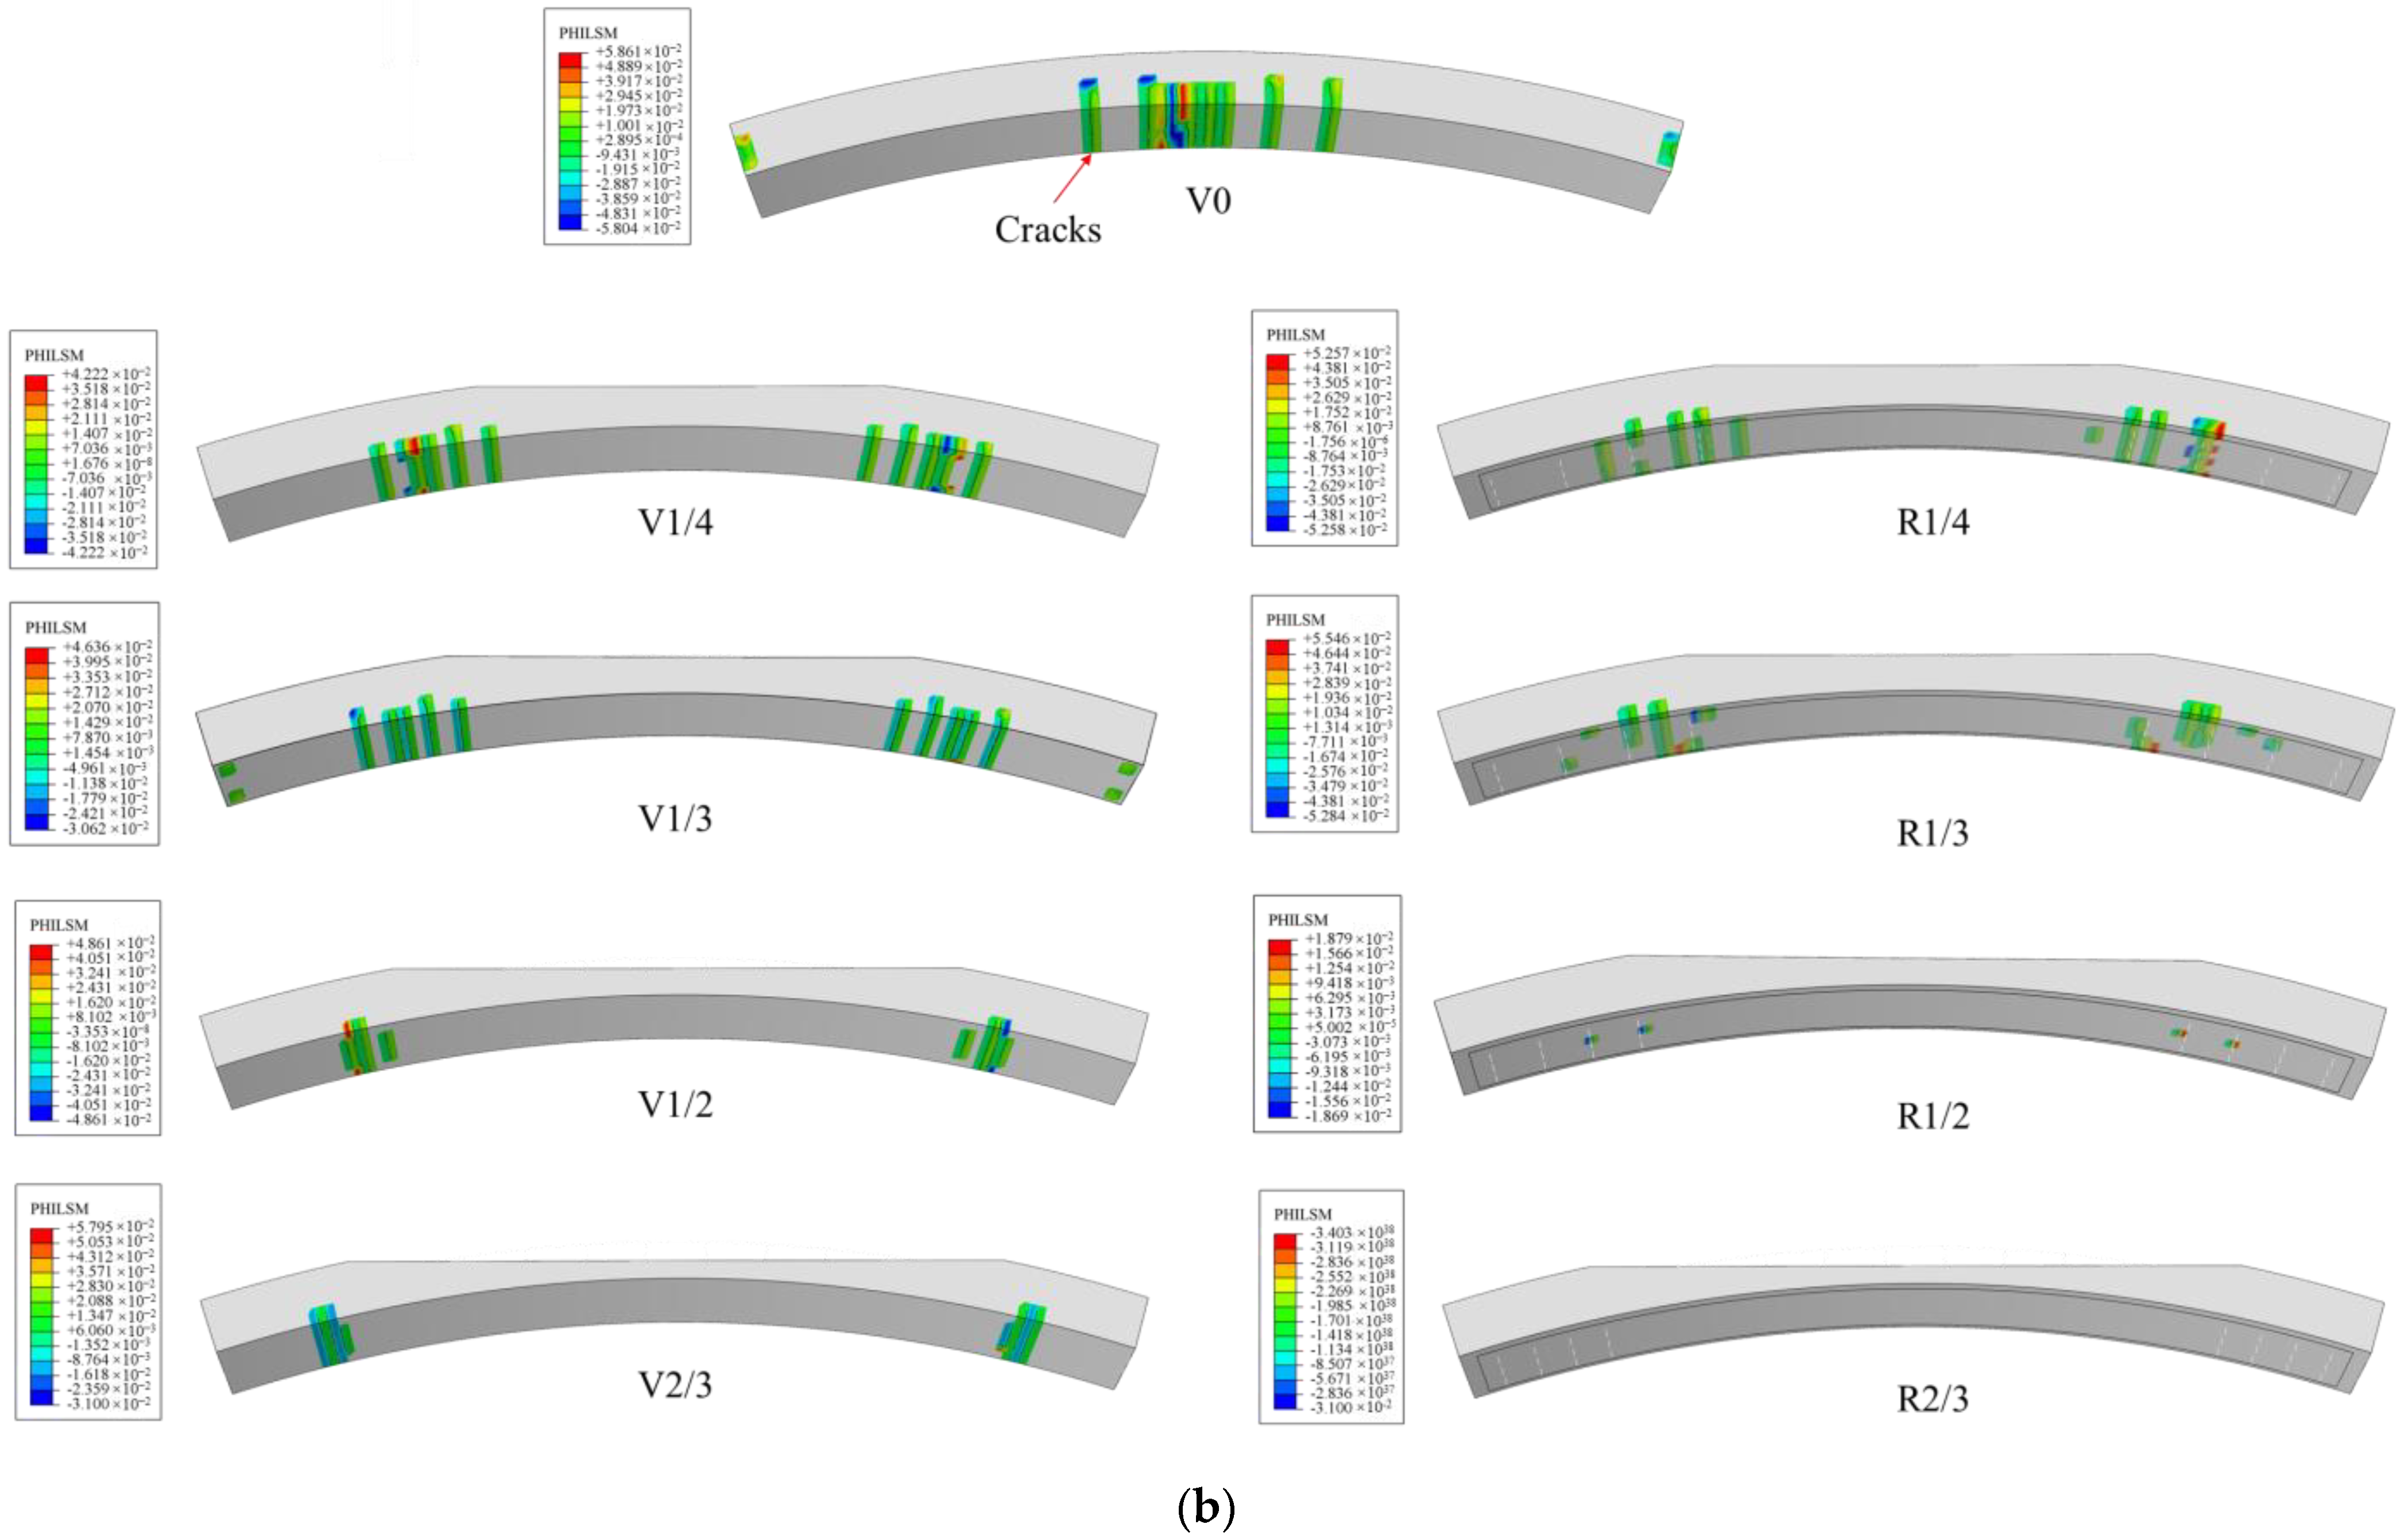
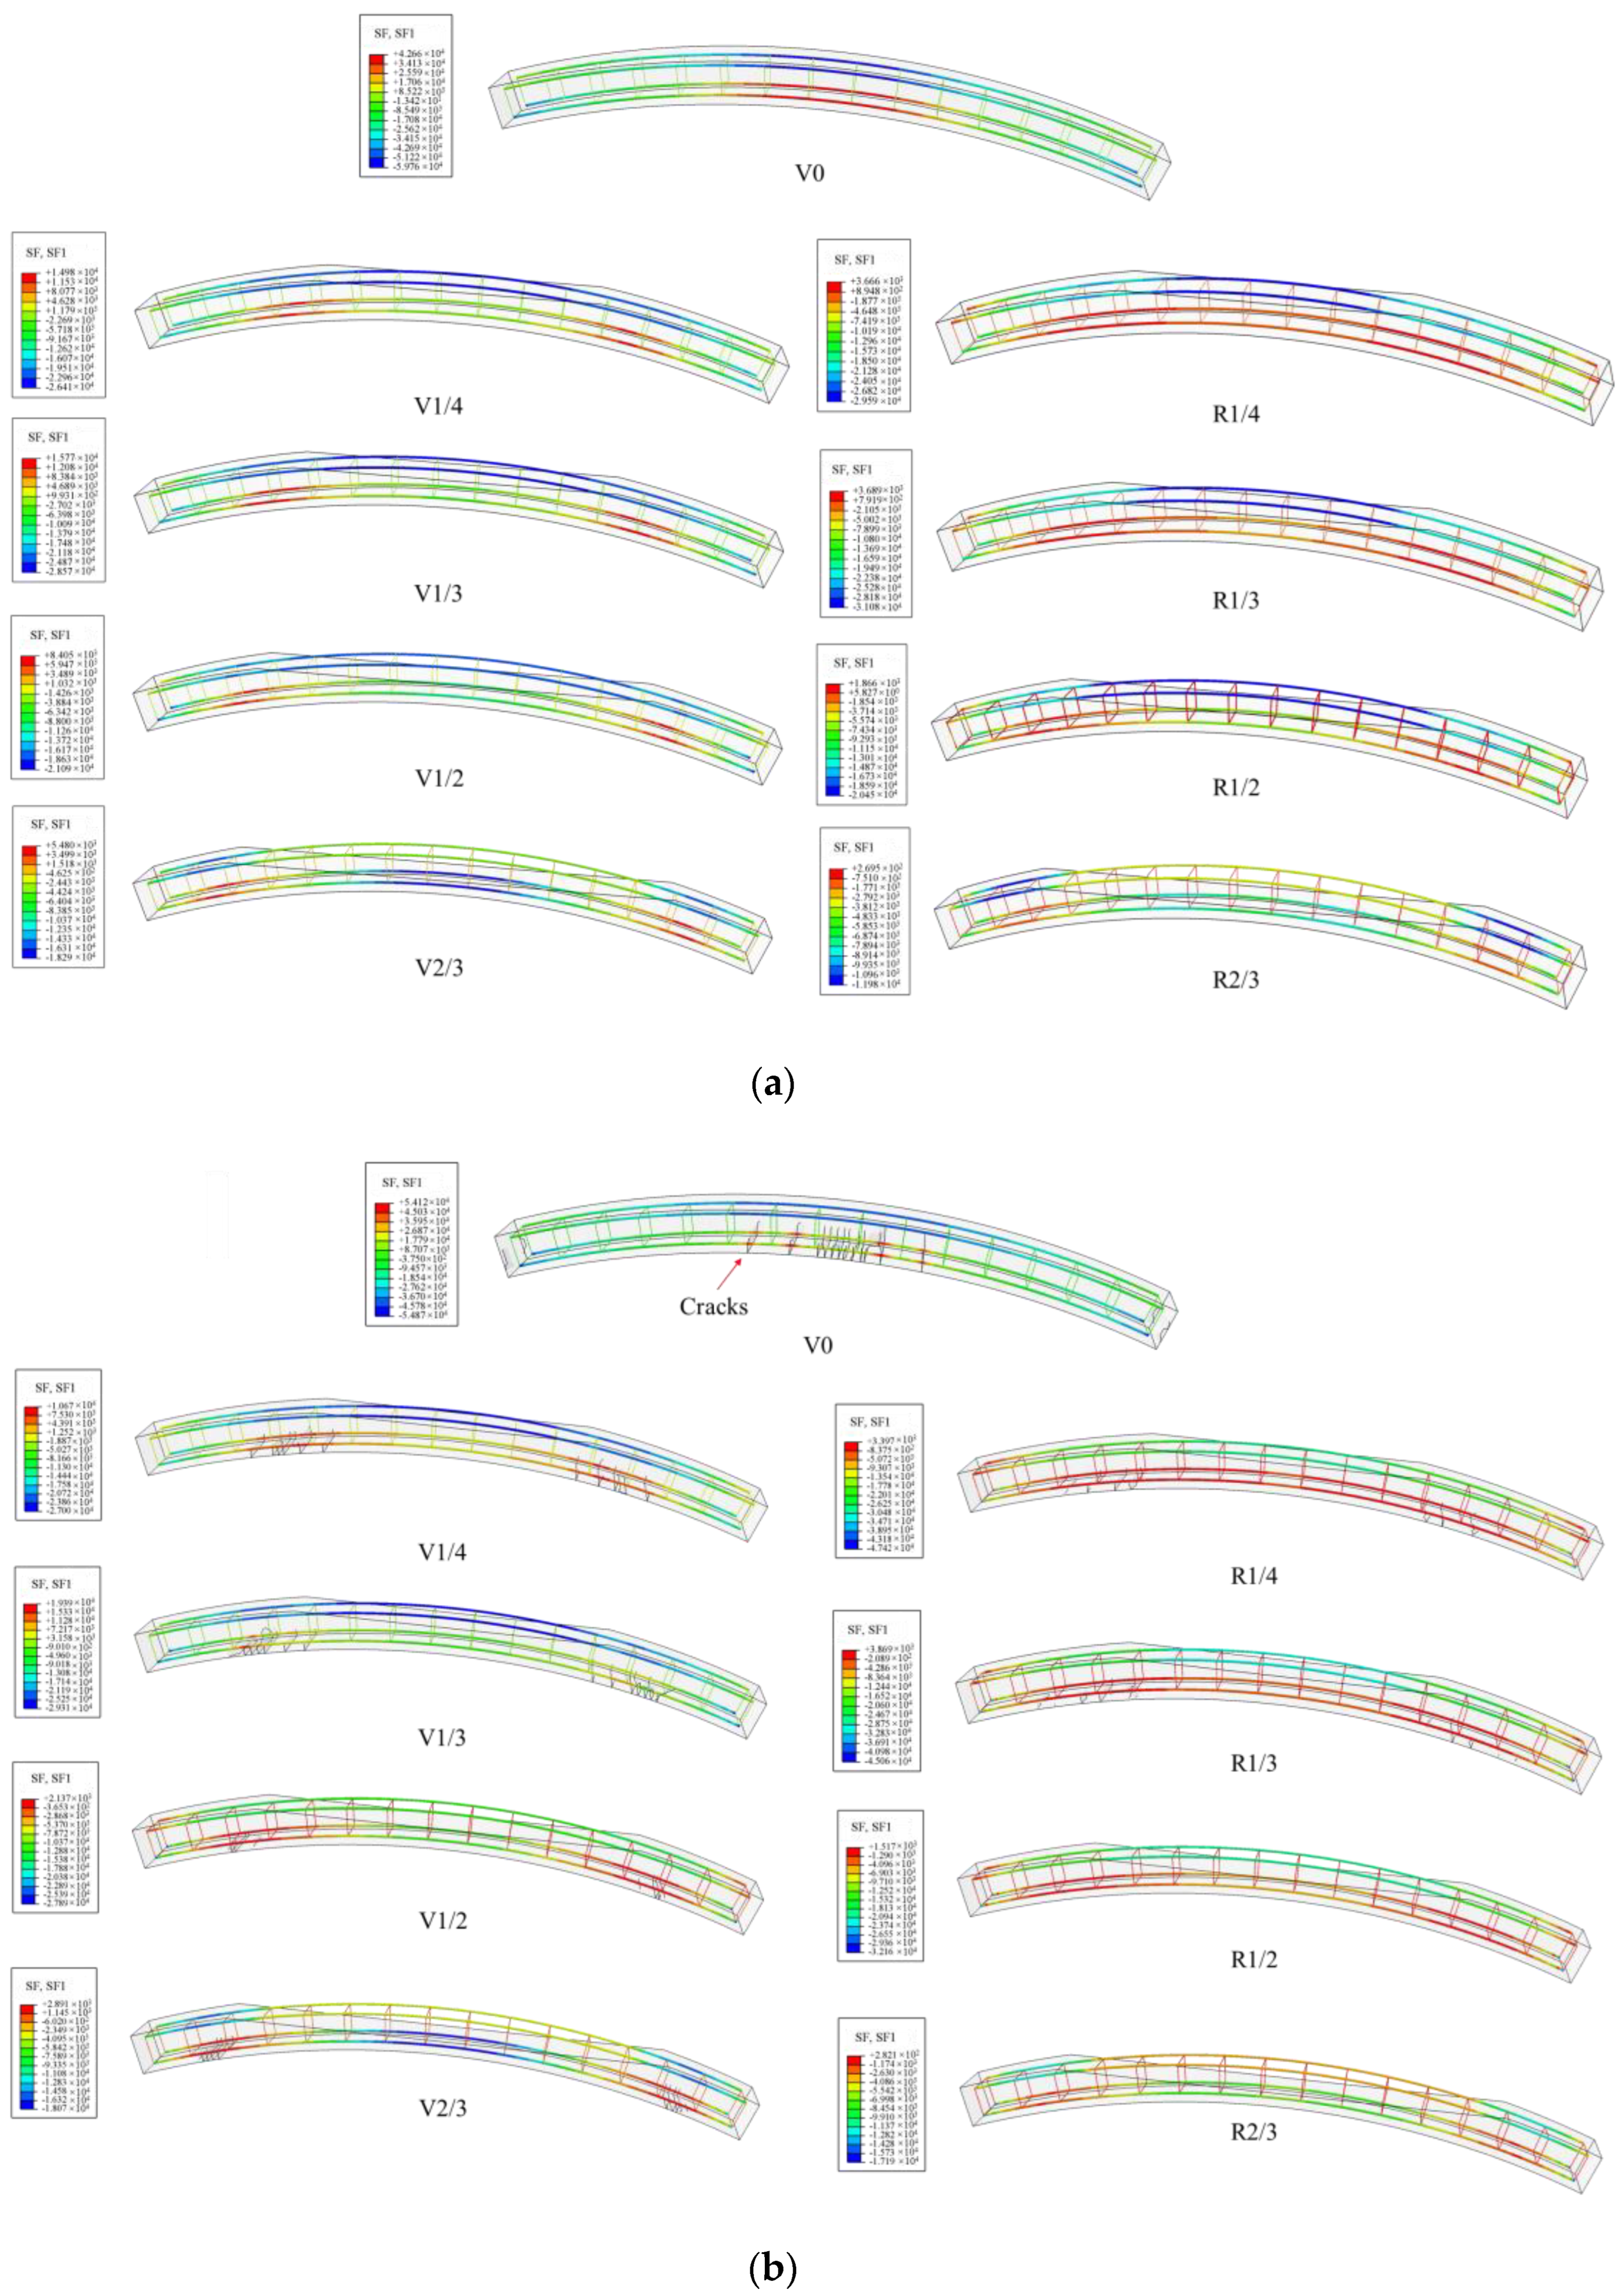
4.1. Damage
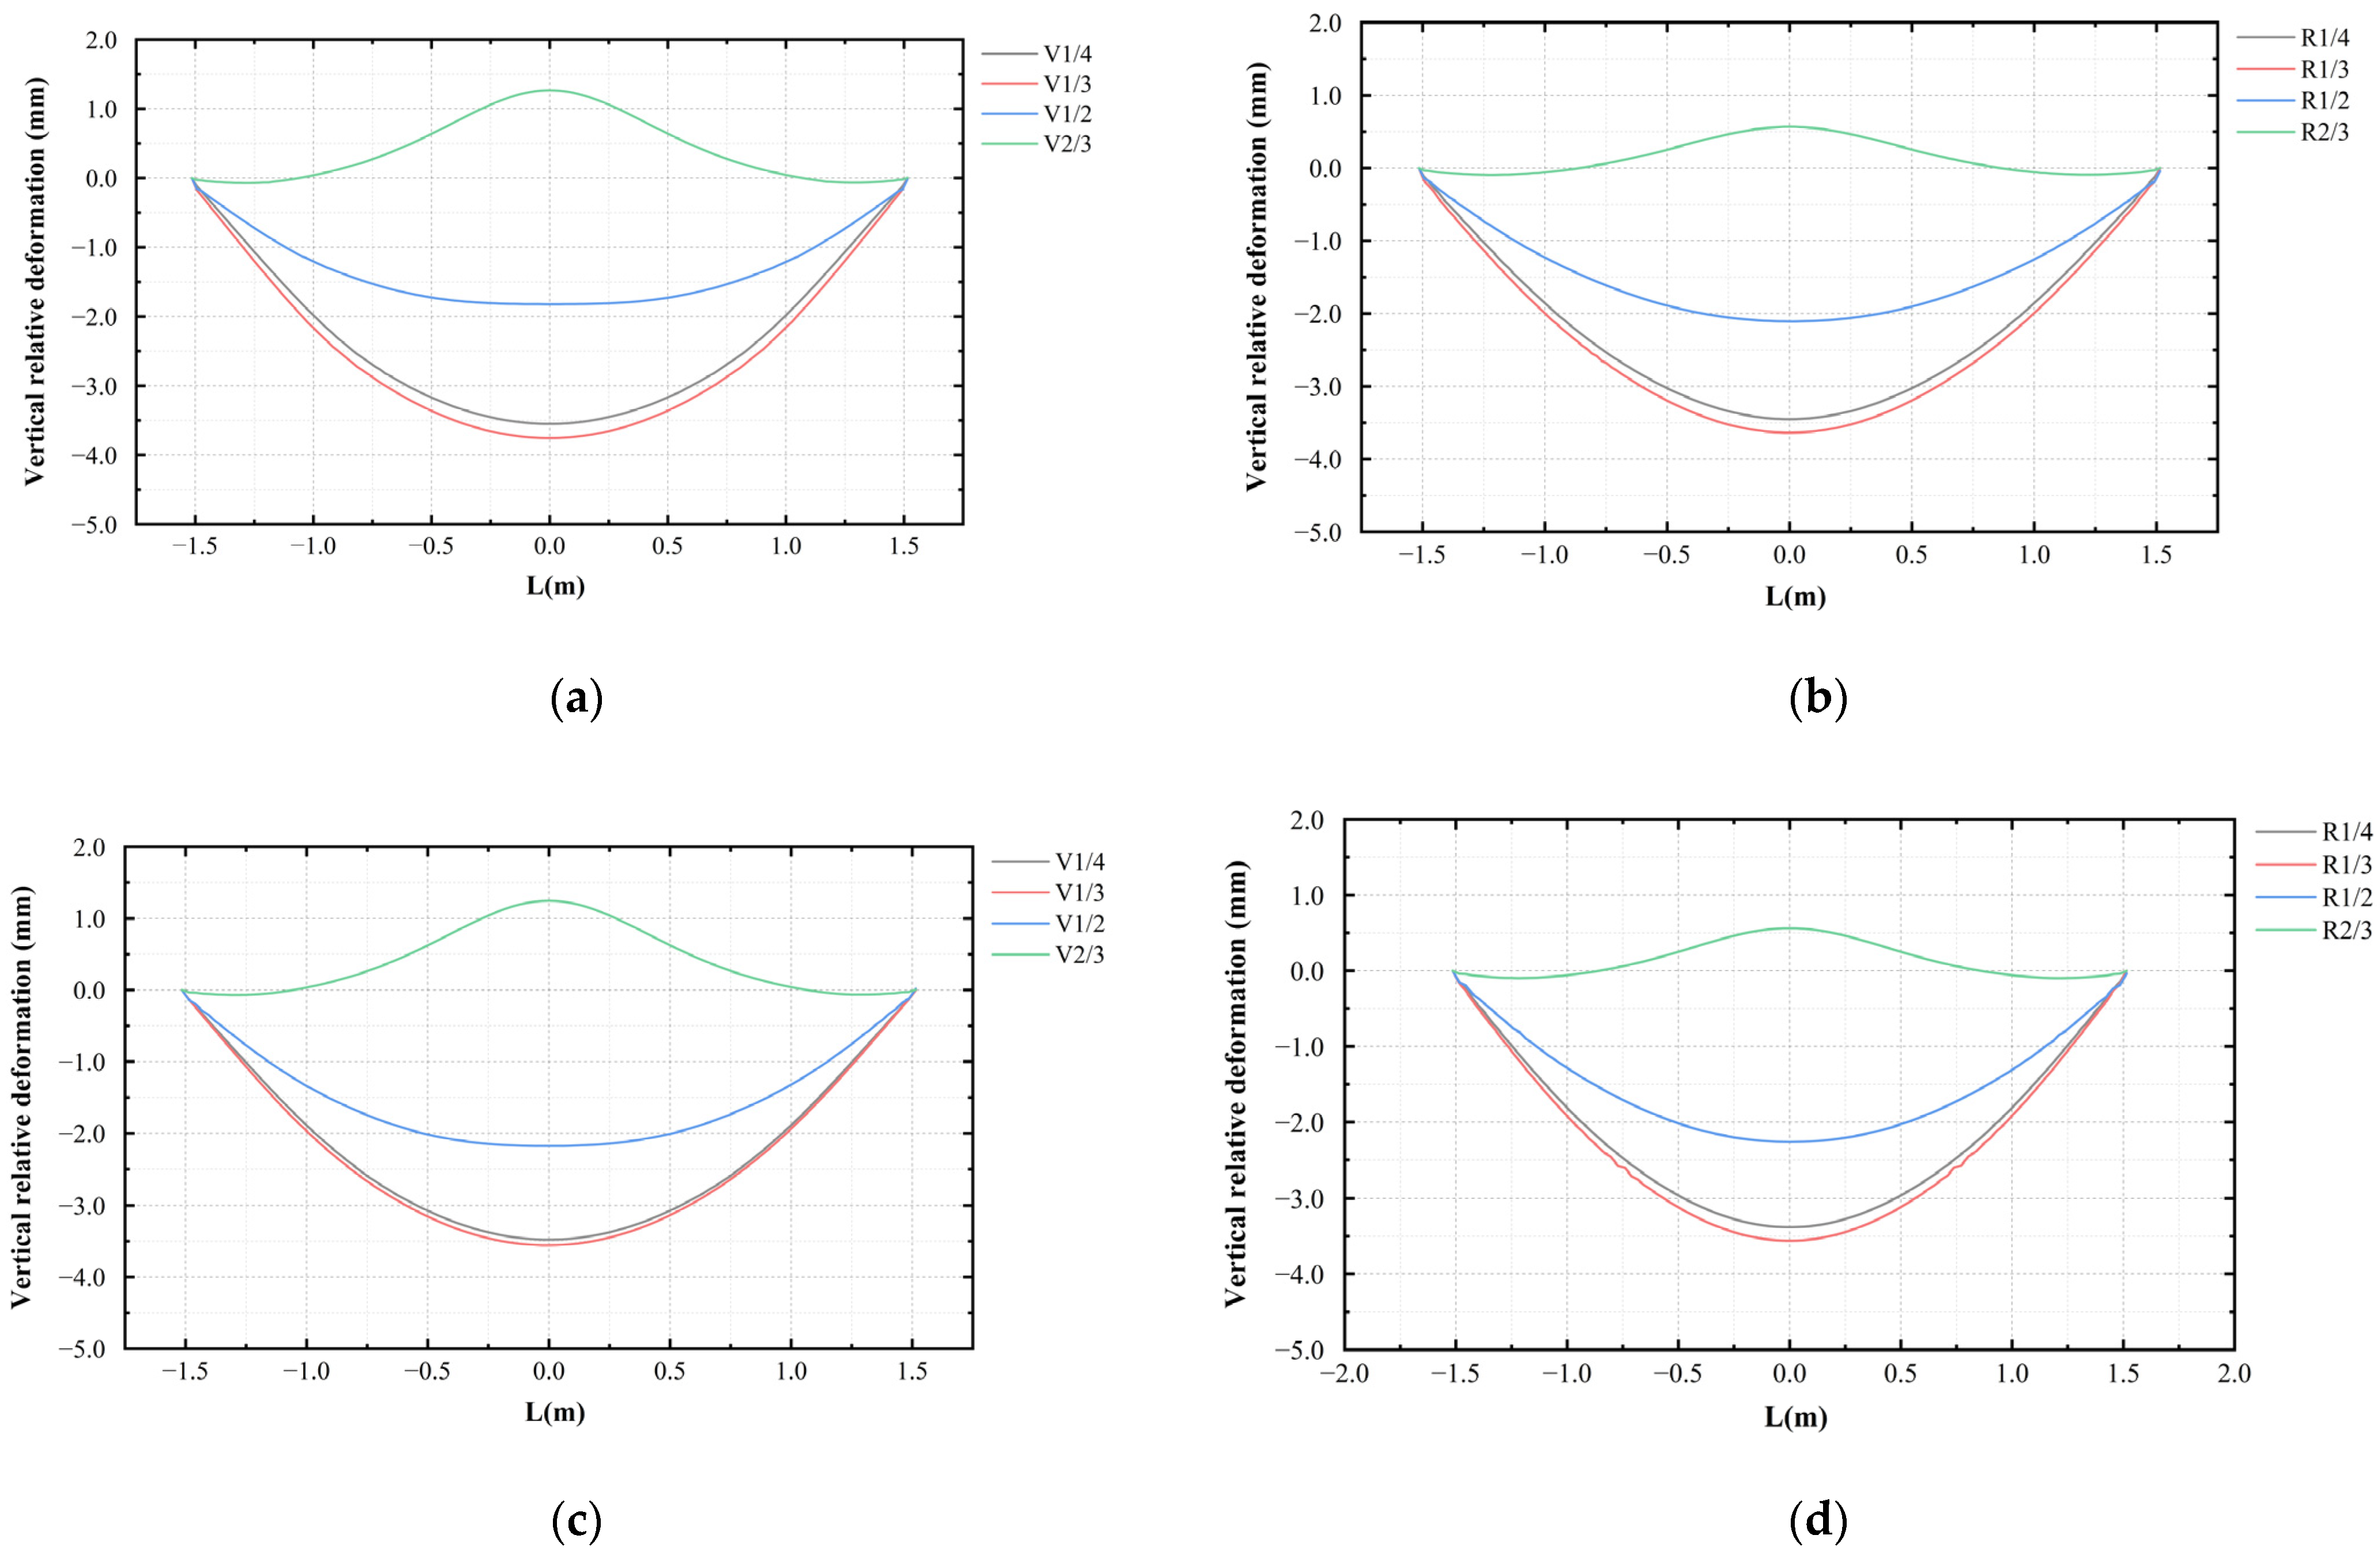
4.2. Vertical Deformation
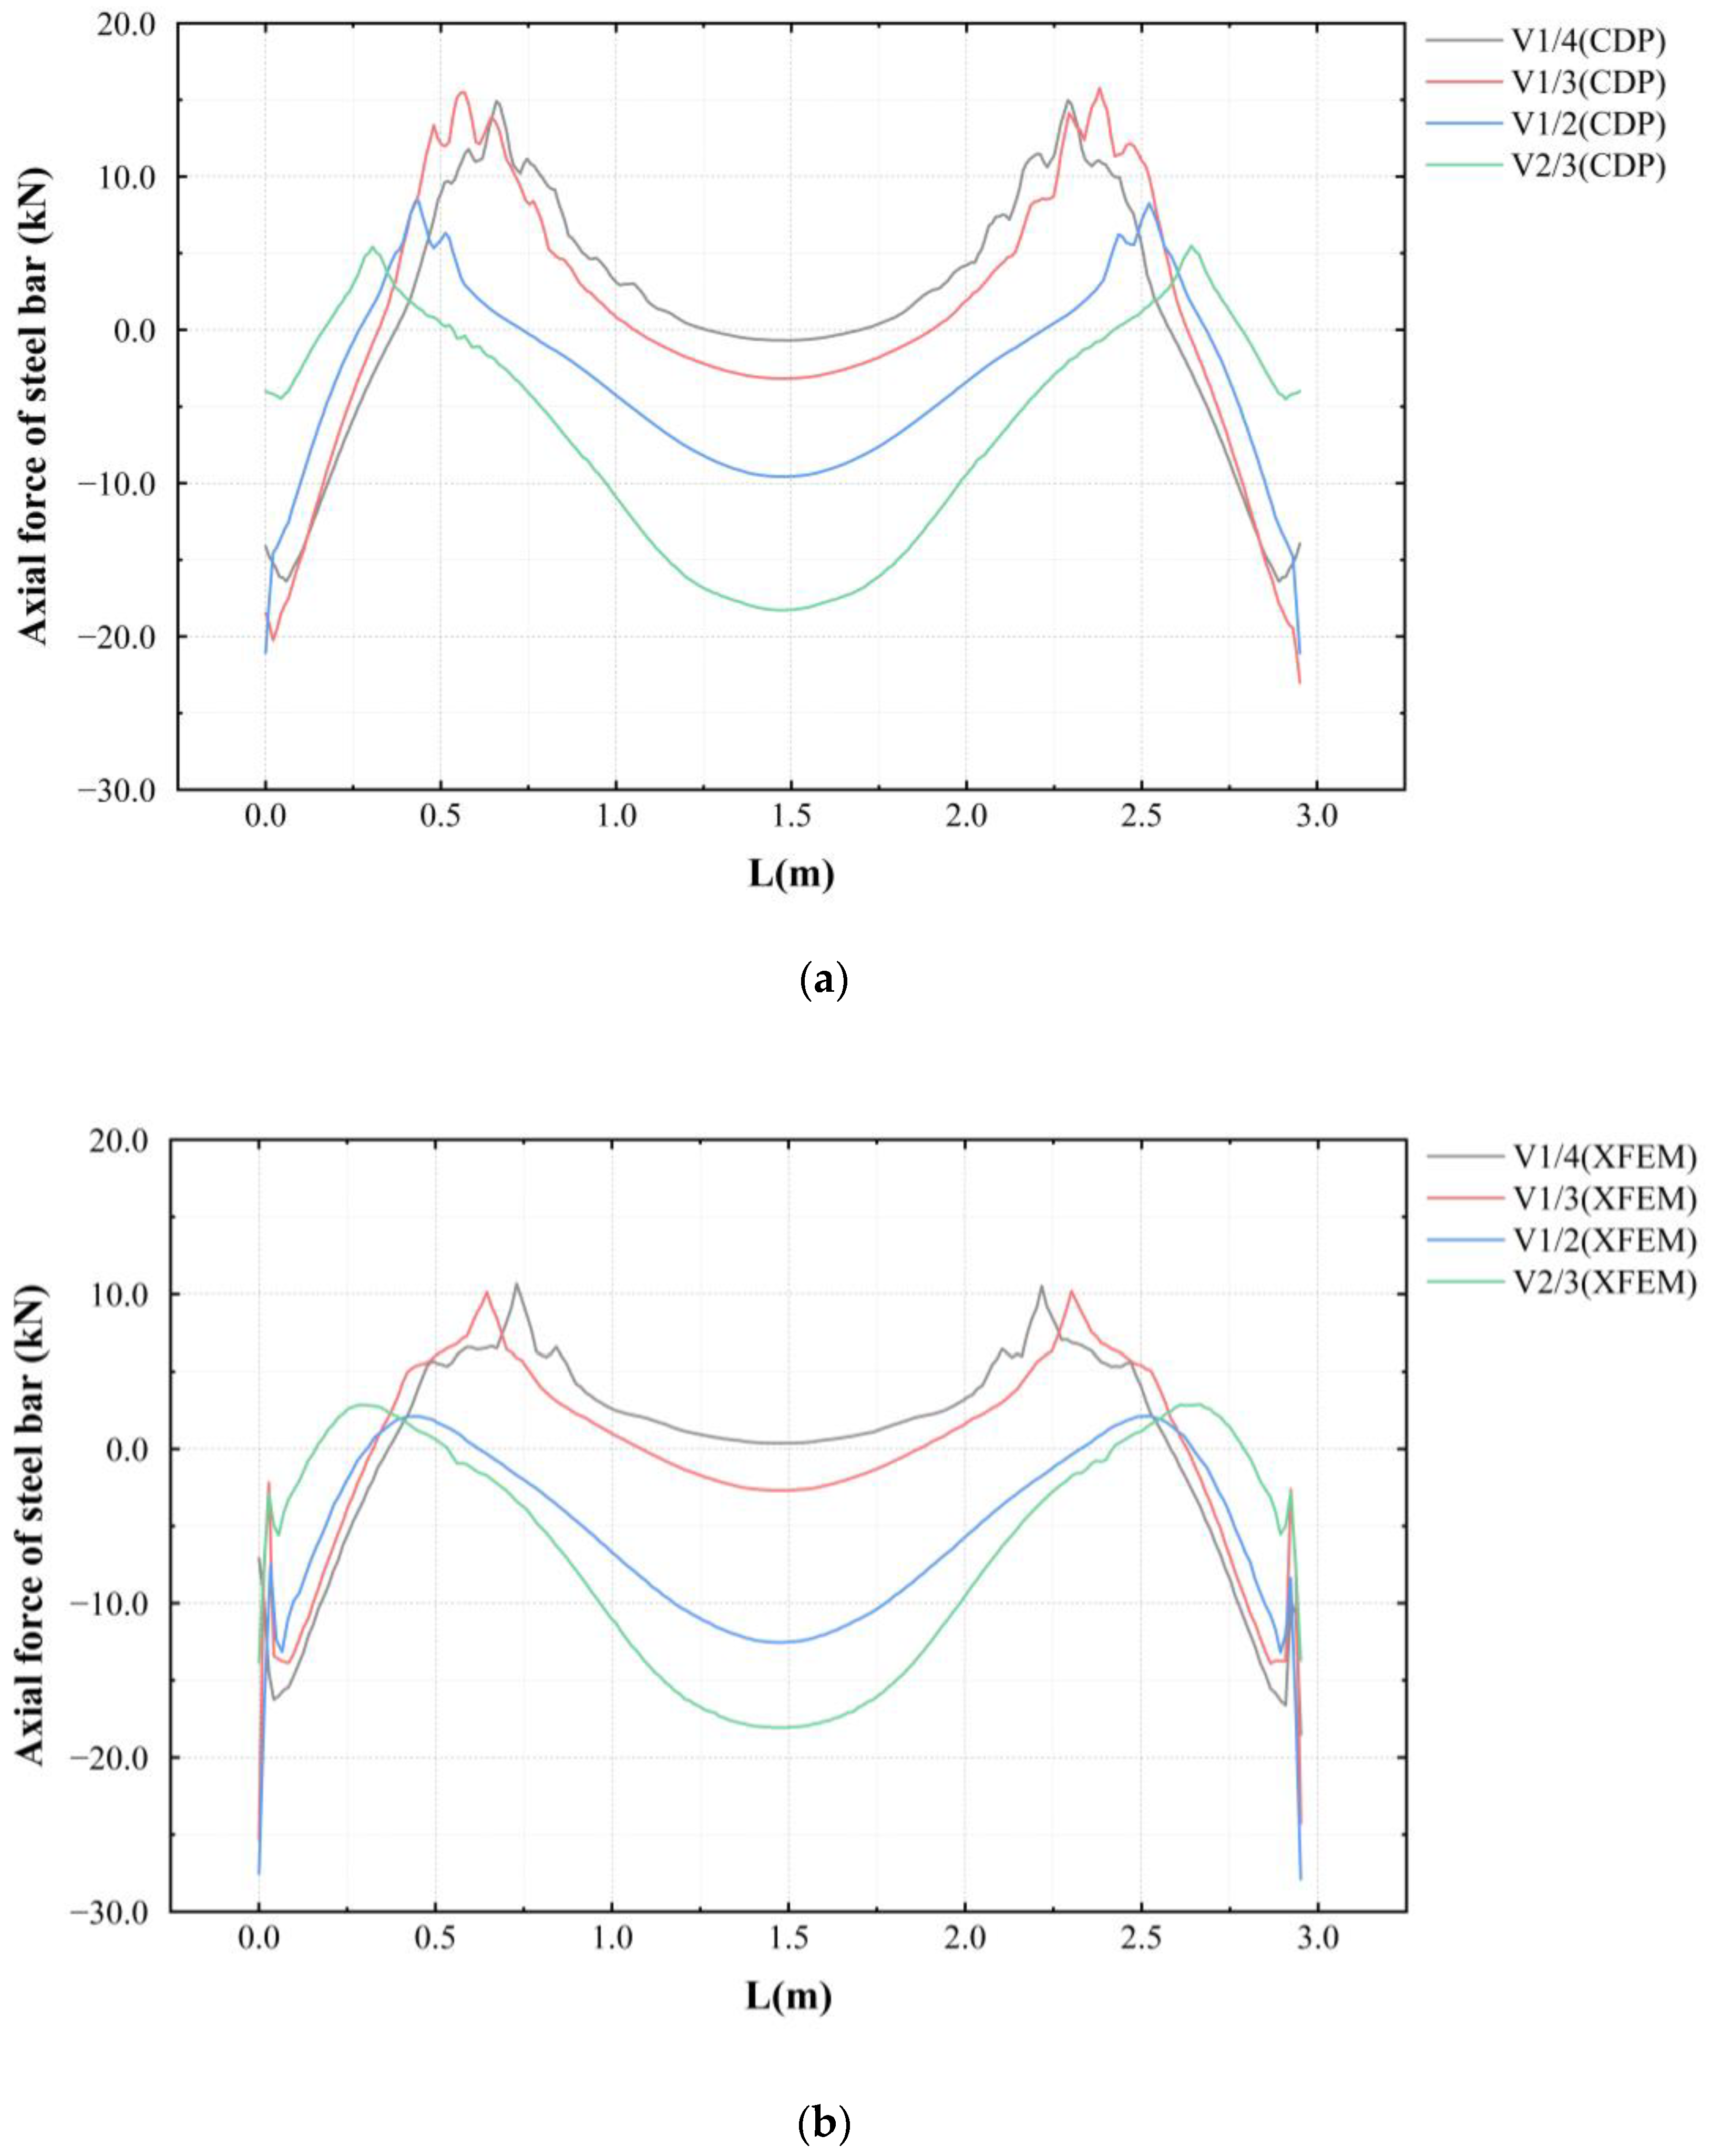
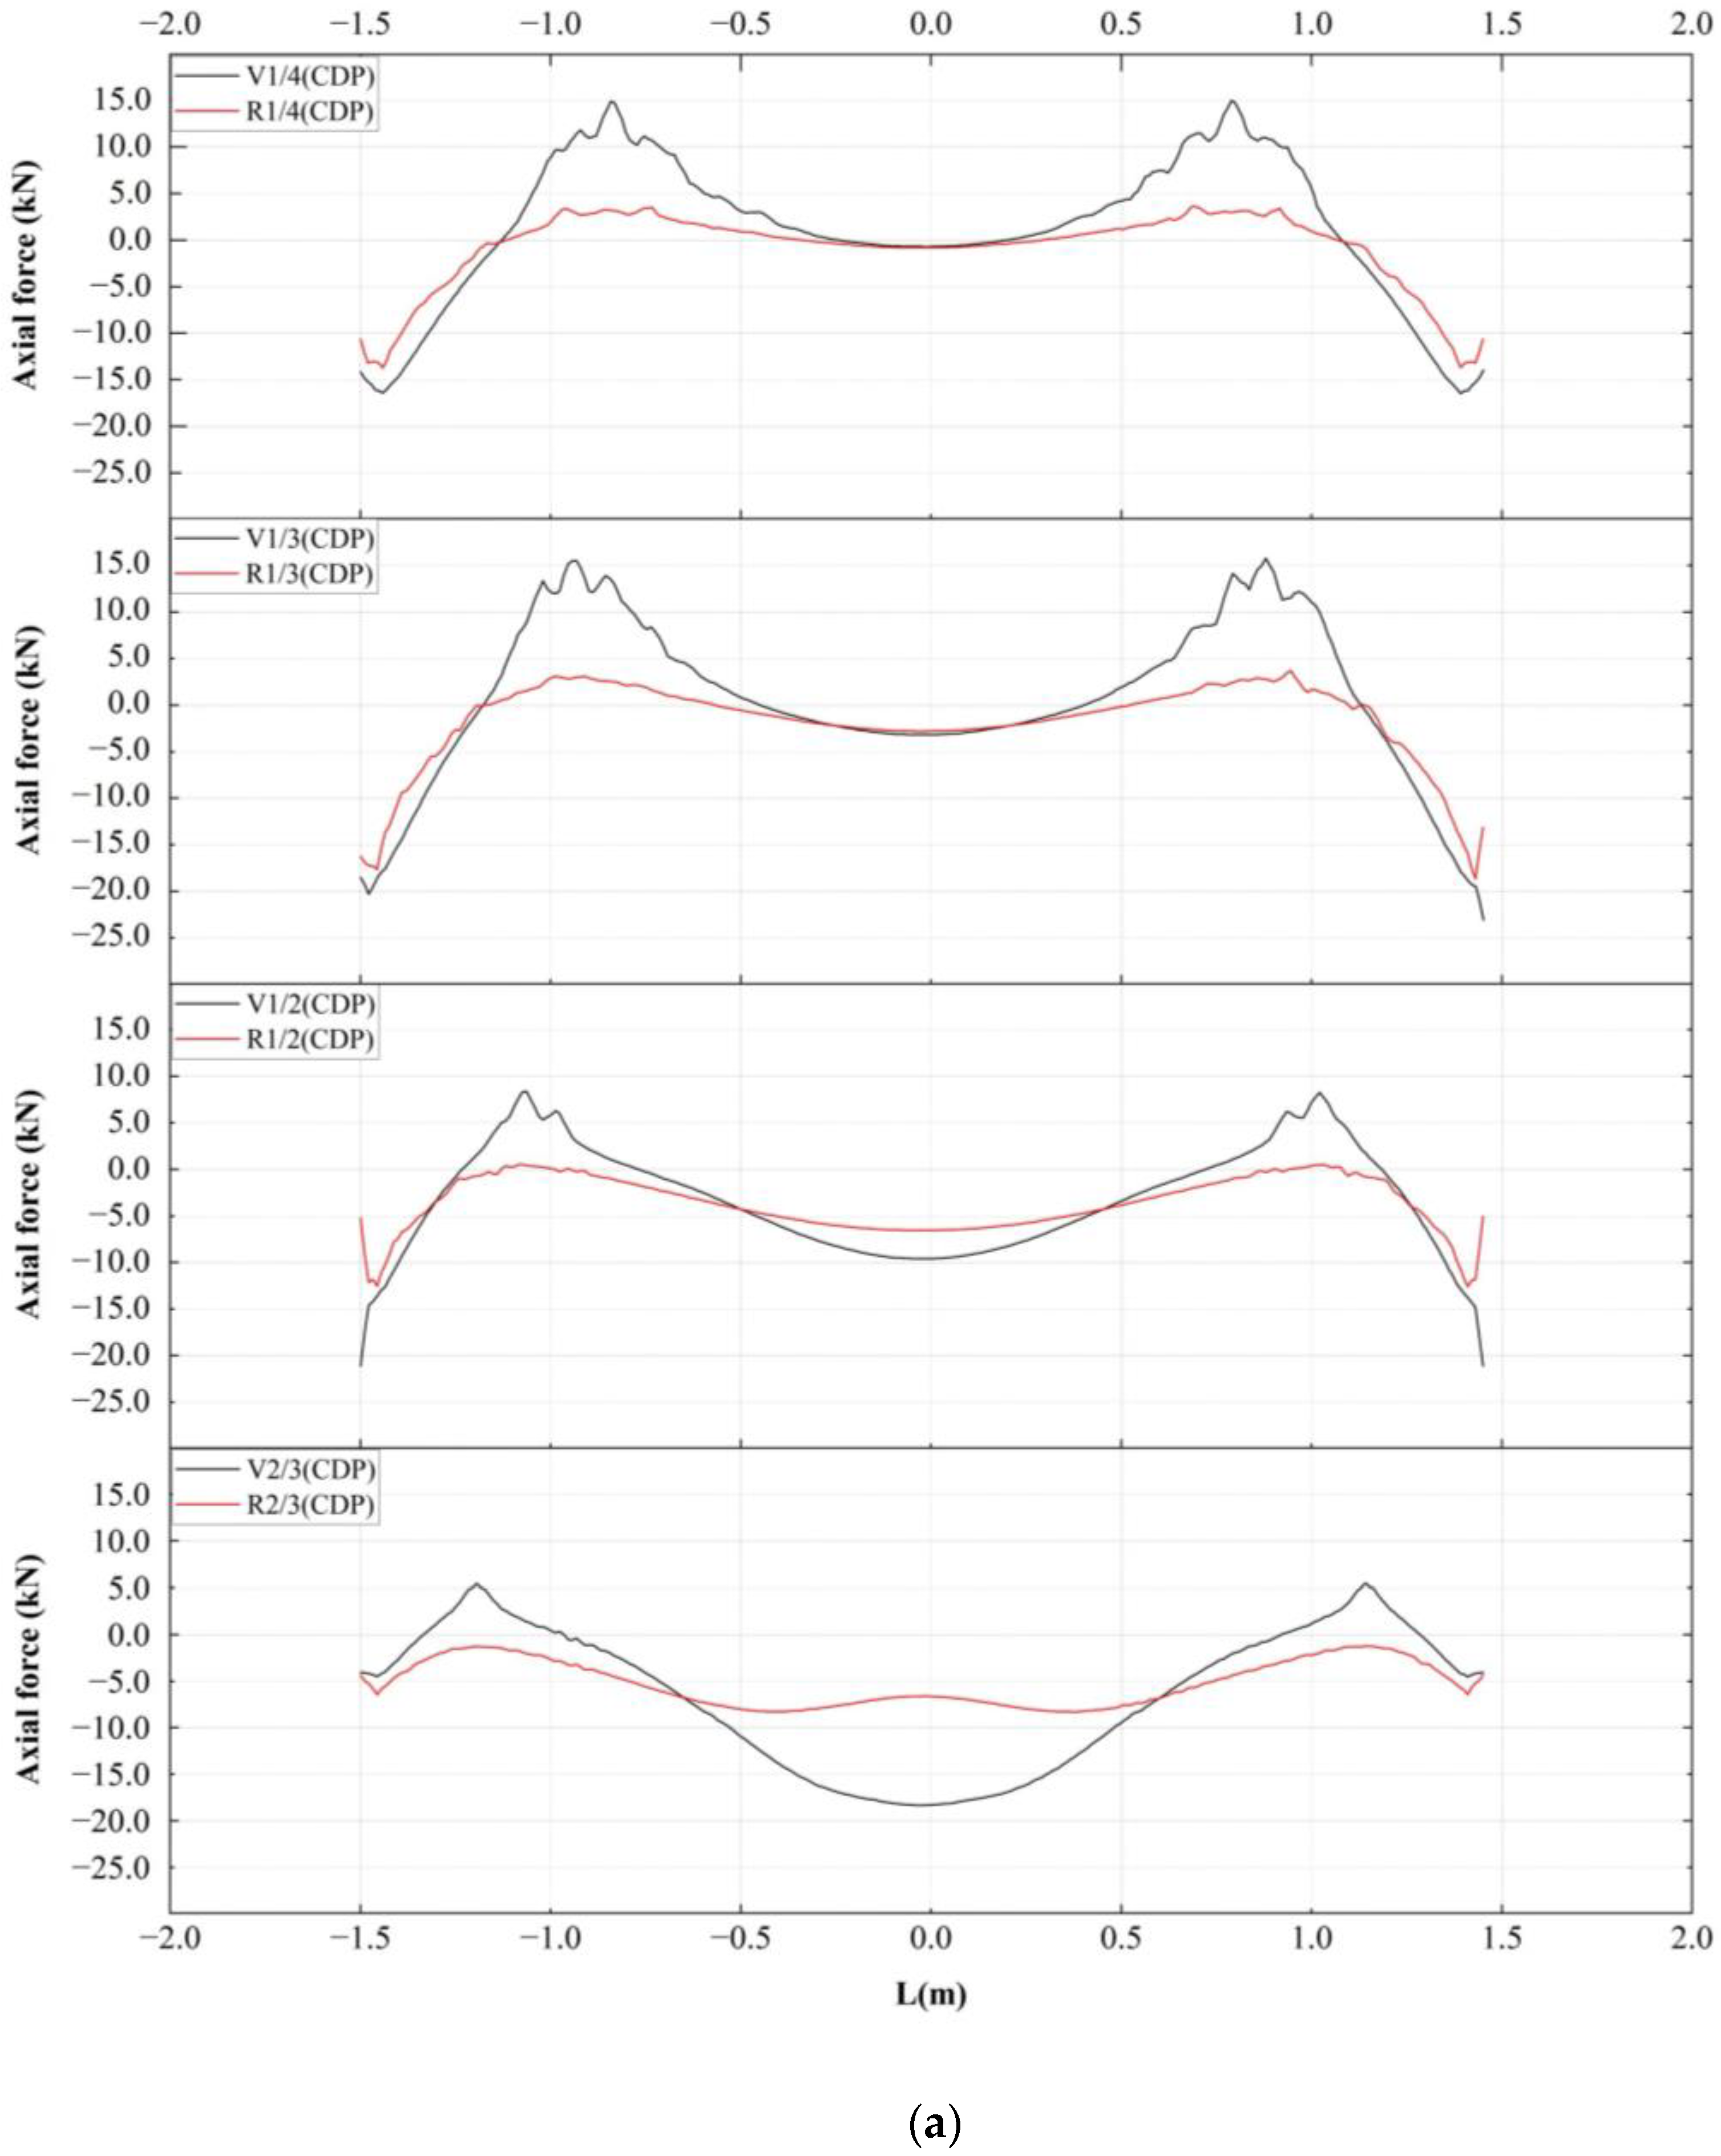
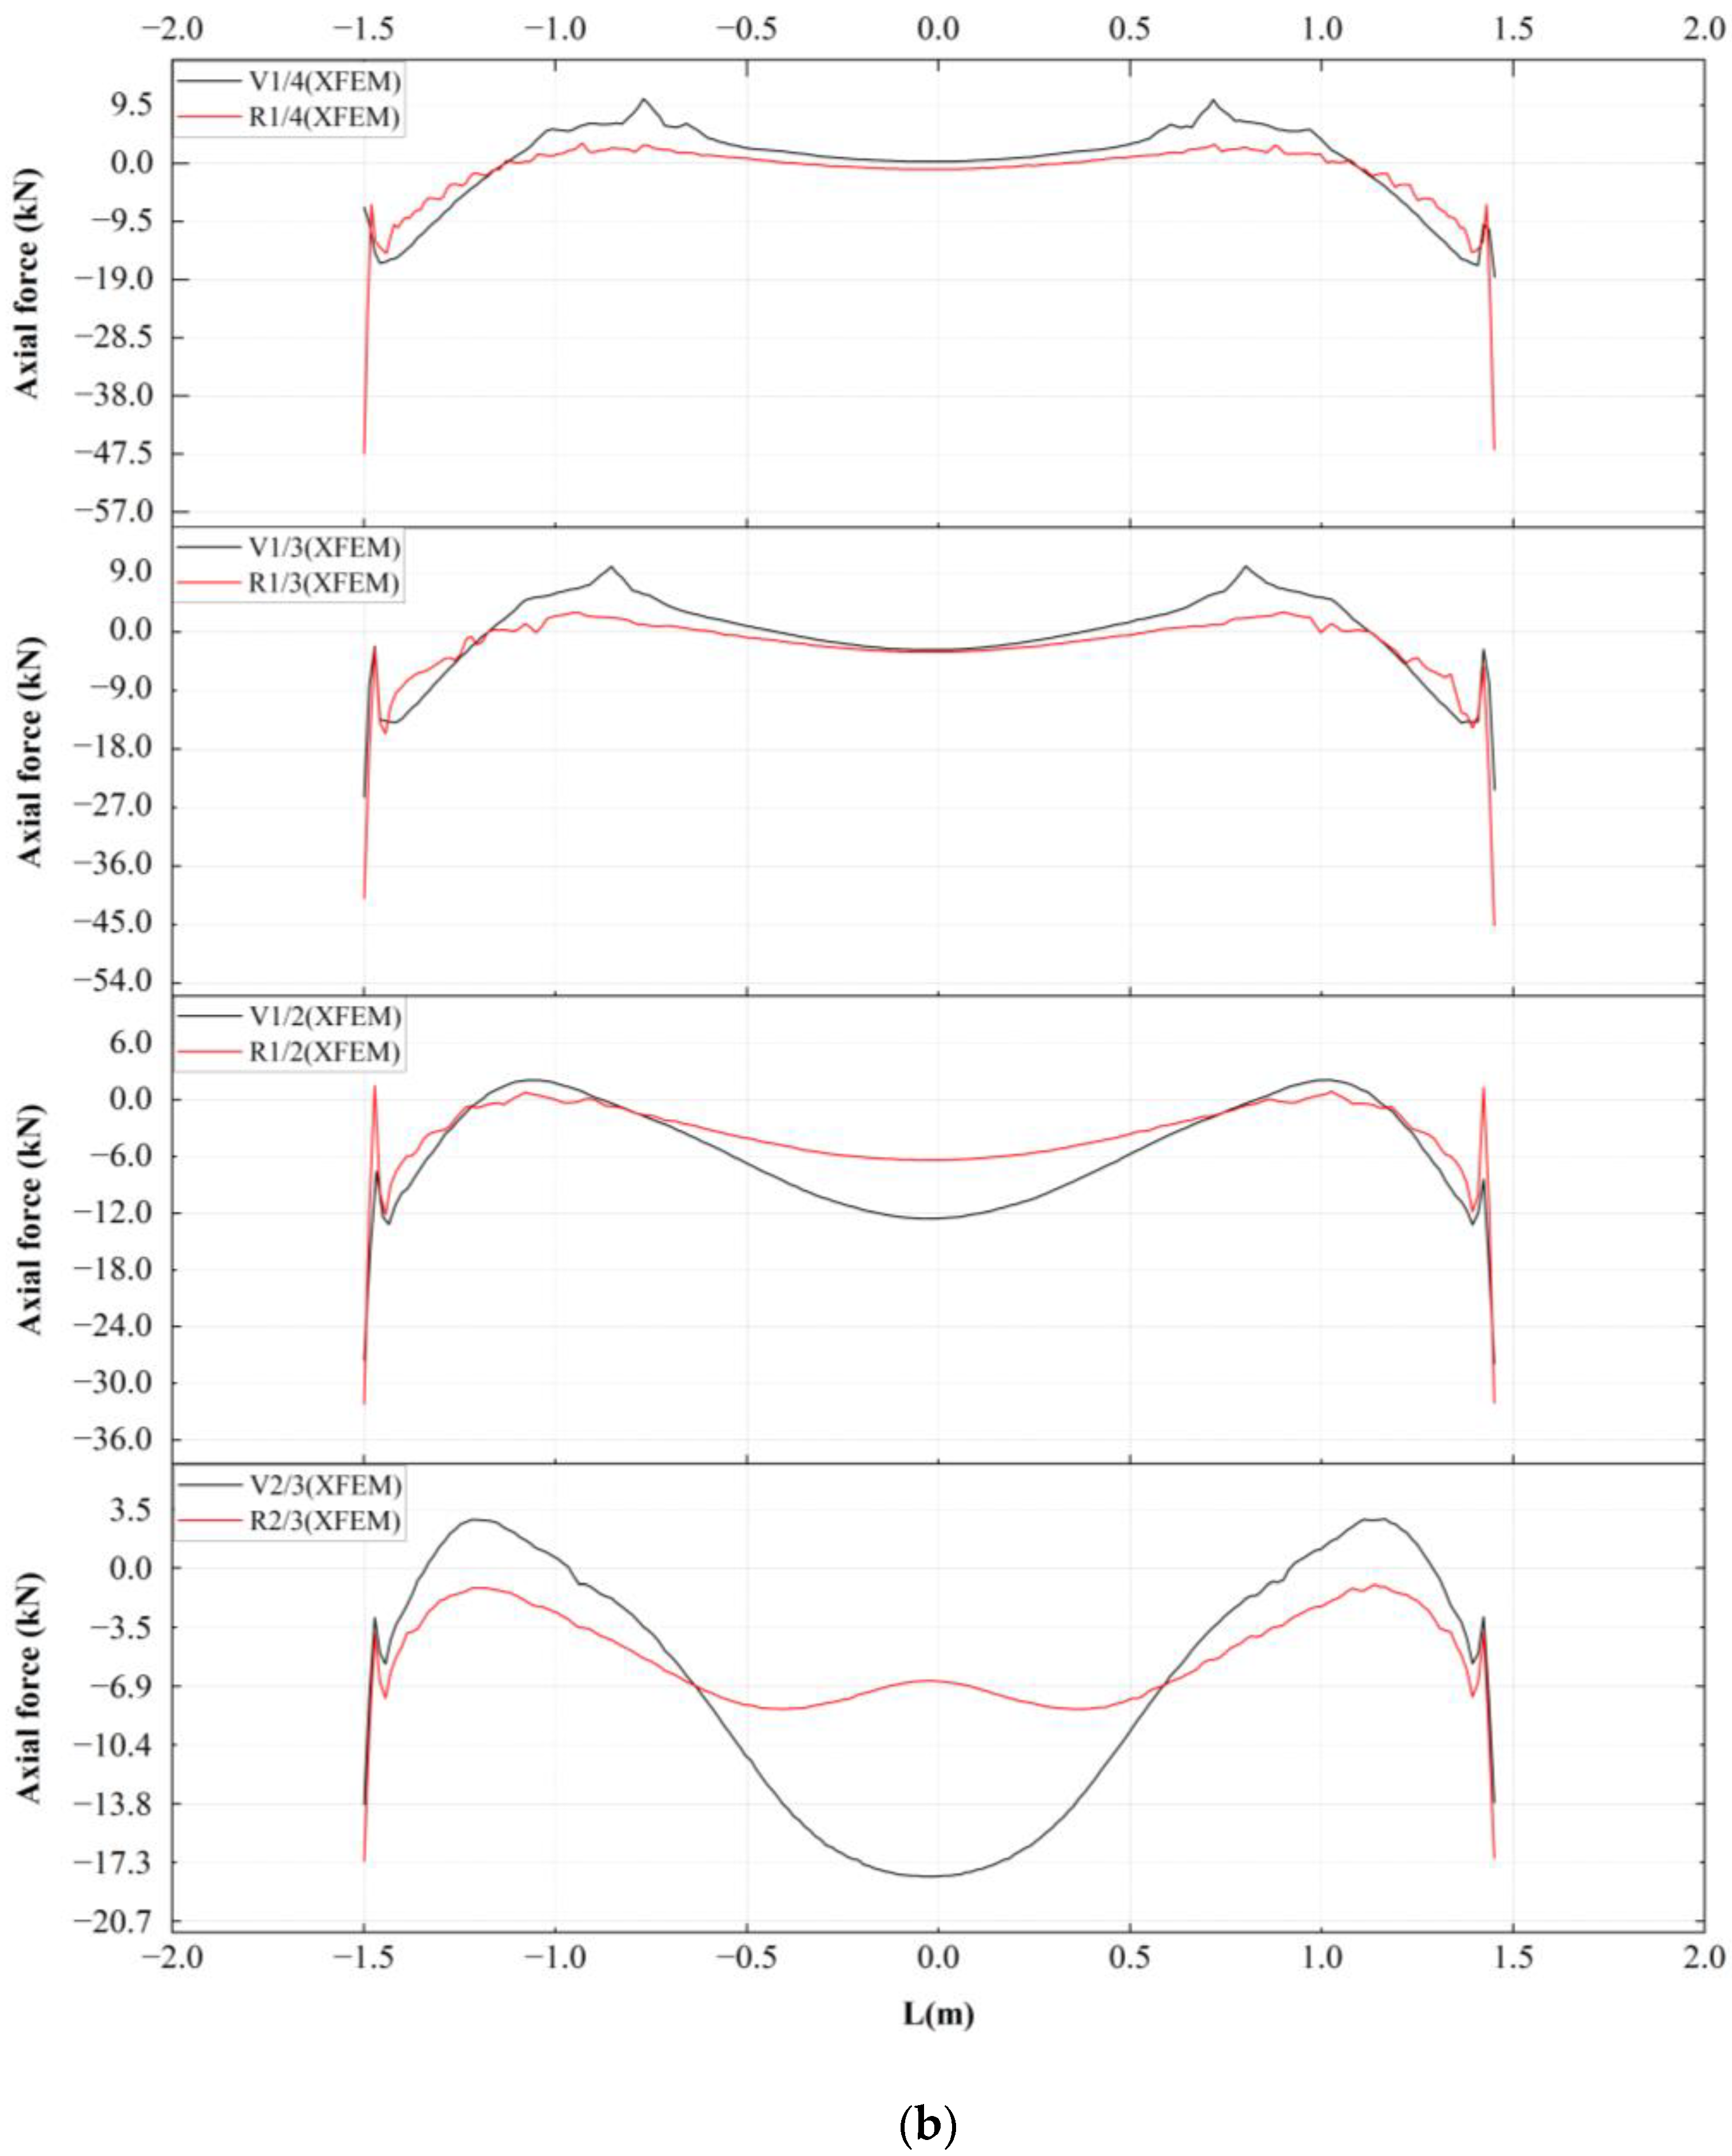
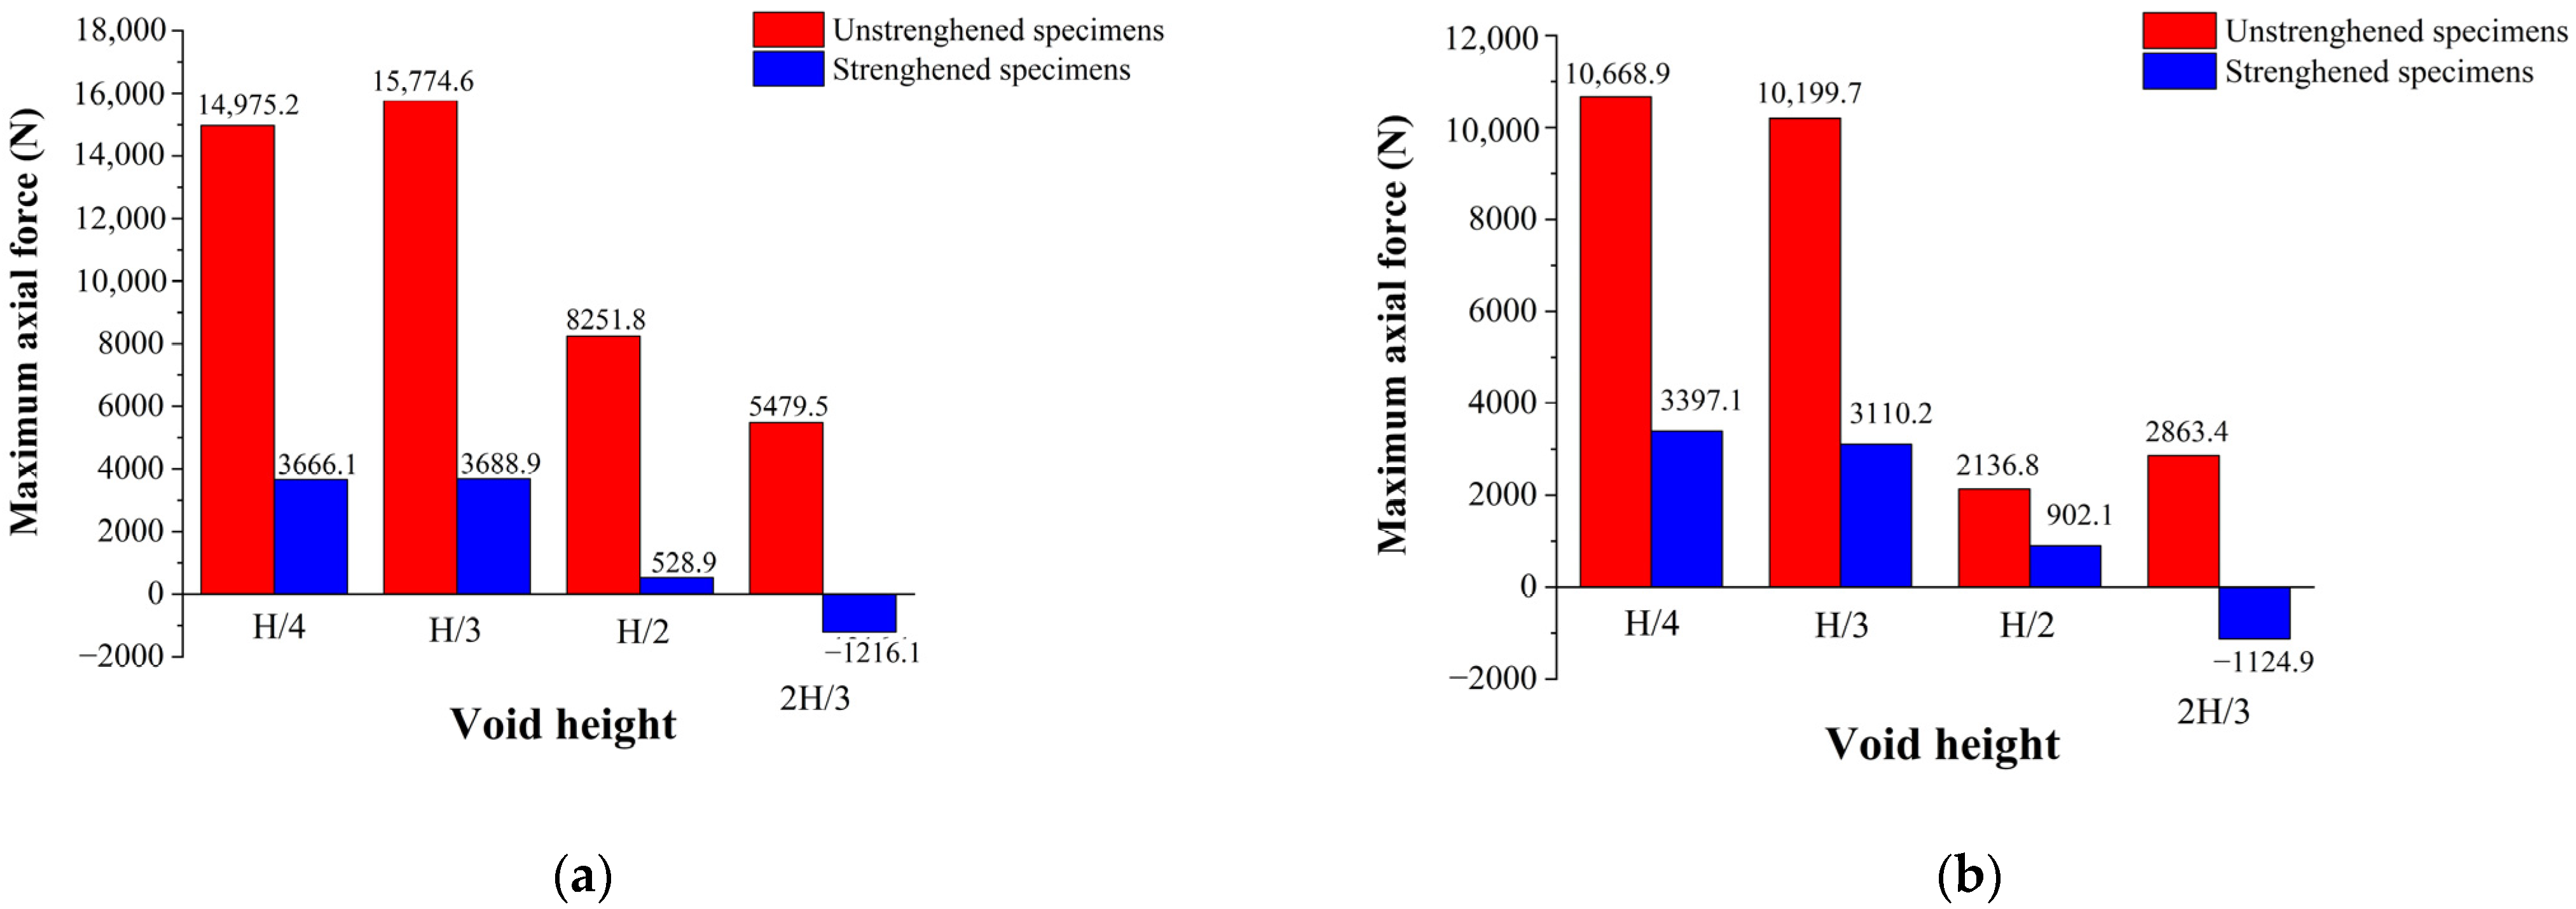
4.3. Axial Force of Rebars
5. Comparison with Experimental Data
5.1. Comparison of Damage Data
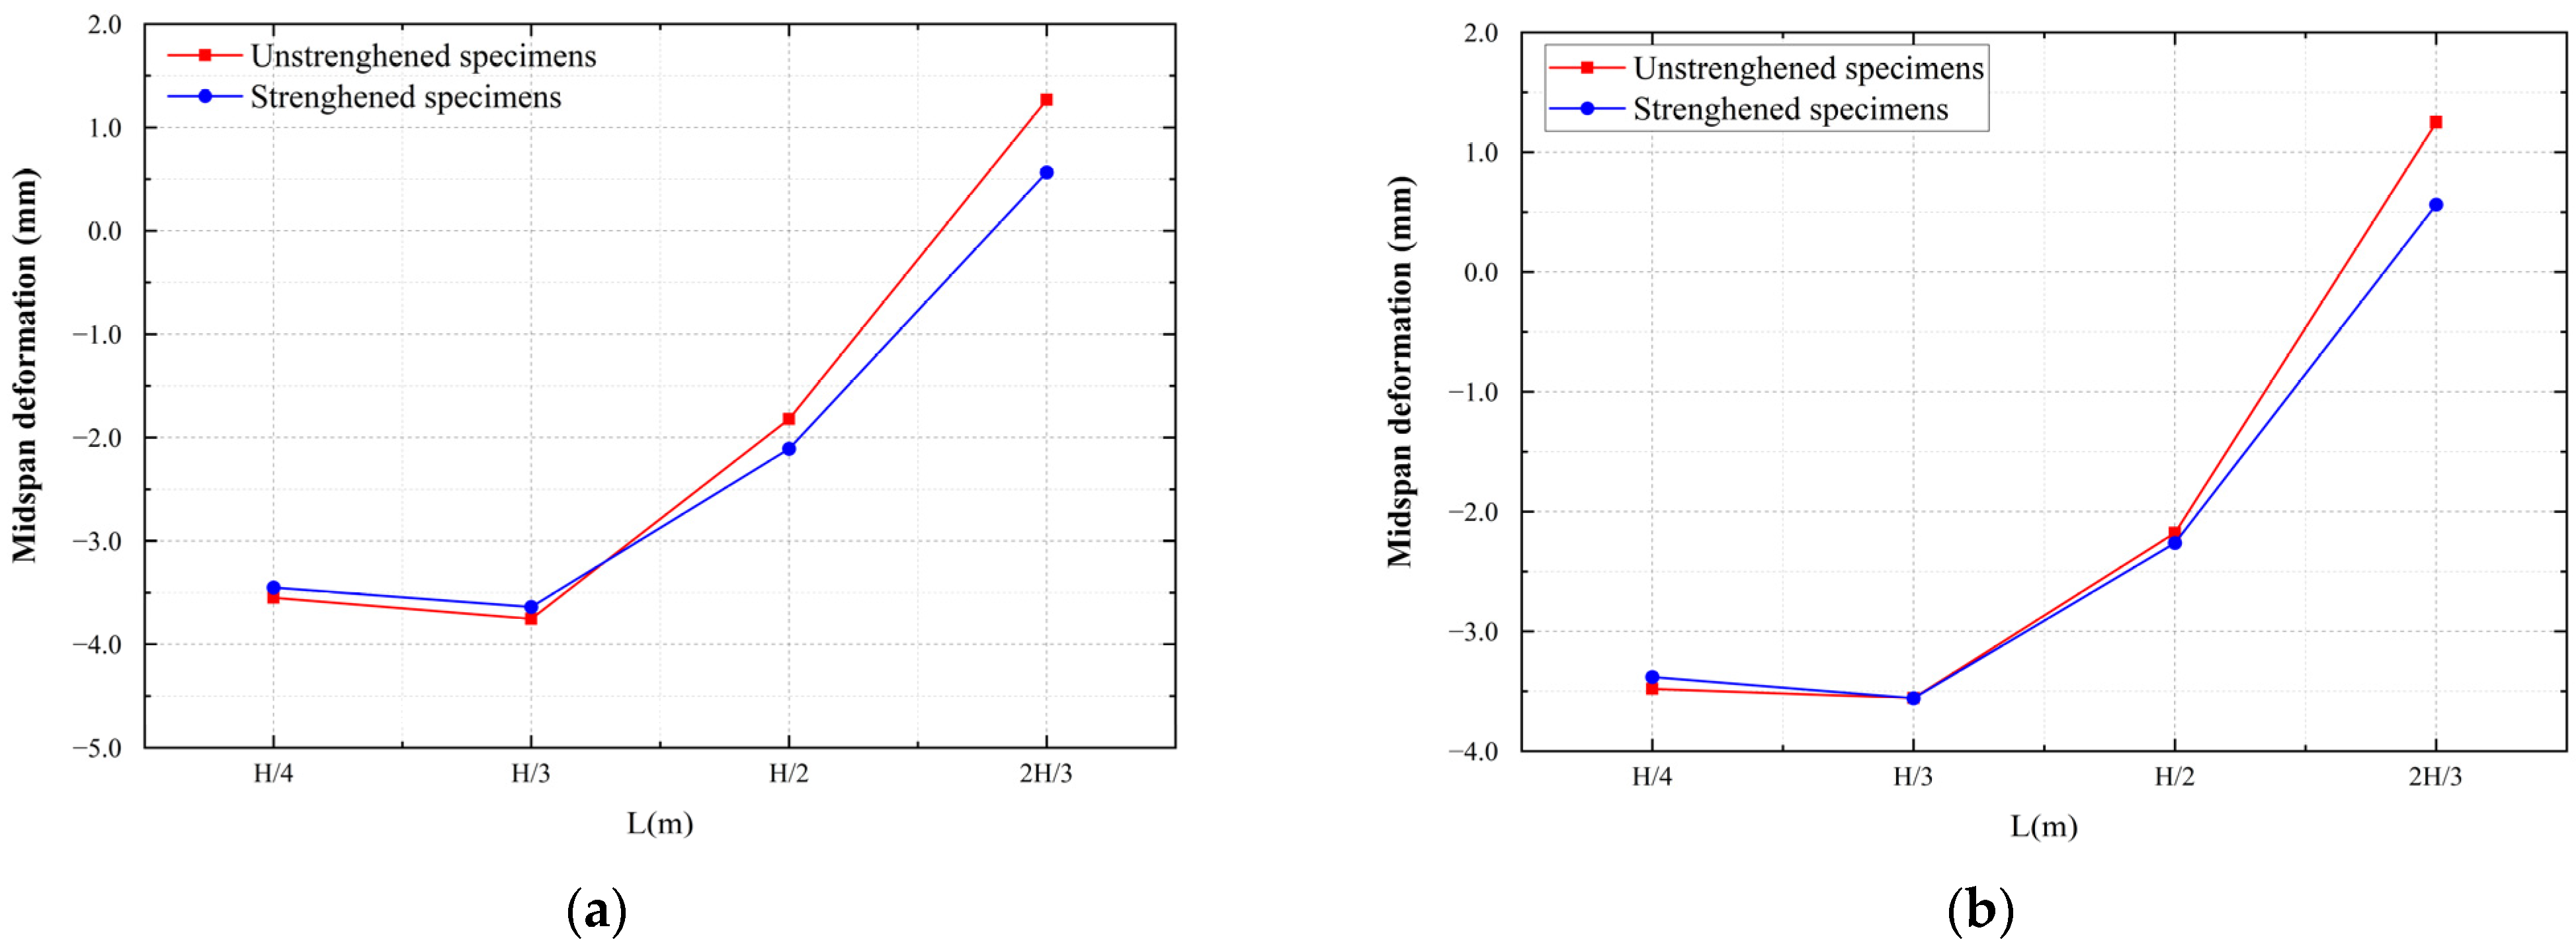
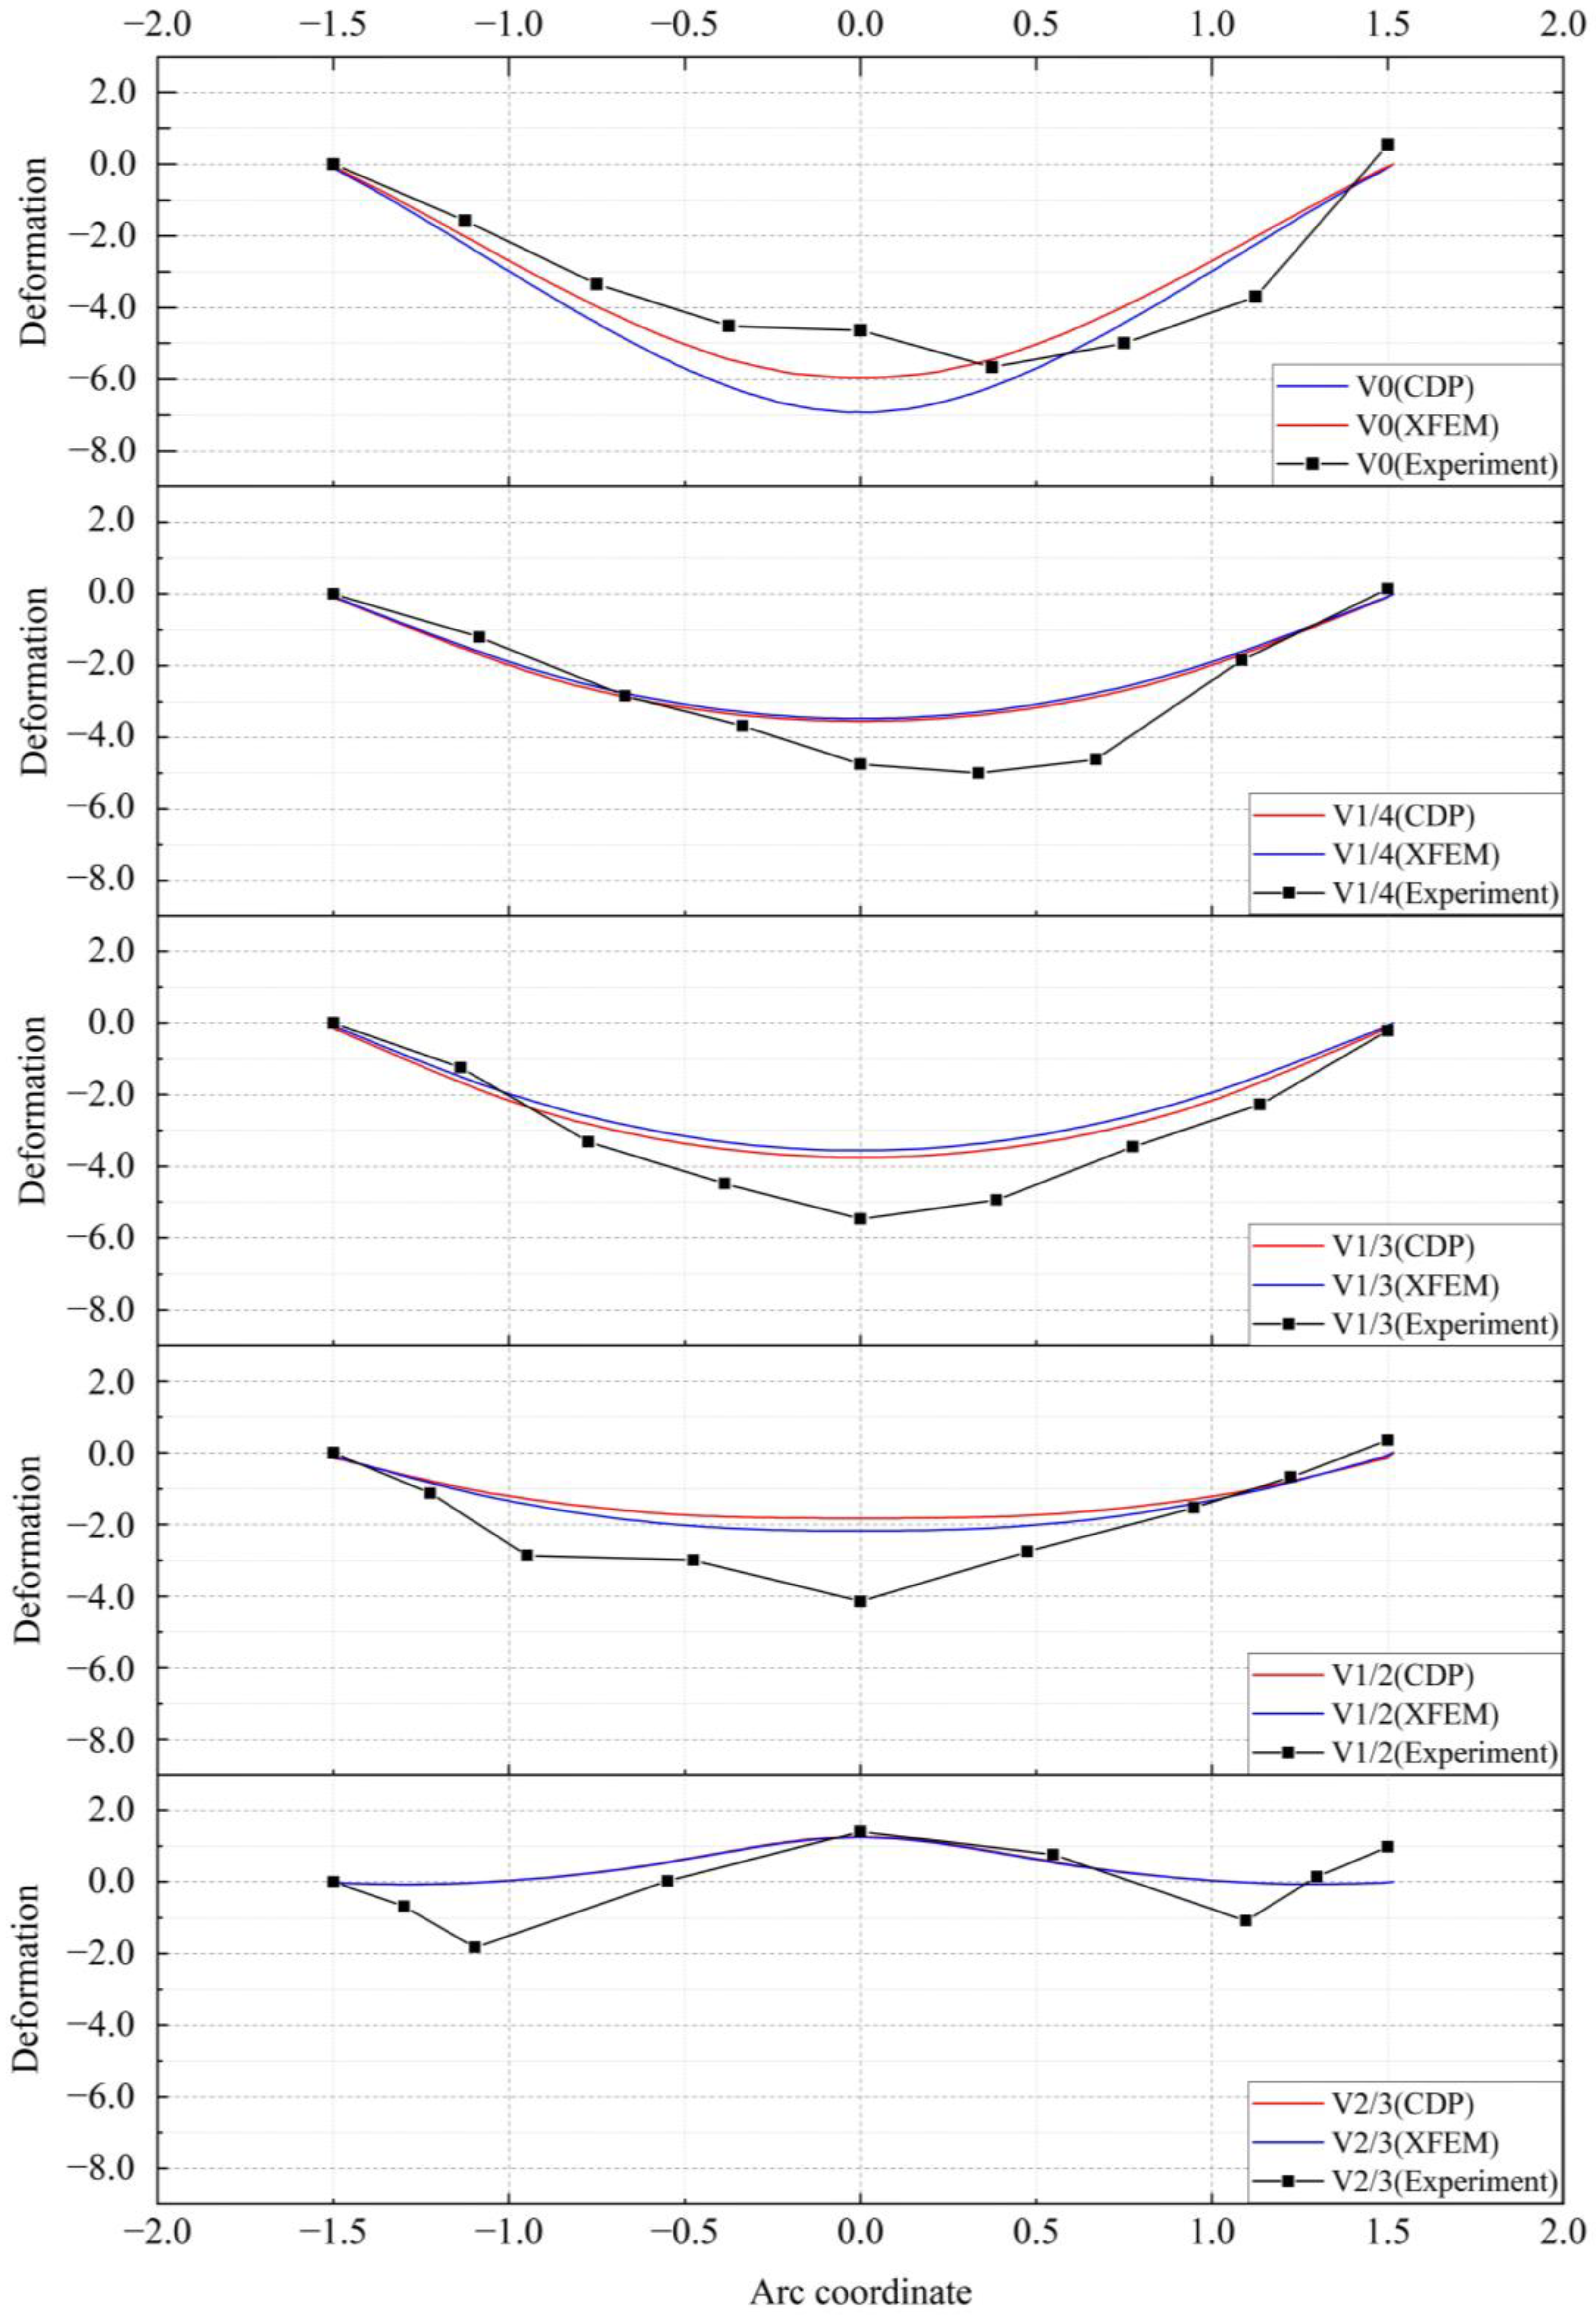
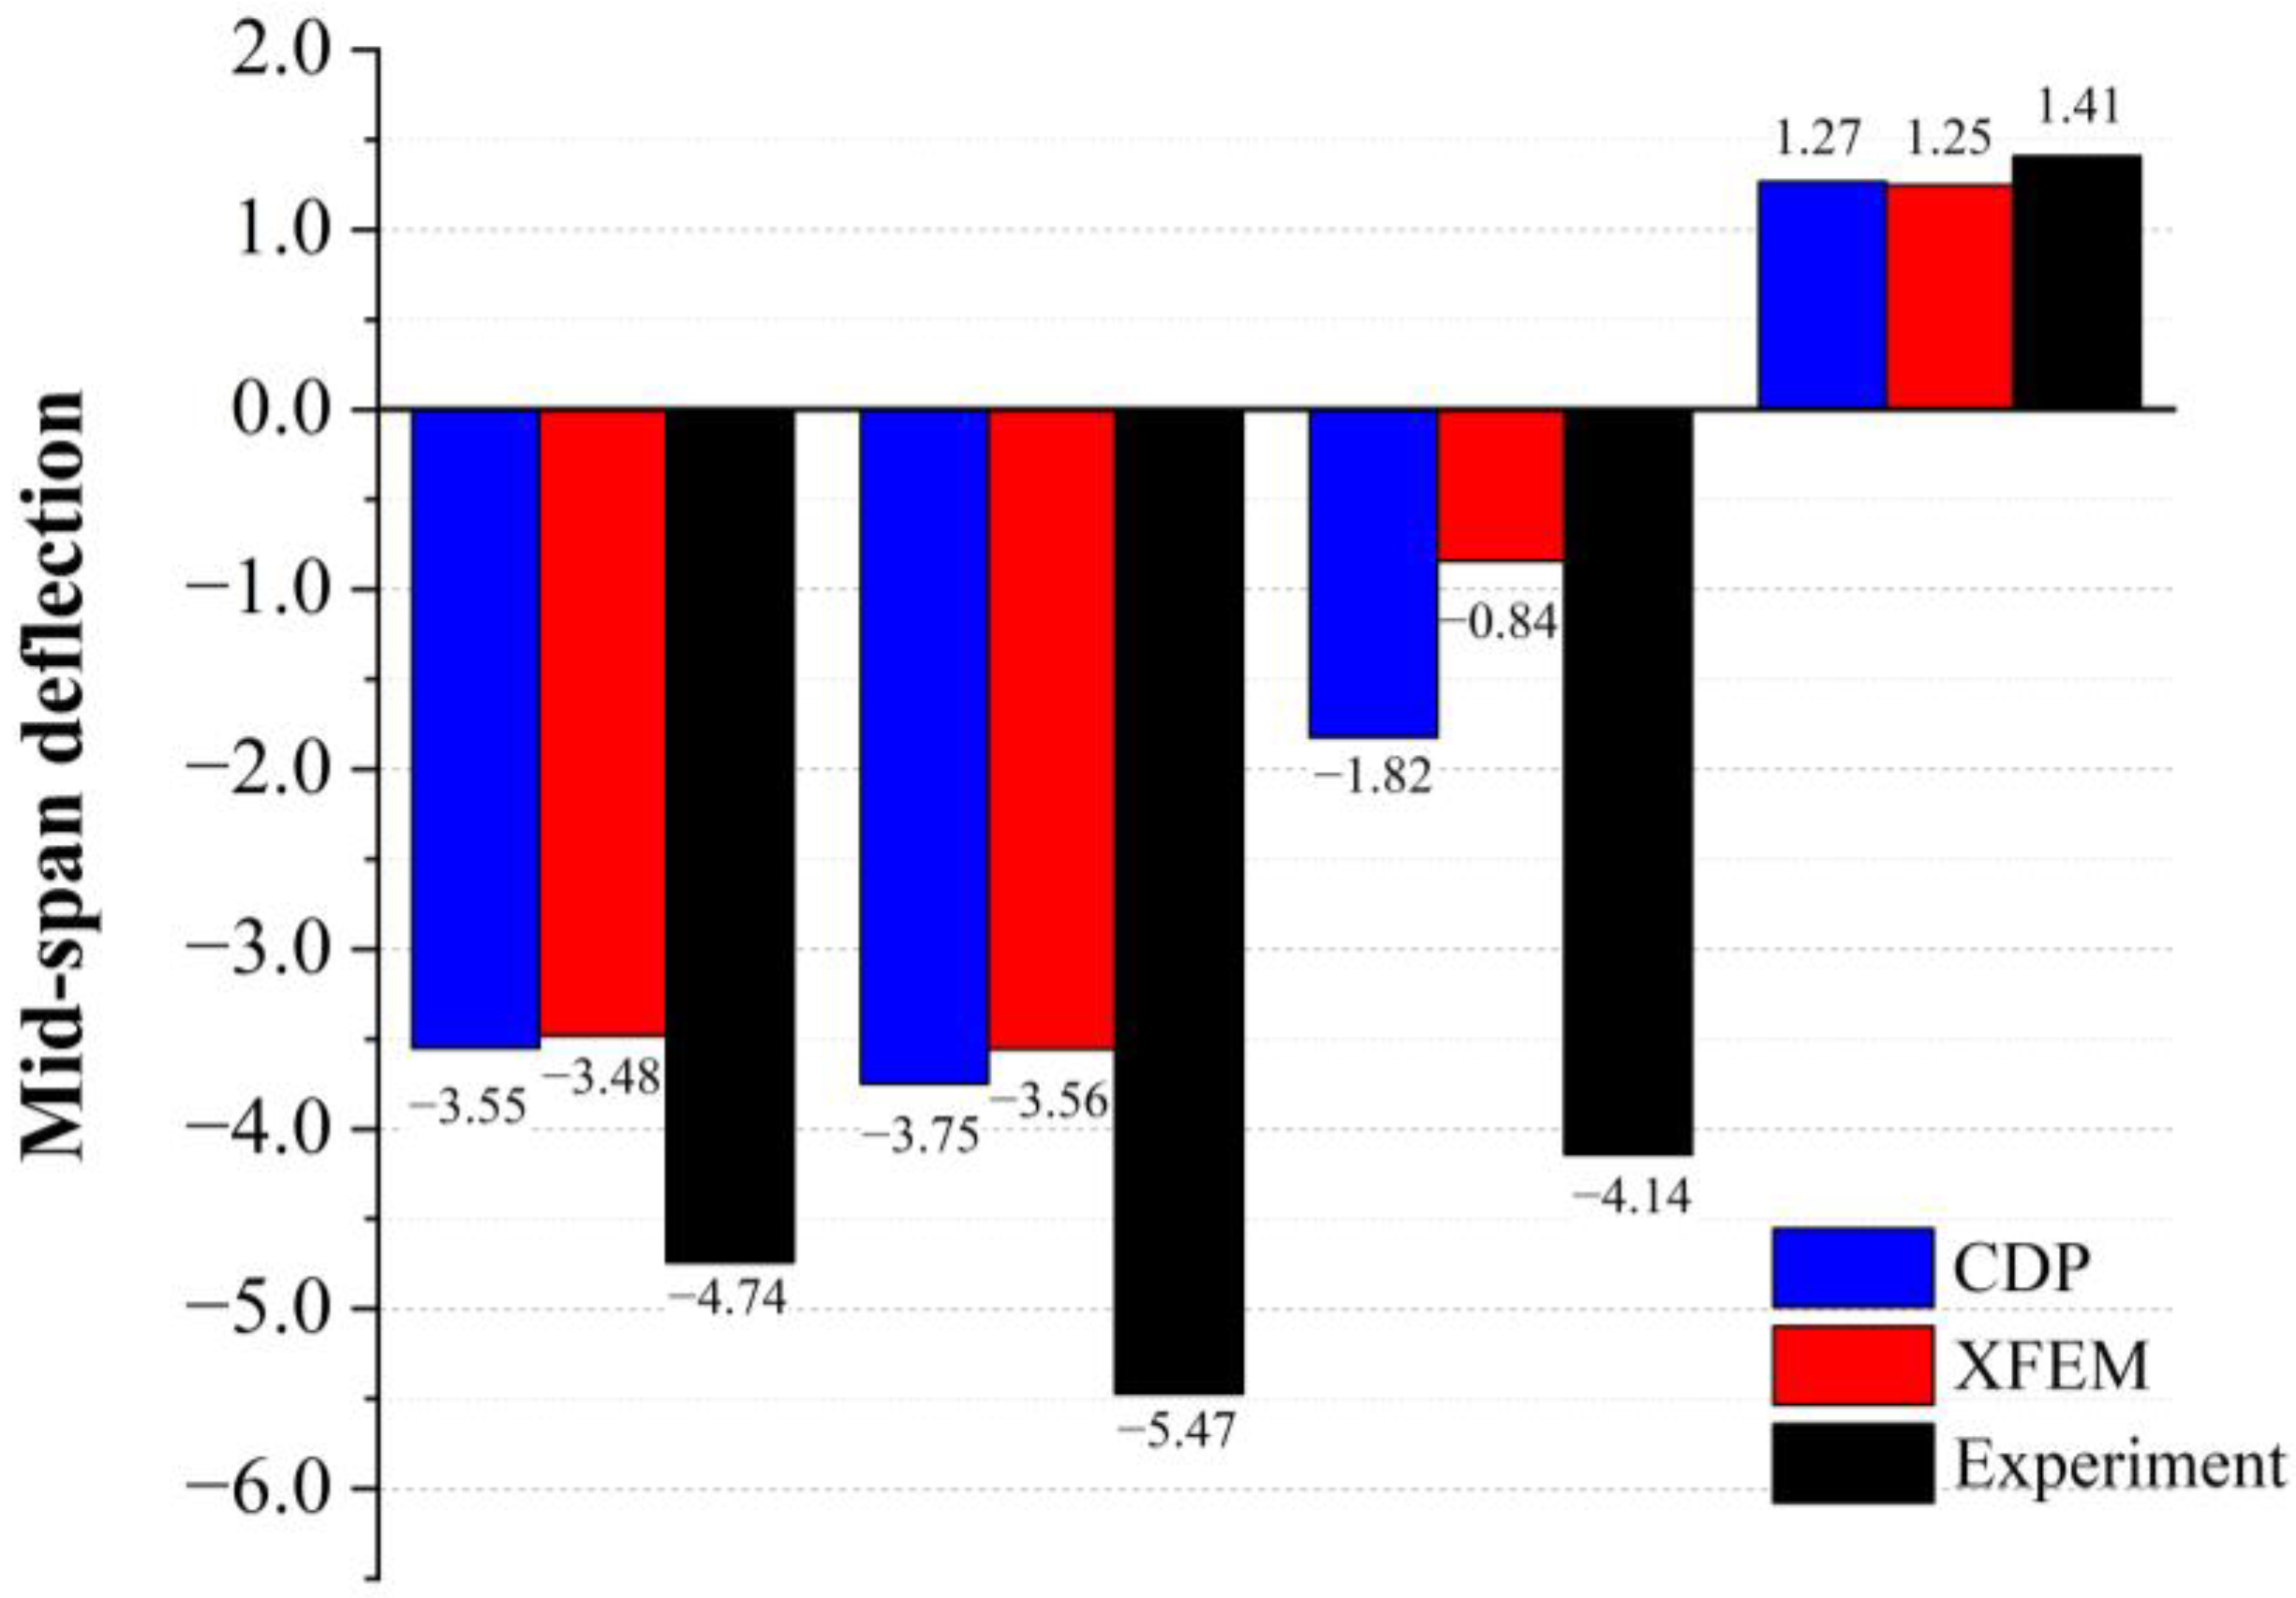
5.2. Comparison of Vertical Deformation
6. Discussion
7. Conclusions
- A local model experiment was carried out to study the stress characteristics of the void vault lining. The results show that the damage to the lining caused by the void was mainly concentrated on the void boundary in the form of cracks radially distributed along the lower surface. With the increase in the void height, the damage at the void boundary gradually decreased. When the void height increased from 1/4 of the secondary lining thickness to 3/4 of the secondary lining thickness, the number of cracks decreased from 14 to 4, and the length of the damaged area decreased from 1.047 to 0.091 m. In addition, the voids caused a relative uplift of the vault position. The higher the void height was, the higher the bulge was;
- Vault void linings with steel plate strengthening were made to verify the strengthening effect. The experimental results show that the damaged area of the lower surface of the strengthened specimen was significantly reduced, the number and length of the cracks were significantly reduced, the axial force of the lower layer reinforcement was significantly reduced, and the vault bulge caused by the void improved;
- Numerical simulations with the CDP and XFEM models were used to verify the model experiment. Through the comparison of the results of the experiment and numerical simulations, the accuracy of the numerical simulations was verified by the damage state, vertical deformation, and axial force of rebars. The results show that the numerical results were similar to the experimental results in terms of damage and deformation. CDP and XFEM revealed high reliability in the stress analysis and damage assessment of the RC lining;
- The advantages and disadvantages of CDP and XFEM in the simulation of structural damage in RC structures were compared and analyzed. In terms of damage expression, the damage coefficient was used in the CDP model to define the damage to the element, and the crack location was not easily identified. By comparison, an independent displacement field function was used in the XFEM model, so the cracking of concrete was more intuitive. However, using the XFEM, only the tensile pattern at the opening of the cracks was detected for damage assessment, so it is difficult to analyze the compression failure using this model. Compared with XFEM, both the damage in tension and compression were defined at the same time using the CDP method, and the concrete after the damage entered a stiffness degradation stage; thus, this model is more suitable for accurate damage assessments and stress analyses in engineering practice.
Author Contributions
Funding
Institutional Review Board Statement
Informed Consent Statement
Data Availability Statement
Conflicts of Interest
References
- Comprehensive Transportation Research Institute of the National Development and Reform Commission. China Transportation Development Report 2020; China Market Press: Beijing, China, 2020.
- Gao, Y.; Jiang, Y.J.; Li, B. Voids delineation behind tunnel lining based on the vibration intensity of microtremors. Tunn. Undergr. Space Technol. 2016, 51, 338–345. [Google Scholar] [CrossRef]
- Huang, G.; Gong, L.; Sun, X.; Liang, Z.N.; Wang, X.Y. Numerical investigation on flexural performance of retrofitted tunnel lining with short bolts and steel-plate. Tunn. Undergr. Space Technol. 2020, 51, 103152.1–103152.16. [Google Scholar] [CrossRef]
- Zhang, W.; Qi, J.; Zhang, G.; Niu, R.; Zhang, C.; He, L.; Lyu, J. Full-scale experimental study on failure characteristics of the key segment in shield tunnel with super-large cross-section. Tunn. Undergr. Space Technol. 2022, 129, 104671. [Google Scholar] [CrossRef]
- Zhang, J.; Zhao, M. Experimental study on mechanical behavior of the skew joints of shield tunnels under large eccentric compressive loading. Tunn. Undergr. Space Technol. 2021, 111, 103876. [Google Scholar] [CrossRef]
- Tian, L.; Hu, Z.; Chen, J. Experimental and Numerical Research on Defective Shield Segment under Cyclic Loading. Shock. Vib. 2021, 2021, 8567899. [Google Scholar] [CrossRef]
- Min, B.; Zhang, C.; Zhang, X.; Wang, H.; Zhang, D. Cracking performance of asymmetric double-arch tunnels due to the voids behind linings. Thin-Walled Struct. 2020, 154, 106856. [Google Scholar] [CrossRef]
- Gong, C.; Wang, Y.; Peng, Y.; Ding, W.; Lei, M.; Da, Z.; Shi, C. Three-dimensional coupled hydromechanical analysis of localized joint leakage in segmental tunnel linings. Tunn. Undergr. Space Technol. 2022, 130, 104726. [Google Scholar] [CrossRef]
- Gong, C.; Ding, W.; Xie, D. Twin EPB tunneling-induced deformation and assessment of a historical masonry building on Shanghai soft clay. Tunn. Undergr. Space Technol. 2022, 98, 103300. [Google Scholar] [CrossRef]
- Meguid, M.A.; Dang, H.K. The effect of erosion voids on existing tunnel linings. Tunn. Undergr. Space Technol. 2009, 24, 278–286. [Google Scholar] [CrossRef]
- Zhang, X.; Ye, Z.J.; Min, B.; Xu, Y.J. Effect of voids behind lining on the failure behavior of symmetrical double-arch tunnels. Symmetry 2019, 11, 1321. [Google Scholar] [CrossRef]
- Wang, J.F.; Huang, H.W.; Xie, X.Y.; Bobet, A. Void-induced liner deformation and stress redistribution. Tunn. Undergr. Space Technol. 2014, 40, 263–276. [Google Scholar] [CrossRef]
- Li, J.J.; Fang, Y.; Liu, C.; Zhang, Y.X.; Lu, W.H. Performance investigation of tunnel lining with cavities around surrounding rocks. Adv. Civ. Eng. 2020, 2020, 1364984. [Google Scholar] [CrossRef] [Green Version]
- Mashimo, H. State of the road tunnel safety technology in Japan. Tunn. Undergr. Space Technol. 2002, 17, 145–152. [Google Scholar] [CrossRef]
- Wang, B.; Li, T.B.; He, C.; She, J. Model test of effect of lining thinning on tunnel structure bearing capacity. J. China Railw. Sci. 2013, 35, 106–114. [Google Scholar]
- Yasuda, N.; Tsukada, K.; Asakura, T. Elastic solutions for circular tunnel with void behind lining. Tunn. Undergr. Space Technol. 2017, 70, 274–285. [Google Scholar] [CrossRef]
- Zhang, S.; Ren, Z.; Ding, Z.; Wen, J.; Yan, Z. Influence of Existing Defects on Mechanical Properties of NC Lining. Adv. Mater. Sci. Eng. 2019, 2019, 8571297. [Google Scholar] [CrossRef] [Green Version]
- Kachanov, L.M. Rupture Time Under Creep Conditions. Int. J. Fract. 1999, 97, 11–18. [Google Scholar] [CrossRef]
- Rabotnov, I.N. On the equations of state for creep. Proc. Inst. Mech. Eng. 1963, 178, 307–315. [Google Scholar]
- Li, G.; Cui, S. A review on theory and application of plastic meso-damage mechanics. Theor. Appl. Fract. Mech. 2020, 109, 102686. [Google Scholar] [CrossRef]
- Lemaitre, J.; Chaboche, J.L.; Maji, A.K. Mechanics of Solid Materials. J. Eng. Mech. 1992, 119, 642–643. [Google Scholar]
- Murakami, S. Continuum Damage Mechanics: A Continuum Mechanics Approach to the Analysis of Damage and Fracture; Springer: Dordrecht, The Netherlands, 2012; Volume 41, pp. 4731–4755. [Google Scholar]
- Krajcinovic, D. Damage mechanics. Mech. Mater. 1989, 8, 117–197. [Google Scholar] [CrossRef]
- Lubliner, J.; Oliver, J.; Oller, S.; Onate, E. A plastic-damage model for concrete. Int. J. Solids Struct. 1989, 25, 299–326. [Google Scholar] [CrossRef]
- Lee, J.; Fenves, G.L. A return-mapping algorithm for plastic-damage models: 3-D and plane stress formulation. Int. J. Numer. Methods Eng. 2001, 50, 487–506. [Google Scholar] [CrossRef]
- Lee, J. Theory and Implementation of Plastic-Damage Model for Concrete Structures under Cyclicn and Dynamic Loading. Ph.D. Thesis, Department of Civil and Environmental Engineering, University of California, Berkeley, CA, USA, 1996. [Google Scholar]
- Lee, J.; Fenves, G.L. Plastic-damage model for cyclic loading of concrete structures. J. Eng. Mech. 1998, 124, 892–900. [Google Scholar] [CrossRef]
- Narjar, J. Continuous damage of brittle solids. In Continuum Damage Mechanics—Theory and Applications; Krajcinovic, D., Lemaitre, J., Eds.; Springer: New York, NY, USA, 1987; pp. 233–294. [Google Scholar]
- Melenka, J.M.; Babuška, I. The partition of unity finite element method: Basic theory and applications. Comput. Methods Appl. Mech. Eng. 1996, 139, 289–314. [Google Scholar] [CrossRef] [Green Version]
- Osher, S.; Sethian, J. Fronts propagating with curvature dependent speed: Algorithms based on Hamilton-Jacobi formulations. J. Comput. Phys. 1988, 79, 12–49. [Google Scholar] [CrossRef] [Green Version]
- Barenblatt, G.I. The formation of equilibrium cracks during brittle fracture. General ideas and hypotheses. Axially-symmetric cracks. J. Appl. Math. Mech. 1959, 23, 622–636. [Google Scholar] [CrossRef]
- Ortiz, M.; Pandolfi, A. Finite-deformation irreversible cohesive element for three-dimensional crack-propagation analysis. Int. J. Numer. Methods Eng. 1999, 44, 1267–1282. [Google Scholar] [CrossRef]
- Ruiz, G.; Pandolfi, A.; Ortiz, M. Three-dimensional cohesive modeling of dynamic mixed-mode fracture. Int. J. Numer. Methods Eng. 2001, 52, 97–120. [Google Scholar] [CrossRef]
- Dolbow, J. An Extended Finite Element Method with Discontinuous Enrichment for Applied Mechanics. Ph.D. Thesis, Northwestern University, Evanston, IL, USA, 1999. [Google Scholar]
- Shi, F.; Gao, F.; Yang, Y.G. Application of extended finite element method to study crack propagation problems of orthotropic rock mass. Rock Soil Mech. 2014, 35, 1203–1210. [Google Scholar]
- Belytschko, T.; Black, T. Elastic crack growth in finite elements with minimal remeshing. Int. J. Numer. Meth. Eng. 1999, 45, 601–620. [Google Scholar] [CrossRef]
- Elguedj, T.; Gravouil, A.; Maigre, H. An explicit dynamics extended finite element method. Part 1: Mass lumping for arbitrary enrichment functions. Comput. Methods Appl. Mech. Eng. 2009, 198, 2297–2317. [Google Scholar] [CrossRef] [Green Version]
- Menouillard, T.; Song, J.H.; Duan, Q.; Belytschko, T. Time dependent crack tip enrichment for dynamic crack propagation. Int. J. Fract. 2010, 162, 33–49. [Google Scholar] [CrossRef]
- Sih, G.C. Strain Energy density factor applied to mixed mode crack problems. Int. J. Fract. 1974, 10, 305–321. [Google Scholar] [CrossRef]
- Chang, J.; Xu, J.-Q.; Mutoh, Y. A general mixed-mode brittle fracture criterion for cracked materials. Eng. Fract. Mech. 2005, 73, 1249–1263. [Google Scholar] [CrossRef]
- Nuismer, R.J. An energy release rate criterion for mixed mode fracture. Int. J. Fract. 1975, 11, 245–250. [Google Scholar] [CrossRef]
- Ahmed, A. Extended Finite Element Method (XFEM) Modeling Arbitrary Discontinuities and Failure Analysis. Ph.D. Thesis, Università degli Studi di Pavia, Pavia, Italy, 2009. [Google Scholar]


| Type | Code Name | Void Depth |
|---|---|---|
| Standard lining | V0 | N/A |
| Unstrengthened lining | V1/4 | H/4 |
| V1/3 | H/3 | |
| V1/2 | H/2 | |
| V2/3 | 2H/3 | |
| Strengthened lining | R1/4 | H/4 |
| R1/3 | H/3 | |
| R1/2 | H/2 | |
| R2/3 | 2H/3 |
| Normal Stress/MPa | Shear Stress/MPa | di/mm | df/mm |
|---|---|---|---|
| 50 | 30 | 0.002 | 0.008 |
Disclaimer/Publisher’s Note: The statements, opinions and data contained in all publications are solely those of the individual author(s) and contributor(s) and not of MDPI and/or the editor(s). MDPI and/or the editor(s) disclaim responsibility for any injury to people or property resulting from any ideas, methods, instructions or products referred to in the content. |
© 2023 by the authors. Licensee MDPI, Basel, Switzerland. This article is an open access article distributed under the terms and conditions of the Creative Commons Attribution (CC BY) license (https://creativecommons.org/licenses/by/4.0/).
Share and Cite
Shao, S.; Wu, Y.; Fu, H.; Feng, S.; Zhang, J. Numerical Investigation on the Mechanical Properties of Vault Void Lining and Steel Plate Strengthening. Materials 2023, 16, 789. https://doi.org/10.3390/ma16020789
Shao S, Wu Y, Fu H, Feng S, Zhang J. Numerical Investigation on the Mechanical Properties of Vault Void Lining and Steel Plate Strengthening. Materials. 2023; 16(2):789. https://doi.org/10.3390/ma16020789
Chicago/Turabian StyleShao, Shuai, Yimin Wu, Helin Fu, Sheng Feng, and Jiawei Zhang. 2023. "Numerical Investigation on the Mechanical Properties of Vault Void Lining and Steel Plate Strengthening" Materials 16, no. 2: 789. https://doi.org/10.3390/ma16020789