
Pavement Performance Investigation of Asphalt Mixtures with Plastic and Basalt Fiber Composite (PB) Modifier and Their Applications in Urban Bus Lanes Using Statics Analysis
Abstract
:1. Introduction
2. Raw Materials and Experimental Methods
2.1. Raw Materials
2.1.1. Modifier PB
2.1.2. Aggregates and Mineral Filler
2.1.3. Asphalt
2.2. Gradation Design
2.2.1. Gradation Curve
2.2.2. Volumetric Properties of the Asphalt Mixtures
2.3. Test Methods
2.3.1. High-Temperature Stability Test
2.3.2. Low-Temperature Performance Test
2.3.3. Water Stability Test
2.3.4. Dynamic Modulus Test
3. Results and Discussion
3.1. High-Temperature Stability
3.1.1. Wheel-Tracking Test Results
3.1.2. Dynamic Creep Test Results
3.2. Low-Temperature Crack Resistance
3.3. Water Damage Stability
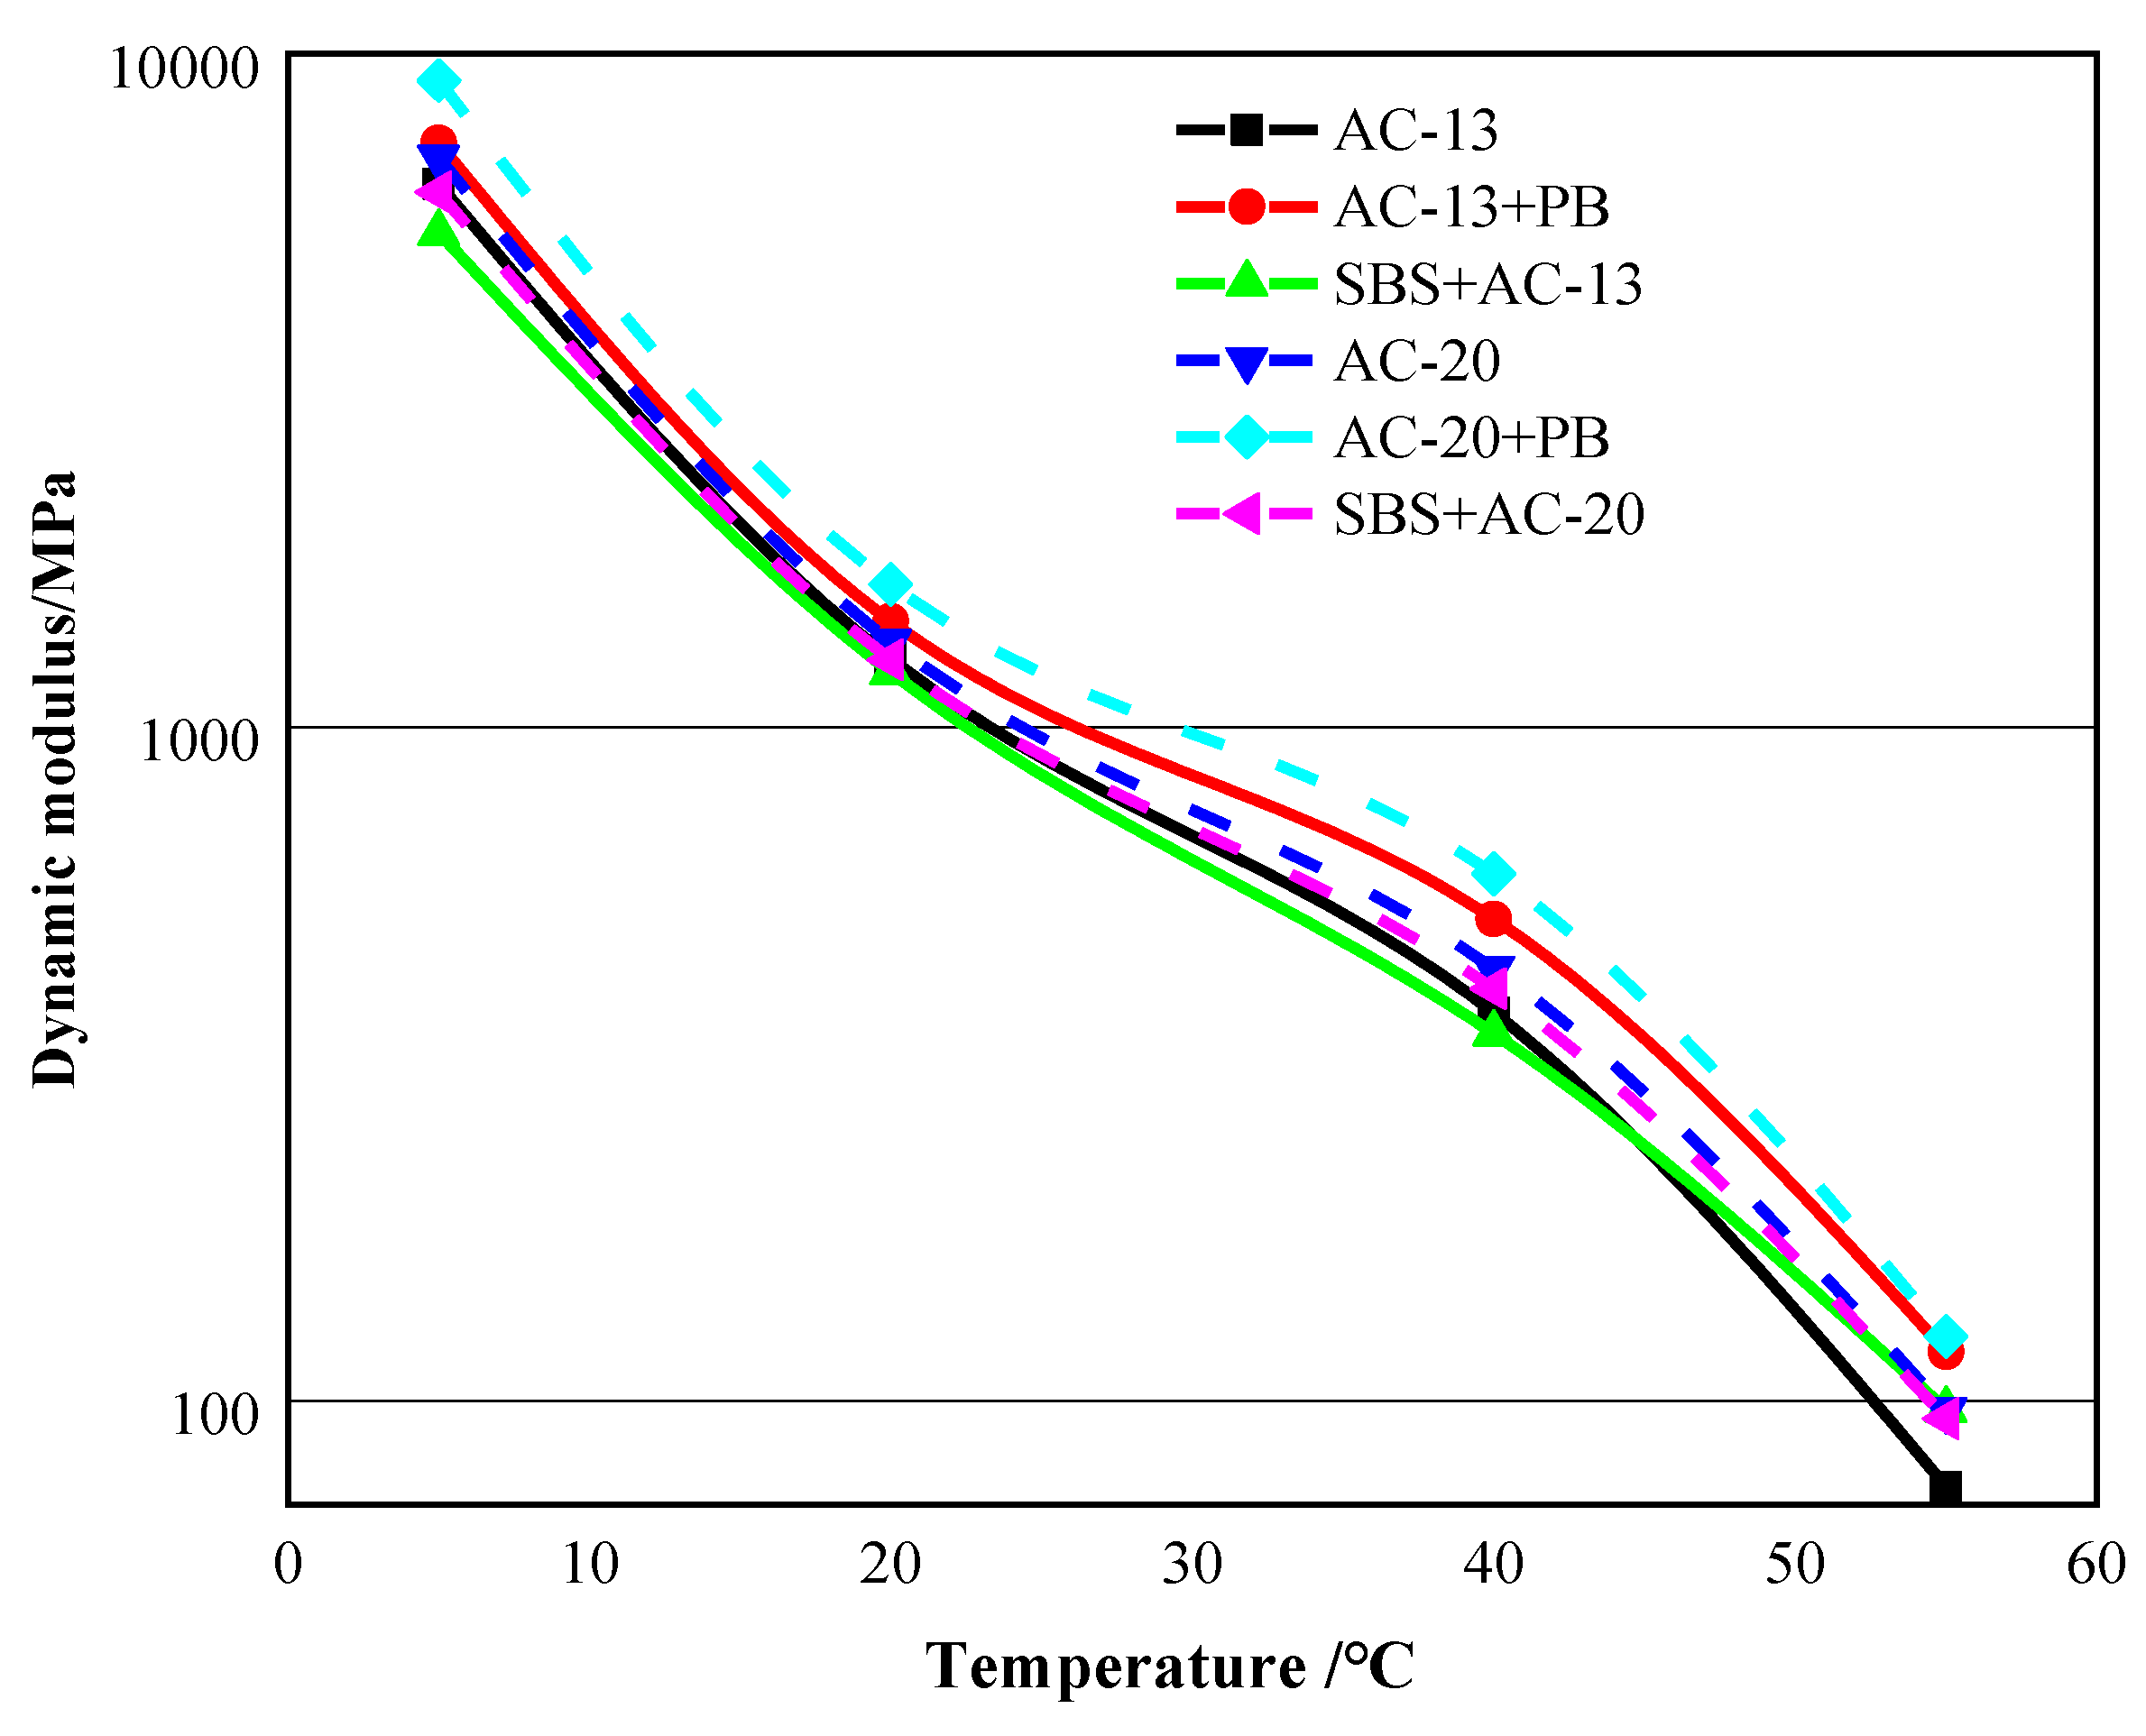
3.4. Dynamic Modulus
4. Statics Analysis of the Pavement Structure of Bus Lane
4.1. Pavement Structure Design of the Bus Lane
4.2. Material Parameters
4.3. Load Determination
4.4. Model Establishing
4.5. Statics Simulation Results
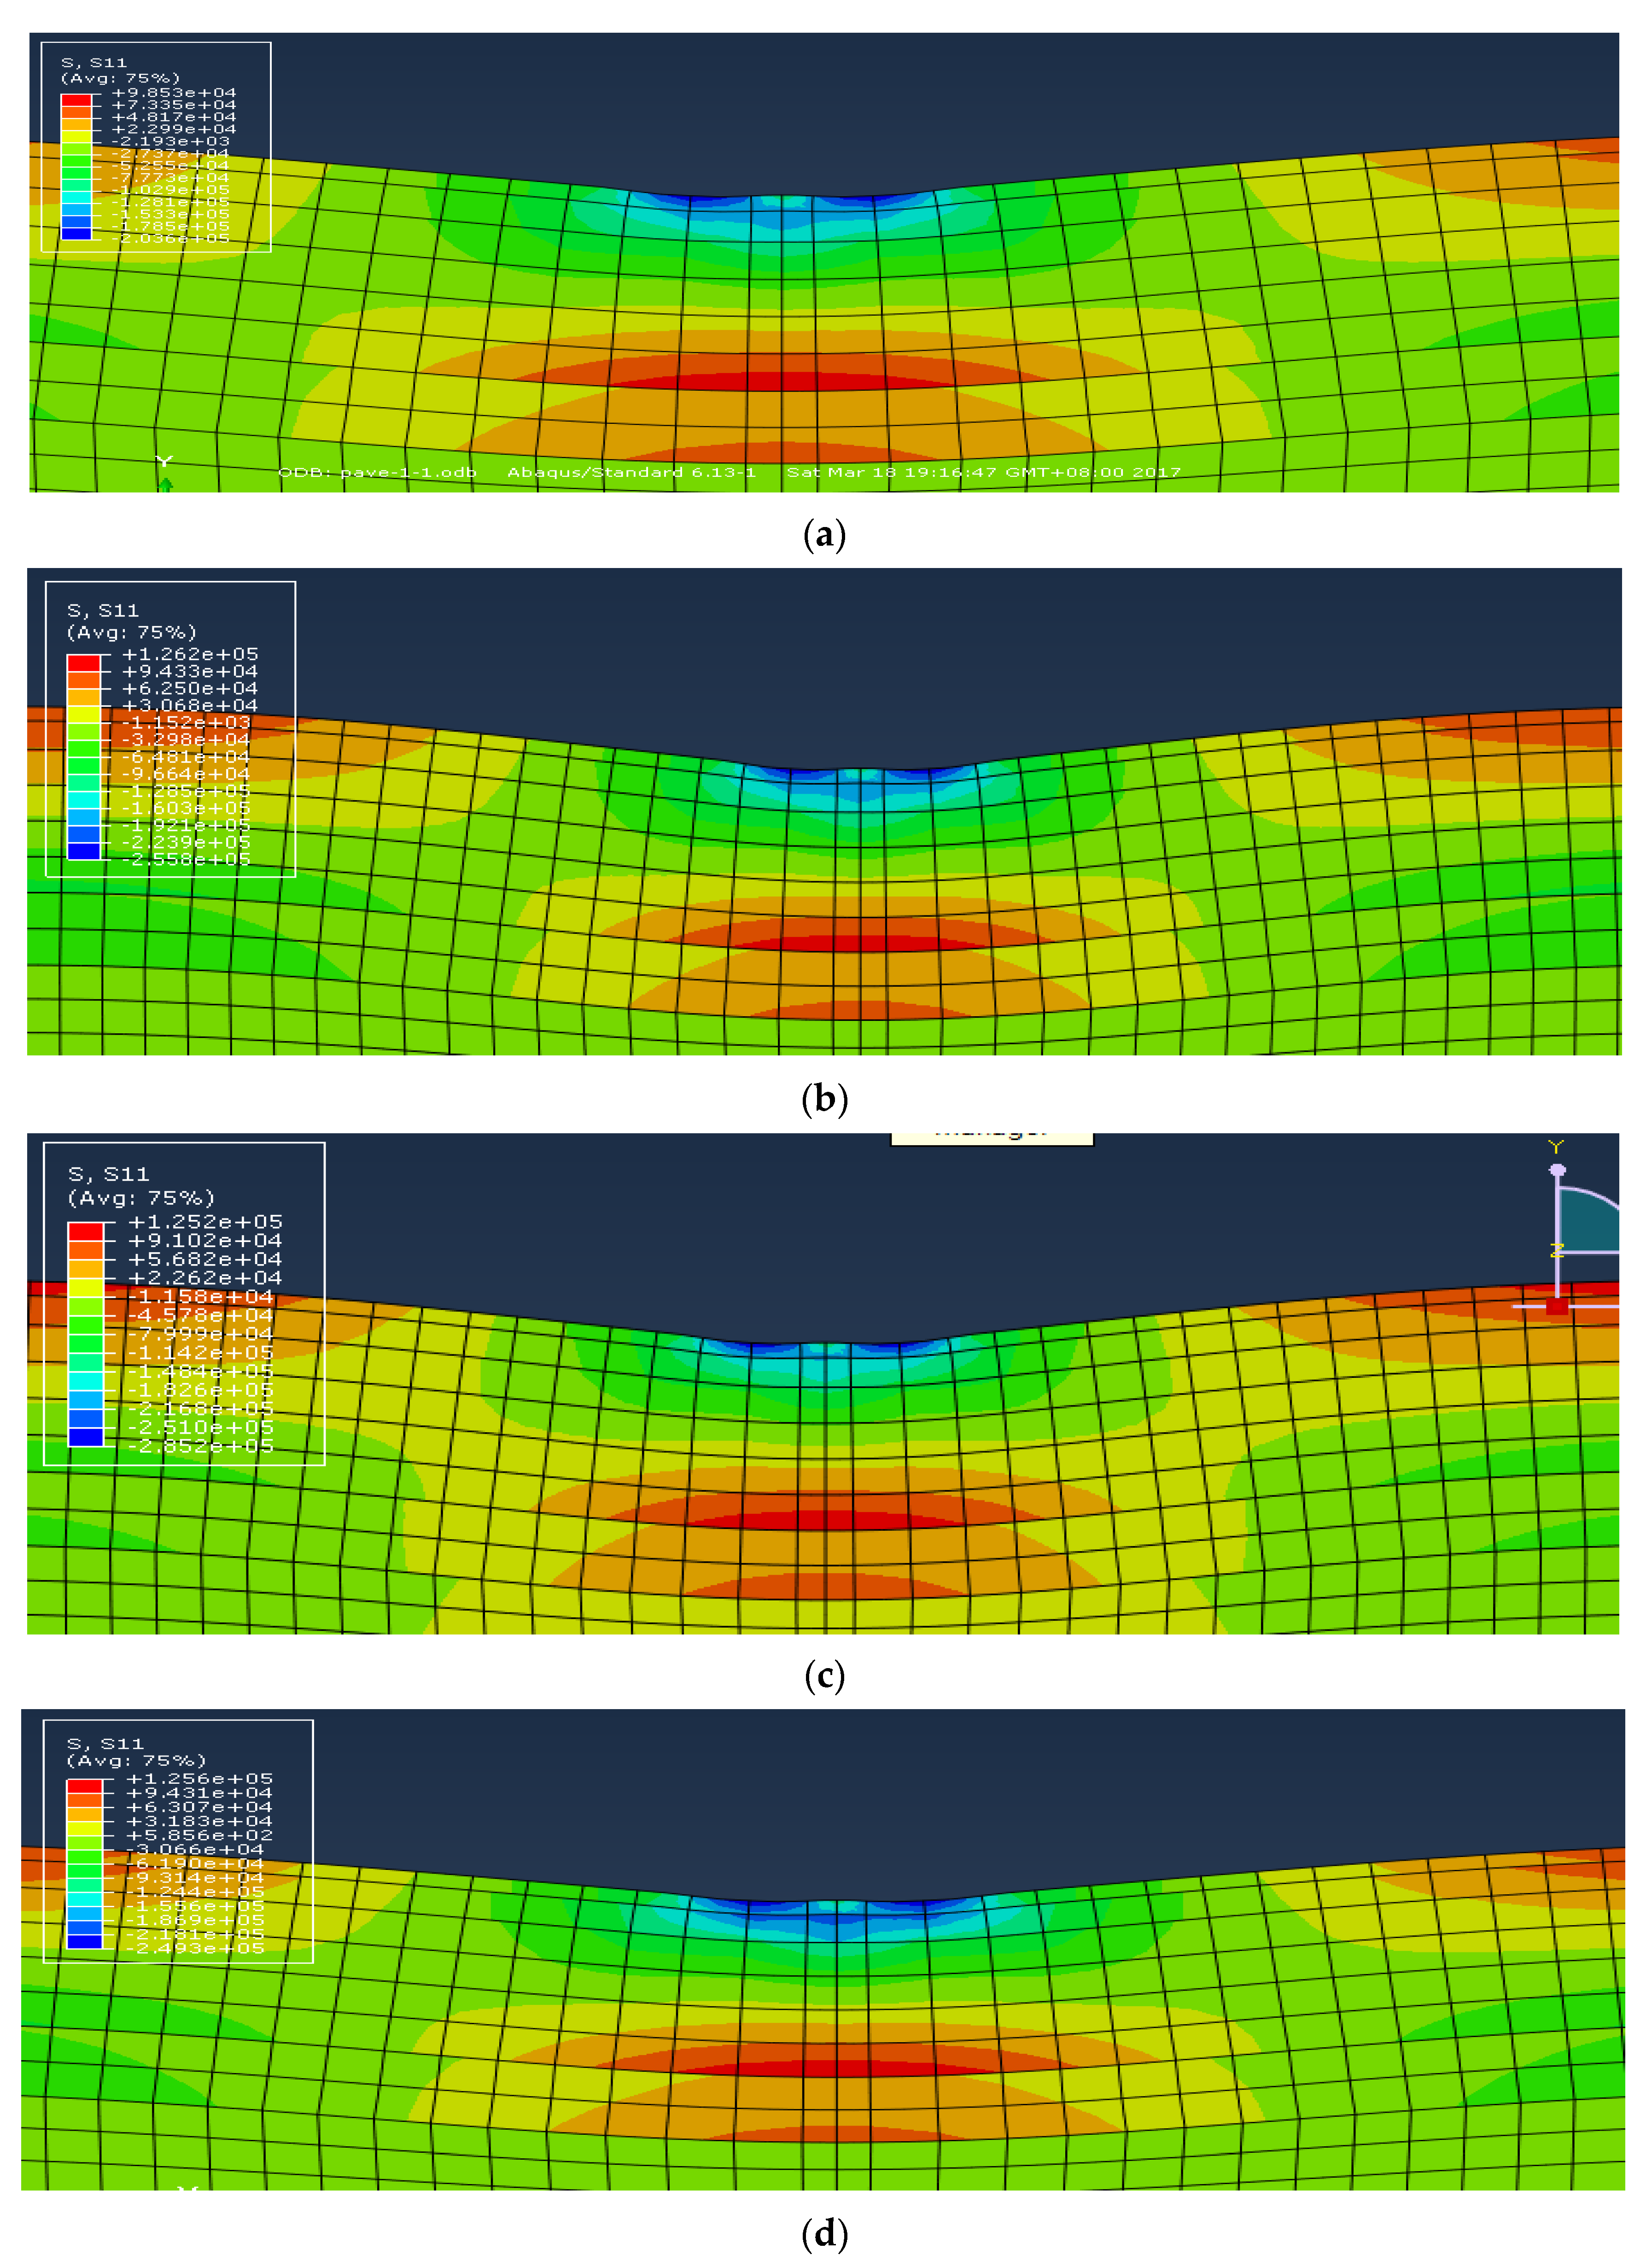
4.5.1. Tensile Stress Distribution
4.5.2. Vertical Deformation
5. Conclusions
- (1)
- Adding PB modifier can improve the dynamic modulus and high-temperature stability remarkably and reduce the creep rate of asphalt mixtures, presenting a superior high-temperature stability that is even better than SBS-modified asphalt mixtures.
- (2)
- By combining with basalt fiber, the PB modifier can compensate for the adverse effect on the low-temperature crack resistance of mixtures caused by the addition of waste plastics.
- (3)
- The PB modifier can not only improve the anti-water damage performance indexes of the residual stability and tensile strength ratio of mixtures, but can also strengthen the absolute values of the strengths, presenting a better water damage resistance.
- (4)
- The actual axle load of a bus will cause severe tensile stress and vertical deformation compared with the standard axle load. Using PB-modified asphalt layers for bus lanes can offset the negative impact caused by a heavy axle load. Using PB-modified asphalt mixtures for both the surface layer and binder layer (designed structure III) presents the best strengthen function.
Author Contributions
Funding
Institutional Review Board Statement
Informed Consent Statement
Data Availability Statement
Acknowledgments
Conflicts of Interest
References
- Available online: https://www.sohu.com/a/256941519_748407 (accessed on 6 December 2022).
- Chen, Y.; Chen, G.; Wu, K. Evaluation of performance of bus lanes on urban expressway using paramics micro-simulation model. Procedia Eng. 2016, 137, 523–530. [Google Scholar] [CrossRef] [Green Version]
- Ben-Dor, G.; Ben-Eliab, E.; Benensona, I. Assessing the impacts of dedicated bus lanes on urban traffic congestion and modal split with an agent-based model. Procedia Comput. Sci. 2018, 130, 824–829. [Google Scholar] [CrossRef]
- Wei, S.; Zheng, W.; Wang, L. Understanding the configuration of bus networks in urban China from the perspective of network types and administrative division effect. Transp. Policy 2021, 104, 1–17. [Google Scholar] [CrossRef]
- Basso, L.; Guevara, C.; Gschwender, A.; Fuster, M. Congestion pricing, transit subsidies and dedicated bus lanes: Efficient and practical solutions to congestion. Transp. Policy 2011, 18, 676–684. [Google Scholar] [CrossRef]
- Hınıslıoğlu, S.; Ağar, E. Use of waste high density polyethylene as bitumen modifier in asphalt concrete mix. Mater. Lett. 2004, 58, 267–271. [Google Scholar] [CrossRef]
- Heydari, S.; Hajimohammadi, A.; Javadi, N.H.S.; Khalili, N. The use of plastic waste in asphalt: A critical review on asphalt mix design and Marshall properties. Constr. Build. Mater. 2021, 309, 125185. [Google Scholar] [CrossRef]
- Awoyera, P.; Adesina, A. Plastic wastes to construction products: Status, limitations and future perspective. Case Stud. Constr. Mater. 2020, 12, e00330. [Google Scholar] [CrossRef]
- EI-Naga, I.A.; Ragab, M. Benefits of utilization the recycle polyethylene terephthalate waste plastic materials as a modifier to asphalt mixtures. Constr. Build. Mater. 2019, 219, 81–90. [Google Scholar] [CrossRef]
- Yu, H.; Zhu, Z.; Zhang, Z.; Yu, J.; Oeser, M.; Wang, D. Recycling waste packaging tape into bituminous mixtures towards enhanced mechanical properties and environmental benefits. J. Clean. Prod. 2019, 229, 22–31. [Google Scholar] [CrossRef]
- Nouali, M.; Derriche, Z.; Ghorbel, E.; Chuanqiang, L. Plastic bag waste modified bitumen a possible solution to the Algerian road pavements. Road Mater. Pavement Des. 2020, 21, 1713–1725. [Google Scholar] [CrossRef]
- Ranieri, M.; Costa, L.; Oliveira, J.R.; Silva, H.M.; Celauro, C. Asphalt surface mixtures with improved performance using waste polymers via dry and wet processes. J. Mater. Civ. Eng. 2017, 29, 04017169. [Google Scholar] [CrossRef]
- Padhan, R.K.; Mohanta, C.; Sreeram, A.; Gupta, A. Rheological evaluation of bitumen modified using antistripping additives synthesised from waste polyethylene terephthalate (PET). Int. J. Pavement Eng. 2020, 21, 1083–1091. [Google Scholar] [CrossRef]
- Shahane, H.A.; Bhosale, S.S. E-Waste plastic powder modified bitumen: Rheological properties and performance study of bituminous concrete. Road Mater. Pavement Des. 2019, 22, 682–702. [Google Scholar] [CrossRef]
- Dalhat, M.; Wahhab, H.A.-A. Performance of recycled plastic waste modified asphalt binder in Saudi Arabia. Int. J. Pavement Eng. 2017, 18, 349–357. [Google Scholar] [CrossRef]
- Joohari, I.B.; Giustozzi, F. Chemical and high-temperature rheological properties of recycled plastics-polymer modified hybrid bitumen. J. Clean. Prod. 2020, 276, 123064. [Google Scholar] [CrossRef]
- Abed, M.A.; Al-Tameemi, A.F.; Abed, A.H.; Wang, Y. Direct tensile test evaluation and characterization for mechanical and rheological properties of polymer modified hot mix asphalt concrete. Polym. Compos. 2022, 43, 6381–6388. [Google Scholar] [CrossRef]
- Cheng, Y.; Han, H.; Fang, C.; Li, H.; Huang, Z.; Su, J. Preparation and properties of nano-CaCO3/waste polyethylene/styrene-butadiene-styrene block polymer-modified asphalt. Polym. Compos. 2020, 41, 614–623. [Google Scholar] [CrossRef]
- Chakartnarodom, P.; Prakaypan, W.; Ineurec, P.; Chuankrerkkul, N.; Laitila, E.A.; Kongkajun, N. Properties and performance of the basalt-fiber reinforced texture roof tiles. Case Stud. Constr. Mater. 2020, 13, e00444. [Google Scholar] [CrossRef]
- Wang, W.; Zhu, J.; Cheng, X.; Liu, S.; Jiang, D.; Wang, W. Numerical simulation of strength of basalt fiber permeable concrete based on CT technology. Case Stud. Constr. Mater. 2022, 17, e01348. [Google Scholar] [CrossRef]
- Xie, T.; Wang, L. Optimize the design by evaluating the performance of asphalt mastic reinforced with different basalt fiber lengths and contents. Constr. Build. Mater. 2023, 363, 129698. [Google Scholar] [CrossRef]
- Celauro, C.; Praticò, F. Asphalt mixtures modified with basalt fibres for surface courses. Constr. Build. Mater. 2018, 170, 245–253. [Google Scholar] [CrossRef]
- Hui, Y.; Men, G.; Xiao, P.; Tang, Q.; Han, F.; Kang, A.; Wu, Z. Recent advances in basalt fiber reinforced asphalt mixture for pavement applications. Materials 2022, 15, 6826. [Google Scholar] [CrossRef] [PubMed]
- Wang, S.; Kang, A.; Xiao, P.; Li, B.; Fu, W. Investigating the effects of chopped basalt fiber on the performance of porous asphalt mixture. Adv. Mater. Sci. Eng. 2019, 2019, 2323761. [Google Scholar] [CrossRef] [Green Version]
- Cheng, Y.; Yu, D.; Gong, Y.; Zhu, C.; Tao, J.; Wang, W. Laboratory evaluation on performance of eco-friendly basalt fiber and diatomite compound modified asphalt mixture. Materials 2018, 11, 2400. [Google Scholar] [CrossRef] [Green Version]
- Lou, K.; Kang, A.; Xiao, P.; Wu, Z.; Li, B.; Wang, X. Effects of basalt fiber coated with different sizing agents on performance and microstructures of asphalt mixture. Constr. Build. Mater. 2021, 266, 121155. [Google Scholar] [CrossRef]
- Zhu, C.; Luo, H.; Tian, W.; Teng, B.; Qian, Y.; Ai, H.; Xiao, B. Investigation on Fatigue Performance of Diatomite/Basalt Fiber Composite Modified Asphalt Mixture. Polymers 2022, 14, 414. [Google Scholar] [CrossRef]
- Lou, K.; Xiao, P.; Kang, A.; Wu, Z.; Li, B.; Lu, P. Performance evaluation and adaptability optimization of hot mix asphalt reinforced by mixed lengths basalt fibers. Constr. Build. Mater. 2021, 292, 123373. [Google Scholar] [CrossRef]
- Wang, W.; Cheng, Y.; Tan, G. Design optimization of SBS-modified asphalt mixture reinforced with eco-friendly basalt fiber based on response surface methodology. Materials 2018, 11, 1311. [Google Scholar] [CrossRef] [Green Version]
- Li, Z.; Shen, A.; Wang, H. Effect of basalt fiber on the low-temperature performance of an asphalt mixture in a heavily frozen area. Constr. Build. Mater. 2020, 253, 119080. [Google Scholar] [CrossRef]
- Zhang, C.; Shi, F.; Cao, P. The fracture toughness analysis on the basalt fiber reinforced asphalt concrete with prenotched three-point bending beam test. Case Stud. Constr. Mater. 2022, 16, e01079. [Google Scholar] [CrossRef]
- Zhang, X.; Liu, J. Viscoelastic creep properties and mesostructure modeling of basalt fiber-reinforced asphalt concrete. Constr. Build. Mater. 2020, 259, 119680. [Google Scholar] [CrossRef]
- T/CHTS 10016-2019; Technical Guideline for Construction of Asphalt Pavement with Basalt Fibe. China Communications Press Co., Ltd.: Beijing, China, 2019. (In Chinese)
- DB32/T 3710-2020; Standard specification for construction of Asphalt Pavement with Basalt Fiber. Jiangsu Market Supervision and Administration Bureau: Beijing, China, 2020. (In Chinese)
- JTG F40; Technical Specification for Construction of Highway Asphalt Pavements. Occupation Standard of the People’s Republic of China: Beijing, China, 2004.
- JTG E20; Standard Test Methods of Bitumen and Bituminous Mixtures for Highway Engineering. Occupation Standard of the People’s Republic of China: Beijing, China, 2011.
- Ruan, L.; Luo, R.; Hu, X.D.; Pan, P. Effect of bell-shaped loading and haversine loading on the dynamic modulus and resilient modulus of asphalt mixture. Constr. Build. Mater. 2018, 161, 124–131. [Google Scholar] [CrossRef]
- Zhao, Y.; Pan, Y. Study on loading frequency distribution and changes with in asphalt pavements. J. Chang. Commun. Univ. 2007, 23, 7–10+17. (In Chinese) [Google Scholar]
- Polasik, J.; Waluś, K.J.; Warguł, Ł. Experimental studies of the size contact area of a summer tire as a function of pressure and the load. Procedia Eng. 2017, 177, 347–351. [Google Scholar] [CrossRef]
- Abinaya, L.; Thilagam, A.; Nivitha, M. Influence of tire pressure on the rutting and fatigue life of bituminous pavement. Sadhana-Acad. Proc. Eng. Sci. 2022, 47, 71. [Google Scholar] [CrossRef]


| Resin | Polythene (PE) | Ethylene Vinyl Acetate Copolymer (EVA) | Coupling Agent | Auxiliary | Melting Point/°C |
|---|---|---|---|---|---|
| 10~20% | 65~75% | 10% | 2% | 3% | 90~100 |
| Index | Fracture Strength/MPa | Elongation at Break/% | Elastic Modulus/GPa |
|---|---|---|---|
| Value | 2500–5000 | 2.69 | 90–110 |
| Requirements in T/CHTS 10016 | ≥2000 | ≥2.1 | ≥80 |
| Project | Appearance | Particle Size/mm | Length/mm | Density/g·cm−3 |
|---|---|---|---|---|
| PB | External colorless transparent, internal brown, flat solid particles | 2.5~3.5 | 6 | 1.82~1.86 |
| Index Items | Index Results | Index Requirements | |
|---|---|---|---|
| Apparent density (g/cm3) | 2.714 | ≥2.50 | |
| Water content (%) | 0.38 | ≤1.0 | |
| Appearance | No clumps | No clumps | |
| Water affinity coefficient | 0.60 | <1 | |
| Size range (%) | <0.6 mm | 100 | 100 |
| <0.15 mm | 100 | 90–100 | |
| <0.075 mm | 92.2 | 75–100 | |
| Properties | Penetration (25 °C)/0.1 mm | Penetration Index PI | Softening Point /°C | Ductility (5 cm/min)/cm | Viscosity (135 °C)/Pa·s |
|---|---|---|---|---|---|
| Base asphalt | 71.2 | −0.8 | 47.1 | 150 (15 °C) | 0.92 |
| SBS-modified asphalt | 67 | 0.3 | 78 | 48 (5 °C) | 1.8 |
| Types of mixture | Optimum Asphalt Content (OAC)/% | Air Voids (VV)/% | Voids in Mineral Aggregate (VMA)/% | Voids Filled with Asphalt (VFA)/% | Marshall Stability/kN | Flow Value/0.1 mm |
|---|---|---|---|---|---|---|
| Base asphalt + AC-13 | 5.0 | 4.1 | 14.2 | 71.1 | 9.5 | 29.8 |
| Base asphalt + AC-13 + PB | 5.4 | 4.4 | 15.3 | 71.1 | 12.5 | 24.2 |
| SBS-modified asphalt + AC-13 | 5.0 | 4.3 | 15.0 | 71.6 | 12.0 | 26.4 |
| Base asphalt + AC-20 | 4.4 | 4.3 | 13.5 | 67.9 | 11.5 | 32.4 |
| Base asphalt + AC-20 + PB | 4.7 | 4.7 | 14.3 | 66.7 | 13.5 | 28.6 |
| SBS-modified asphalt + AC-20 | 4.4 | 4.4 | 13.5 | 67.5 | 12.4 | 30.7 |
| Structure Sheaf | Material | Density/kg·m−3 | Modulus/MPa | Poisson Ratio |
|---|---|---|---|---|
| Surface layer | AC-13 + SBS | 2360 | 1207 | 0.30 |
| AC-13 + 0.6% PB | 2360 | 1438 | 0.30 | |
| Binder layer | AC-20 | 2450 | 1340 | 0.30 |
| AC-20 + SBS | 2450 | 1260 | 0.30 | |
| AC-20 + 0.6% PB | 2450 | 1630 | 0.30 | |
| Base course | Cement-stabilized gravel | 2200 | 1500 | 0.20 |
| Sub-base | 12% lime soil | 2100 | 550 | 0.30 |
| Soil base | soil | 1800 | 45 | 0.40 |
| Index | Length/mm | Width/mm | Height/mm | Curb Weight/kg | Full Quality/kg | Tire Ground Pressure/MPa |
|---|---|---|---|---|---|---|
| Parameter | 12,000 | 2550 | 3120 | 11,200 | 17,500 | 0.83 |
| Parameter | Tire Ground Pressure/MPa | Axle Load /kN | Equivalent Circle Radius/cm | Line Load /N·m−1 |
|---|---|---|---|---|
| Standard axle load | 0.7 | 100 | 10.65 | 117,371 |
| Actual bus axle load | 0.83 | 130 | 11.16 | 145,740 |
Disclaimer/Publisher’s Note: The statements, opinions and data contained in all publications are solely those of the individual author(s) and contributor(s) and not of MDPI and/or the editor(s). MDPI and/or the editor(s) disclaim responsibility for any injury to people or property resulting from any ideas, methods, instructions or products referred to in the content. |
© 2023 by the authors. Licensee MDPI, Basel, Switzerland. This article is an open access article distributed under the terms and conditions of the Creative Commons Attribution (CC BY) license (https://creativecommons.org/licenses/by/4.0/).
Share and Cite
Jiu, X.; Xiao, P.; Li, B.; Wang, Y.; Kang, A. Pavement Performance Investigation of Asphalt Mixtures with Plastic and Basalt Fiber Composite (PB) Modifier and Their Applications in Urban Bus Lanes Using Statics Analysis. Materials 2023, 16, 770. https://doi.org/10.3390/ma16020770
Jiu X, Xiao P, Li B, Wang Y, Kang A. Pavement Performance Investigation of Asphalt Mixtures with Plastic and Basalt Fiber Composite (PB) Modifier and Their Applications in Urban Bus Lanes Using Statics Analysis. Materials. 2023; 16(2):770. https://doi.org/10.3390/ma16020770
Chicago/Turabian StyleJiu, Xueyang, Peng Xiao, Bo Li, Yu Wang, and Aihong Kang. 2023. "Pavement Performance Investigation of Asphalt Mixtures with Plastic and Basalt Fiber Composite (PB) Modifier and Their Applications in Urban Bus Lanes Using Statics Analysis" Materials 16, no. 2: 770. https://doi.org/10.3390/ma16020770