
Comparison of Standardized Methods for Determining the Diffusion Coefficient of Chloride in Concrete with Thermodynamic Model of Migration


Abstract
:1. Introduction
Significance
2. Materials
3. Experimental Investigation
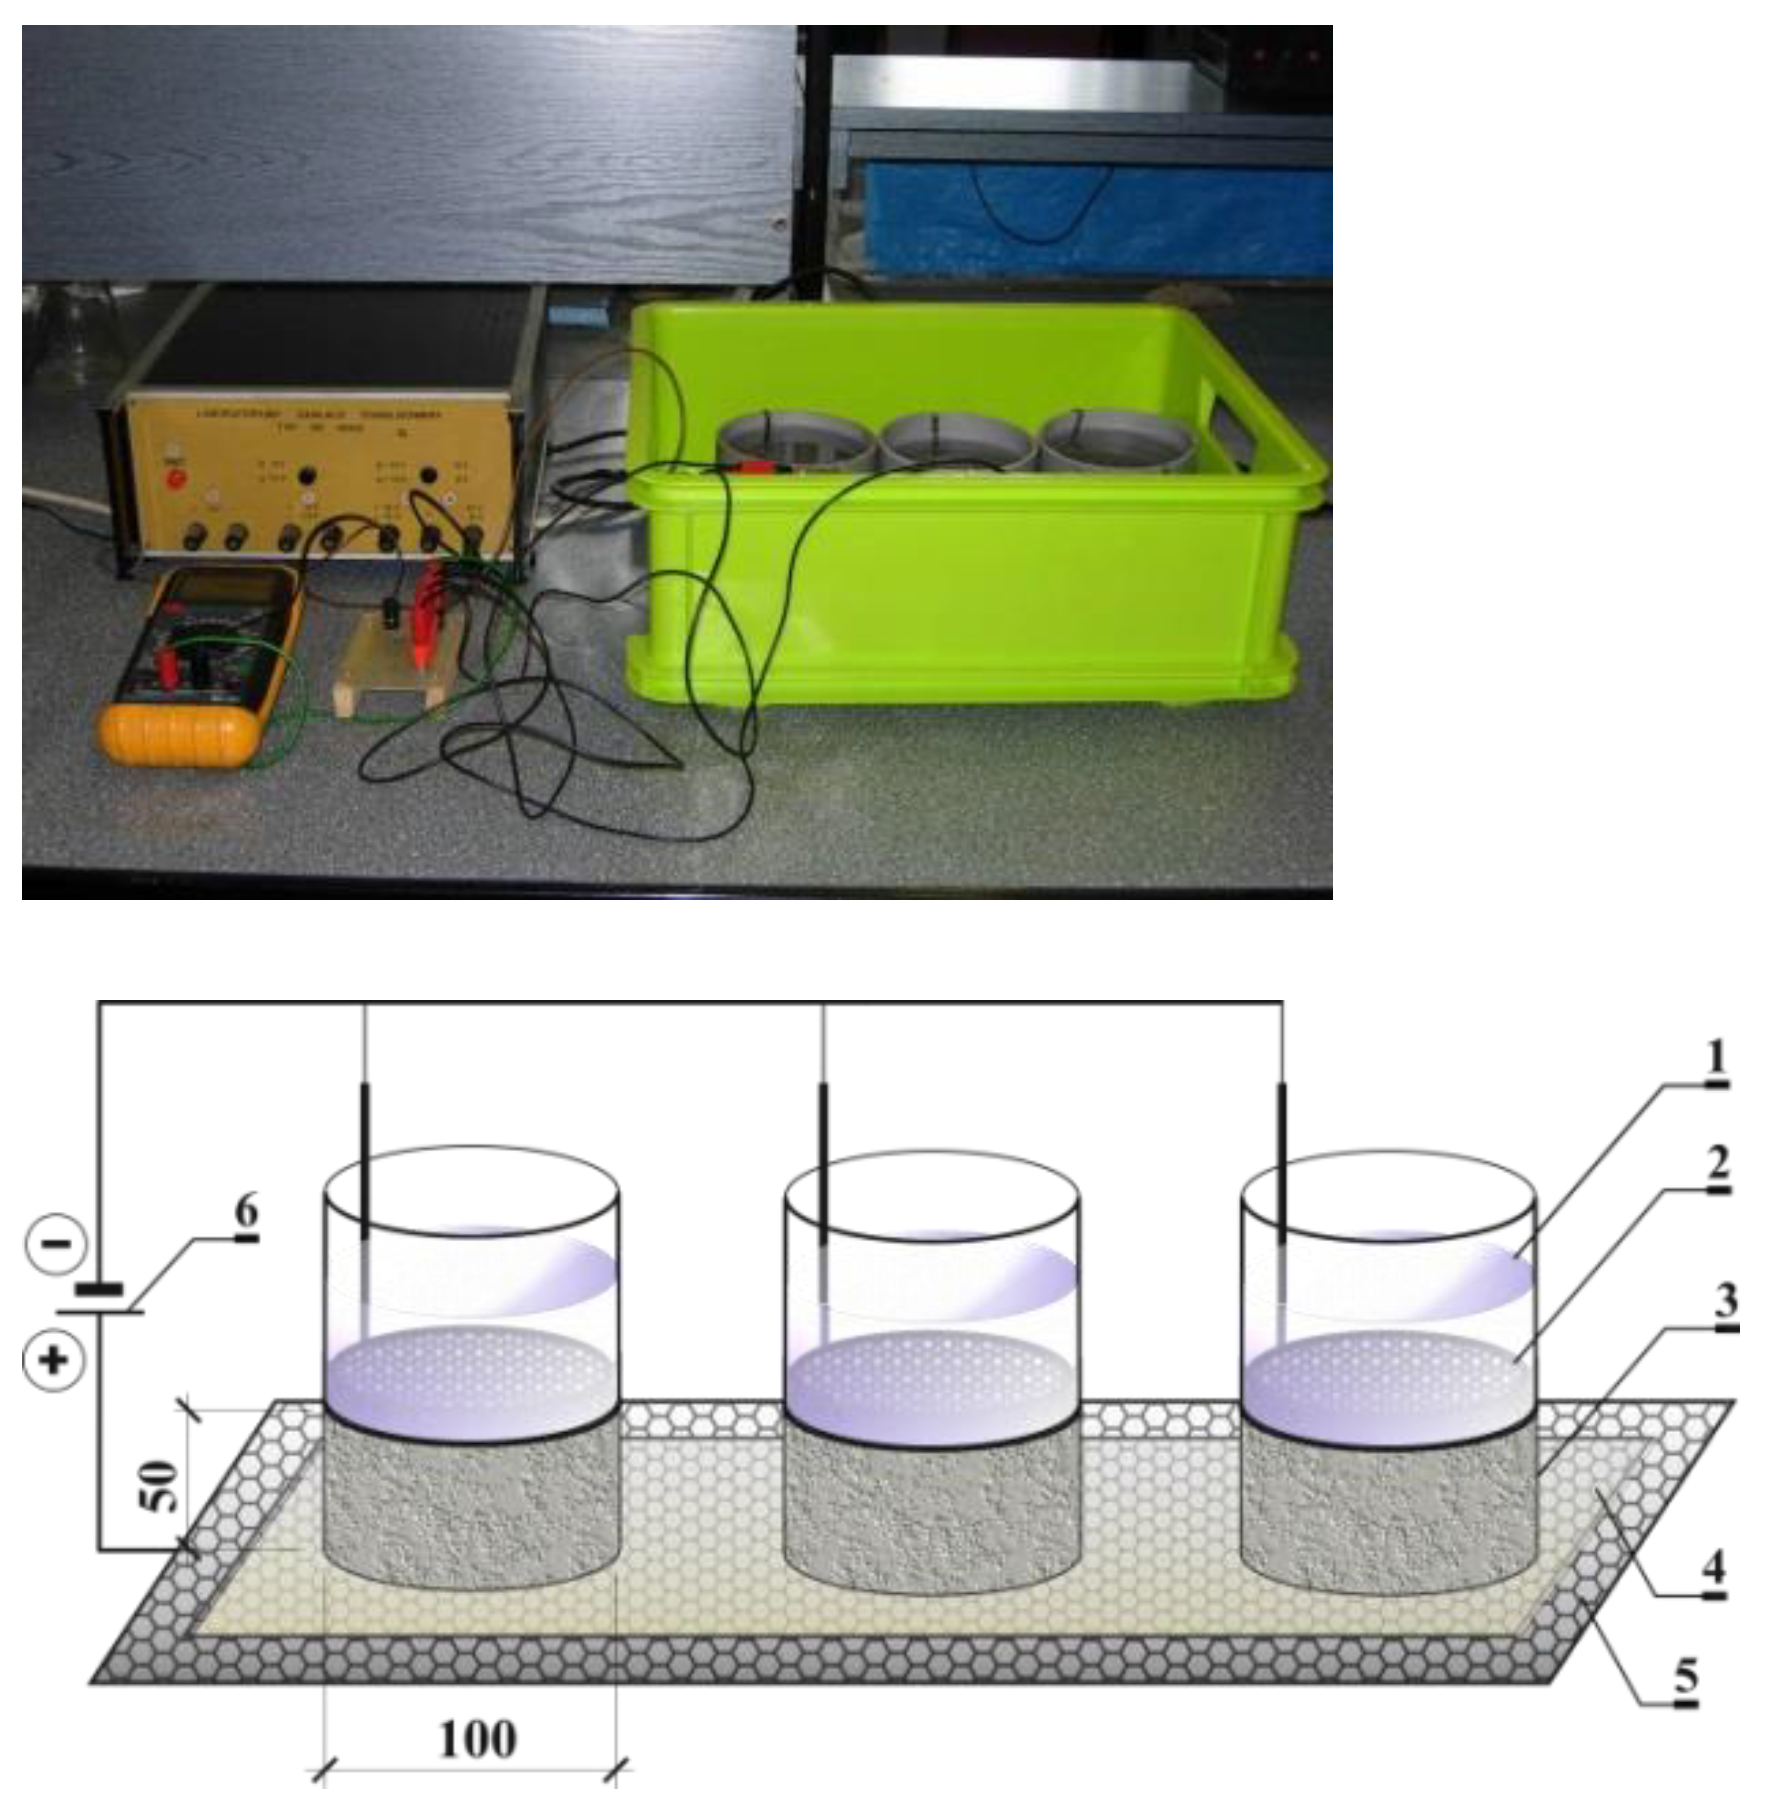
3.1. Permeability of Chloride Ions According to the American Standard ASTM C1202
3.2. Permeability of Chloride Ions According to the Norwegian NT Standard BUILD 492
3.2.1. Test Method
3.2.2. Determination of the Migration Coefficient
3.2.3. Determination of the Migration Coefficient
3.2.4. Determination of the Diffusion Coefficient
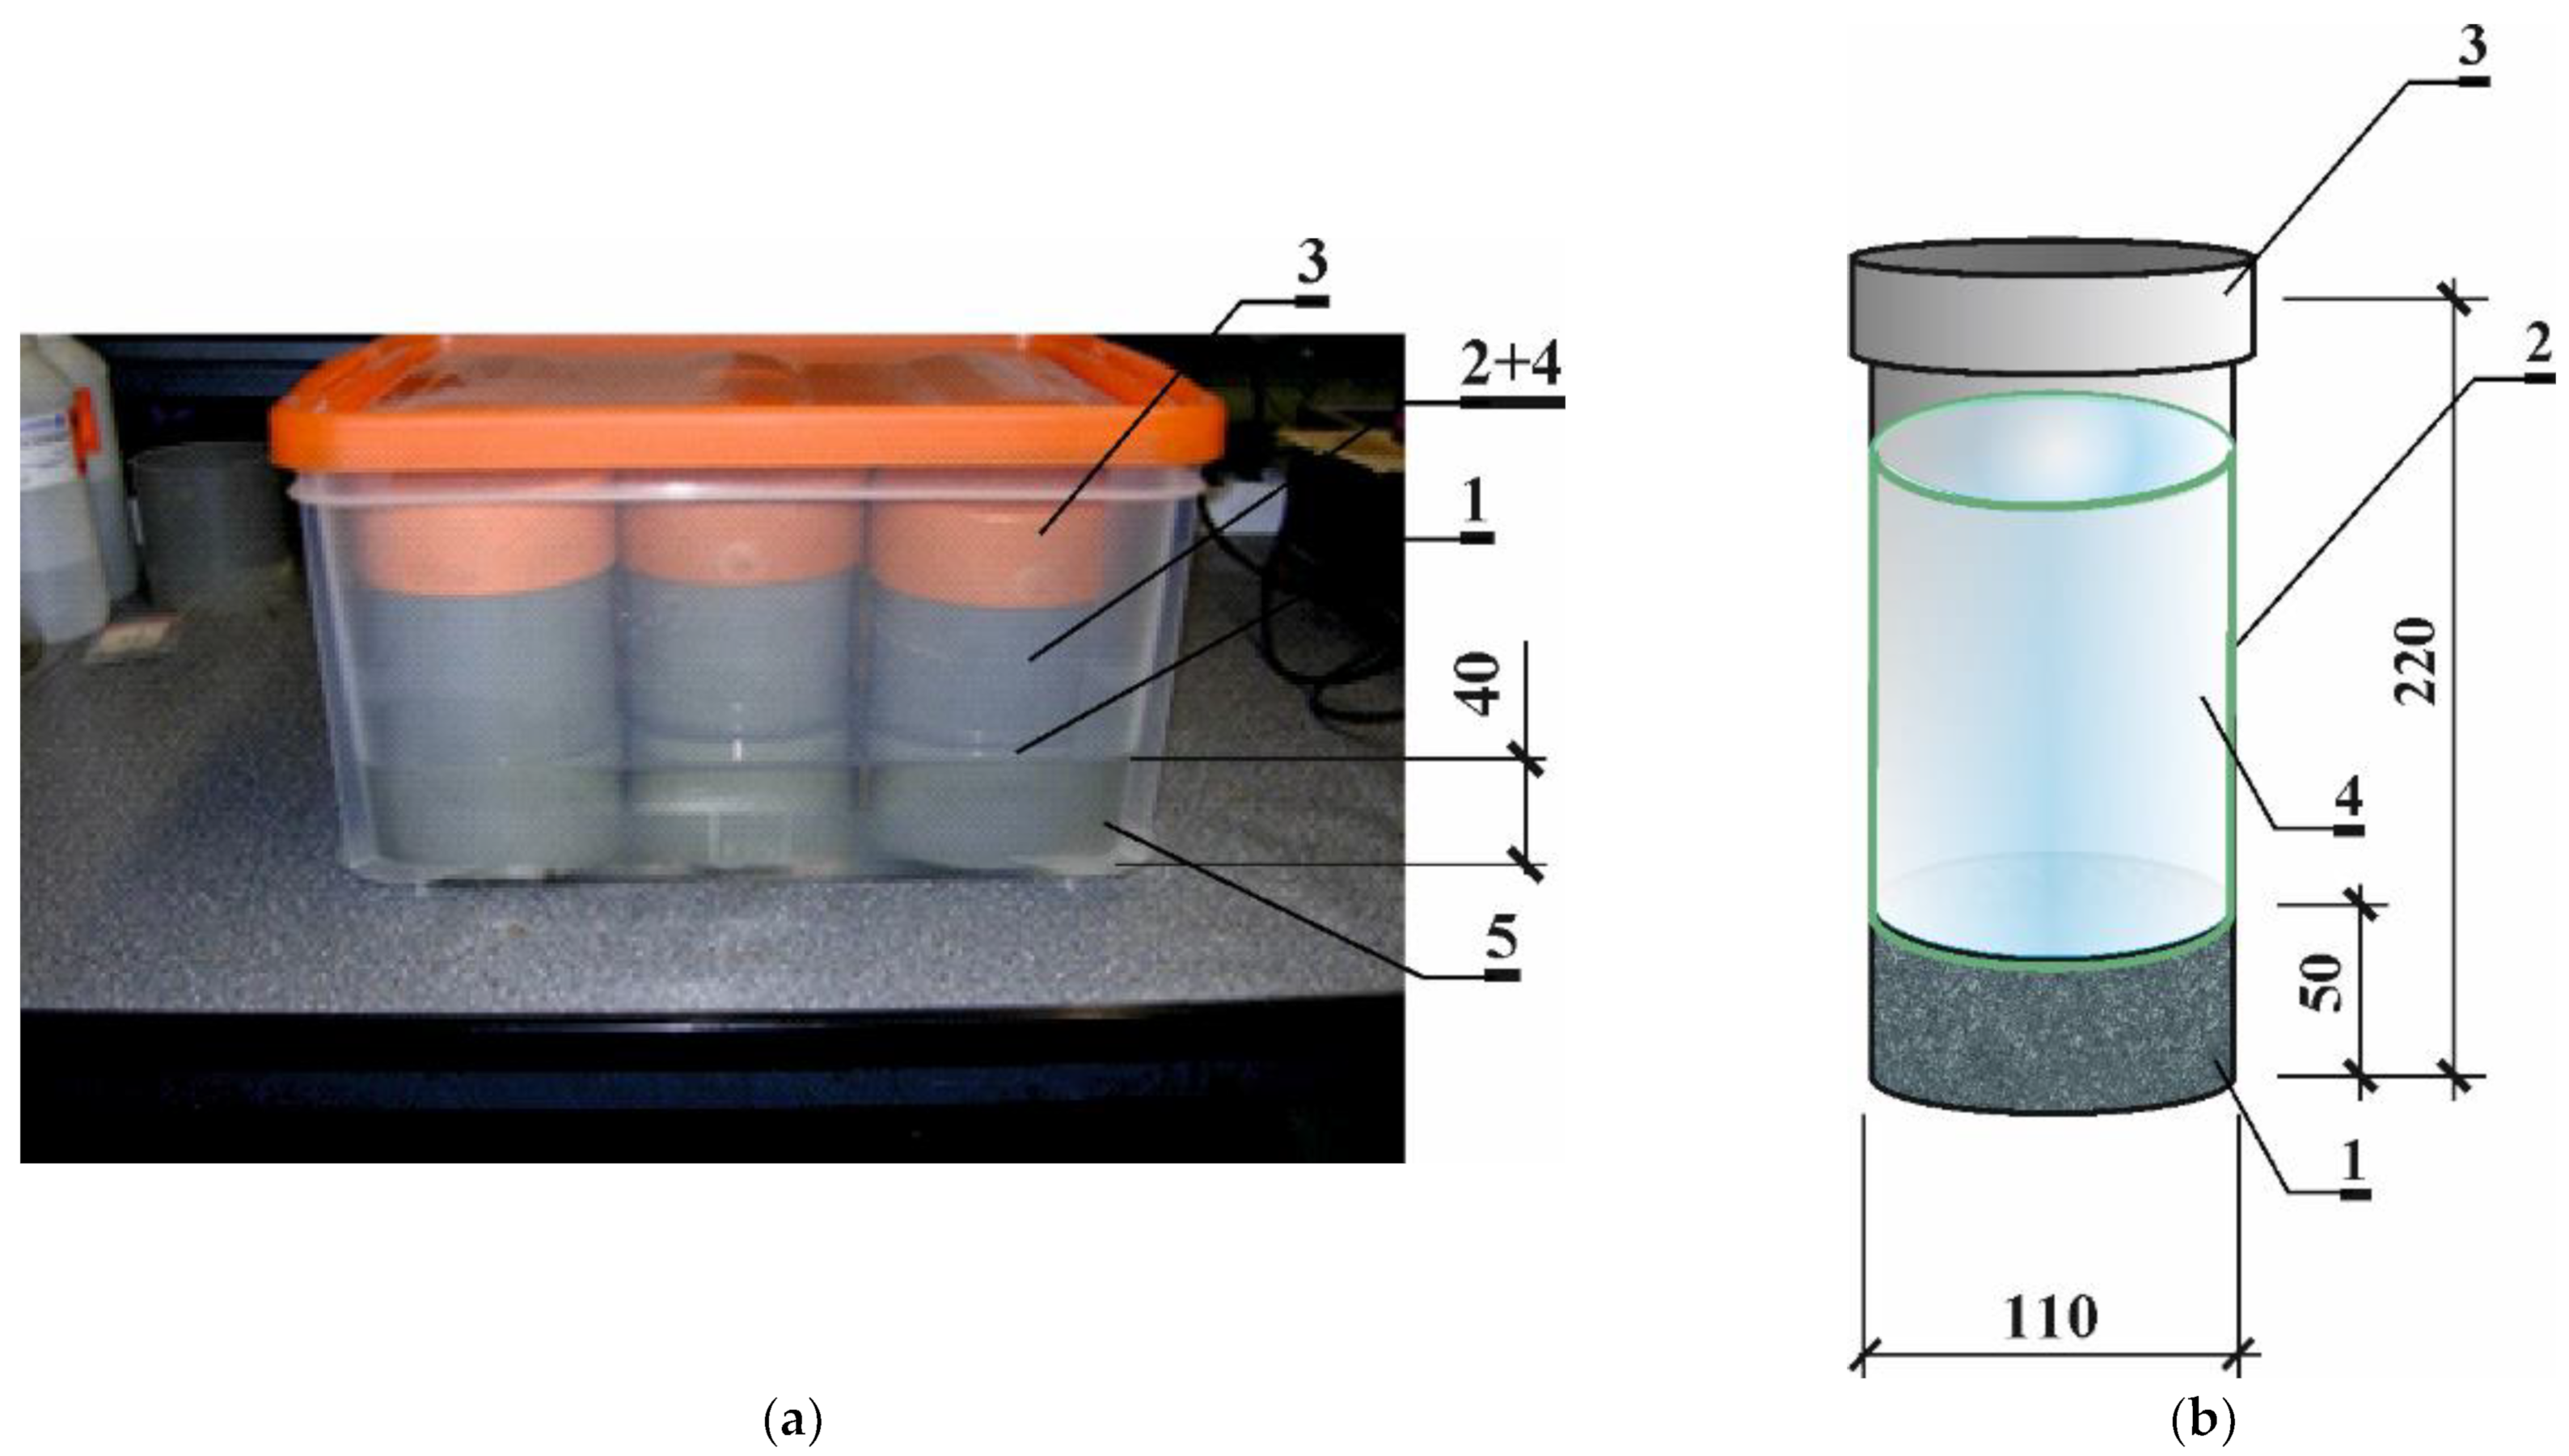
3.3. Permeability of Chloride Ions According to Norwegian Standard NT BUILD 443 and American Standard ASTM 1556
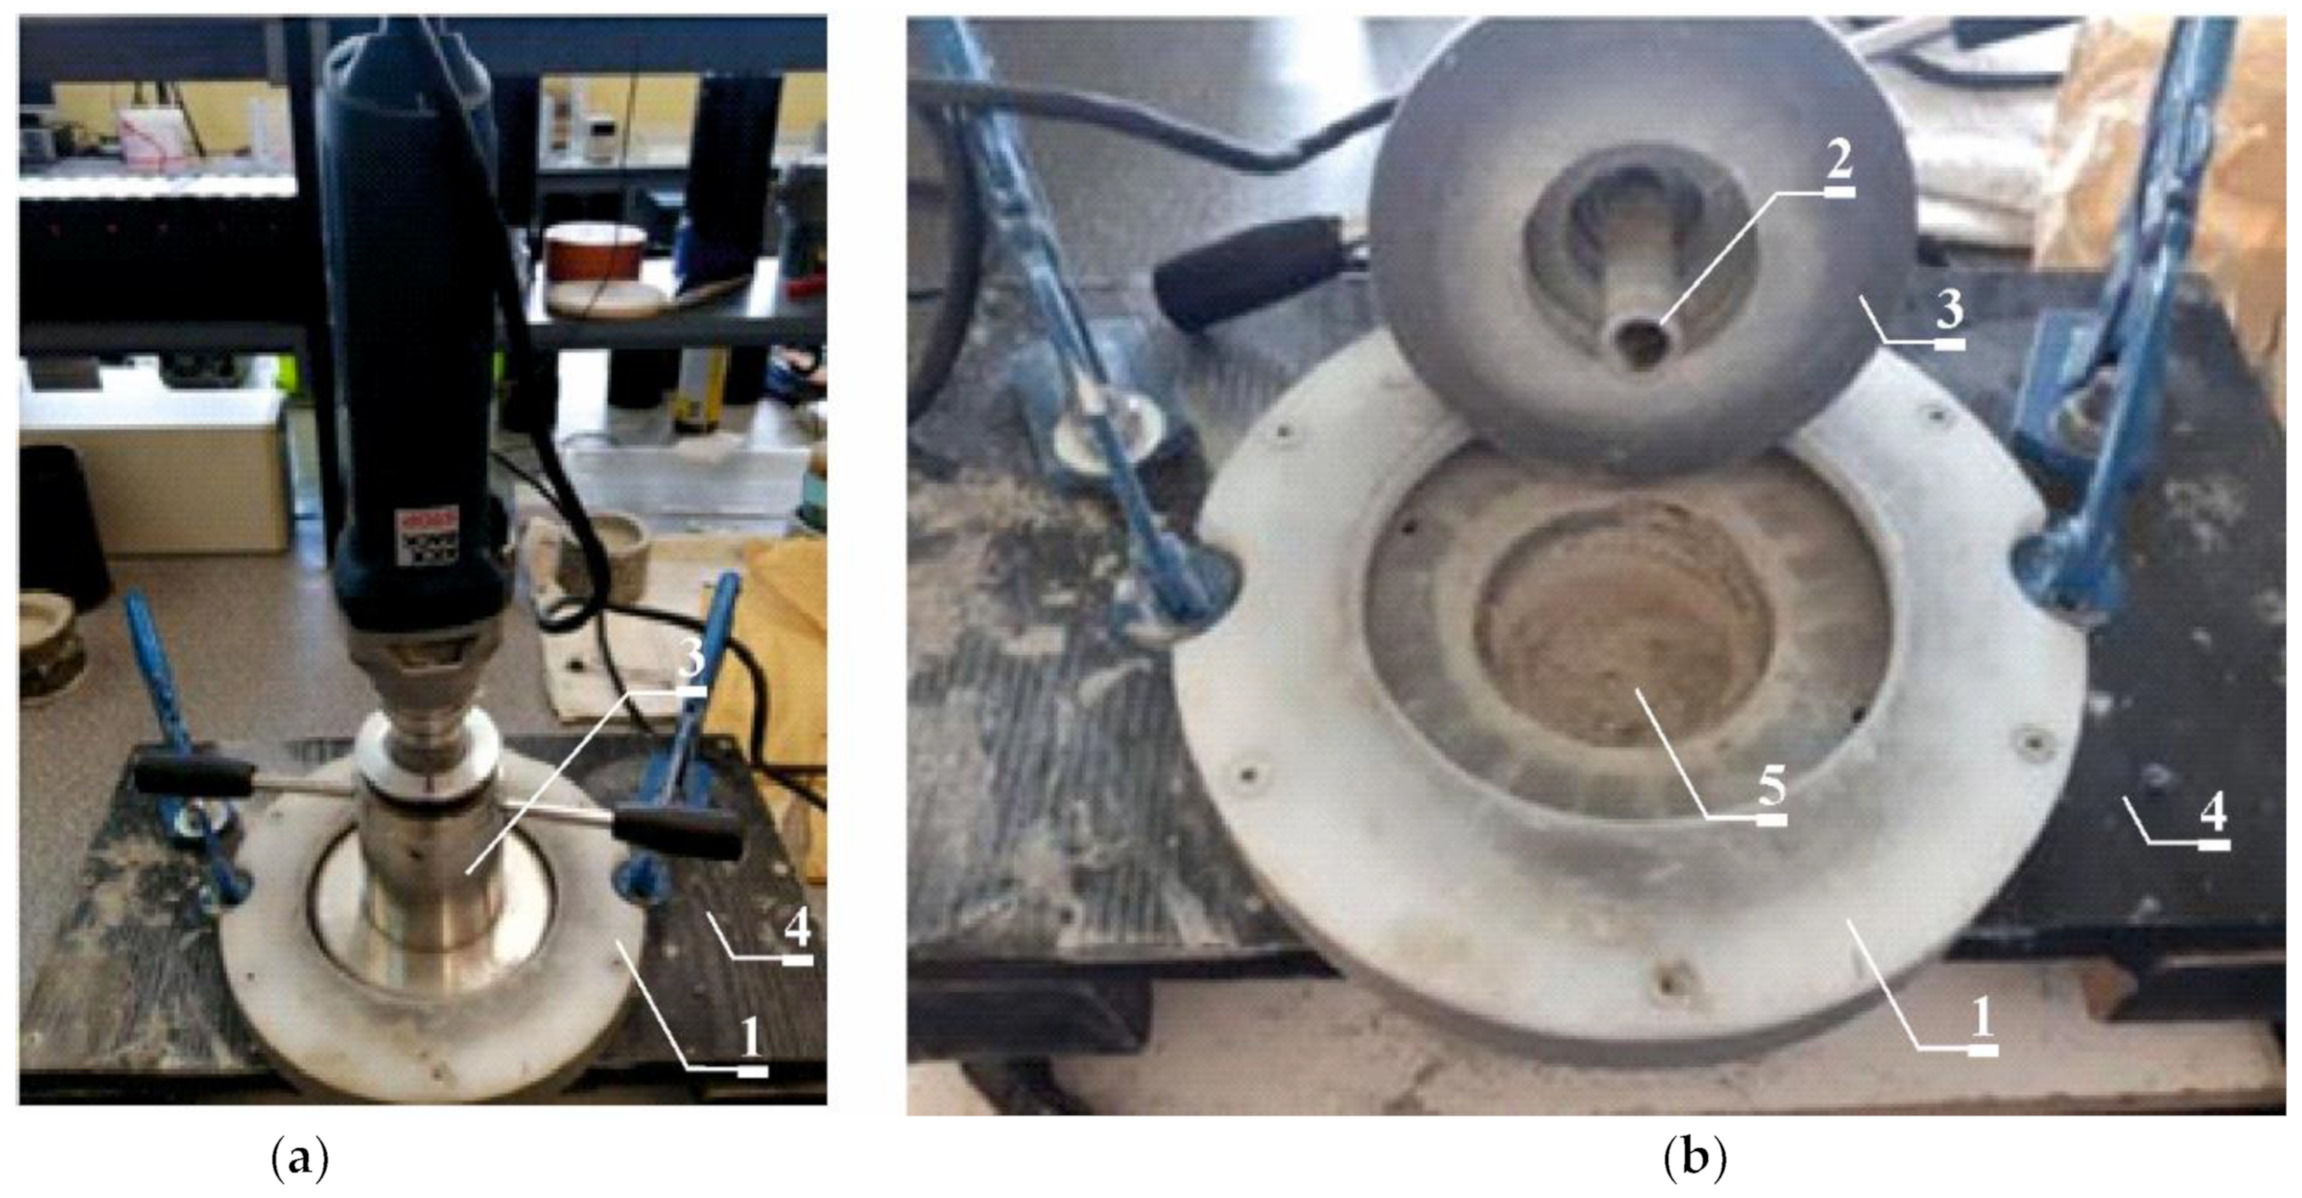
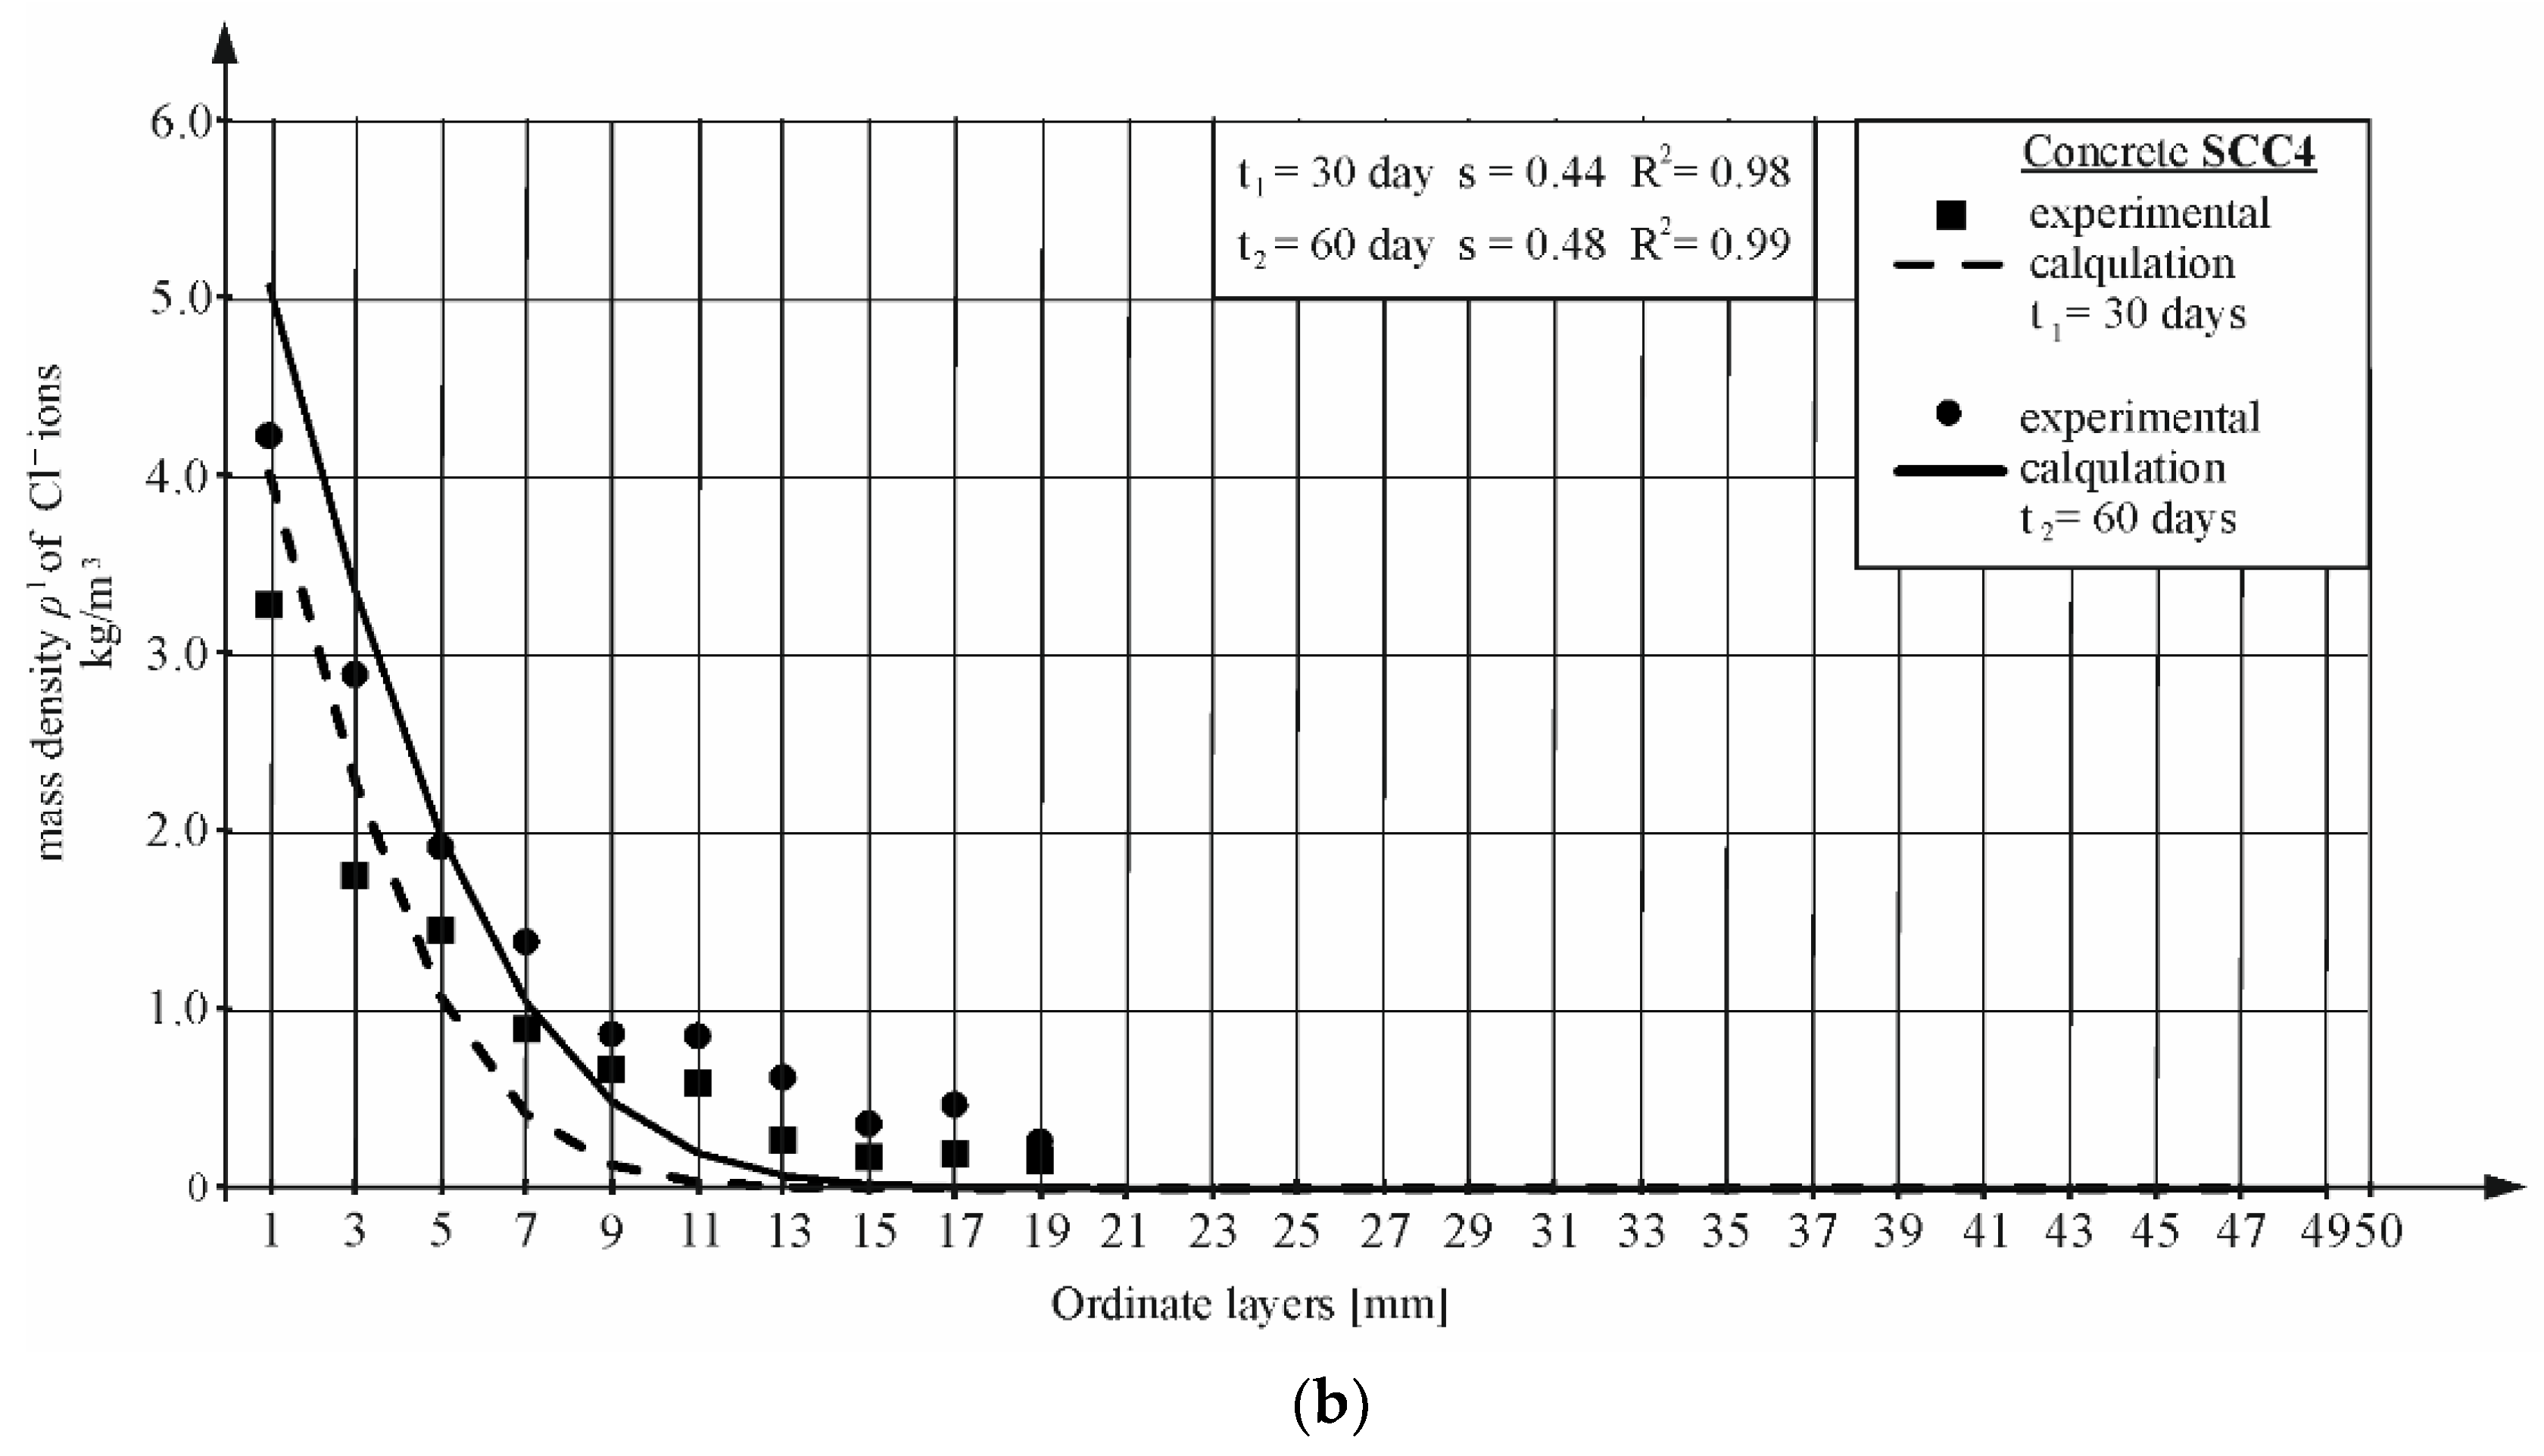
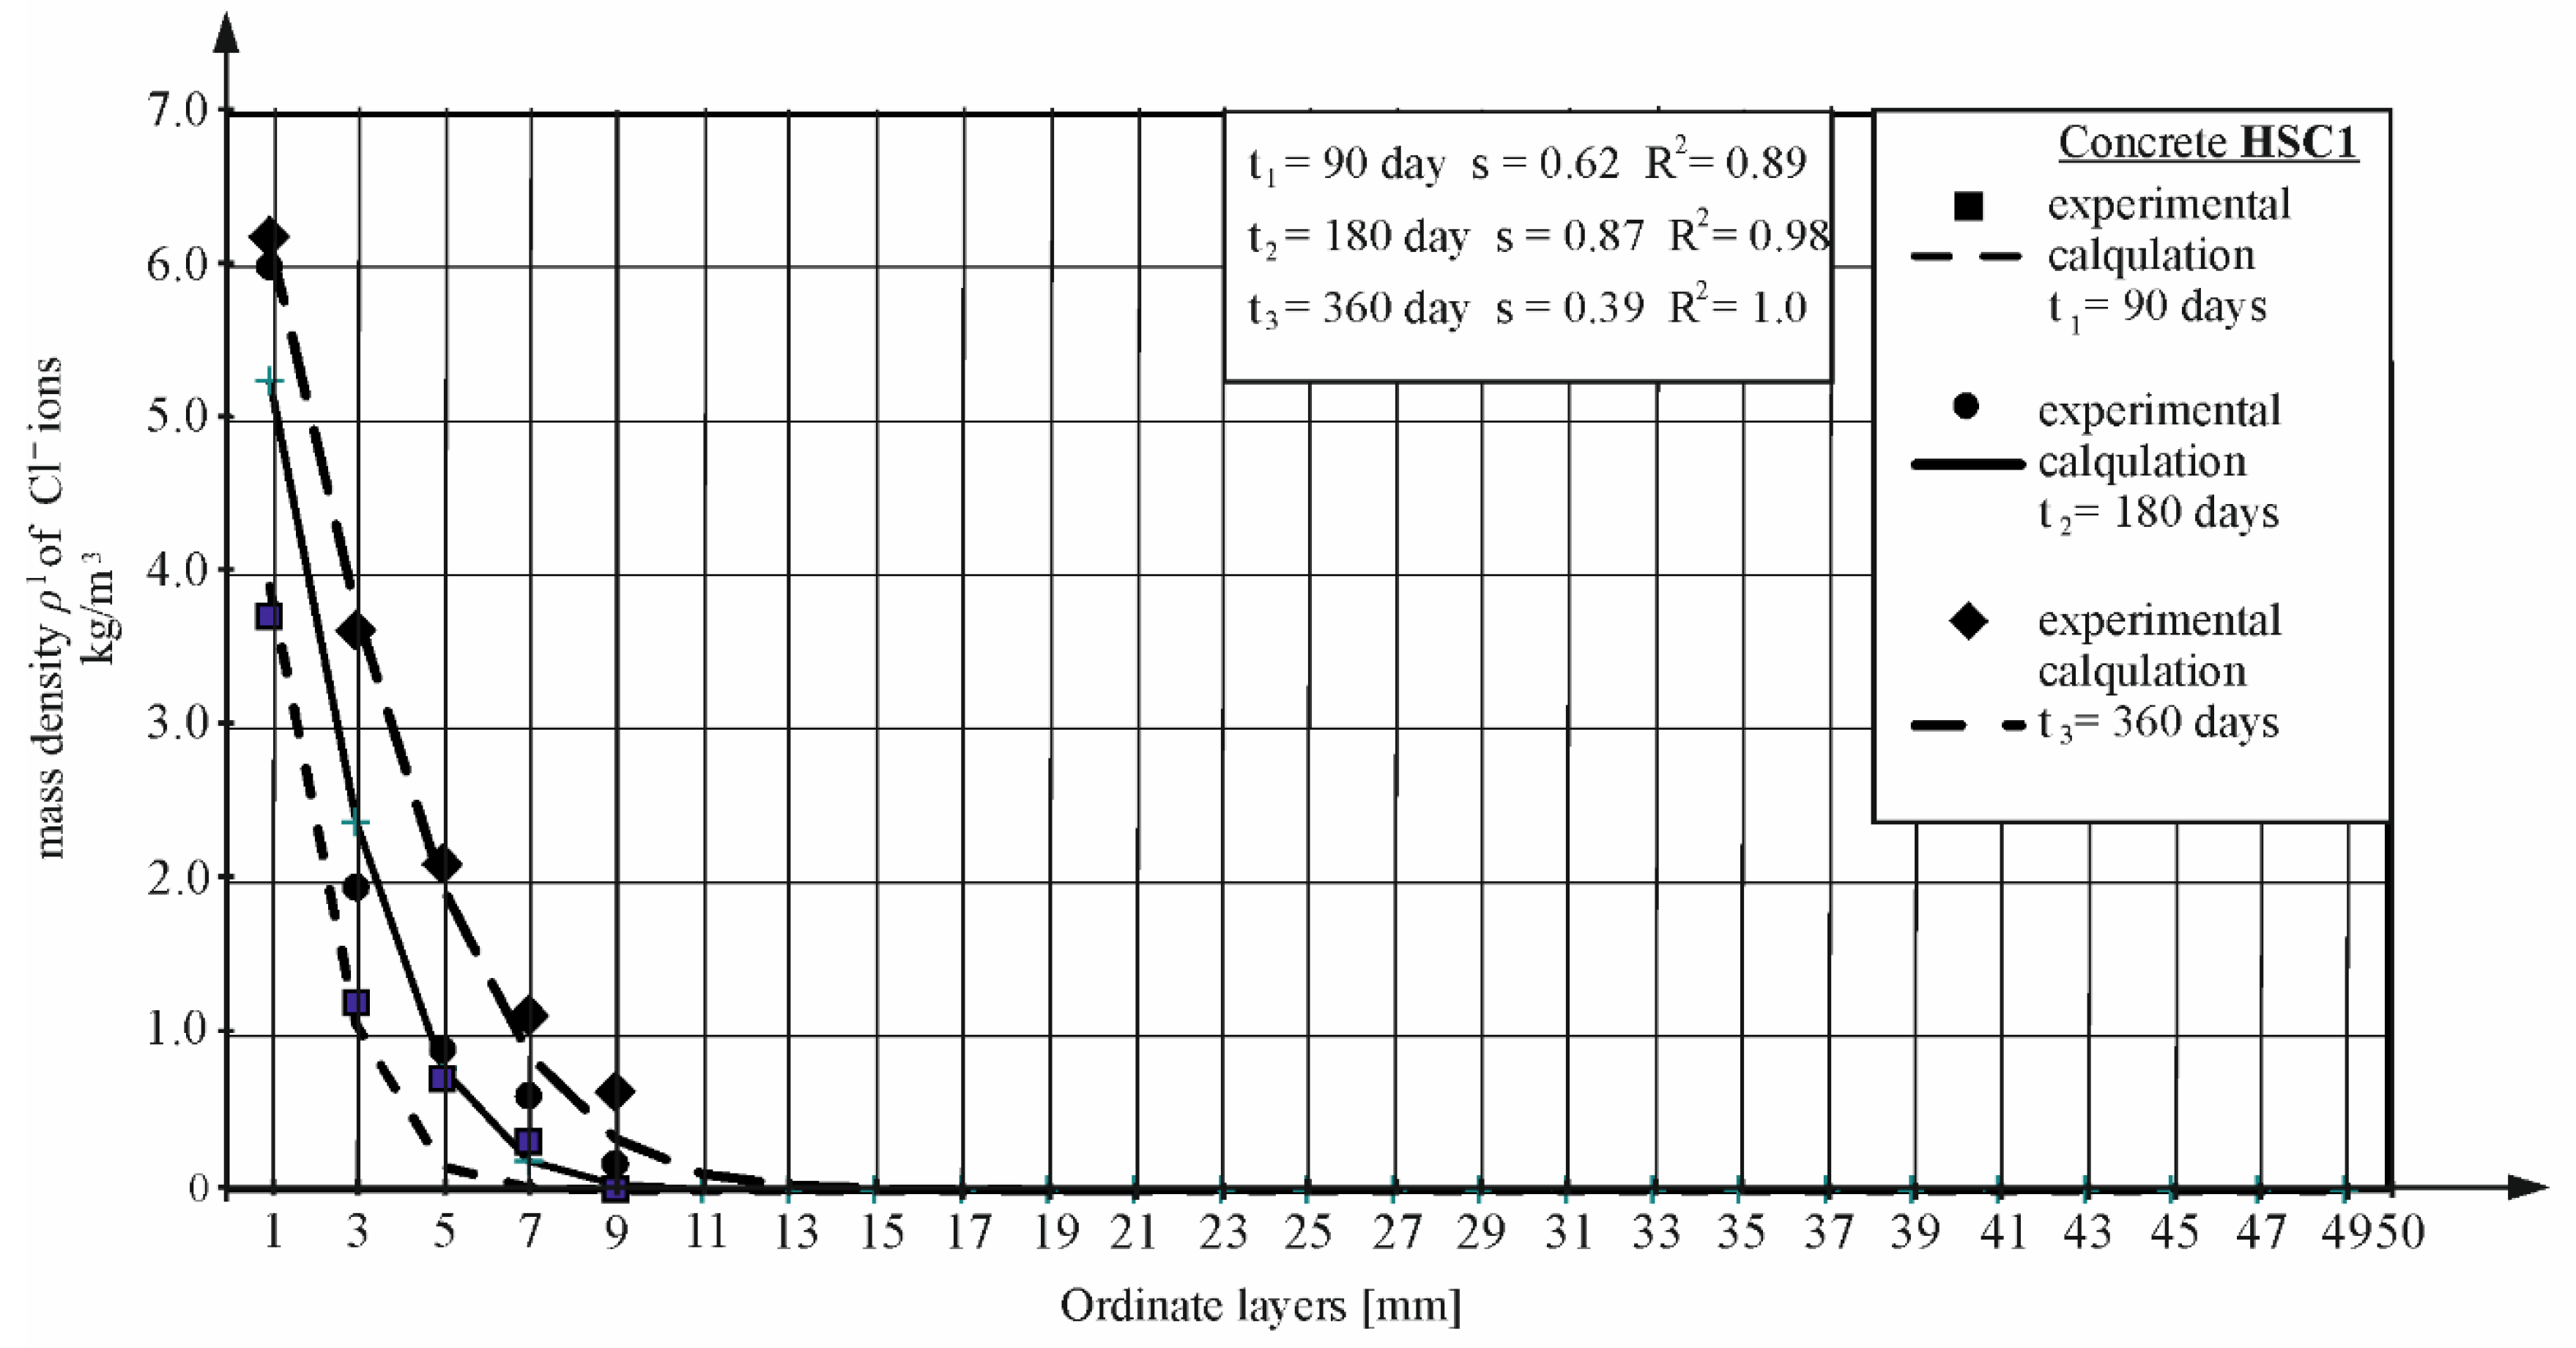
3.4. Diffusion Test of Chloride Ions in Concrete
3.5. Determining the Value of the Diffusion Coefficient Based on the Thermodynamic Model of Migration
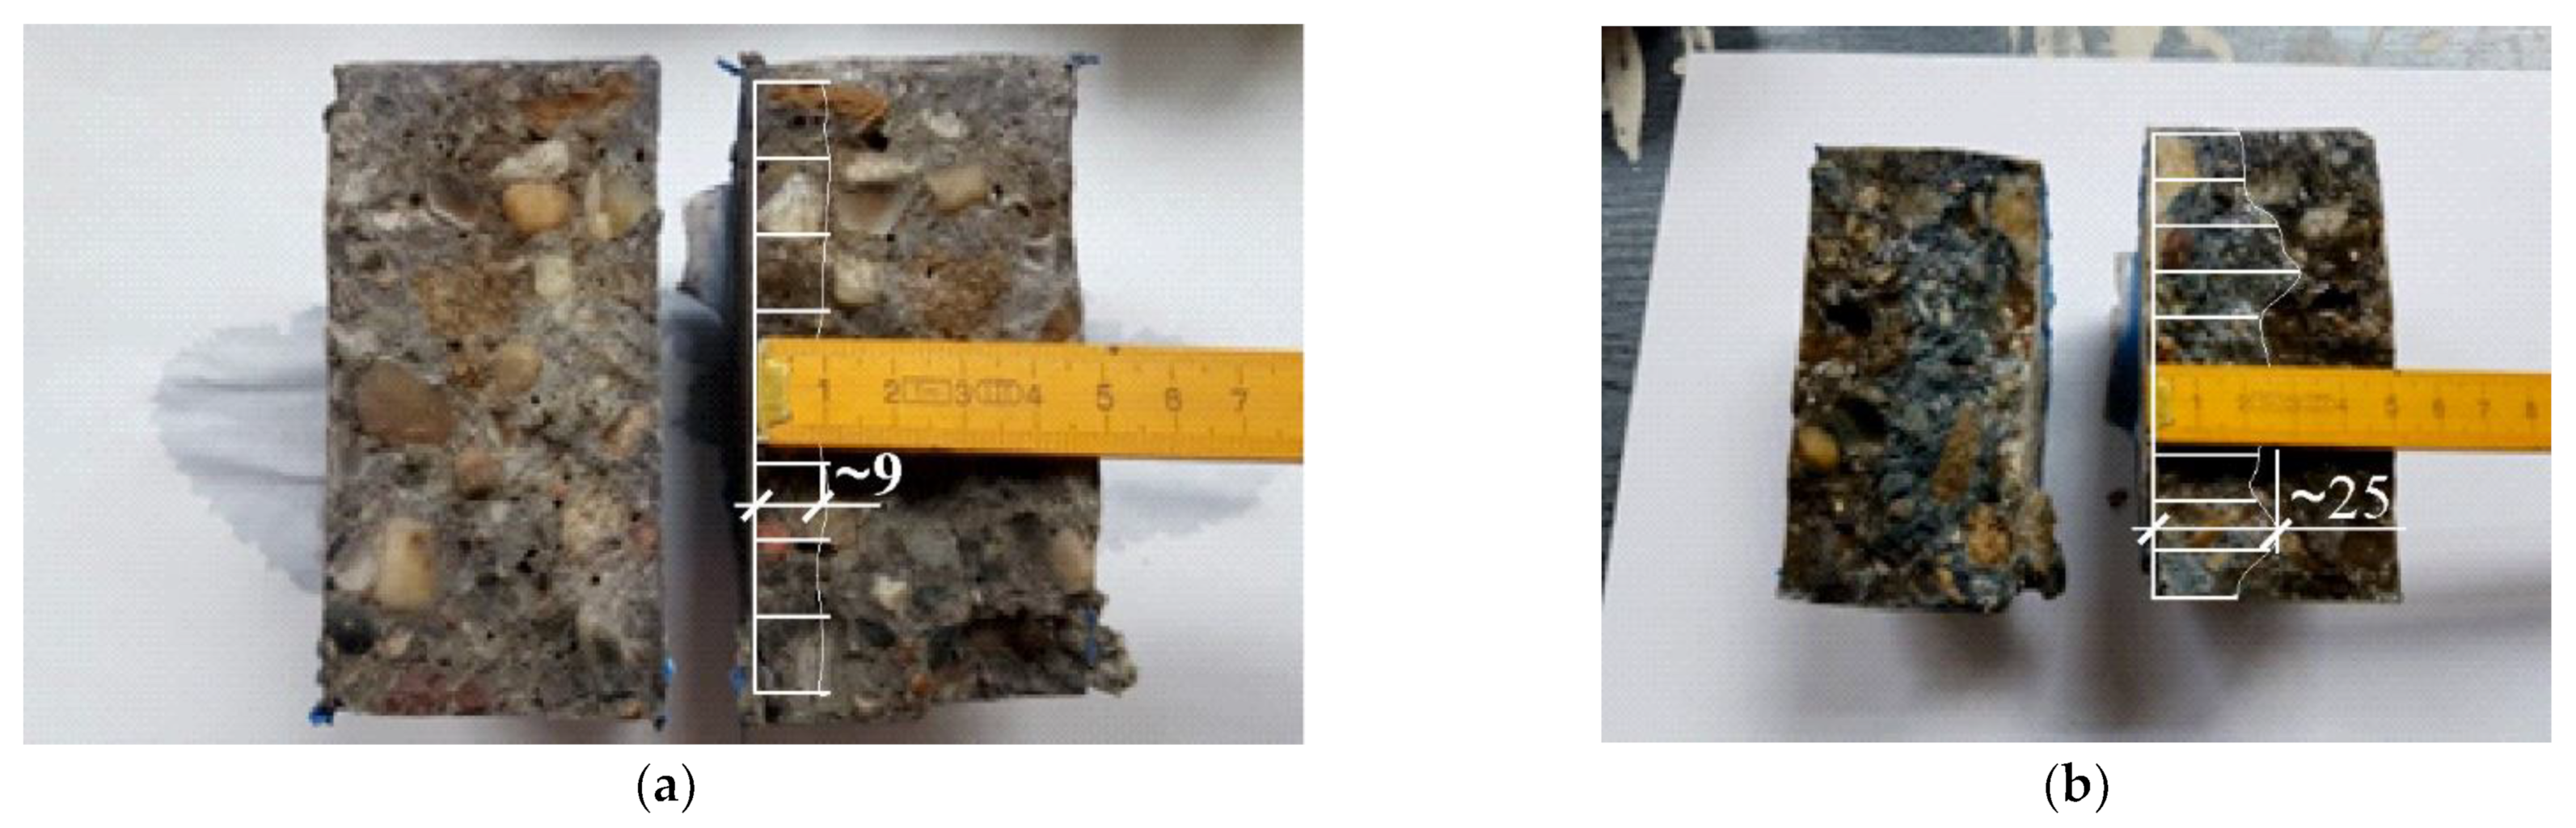
3.6. Determining of Chloride Ion Concentration Distribution in Concrete
3.7. Advanced Method for Chloride Ion Concentration Distribution Detection
4. Results
4.1. Results of the Tests Carried Out According to the ASTM C1202-97 (RCPT1)
4.2. Results of the Tests Carried Out According to the NT BUILD 492 (RCPT2)
4.3. Results of the Tests Carried Out According to the Standard NT BUILD 443 and the American Standard ASTM 1556 (CPT1)
4.4. Determining the Value of the Diffusion Coefficient Based on the Results of the Diffusion Test in Time t1 and t2 of Chloride Ions in All Concrete (TD1 and TD2)
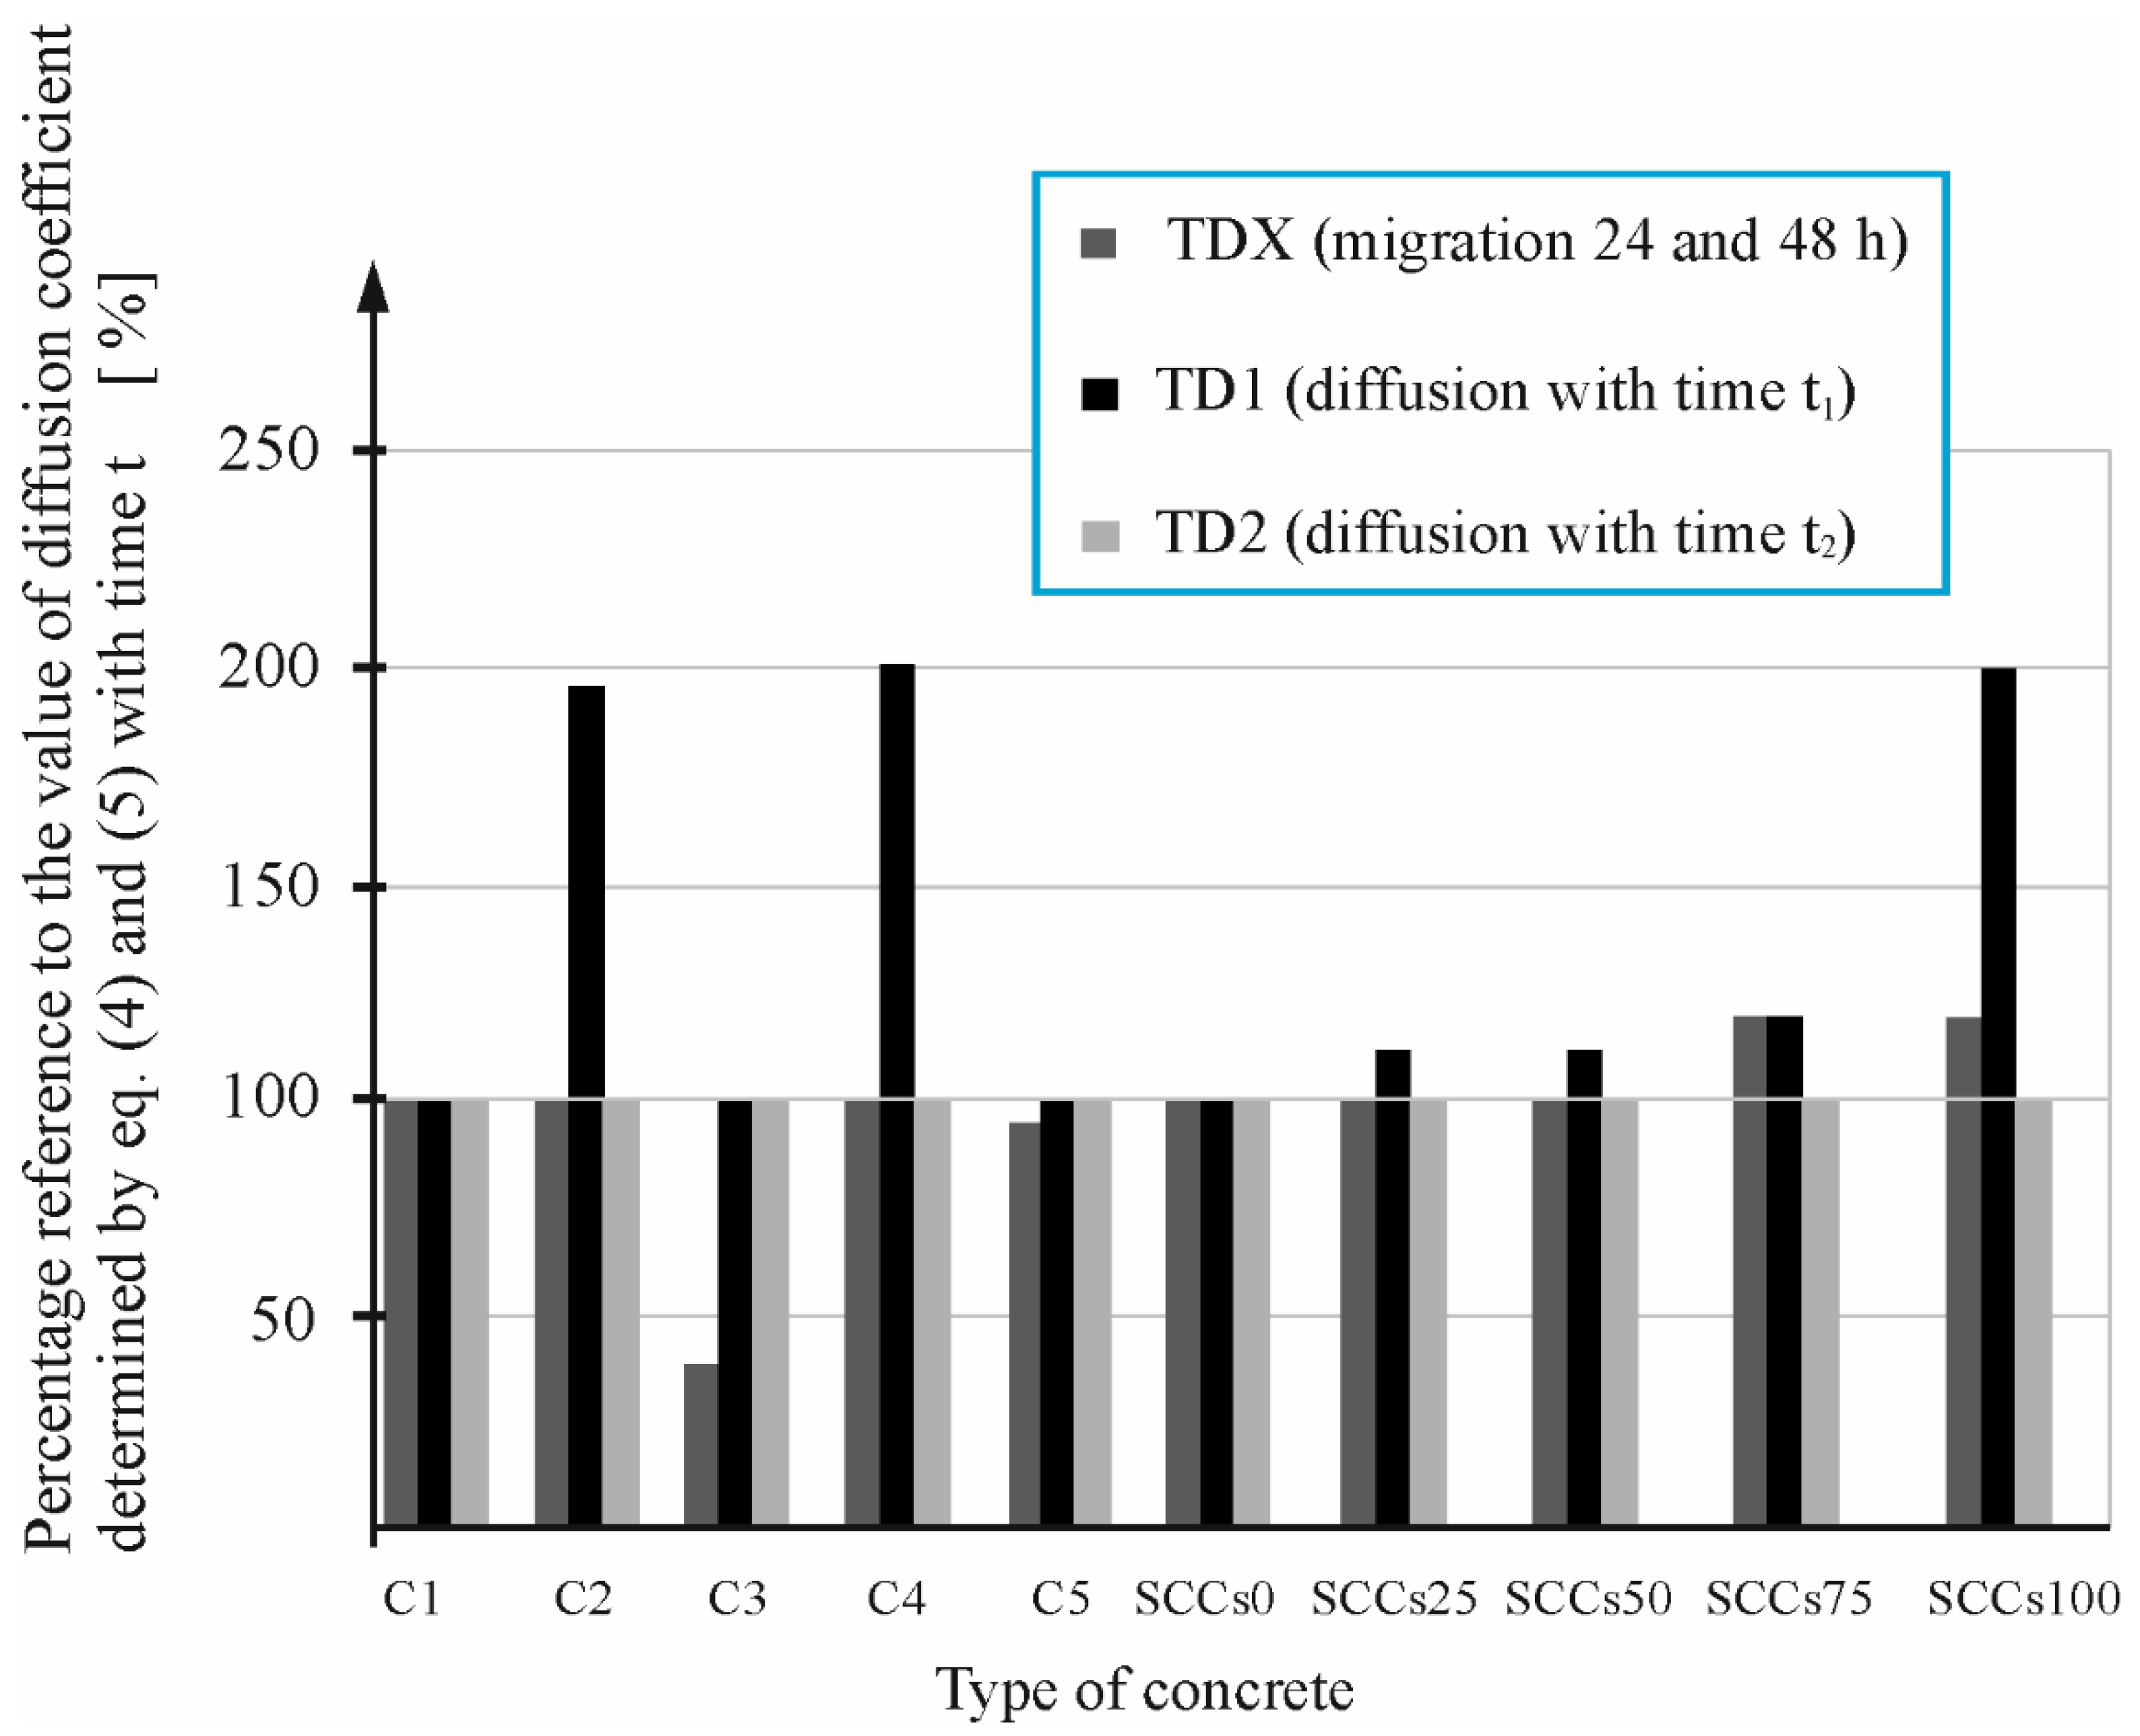
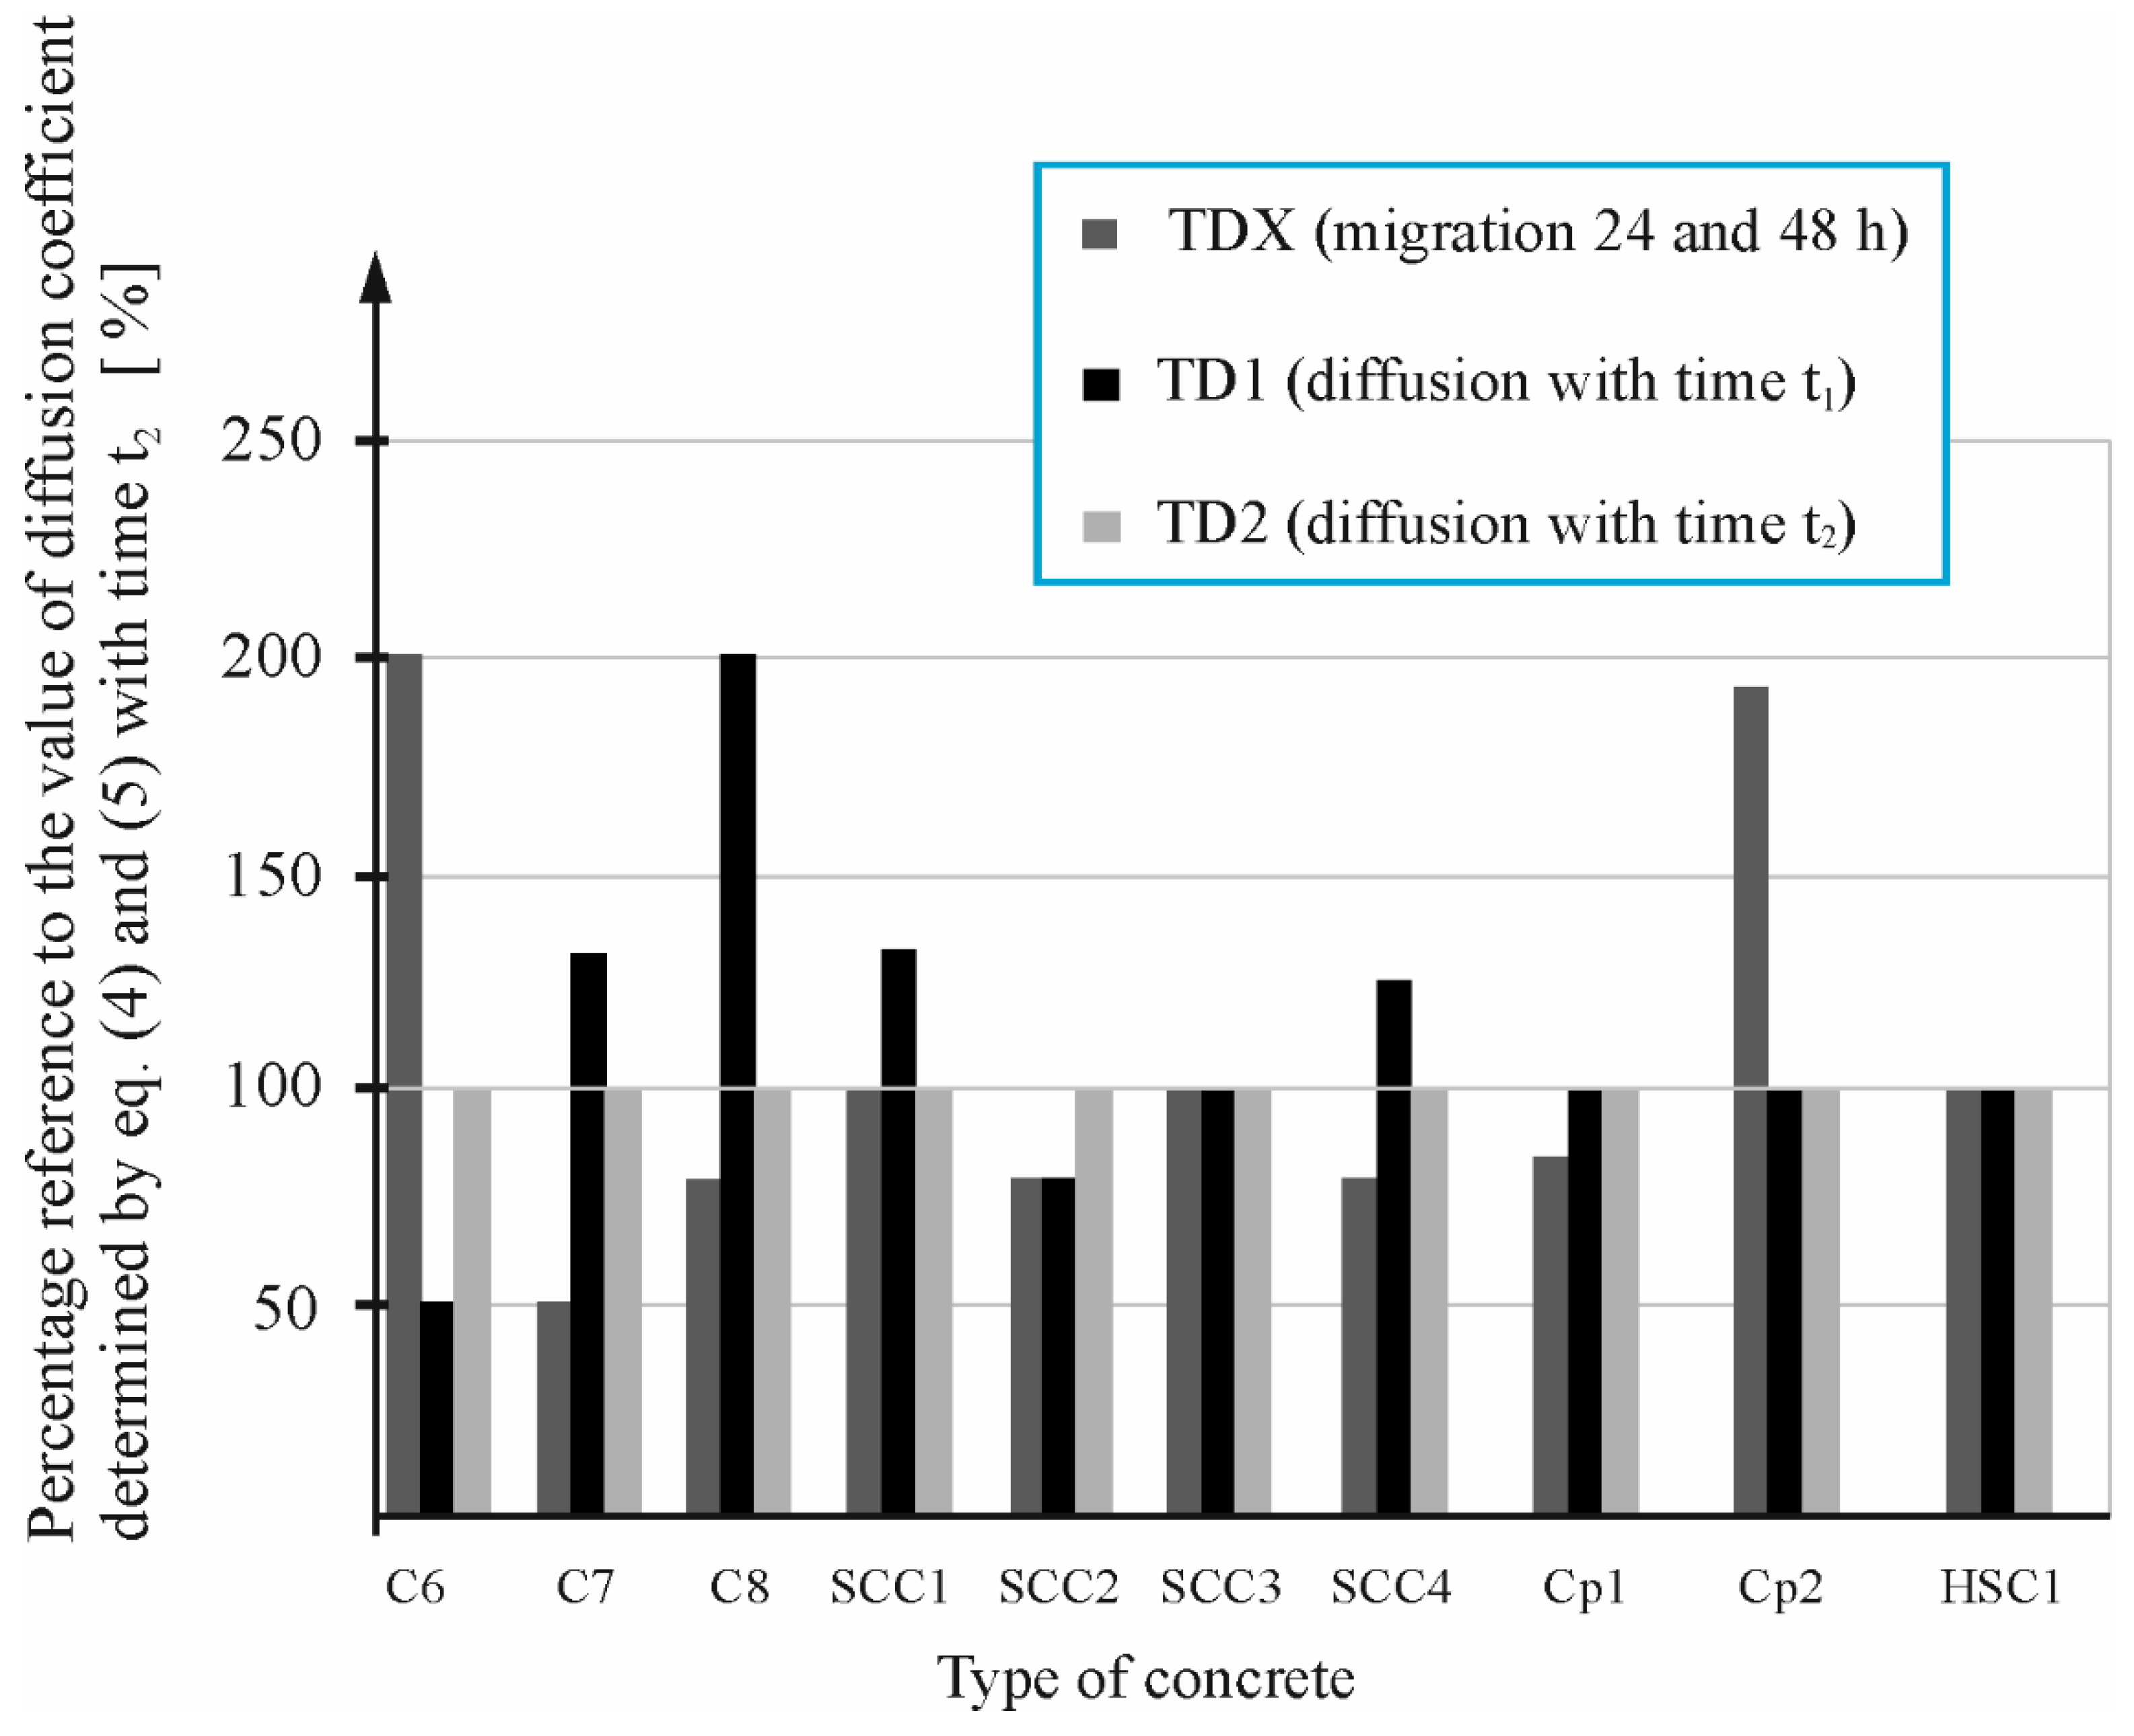
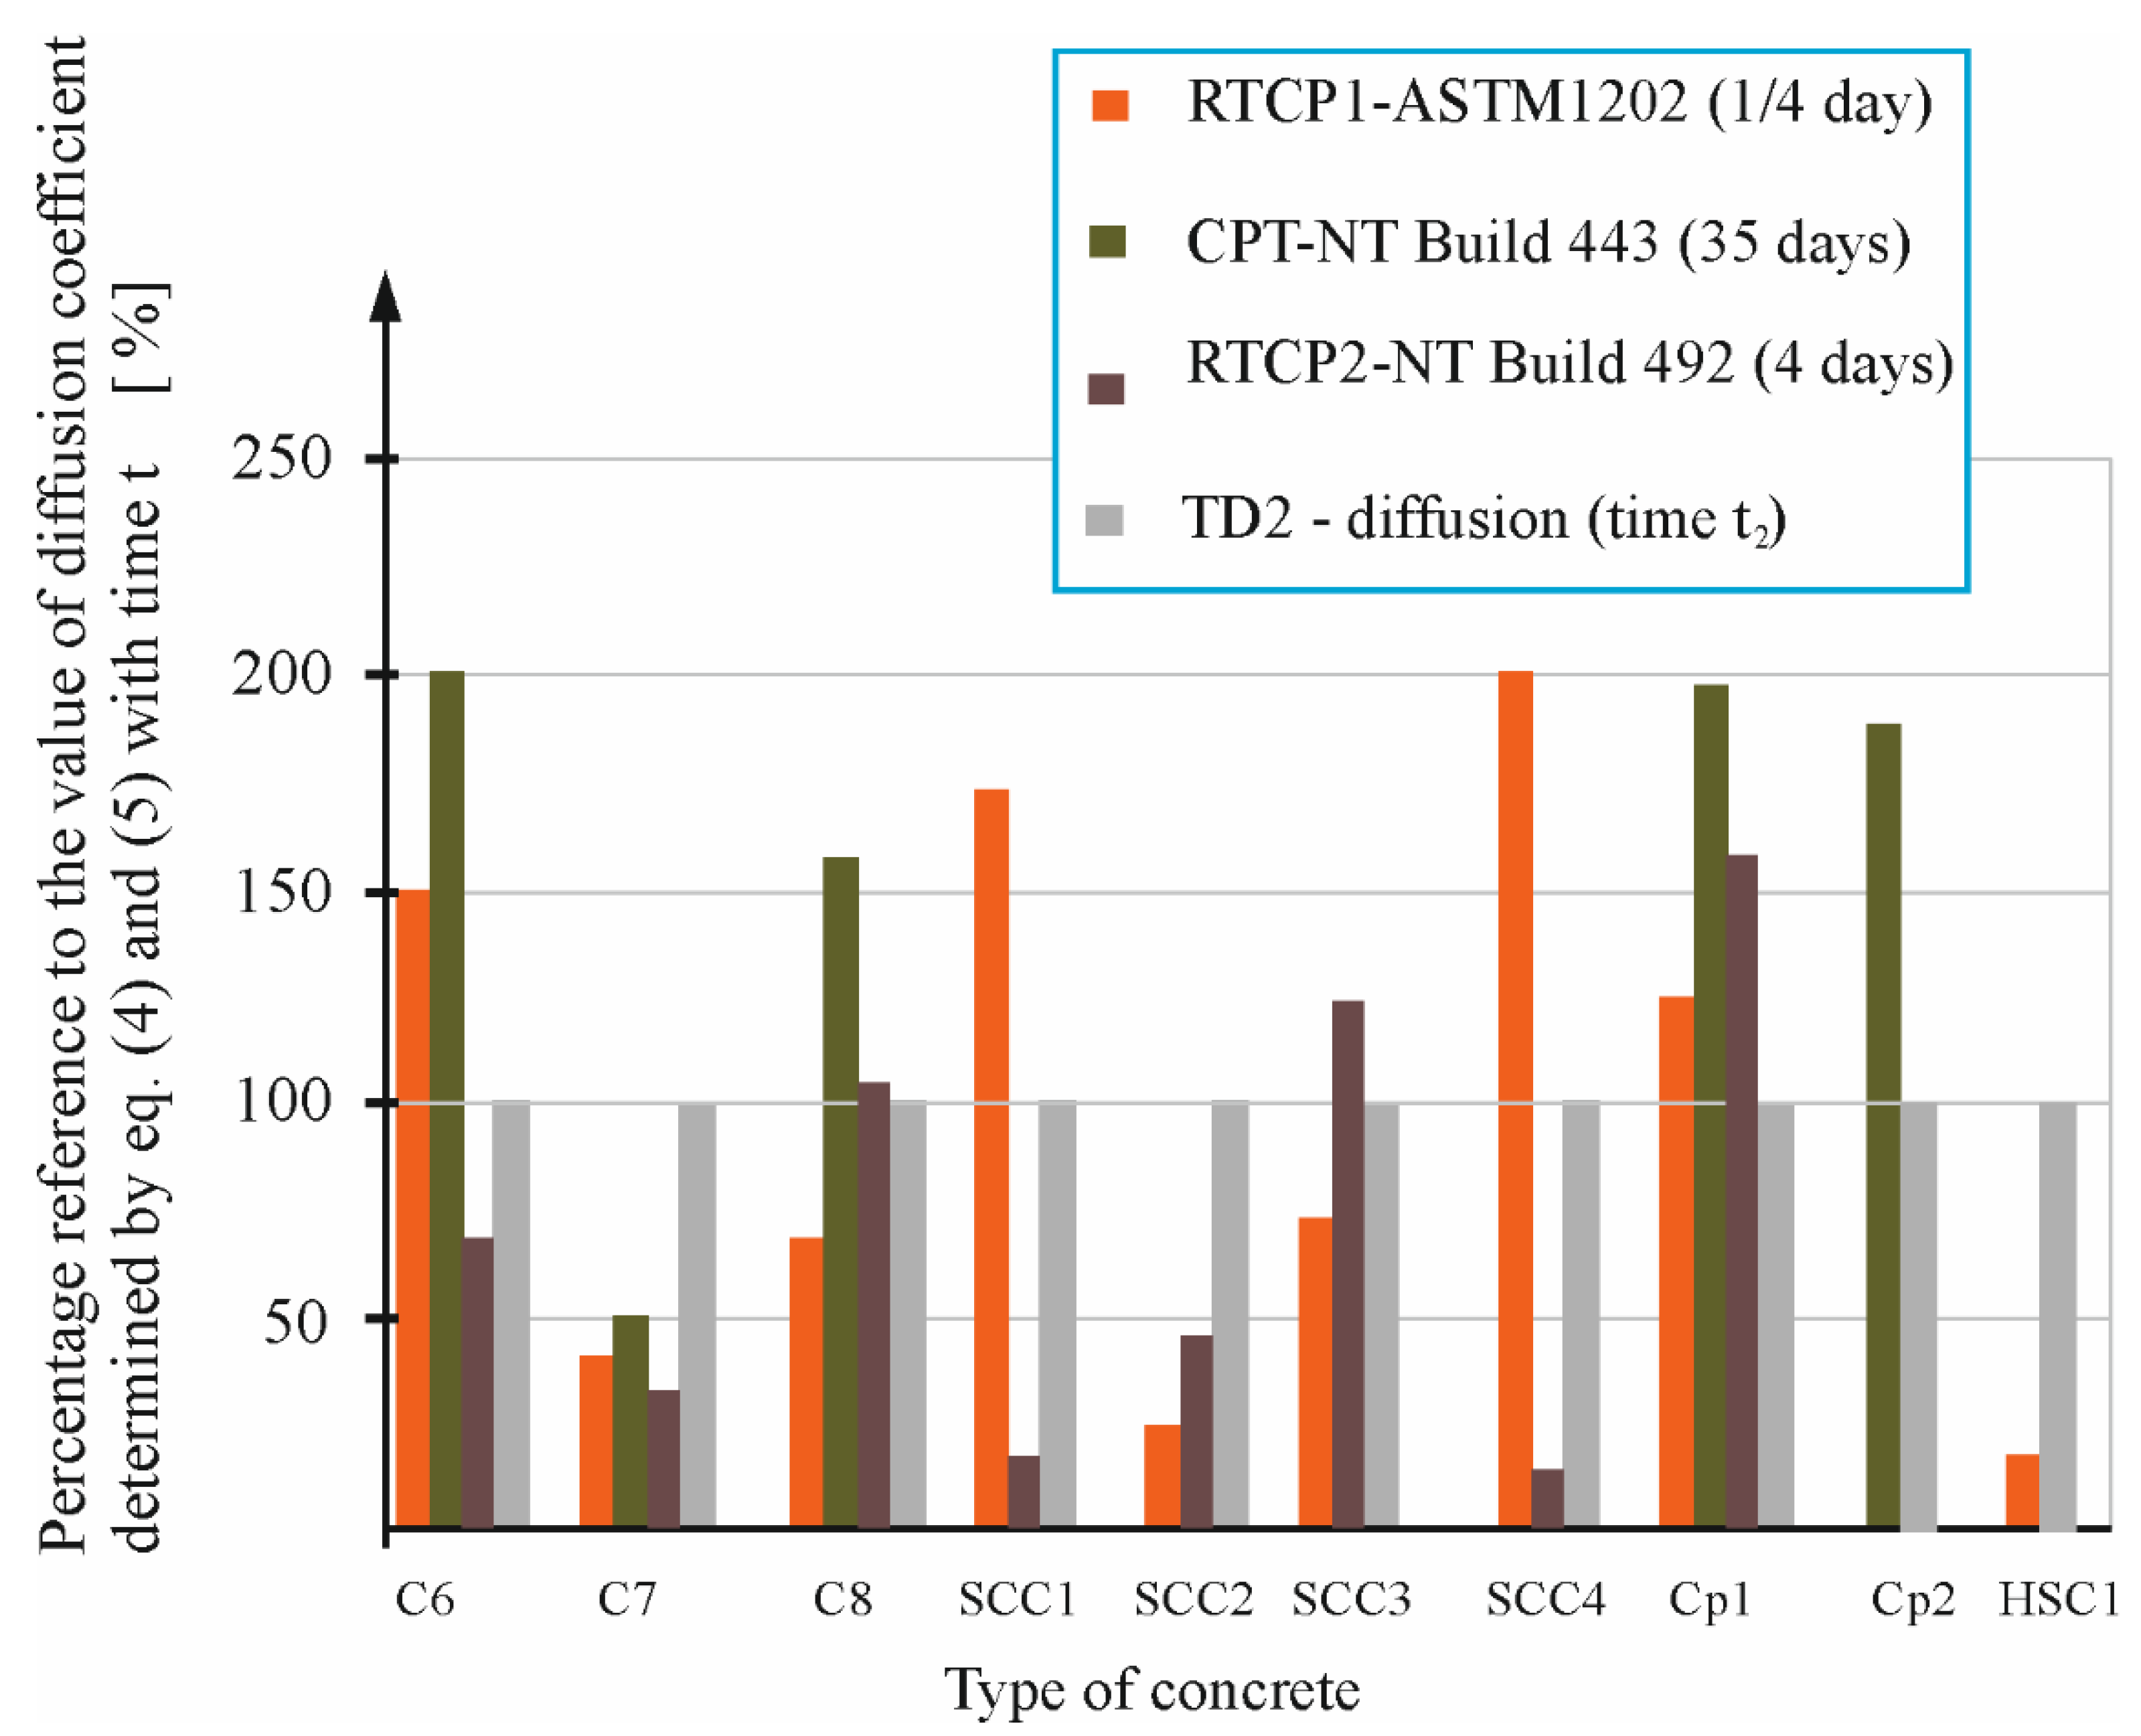
4.5. Comparison of the Value of the Diffusion Coefficient Obtained with Different Methods
5. Summary
- Of the methods considered, the most accurate method, while very time-consuming, is the natural penetration-based method for computing the diffusion coefficient, a curve fitting method for results obtained from a diffusion test lasting 60 or 180 days or longer (360 days) in the case of highly compact concretes (TD2). This method is the best representation of the natural diffusion process, and the diffusion coefficient values can be used in numerical methods modeling the phenomenon of chloride ion diffusion into concrete.
- The quickest and least labor-consuming method (RCPT1) used in the research is the chloride permeability test method according to the standard ASTM C1202-97.
- ○
- However, it is an indirect method obtaining the value of the diffusion coefficient based on correlation with the charge passing through the concrete.
- ○
- Although the method is faster, it can be used only for concretes for which the results are confirmed by using another long-term standard method.
- ○
- In this method, there is an almost 2.8-fold greater dispersion of the obtained results compared to the thermodynamic model of migration [48]. A high standard deviation can be a result of the method drawbacks.
- The standard NT BUILD 492 [14] method (RCPT2) is also quite fast and requires relatively little effort.
- ○
- The colorimetric method of determining the depth of chloride ion penetration may lead to large errors in concretes containing various types of cement, raising serious doubts.
- ○
- There is also no clarity regarding the coefficient that was computed, as the standard specifies that it is a nondiffusion migration coefficient; therefore, it is not useful in the context of using the diffusion coefficient in models that allow prediction of the durability of reinforced concrete structures.
- ○
- Additionally, a 3.8-fold dispersion of the results compared to the method with the thermodynamic model of migration was observed.
- ○
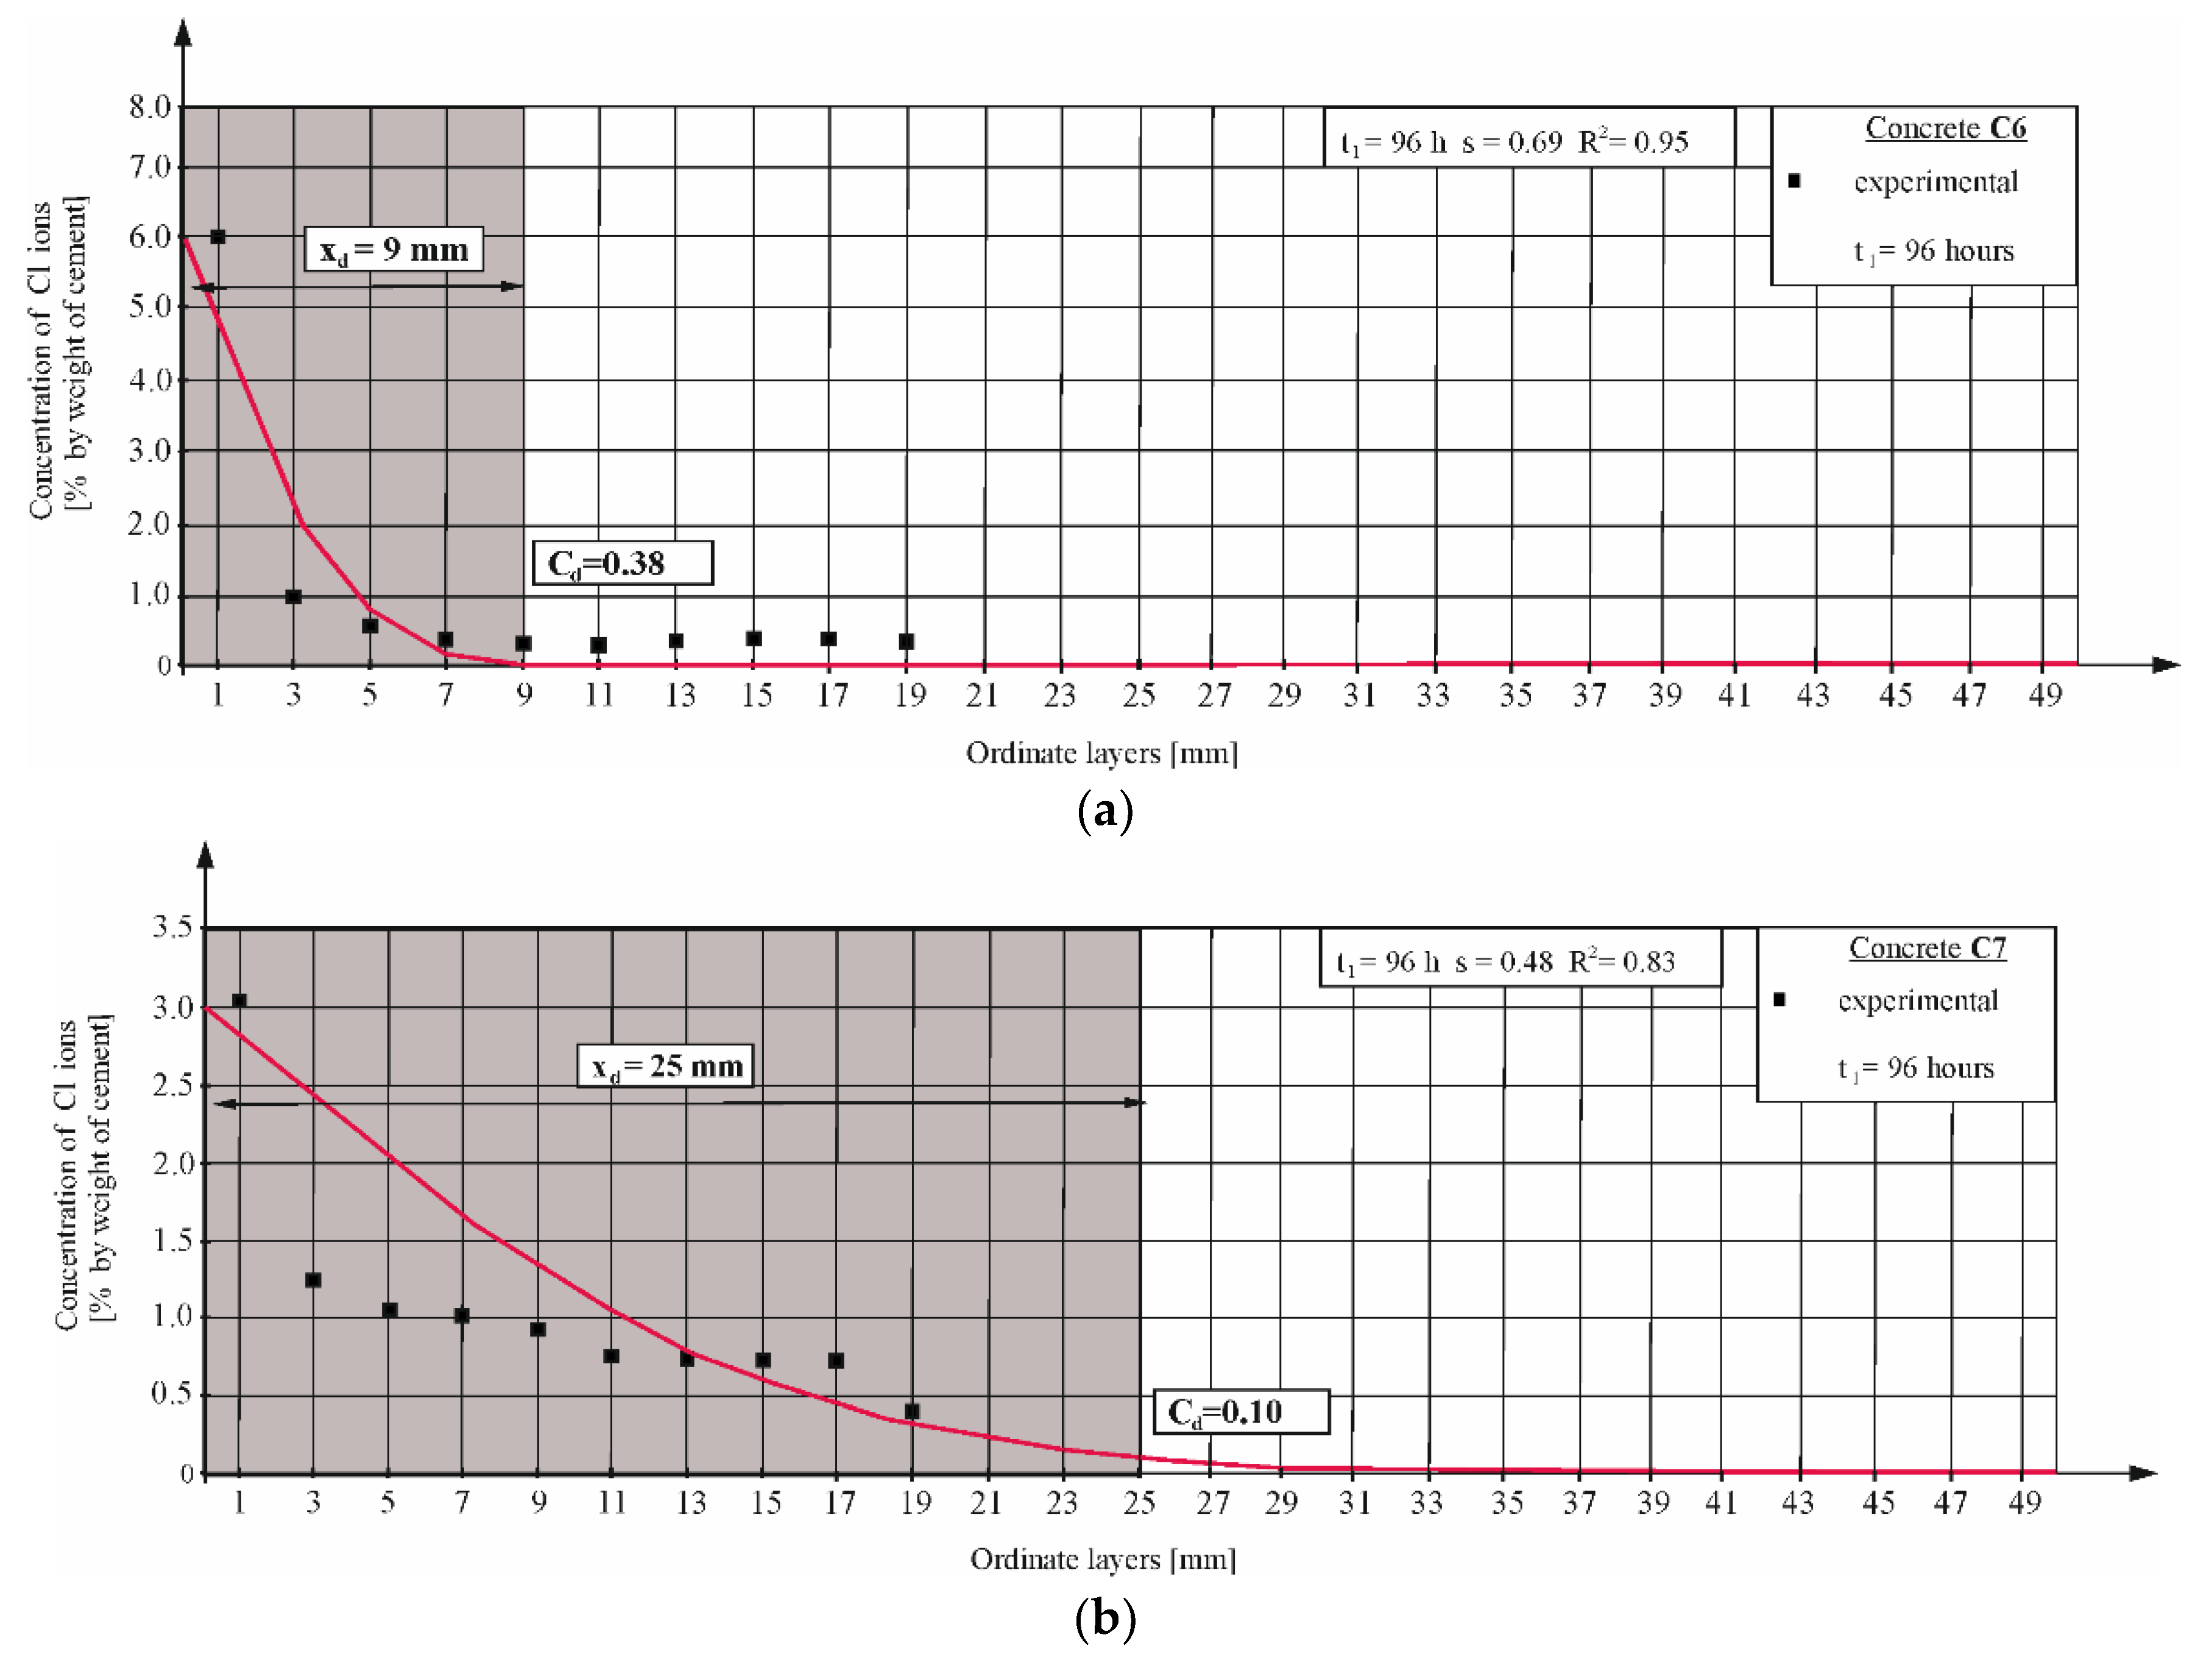
- Standard deviation can be a result of using a method based on Equation (4), which was determined empirically by Tang and Nillson [11,12,13] based on chloride concentration distribution and in which was a depth at which chloride concentration obtains a constant value. However, the graph presented in Figure 11 shows that this value falls within the 0.012 to 0.55 scope, which is a result of colorimetric method imprecision.
- The most time-consuming and long-lasting method (CPT) is the standard method NT BUILD 443 [5].
- ○
- Unfortunately, in this case, the largest 3.5-fold dispersion of values concerning the reference value are observed.
- ○
- The reason for the dispersion may be a large difference in the concentration of used source solutions and the difference in the preparation of test samples that are saturated in lime water before the test.
- The next method (TDX) is utilized according to the thermodynamic migration model [48]. Thus, the method seems to be the best among the analyzed methods. It is a relatively fast yet labor-intensive method that needs more extensive testing with different concrete mixtures.
- ○
- In this method, the smallest average positional deviation, which is 21% of base values, was also observed.
- ○
- By using an electric field in the test method and solving a thermodynamic migration model [48], the value of the diffusion coefficient is obtained after short-term tests lasting usually 24 and 48 h or 48 and 72 h in the case of concretes with very compact structures.
- ○
- It is based on two measurements that allows one to obtain the mean diffusion coefficient value and to include the effect of diffusion process nonstationarity related to the capacity of chloride ions to bind in the cement matrix [59].
- ○
- It requires a greater amount of labor than other rapid migration methods (RCPT1 and RCTP2), but thanks to the use of an electric field, it is shorter than natural penetration-based approaches (CPT, TD1, and TD2).
- ○
- It is a relatively fast testing procedure.
- ○
- A great advantage of this method is that it is promising for wide range of concrete mixtures, both plain concrete and concrete with various additives and admixtures, as well as high-performance concrete, even though it was tested on a relatively low number of mixtures.
- ○
- Even though there were three more significant differences from 20 mixture designs observed between the thermodynamic model and the base model, the overall match was better compared to the ASTM 1202, NT Build 493, or 492 standards.
6. Conclusions
- (1)
- The values obtained using standardized accelerated chloride penetration methods differed from each other, and it was difficult to find the relationship between them.
- (2)
- The results of thermodynamic model matched with the model based on longer natural penetration better comparing to codified approaches.
- (3)
- Moreover, the time needed for the thermodynamic test was in the order of days, making it of great importance in the preparation of an appropriate recipe for concrete used in the production of reinforced concrete structures.
- (4)
- The presented results confirmed doubts about the application of standardized approaches for the fast evaluation of chloride diffusion coefficients.
- (5)
- It is important to keep in mind its limited range of applications compared to traditional long-term penetration tests, adding therefore to the already mentioned concerns.
- (6)
- Since each of the indirect methods might need calibration based on the material content, further research might be focused on the evaluation of the mixture design on the results of the indirect determination of the chloride migration coefficient.
Author Contributions
Funding
Institutional Review Board Statement
Informed Consent Statement
Data Availability Statement
Acknowledgments
Conflicts of Interest
Nomenclature
| C1–C5 | Ordinary concretes differing only in the type of cement used |
| C6–C8 | Ordinary concretes used for the production of foundation blocks differ in the cement used, and an additional sealing admixture was used in C8 |
| SCC1–SCC4 | Self-compacting concretes of various compositions |
| SCCs0 | Self-compacting concretes without the addition of ISP slag |
| SCCs25 | Self-compacting concretes with the addition of 25% ISP slag instead of sand |
| SCCs50 | Self-compacting concretes with the addition of 50% ISP slag instead of sand |
| SCCs75 | Self-compacting concretes with the addition of 75% ISP slag instead of sand |
| SCCs100 | Self-compacting concretes with the addition of 100% ISP slag instead of sand |
| CP1 | Concrete drilled directly from the HC-500 floor slabs |
| CP2 | Concrete drilled directly from the prestressed lintels |
| HSC1 | High-strength self-compacting concrete |
| ISP | Imperial Smelting Process: a combined lead–zinc process in which oxidized concentrates are reduced with coke in a shaft furnace and the zinc fumes are collected in a lead splash condenser |
| RCPT1 | Rapid Chloride Penetration Test accordance AASHTO T 277 and ASTM C1202-9 standard method |
| RCPT2 | Rapid Chloride Penetration Test accordance NT BUILD 492 standard method (AgNO3 spray test applied) |
| NSC1 | Migration Test in Nonsteady conditions Modified NT BUILD 492 (method of fitting to a concentration curve) |
| NSC2 | Migration in Nonsteady conditions Modified NT BUILD 492 (calculated based on on ) |
| CPT | Chloride penetration test accordance NT BUILD 443 and ASTM C 1556 standard method |
| TD1 | Natural diffusion with t1 = (method of fitting to a concentration curve) |
| TD2 | Natural diffusion with t2 = (method of fitting to a concentration curve) |
| TDX | Thermodynamic model of Migration in nonsteady conditions t1 and t2 |
| Diffusion coefficient determined on the basis of the RCPT1 method | |
| Diffusion coefficient determined on the basis of the RCPT2 method | |
| Migration coefficient determined on the basis of the NSC1 method | |
| Diffusion coefficient determined on the basis of the NSC2 method | |
| Diffusion coefficient determined on the basis of the CPT method | |
| Diffusion coefficient determined on the basis of the TD1 method | |
| Diffusion coefficient determined on the basis of the TD2 method | |
| Diffusion coefficient determined on the basis of the TDX method | |
| Note: Detailed nomenclature related to equations is given below the respective equation. | |
References
- Guimarães, A.T.C.; Climent, M.A.; De Vera, G.; Vicente, F.J.; Rodrigues, F.T.; Andrade, C. Determination of chloride diffusivity through partially saturated Portland cement concrete by a simplified procedure. Constr. Build. Mater. 2011, 25, 785–790. [Google Scholar] [CrossRef]
- Yang, J.; Zhang, P.; Feng, J. Advances in Chloride Ion Diffusion Coefficient. Test Research for Concrete. In Proceedings of the First International Conference on Innovation in Low-Carbon Cement and Concrete Technology (ILCCC2019), University College, London, UK, 24–26 June 2019; pp. 1–6. [Google Scholar]
- Shi, X.; Xie, N.; Fortune, K.; Gong, J. Durability of steel reinforced concrete in chloride environments: An overview. Constr. Build. Mater. 2012, 30, 125–138. [Google Scholar] [CrossRef]
- Test, C.C.; Drilled, T.; Statements, B. Determining the Apparent Chloride Diffusion Coefficient of Cementitious Mixtures by Bulk Diffusion. Designation 1556-11a 2003, 4, 1–7. [Google Scholar]
- NT BUILD-443; Concrete Hardened: Accelerated Chloride Penetration. Nordtest: Espoo, Finland, 1995; pp. 1–5.
- ASTM C1202-12; Standard Test Method for Electrical Indication of Concrete’s Ability to Resist Chloride Ion Penetration. ASTM International: West Conshohocken, PA, USA, 2012.
- Whiting, D. Report No. FHWA/RD-81/119 Rapid Determination of the Chloride Permeability of Concrete Final; Federal Highway Administration: Washington, DC, USA, 1981; p. 174.
- Ghosh, P.; Hammond, A.; Tikalsky, P.J. Publication Prediction of Equivalent Steady-State Chloride Diffusion Coefficients. Mater. J. 2011, 108, 88–94. [Google Scholar]
- Lu, X. Application of the Nernst-Einstein equation to concrete. Cem. Concr. Res. 1997, 27, 293–302. [Google Scholar] [CrossRef]
- AASHTO T259-02; Standard Method of Test for Resistance of Concrete to Chloride Ion Penetration. American Association of State and Highway Transportation Officials: Washington, DC, USA, 2002.
- Tang, L.; Nilsson, L.O. Chloride Diffusivity in High Strength Concrete. Nord. Concr. Res. 1992, 11, 162–170. [Google Scholar]
- Luping, T.; Nilsson, L. Accelerated Tests for Chloride Diffusivity and their Application in Prediction of Chloride Penetration. Mech. Chem. Degrad. Cem. Based Syst. 2020, 45, 399–408. [Google Scholar] [CrossRef]
- Luping, T.; Nilsson, L. Rapid determination of the Chloride Diffusivity in concrete by Applying an Electrical Field. ACI Mater. J. 1992, 89, 49–53. [Google Scholar]
- NT Build 492; Concrete, Mortar and Cement-Based Repair Materials: Chloride Migration Coefficient from Non-Steady-State Migration Experiments. Nordtest: Espoo, Finland, 1999; pp. 1–8.
- He, F.; Shi, C.; Yuan, Q.; An, X.; Tong, B. Calculation of chloride concentration at color change boundary of AgNO3 colorimetric measurement. Cem. Concr. Res. 2011, 41, 1095–1103. [Google Scholar] [CrossRef]
- Castellote, M.; Andrade, C.; Kropp, J.; Antonsen, R.; Baroghel-Bouny, V.; Basheer, M.P.A.; Bertolini, L.; Carcasses, M.; Cavlek, C.; Chaussadent, T.; et al. Round-Robin test on methods for determining chloride transport parameters in concrete. Mater. Struct. 2006, 39, 955–990. [Google Scholar] [CrossRef]
- Andrade, C.; D’Andrea, R.; Rebolledo, N. Chloride ion penetration in concrete: The reaction factor in the electrical resistivity model. Cem. Concr. Compos. 2014, 47, 41–46. [Google Scholar] [CrossRef]
- Funahashi, M. Predicting corrosion-free service life of a concrete structure in a chloride environment. ACI Mater. J. 1990, 87, 581–587. [Google Scholar] [CrossRef]
- Boddy, A.; Bentz, E.; Thomas, M.D.A.; Hooton, R.D. Overview and sensitivity study of a multimechanistic chloride transport model. Cem. Concr. Res. 1999, 29, 827–837. [Google Scholar] [CrossRef]
- Kumar, S.; Rai, B.; Biswas, R.; Samui, P.; Kim, D. Prediction of rapid chloride permeability of self-compacting concrete using Multivariate Adaptive Regression Spline and Minimax Probability Machine Regression. J. Build. Eng. 2020, 32, 101490. [Google Scholar] [CrossRef]
- Luping, T.; Gulikers, J. On the mathematics of time-dependent apparent chloride diffusion coefficient in concrete. Cem. Concr. Res. 2007, 37, 589–595. [Google Scholar] [CrossRef]
- Tang, L. Chloride Transport in Concrete—Measurement and Prediction. Ph.D. Thesis., Chalmers University of Technology, Gothenburg, Sweden, 1996. [Google Scholar]
- Nilsson, L. On the uncertainty of service-life models for reinforced marine concrete structures. In Proceedings of the International RILEM Workshop on Life Prediction and Aging Management of Concrete Structures, Cannes, France, 16–17 October 2000; pp. 1–13. [Google Scholar]
- Nokken, M.; Boddy, A.; Hooton, R.D.; Thomas, M.D.A. Time dependent diffusion in concrete-three laboratory studies. Cem. Concr. Res. 2006, 36, 200–207. [Google Scholar] [CrossRef]
- Stanish, K.; Thomas, M. The use of bulk diffusion tests to establish time-dependent concrete chloride diffusion coefficients. Cem. Concr. Res. 2003, 33, 55–62. [Google Scholar] [CrossRef]
- Lehner, P.; Konečný, P.; Ponikiewski, T. Experimental and numerical evaluation of SCC concrete durability related to ingress of chlorides. AIP Conf. Proc. 2018, 1978, 1–4. [Google Scholar] [CrossRef]
- Dehkordi, E.R.; Moodi, F.; GivKashi, M.R.; Ramezanianpour, A.A.; Khani, M. Software simulation of chloride ions penetration into composite of pre-fabricated geopolymer permanent formworks (PGPFs) and substrate concrete. J. Build. Eng. 2022, 51, 104344. [Google Scholar] [CrossRef]
- Han, S.H. Influence of diffusion coefficient on chloride ion penetration of concrete structure. Constr. Build. Mater. 2007, 21, 370–378. [Google Scholar] [CrossRef]
- Andrade, C.; Prieto, M.; Tanner, P.; Tavares, F.; D’Andrea, R. Testing and modelling chloride penetration into concrete. Constr. Build. Mater. 2013, 39, 9–18. [Google Scholar] [CrossRef]
- Spiesz, P.; Brouwers, H.J.H. The apparent and effective chloride migration coefficients obtained in migration tests. Cem. Concr. Res. 2013, 48, 116–127. [Google Scholar] [CrossRef]
- Tang, L.; Sørensen, H.E. Precision of the Nordic test methods for measuring the chloride diffusion/migration coefficients of concrete. Mater. Struct. 2001, 34, 479–485. [Google Scholar] [CrossRef]
- Konečný, P.; Lehner, P.; Ponikiewski, T.; Miera, P. Comparison of Chloride Diffusion Coefficient Evaluation Based on Electrochemical Methods. Procedia Eng. 2017, 190, 193–198. [Google Scholar] [CrossRef]
- AASHTO TP95-11; Standard Method of Test for Surface Resistivity Indication of Concrete’s Ability to Resist Chloride Ion Penetration. American Association of State and Highway Transportation Officials: Washington, DC, USA, 2011.
- Guignone, G.C.; Vieira, G.L.; Zulcão, R.; Mion, G.; Baptista, G. Analysis of the chloride diffusion coefficients by different test methods in concrete mixtures containing metakaolin and high-slag blast-furnace cement. Rev. Mater. 2019, 1–18. [Google Scholar] [CrossRef]
- Tang, L.; Gjørv, O.E. Chloride diffusivity based on migration testing. Cem. Concr. Res. 2001, 31, 973–982. [Google Scholar] [CrossRef]
- Tang, L. Concentration dependence of diffusion and migration of chloride ions Part 1. Theoretical considerations. Cem. Concr. Res. 1999, 29, 1463–1468. [Google Scholar] [CrossRef]
- Tang, L. Concentration dependence of diffusion and migration of chloride ions Part 2. Experimental evaluations. Cem. Concr. Res. 1999, 29, 1469–1474. [Google Scholar] [CrossRef]
- Andrade, C.; Castellote, M.; Alonso, C.; González, C. Relation between colourimetric chloride penetration depth and charge passed in migration tests of the type of standard ASTM C1202-91. Cem. Concr. Res. 1999, 29, 417–421. [Google Scholar] [CrossRef]
- Otsuki, N.; Nagataki, S.; Nakashita, K. Evaluation of the AgNO3 solution spray method for measurement of chloride penetration into hardened cementitious matrix materials. Constr. Build. Mater. 1993, 7, 195–201. [Google Scholar] [CrossRef]
- Al-Alaily, H.S.; Hassan, A.A.A. Time-dependence of chloride diffusion for concrete containing metakaolin. J. Build. Eng. 2016, 7, 159–169. [Google Scholar] [CrossRef]
- Shafikhani, M.; Chidiac, S.E. Quantification of concrete chloride diffusion coefficient—A critical review. Cem. Concr. Compos. 2019, 99, 225–250. [Google Scholar] [CrossRef]
- Liu, J.; Ou, G.; Qiu, Q.; Xing, F.; Tang, K.; Zeng, J. Atmospheric chloride deposition in field concrete at coastal region. Constr. Build. Mater. 2018, 190, 1015–1022. [Google Scholar] [CrossRef]
- Liu, J.; Zhang, W.; Li, Z.; Jin, H.; Tang, L. Influence of deicing salt on the surface properties of concrete specimens after 20 years. Constr. Build. Mater. 2021, 295, 123–643. [Google Scholar] [CrossRef]
- Lehner, P.; Koubová, L.; Rosmanit, M. Study of Effect of Reference Time of Chloride Diffusion Coefficient in Numerical Modelling of Durability of Concrete. Buildings 2022, 12, 1443. [Google Scholar] [CrossRef]
- ASTM C1543 Standard; Test Method for Determining the Penetration of Chloride Ion into Concrete by Ponding. ASTM: West Conshohocken, PA, USA, 1996.
- Zhang, F.; Wei, F.; Wu, X.; Hu, Z.; Li, X.; Gao, L. Study on Concrete Deterioration and Chloride Ion Diffusion Mechanism by Different Aqueous NaCl-MgSO4 Concentrations. Buildings 2022, 12, 1843. [Google Scholar] [CrossRef]
- Sanjuán, M.Á.; Rivera, R.A.; Martín, D.A.; Estévez, E. Chloride Diffusion in Concrete Made with Coal Fly Ash Ternary and Ground Granulated Blast-Furnace Slag Portland Cements. Materials 2023, 15, 8914. [Google Scholar] [CrossRef]
- Szweda, Z.; Zybura, A. Theoretical model and experimental tests on chloride diffusion and migration processes in concrete. Procedia Eng. 2013, 57, 1121–1130. [Google Scholar] [CrossRef] [Green Version]
- Szweda, Z. Analysis of protective features of concrete in precast prestressed floor slabs (HC type) against chloride penetration. MATEC Web Conf. 2018, 163, 05006. [Google Scholar] [CrossRef] [Green Version]
- Szweda, Z. Chloride diffusion and migration coefficients in concretes with CEM I 42.5 R; CEMII/B-V 32.5 R; CEM I 42.5N/SR3/NA cement determined by standard methods and thermodynamic migration model. Ochr. Przed Koroz. 2019, 62, 162–169. [Google Scholar] [CrossRef]
- Szweda, Z. Comparison of Protective Properties of Concretes with Low Alkali Cement. IOP Conf. Ser. Mater. Sci. Eng. 2019, 603, 042059. [Google Scholar] [CrossRef]
- Szweda, Z.; Ponikiewski, T.; Katzer, J. A study on replacement of sand by granulated ISP slag in SCC as a factor formatting its durability against chloride ions. J. Clean. Prod. 2017, 156, 569–576. [Google Scholar] [CrossRef]
- BS EN 206 2013; Concrete, Specification, Performance, Production and Conformity. British Standards Institution: London, UK, 2013.
- Andrade, C.; Sanjuán, M.; Recuero, A.; Río, O. Calculation of chloride diffusivity in concrete from migration experiments, in non steady-state conditions. Cem. Concr. Res. 1994, 24, 1214–1228. [Google Scholar] [CrossRef]
- Szweda, Z.; Gołaszewski, J.; Konečny, P. Comparison of Standardized Methods for Determining the Diffusion Coefficient of Chloride in Concrete with Thermodynamic Model of Migration—Data [Data set]. Zenodo 2022. [Google Scholar] [CrossRef]
- Caijun, S. Effect of mixing proportions of concrete on its electrical conductiv-ity and the rapid chloride permeability test (ASTM C 1202 or AASHTO T 277-83) results. Cem. Concr. Res. 2004, 34, 537–545. [Google Scholar]
- Khanzadeh Moradllo, M.; Sudbrink, B.; Hu, Q.; Aboustait, M.; Tabb, B.; Ley, M.T.; Davis, J.M. Using micro X-ray fluorescence to image chloride profiles in concrete. Cem. Concete Res. 2017, 92, 128–141. [Google Scholar] [CrossRef]
- Gottlieb, C.; Millar, S.; Günther, T.; Wilsch, G. Revealing hidden spectral information of chlorine and sulfur in data of a mobile Laser-induced Breakdown Spectroscopy system using chemometrics. Spectrochim. Acta Part B At. Spectrosc. 2017, 132, 43–49. [Google Scholar] [CrossRef]
- Perkowski, Z.; Szweda, Z. The “Skin Effect” Assessment of Chloride Ingress into Concrete Based on the Identification of Effective and Apparent Diffusivity. Appl. Sci. 2022, 12, 1730. [Google Scholar] [CrossRef]


| Series | Mixture ID. | Sand (0–2) * mm [kg/m3] | Gravel (2–8) * mm [kg/m3] | Gravel (8–16) * mm [kg/m3] | ISP Slag [kg/m3] | Cement [kg/m3] | Additives [kg/m3] | w/c |
|---|---|---|---|---|---|---|---|---|
| 1 | C1 | 722 | 512 | 2271 | - | 681 | - | 0.5 |
| C2 | ||||||||
| C3 | ||||||||
| C4 | ||||||||
| C5 | ||||||||
| 2 | C6 | 368 | 1.84 *** | 0.4 | ||||
| C7 | ||||||||
| C8 | ||||||||
| 3 | SCC1 | - | 2308 | 580 | 2 *** | 0.3 | ||
| SCC2 | - | 2257 | 579 | 1 *** | 0.3 | |||
| SCC3 | - | 2198 | 555 | 1.5 *** | 0.3 | |||
| SCC4 | - | 2187 | 508 | 1 *** | 0.4 | |||
| 4 | SCCs0 | 750 | 570 | 300 | 0 | 450 | 13.5 *** 1.8 ***** | 0.4 |
| SCCs25 | 562.5 | 217.5 | ||||||
| SCCs50 | 375 | 435 | ||||||
| SCCs75 | 187.5 | 652.5 | ||||||
| SCCs100 | - | 870 | ||||||
| 5 | CP1 | 580 | 671 ** | 633 ** | 550 | 6.2 *** | 0.3 | |
| CP2 | 800 | 800 | - | 260 | 0.3 | |||
| 6 | HSC1 | 580 | 671 ** | 633 ** | 225 **** | 480 | 7.49 *** | 0.2 |
| Mixture ID | Type of Cement | Compressive Strength [MPa] | Volume Weight [kg/m3] | Porosity [%] |
|---|---|---|---|---|
| C1 | CEM I 42.5 R * | 54.2 | 2271 | 12 |
| C2 | CEM II/B-V 32.5 R * | 45.8 | 2241 | 10 |
| C3 | CEM III/A 42.5 N-LH/HSR/NA * | 49.5 | 2269 | 7 |
| C4 | CEM I/ N/SR3/NA * | 58.4 | 2258 | 9 |
| C5 | CEM IV/B (V) 32.5 R–LH/NA | 46.5 | 2280 | 10 |
| C6 | CEM I 42.5 R | 62.4 | 2309 | 9 |
| C7 | CEM III/A 42.5 N-LH/HSR/NA * | 63.9 | 2273 | 9 |
| C8 | CEM III/A 42.5 N-LH/HSR/NA * | 56.9 | 2265 | 8 |
| SCC1 | CEM I 42.5 R * | - | 2308 | 9 |
| SCC2 | CEM III/A 42.5 N-LH/HSR/NA * | - | 2257 | 10 |
| SCC3 | CEM V/A (S-V) 32.5R-LH * | - | 2198 | 11 |
| SCC4 | CEM I 42.5 R * | - | 2187 | 12 |
| SCCs0 | CEM I 42.5 R * | 48.6 | 2320 | 8 |
| SCCs25 | CEM I 42.5 R * | 47.5 | 2370 | 8 |
| SCCs50 | CEM I 42.5 R * | 46.8 | 2470 | 7 |
| SCCs75 | CEM I 42.5 R * | 44.3 | 2520 | 9 |
| SCCs100 | CEM I 42.5 R * | 42.4 | 2620 | 10 |
| CP1 | CEM II 52.5 R * | 78.0 | 2493 | 10 |
| CP2 | CEM I 42.5 R | 58.3 | 2359 | 11 |
| HSC1 | CEM I 32.5 R * | 99.5 | 2530 | 6 |
| Constituent, % Mass | CEM I 42.5 R | CEM III/A 42.5 N-LH/HSR/NA | CEM V/A (S-V) 32.5R-LH | CEM I/N/SR3/NA | CEM IV/B (V) 32.5 R–LH/NA |
|---|---|---|---|---|---|
| SiO2 | 19.38 | 29.08 | 29.2 | 21.15 | 30.18 |
| Al2O3 | 4.57 | 6.30 | 9.5 | 3.93 | 11.92 |
| Fe2O3 | 3.59 | 1.37 | 2.8 | 5.14 | 4.72 |
| CaO | 63.78 | 48.82 | 49.3 | 63.34 | 41.95 |
| MgO | 1.38 | 4.36 | 2.4 | 1.28 | 1.72 |
| K2O | 0.58 | 0.73 | 0.0 | 0.39 | 1.43 |
| Na2O | 0.21 | 0.34 | 0.0 | 0.21 | 0.39 |
| Eq. Na2O | 0.59 | 0.82 | 1.3 | 0.47 | 1.33 |
| SO3 | 3.26 | 2.74 | 2.2 | 2.61 | 2.65 |
| Cl | 0.069 | 0.066 | 0.0 | 0.058 | 0.057 |
| Test ID. | Name | Parameter | Reference | Section |
|---|---|---|---|---|
| RCPT1 | Rapid chloride penetration test: AASHTO T 277 and ASTM C1202-97 | Equation (1), [9] | 3.1 | |
| RCPT2 | Rapid chloride penetration test: NT BUILD 492 (AgNO3 spray test applied) | Equation (2), [14] | 3.2.1 and 3.2.2 | |
| NSC1 | Migration in nonsteady conditions Modified NT BUILD 492 (method of fitting to a concentration curve) | Equation (3) [48] | 3.2.3 and 3.6 | |
| NSC2 | Migration in nonsteady conditions Modified NT BUILD 492 (calculated based on ) | Equation (3) [48] | 3.2.4 | |
| CPT | Chloride penetration test: NT BUILD 443 and ASTM C 1556 | Equations (4) and (5) [4,5] | 3.3 and 3.6 | |
| TD1 | Natural diffusion with t1 = (method of fitting to a concentration curve) | Equations (4) and (5) | 3.4 and 3.6 | |
| TD2 | Natural diffusion with t2 = (method of fitting to a concentration curve) | Equations (4) and (5) | 3.4 and 3.6 | |
| TDX | Thermodynamic model of migration Migration in nonsteady conditions t1 = 24 h and t2 = 48 ho | Equation (6) [41] | 3.5 and 3.6 |
| Series 1 | Test Duration (Days) | ||
|---|---|---|---|
| t1 | t2 | t3 | |
| 1 | 90 | 180 | - |
| 2 | 30 | 60 | - |
| 3 | 30 | 60 | - |
| 4 | 90 | 180 | - |
| 5 | 30 | - | - |
| 6 | 90 | 180 | 360 |
| MIXTURE ID. | Calculated Charge Q(C) | Diffusion Coefficient According to Equation (1)–RCPT1 | ||||||
|---|---|---|---|---|---|---|---|---|
| σ | ||||||||
| C6 | 1322 | 1474 | 1590 | 3.32 | 3.71 | 4.0 | 3.67 | 0.28 |
| C7 | 737 | 718 | 768 | 1.85 | 1.81 | 1.93 | 1.86 | 0.05 |
| C8 | 518 | 561 | 515 | 1.30 | 1.41 | 1.3 | 1.34 | 0.05 |
| SCC1 | 2345 | 1991 | 2139 | 5.89 | 5.01 | 5.38 | 5.42 | 0.36 |
| SCC2 | 250 | 316 | 297 | 0.63 | 0.79 | 0.75 | 0.72 | 0.07 |
| SCC3 | 108 | 125 | 106 | 0.27 | 0.31 | 0.27 | 0.28 | 0.02 |
| SCC4 | 2231 | 1877 | 2131 | 5.61 | 4.72 | 5.36 | 5.23 | 0.37 |
| CP1 | 352 | 366 | 364 | 0.89 | 0.92 | 0.92 | 0.91 | 0.01 |
| HSCC1 | 17.17 | 18.69 | 18.72 | 0.04 | 0.05 | 0.05 | 0.05 | 0.00 |
| Mixture ID | ||
|---|---|---|
| C6 | 9 | 0.38 |
| C7 | 25 | 0.1 |
| C8 | 35 | 0.32 |
| SCC1 | 28 | 0.012 |
| SCC2 | 9 | 0.2 |
| SCC3 | 7 | 0.055 |
| SCC4 | 20 | 0.042 |
| CP1 | 10 | 0.55 |
| Mix ID | Diffusion Coefficient Calculated (10−12 m2/s) | |||||||
|---|---|---|---|---|---|---|---|---|
| C1 | - | - | - | - | - | 1.36; (0.27) | 1.36; (0.87) | 1.36 |
| C2 | - | - | - | - | - | 4.40; (0.65) | 2.25; (0.83) | 2.14 |
| C3 | - | - | - | - | - | 1.2; (0.26) | 1.2; (2.6) | 0.46 |
| C4 | - | - | - | - | - | 9.46; (0.41) | 4.73; (0.56) | 4.73 |
| C5 | - | - | - | - | - | 2.25; (0.28) | 2.25; (1.37) | 2.25 |
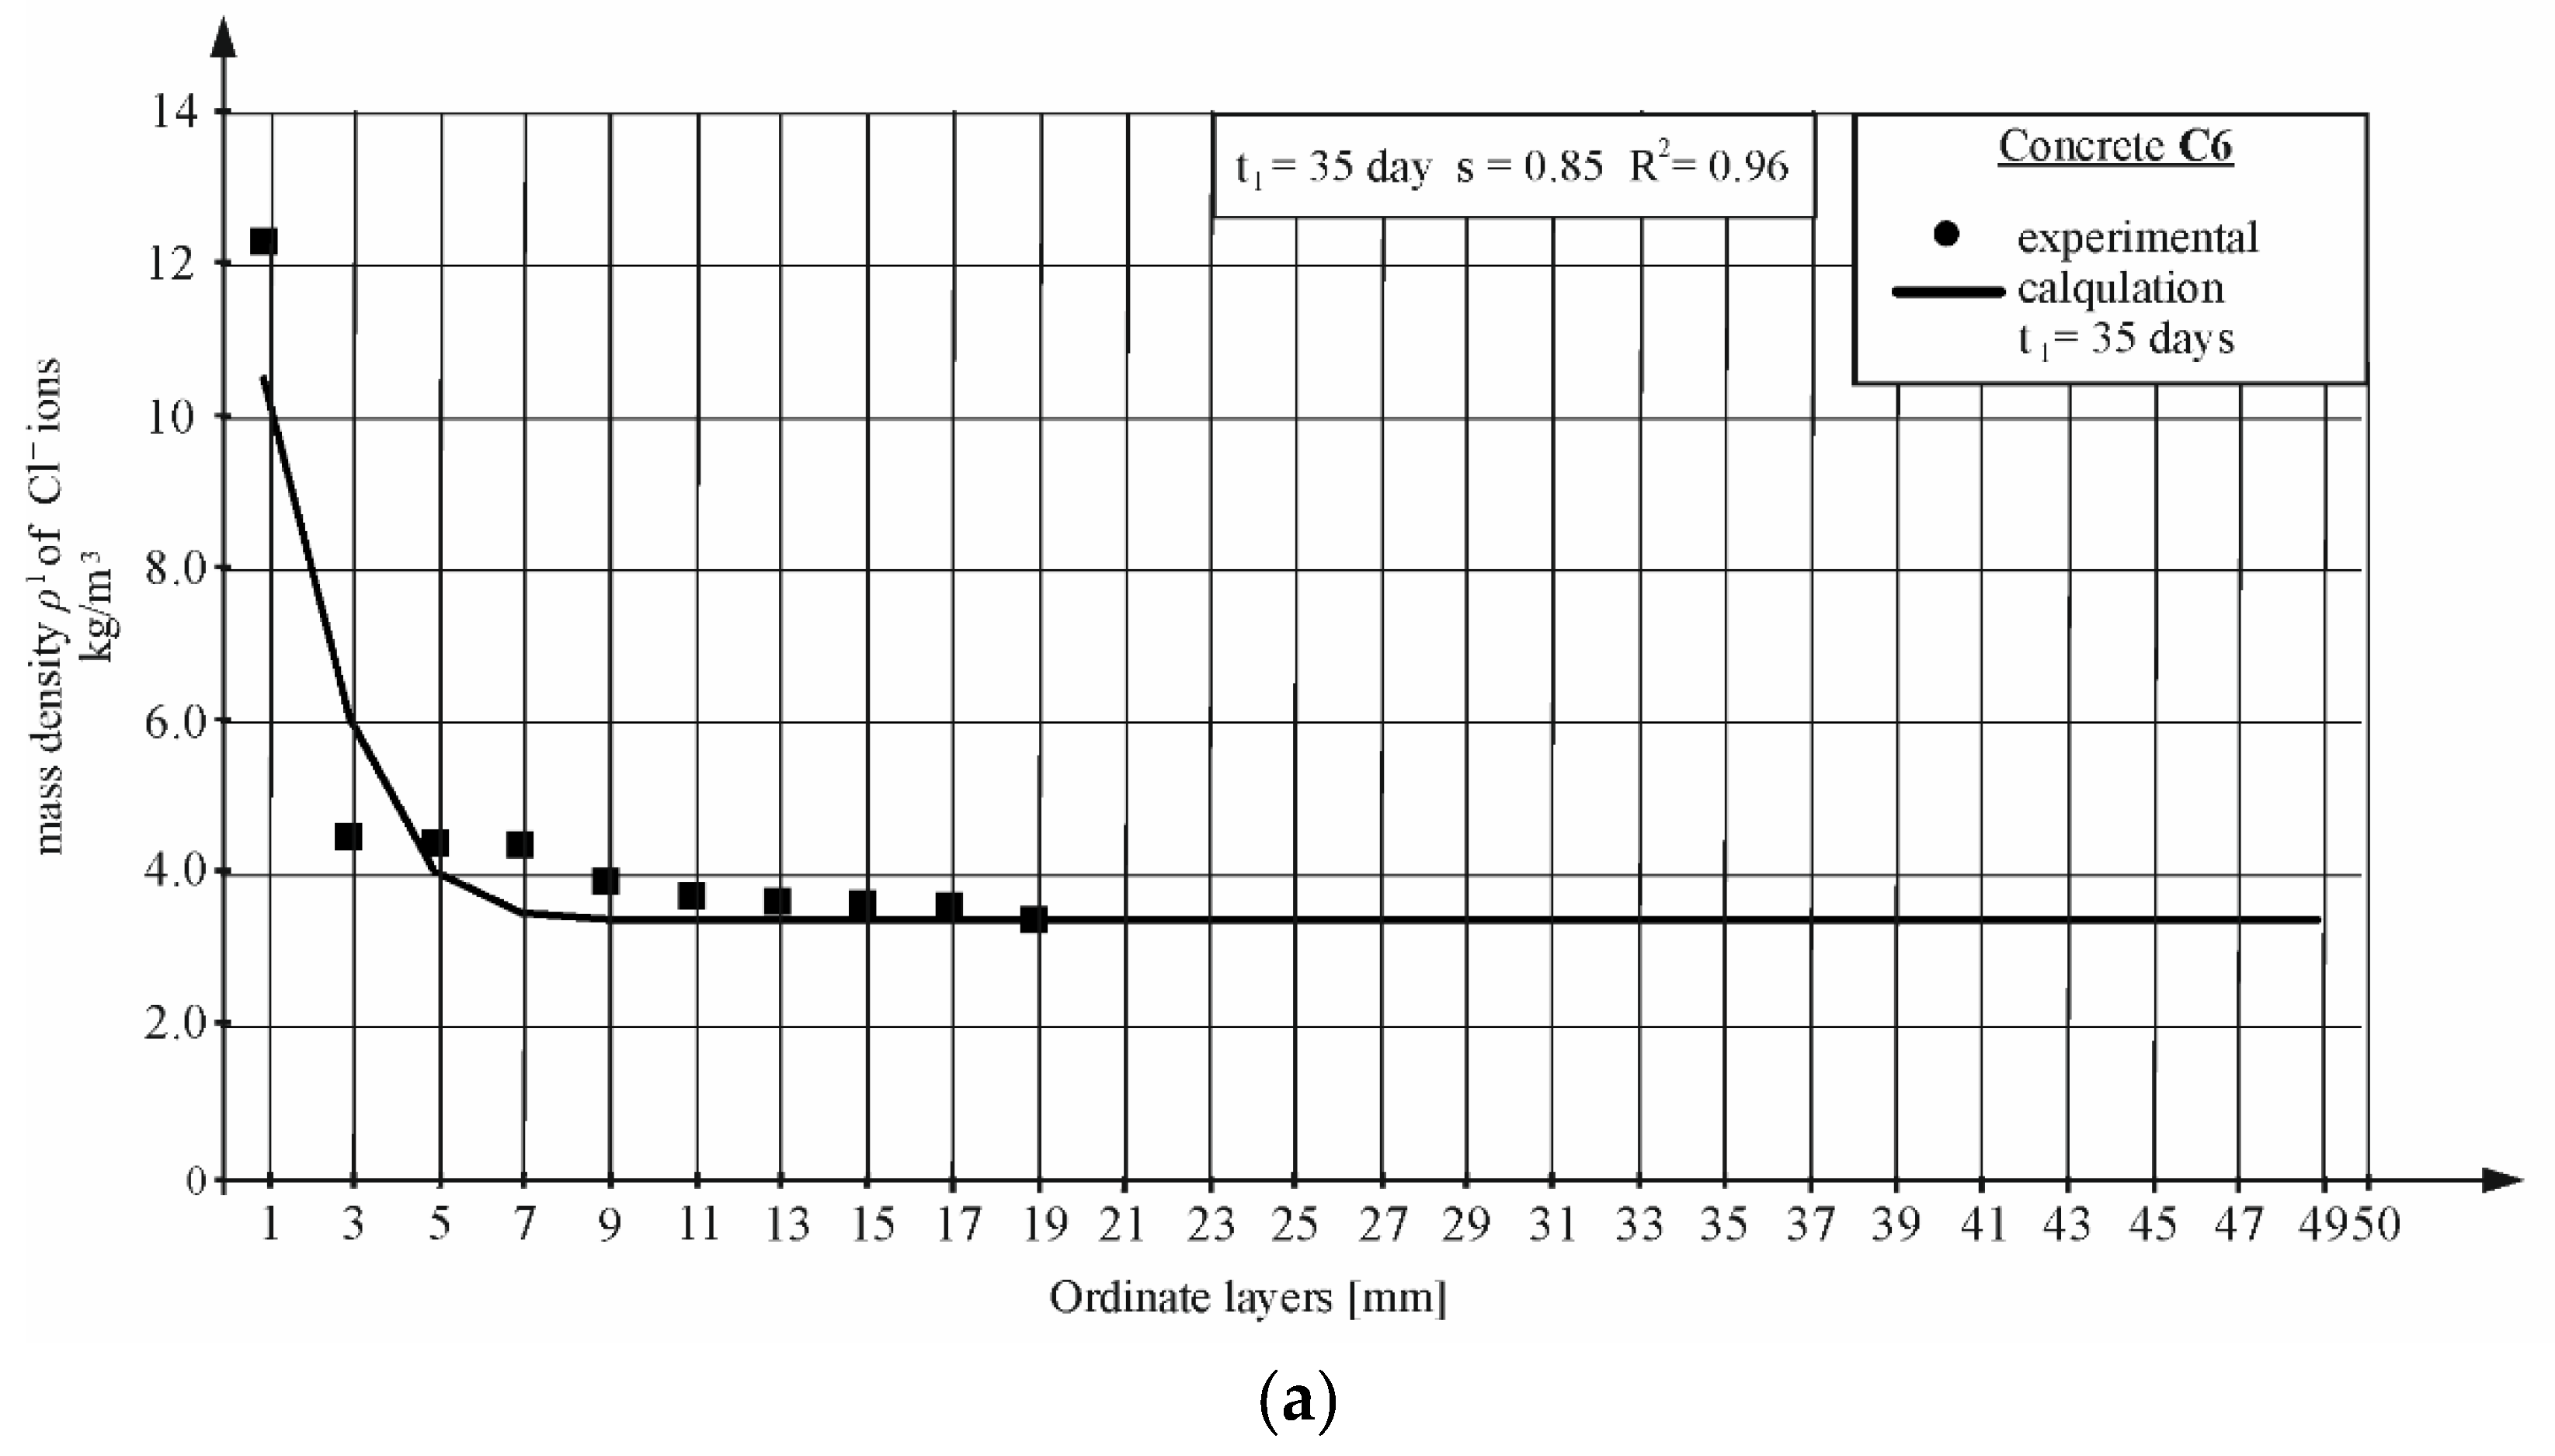
| C6 | 3.67; (0.28) | 0.48; (±0.06) | 12.5; (0.69) | 12.5; (0.69) | 1.20; (0.85) | 4.84; (0.34) | 2.42; (0.61) | 4.84 |
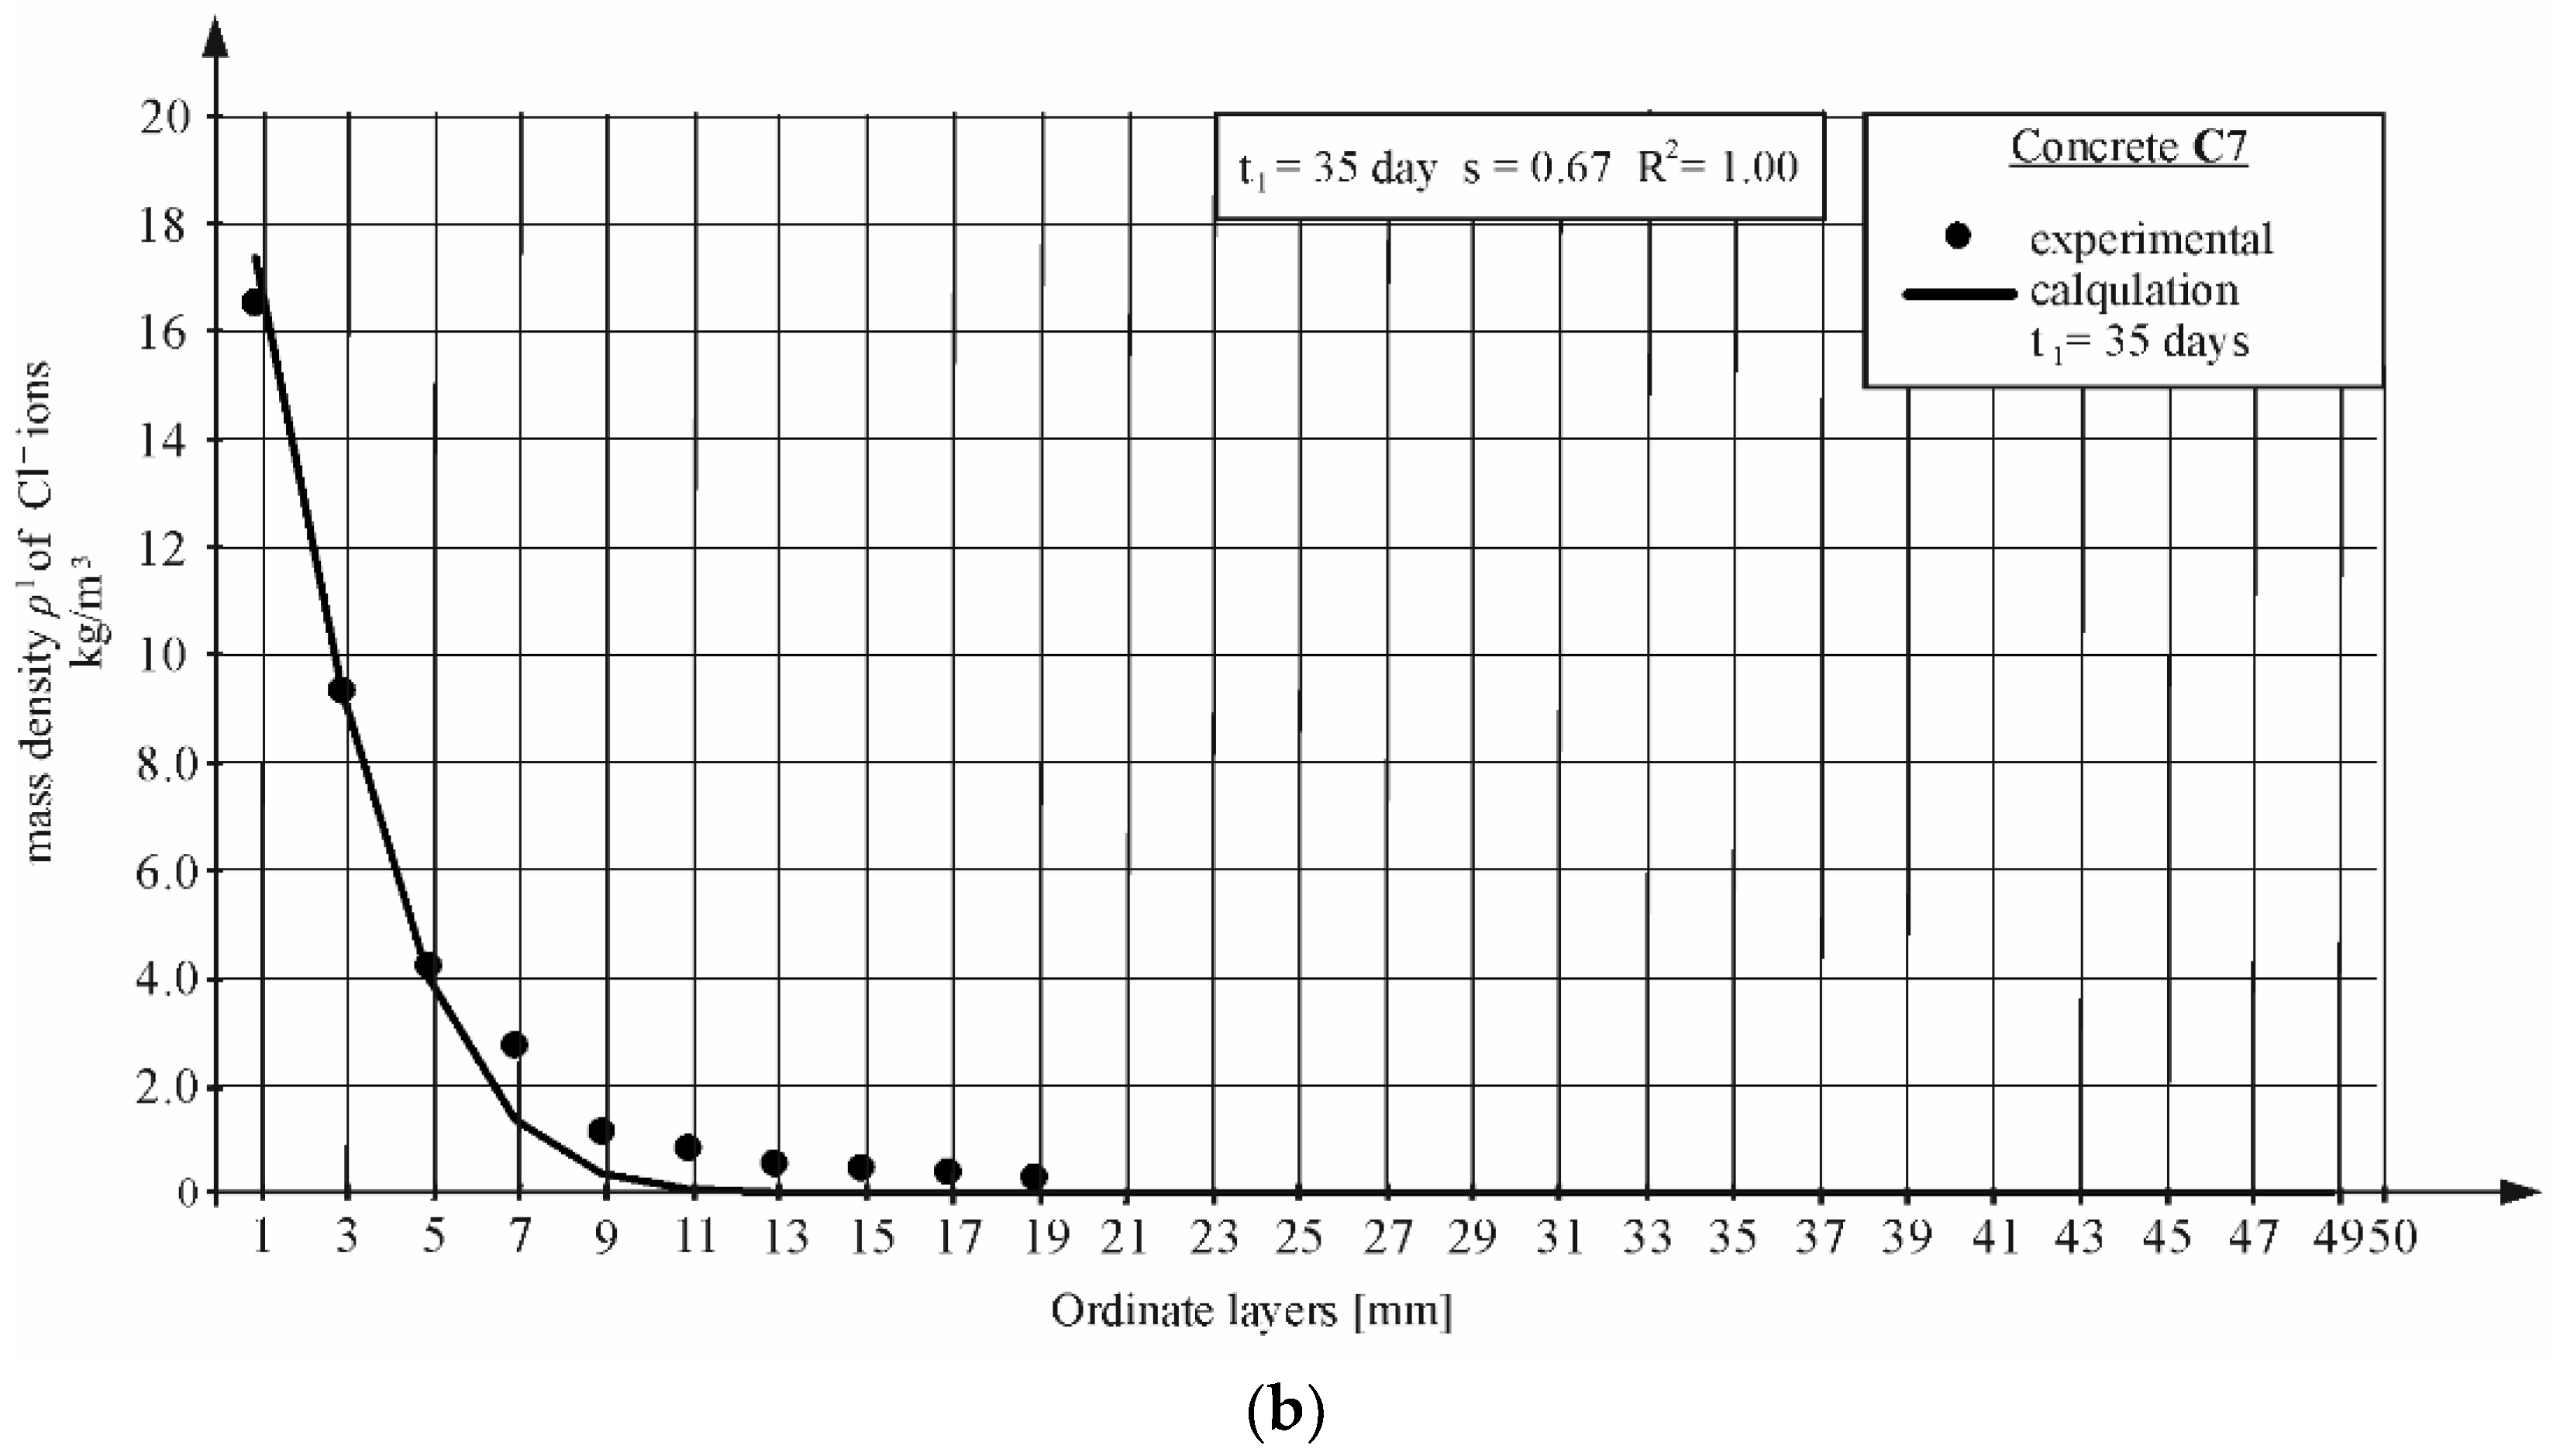
| C7 | 1.86; (0.05) | 1.41; (±0.06) | 130; (0.48) | 130; (0.48) | 2.32; (0.67) | 5.88; (0.54) | 4.52; (0.33) | 2.27 |
| C8 | 1.34; (0.05) | 2.0; (±0.06) | 16; (0.74) | 16; (0.74) | 2.96; (0.21) | 3.84; (0.25) | 1.92; (0.62) | 1.48 |
| SCC1 | 5.42; (0.36) | 1.59; (±0.06) | 160; (0.17) | 160; (0.17) | - | 4.20; (0.39) | 3.23; (0.56) | 3.23 |
| SCC2 | 0.72; (0.07) | 0.48; (±0.06) | 70; (0.09) | 70; (0.09) | - | 2,67; (0.19) | 3.47; (0.19) | 2.67 |
| SCC3 | 0.28; (0.02) | 0.36; (±0.06) | 9900; (0.00) | 9900; (0.00) | - | 3.65; (0.84) | 3.65; (0.69) | 3.65 |
| SCC4 | 5.23; (0.37) | 1.12; (±0.06) | 3000; (0.00) | 3000; (0.00) | - | 3.15; (0.44) | 2.56; (0.48) | 1.97 |
| SCCs0 | - | - | - | - | - | 0.98; (0.26) | 0.98; (0.78) | 0.98 |
| SCCs25 | - | - | - | - | - | 1.20; (0.29) | 1.07; (0.49) | 1.07 |
| SCCs50 | - | - | - | - | - | 1.21; (0.28) | 1.21; (0.49) | 1.21 |
| SCCs75 | - | - | - | - | - | 1.43; (0.19) | 1.20; (0.59) | 1.43 |
| SCCs100 | - | - | - | - | - | 3.08; (0.61) | 1.54; (0.43) | 1.54 |
| CP1 | 0.91; (0.01) | 0.54; (±0.06) | 7; (0.12) | 7; (0.12) | 1.44; (0.11) | 0.72; (0.36) | - | 0.72 |
| CP2 | - | - | - | - | 6.3; (1.93) | 3.31; (0.28) | - | 3.31 |
| HSC1 | 0.05; (0.00) | - | - | - | - | 0.32; (0.62) | 0.32; (0.87) | 0.32 |
Disclaimer/Publisher’s Note: The statements, opinions and data contained in all publications are solely those of the individual author(s) and contributor(s) and not of MDPI and/or the editor(s). MDPI and/or the editor(s) disclaim responsibility for any injury to people or property resulting from any ideas, methods, instructions or products referred to in the content. |
© 2023 by the authors. Licensee MDPI, Basel, Switzerland. This article is an open access article distributed under the terms and conditions of the Creative Commons Attribution (CC BY) license (https://creativecommons.org/licenses/by/4.0/).
Share and Cite
Szweda, Z.; Gołaszewski, J.; Ghosh, P.; Lehner, P.; Konečný, P. Comparison of Standardized Methods for Determining the Diffusion Coefficient of Chloride in Concrete with Thermodynamic Model of Migration. Materials 2023, 16, 637. https://doi.org/10.3390/ma16020637
Szweda Z, Gołaszewski J, Ghosh P, Lehner P, Konečný P. Comparison of Standardized Methods for Determining the Diffusion Coefficient of Chloride in Concrete with Thermodynamic Model of Migration. Materials. 2023; 16(2):637. https://doi.org/10.3390/ma16020637
Chicago/Turabian StyleSzweda, Zofia, Jacek Gołaszewski, Pratanu Ghosh, Petr Lehner, and Petr Konečný. 2023. "Comparison of Standardized Methods for Determining the Diffusion Coefficient of Chloride in Concrete with Thermodynamic Model of Migration" Materials 16, no. 2: 637. https://doi.org/10.3390/ma16020637