Article

A Multiscale Topographical Surface Analysis of High Entropy Alloys Coatings by Laser Melting

1
Laboratoire d’Automatique, de Mécanique et d’Informatique Industrielles et Humaines—LAMIH, University Polytechnique Hauts-de-France, CNRS, UMR 8201, 59313 Valenciennes, France
2
Belgian Ceramic Research Centre, 7000 Mons, Belgium
3
Bruker Nano Surface Division, 7 rue de la croix Martre, 91120 Palaiseaux, France
*
Author to whom correspondence should be addressed.
Materials 2023, 16(2), 629; https://doi.org/10.3390/ma16020629
Submission received: 17 November 2022 / Revised: 23 December 2022 / Accepted: 31 December 2022 / Published: 9 January 2023

Abstract

:
High Entropy Alloys (HEAs) coatings obtained by laser melting (LM) technique were studied through a multiscale topographical surface analysis using a focus variation microscope. The laser melting creates a multiscale topography from under-powder size (incomplete or complete powder melting) to upper-powder size (process conditions). The surface topography must be optimized because of the significant influence on friction and material transfer during sliding wear. The analyses were shown that different pre-melting zone interactions were present. Statistical analysis based on covariance analyses is allowed to highlight the different process melting scales. The best LM parameter values to minimize Surface Heterogeneity were laser power (Pw) of 55 W, laser exposition time (te) of 1750 µs, and distance between two pulses (dp) of 100 µm.

1. Introduction

Coatings are used for a long time to protect from wear, corrosion, and other environmental attacks. Some of them are toxic, like hard chromium, because to obtain this coating, the electrolyte baths commonly use hexavalent chromium, which is toxic to humans [1]. The High Entropy Alloys (HEAs) are being used to manufacture coatings. Yeh et al. [2] defined the HEAs as a mix of at least five elements in an equimolar ratio with an atomic concentration going from 5 to 35 % in 2004. Cantor et al., [3] developed multi-component alloys in 2004 by induction melting pure elements in equal atomic proportions, among which the most significant is a five-component Fe20Cr20Mn20Ni20Co20 alloy that forms a single FCC solid solution with dendritic solidification. Therefore, using HEAs like coatings on finished elements appears as an alternative for industrial applications.
Ye X. et al., [4] studied the AlxCoCrNiCuFe coating deposited by laser cladding in 2011. They obtained HEAs coating nanostructured with BCC and FCC crystal structure, finding the addition of aluminum elemental promoted the transition of FCC to BCC structure. Additionally, Ye Q. et al., [5] studied HEAs coating with a nominal composition of CrMnFeCoNi fabricated by laser surface alloying in 2017; they have found that this coating shows excellent properties with a combination of corrosion resistance, ductility, and strength.
Several other studies on different coating compositions were published for HEAs coatings by laser cladding like AlCoCrxFeNi [6], Al2CrFeNiMox [7], CoCrBFeNiSi [8], AlCoCrFeNiTix [9], and FeNiCoAlCu [10]. The laser cladding technique obtains thick coatings of about 1–5 mm. In addition, it was reported in other techniques to obtain HEAs coatings such as mechanical alloying [11], plasma spraying [12], high-velocity oxy-fuel (HVOF) thermal spray [13], and Physical Vapour Deposition (PVD) [14], among others.
The manufacture of HEAs bulk was possible through the selective laser melting (SLM) technique [15]. This technique is currently used for the powder bed fusion technique of metal additive manufacturing, which allows for obtaining functional components with high structural integrity at a low cost and is compatible with various materials [16]. This technique can be used for large surfaces and thicknesses. Thus, the coatings can be synthesized with laser melting from mono-elementary high-purity powder is cheaper, less energetic, and faster. However, there is a challenge to the surface: we want to control the melting quality.
It is widely known that the SLM produces surfaces with high roughness, and generally, the parts manufactured by this technique require a post-finishing process. The commonly reported roughness values (Ra) for components manufactured by SLM are mostly between 10 μm and 20 μm, depending on the material, the processing parameters of the SLM, and the orientation of the construction [17,18,19,20]. Tonelli et al. [17] evaluated the influence of laser energy on the surface roughness for manufacturing CoCr alloy by SLM in 2020. They found that low energy (50–100 W) applied to the powder bed produces surfaces with high roughness (max Ra = 13 µm), while at high laser energies (>150 W), the surfaces are smoother (Ra = 2.5–3 µm). Several authors [17,21,22] agree that when low laser energy is used, the flow of the melt is unstable, producing an incomplete wettability and dispersion of the melt during the process; this leads to a discontinuous morphology.
Furthermore, it was found that during this process, spatter ejection of the molten material from the pool could be produced, causing cavities and roughness. The ejection of splashes is because the laser plume tends to expel the molten material from the liquid pool. These expelled particles solidify before falling onto the bed of powder and react with the oxygen in the atmosphere, which would change its composition, for example, by forming oxides [17]. Therefore, when the deposition parameters are not correctly selected, the unmelted powders and large drops may be found that solidify quickly and are larger than the diameter of the laser spot. These large forming drops are extremely undesirable and are also known as the balling process [17,21,23,24,25].
Wang et al. [19] also studied a CoCr alloy in 2017 obtained by SLM, finding that the number of particles expelled rises as the laser energy increases. In addition, it has classified the splashes into three types of morphology (spherical splashing, coarse spherical splashing, and irregular splashing) according to their origin either from recoil pressure, Marangoni effect, and heat effect in the molten pool. They have also shown that the ejected particles have almost the same initial composition but higher O, Si, and C contents.
Another problem found in the SLM process is the denudation of the substrate, which is the depletion of the powders in the regions surrounding the laser track [17,19,25,26]. These authors agree that the above phenomena are strictly related to the process parameters. The stability of the melting pool is dominated by the balance between splash ejection due to the laser plume and Marangoni convection, which tends to propagate the molten material from the center of the melting pool to the outer regions.
Researchers have analyzed these alloys to obtain better mechanical properties [27]. Coatings are the link between a piece and an external environment. Thus, it is also part of the piece which submits more degradation: corrosion and wear. The surface topography of coatings affects the behavior of piece in-service conditions. Many peaks and valleys corresponding to high roughness will directly impact tribological properties like wear resistance. During the sliding wear of rough surfaces, the peaks will have a higher concentration of stress, producing breakage and generation of wear particles. Therefore, if there is a high roughness, the coatings will be worn quickly and heterogeneously.
This work was used selective laser melting techniques to obtain HEAs coatings composed of FeCrAlMnMo. Laser melting surface treatment promotes a non-homogeneous surface area. Tribological properties are influenced by surface roughness. Therefore, it becomes essential to assess the topography of the surface and analyze a large part of the piece coated. At the same time and with a unique measurement, we want to observe the roughness peaks (µm order) and the general roughness of the piece (cm order). These requirements imply finding a new method with a considerable inspection space, an acceptable resolution, and fast analysis.
We suggest characterizing melting quality by measuring and analyzing surface topography. However, the quantitative surface quality measurement requires a high amplitude measurement over a relatively wide spatial range of investigation. The Brüker society has innovated a new focus variation apparatus to solve this metrology demand. This bench can observe topography (with a lateral scale from 0.3 µm to 80 mm and a vertical scale from 0.01 µm to 300 µm) without filling in the blanks with outliers. It is a common problem for other optical measurement techniques with steep grades of roughness. The measure processing associated with multi-scale analysis highlights a topographical parameter. This parameter quantifies the melting quality for manufacturing HEAs coating quality, i.e., the part of the surface to be subjected to a total transformation. Therefore, with the focus variation methodology, we can create a multi-scale morphological indicator that quantifies the microtextural homogeneity of the HEAs coating manufacturing.

2. Experimental Process

2.1. Materials and Methods

The powders used to deposit the HEAs coatings were prepared with an ink of a mix of five mono-element industrial powders (>99% of purity) of Alpha Easar (Haverhill, MA, USA). The average granulometry of elements was for Fe: <10 µm, Al: 7–15 µm, Mn: <44 µm, Cr: <44 µm, and Mo: 3–7 µm. The curve in Figure 1 shows the grain size distribution of the mix realized from commercial mono-elementary powder, to confirm the grain size is more homogeneous after mixing.
The ink is 80% by mass of dry matter (i.e., 80% wt. powder/20 wt. water). The mixing of the metallic powders, water, and various organic materials (binder, dispersant, and antifoam) was conducted via a simple propeller agitator for 30 min. For the ink spray-coating, two layers are successively applied at a flow rate of 3 mL/min and with a constant gun speed of 100 mm/s.
Figure 2 highlights that, before laser melting, any mono-element powder interacted with another. Five different peaks show corresponding metallic elements, which are like monophasic crystals.
The HEAs coatings were deposited on a steel substrate (S235JR) by a spray-coating technique after treatment with Laser Melting (LM). The ink is created by mixing powders (initial mixing: Fe28Cr22Al20Mn19Mo11) with aqueous and organic solutions. The ink is spread with a thickness of 100 µm, and the melting is performed with a SLM machine by two orthogonal passes of the laser.
The SLM machine used in this study was a RenishawAM125 (Renishaw, Wooton-under-Edge, Gloucestershire, UK). It uses a high-power (Pmax = 200 W (cw)) fiber laser (λ = 1070 nm) and comprises a building chamber of 125 × 125 × 100 mm3 size, which is swept by argon to maintain an inert gas environment. The main parameters for fine-tuning processing are illustrated in Figure 3: Laser power (Pw); Laser exposition time for each point (te); (d) hatch space (HS), defined as the distance between two consecutive parallel laser tracks; and (e) distance between two pulses (Pd), defined as the distance between two consecutive laser spot area irradiated. Table 1 summarizes the deposition conditions.
Morphological characterization and chemical composition were analyzed by scanning electron microscopy (SEM) and energy dispersive spectroscopy (EDS). The phase constituents of the coating were also analyzed by X-ray diffraction (XRD) with Cu target radiation (λ = 0.154060 nm). Hardness and reduced elastic modulus were determined by nanoindentation test with a diamond Berkovich indenter, using a Hysitron Triboindenter (TI980, Eden Prairie, MN, USA). The profile tests on the cross-section of the coating were performed in a mode of quantitative ultra-high-speed mechanical property mapping (XPM). This technology can perform six measurements/s. For each coating, three indentation arrays of 10 × 10 were carried out to a load of 2 mN. The spacing between indentations was 2 μm (i.e., 10–20 times the indentation depth) [28]. The hardness and elastic modulus were determined using the standard Oliver and Pharr method [29].

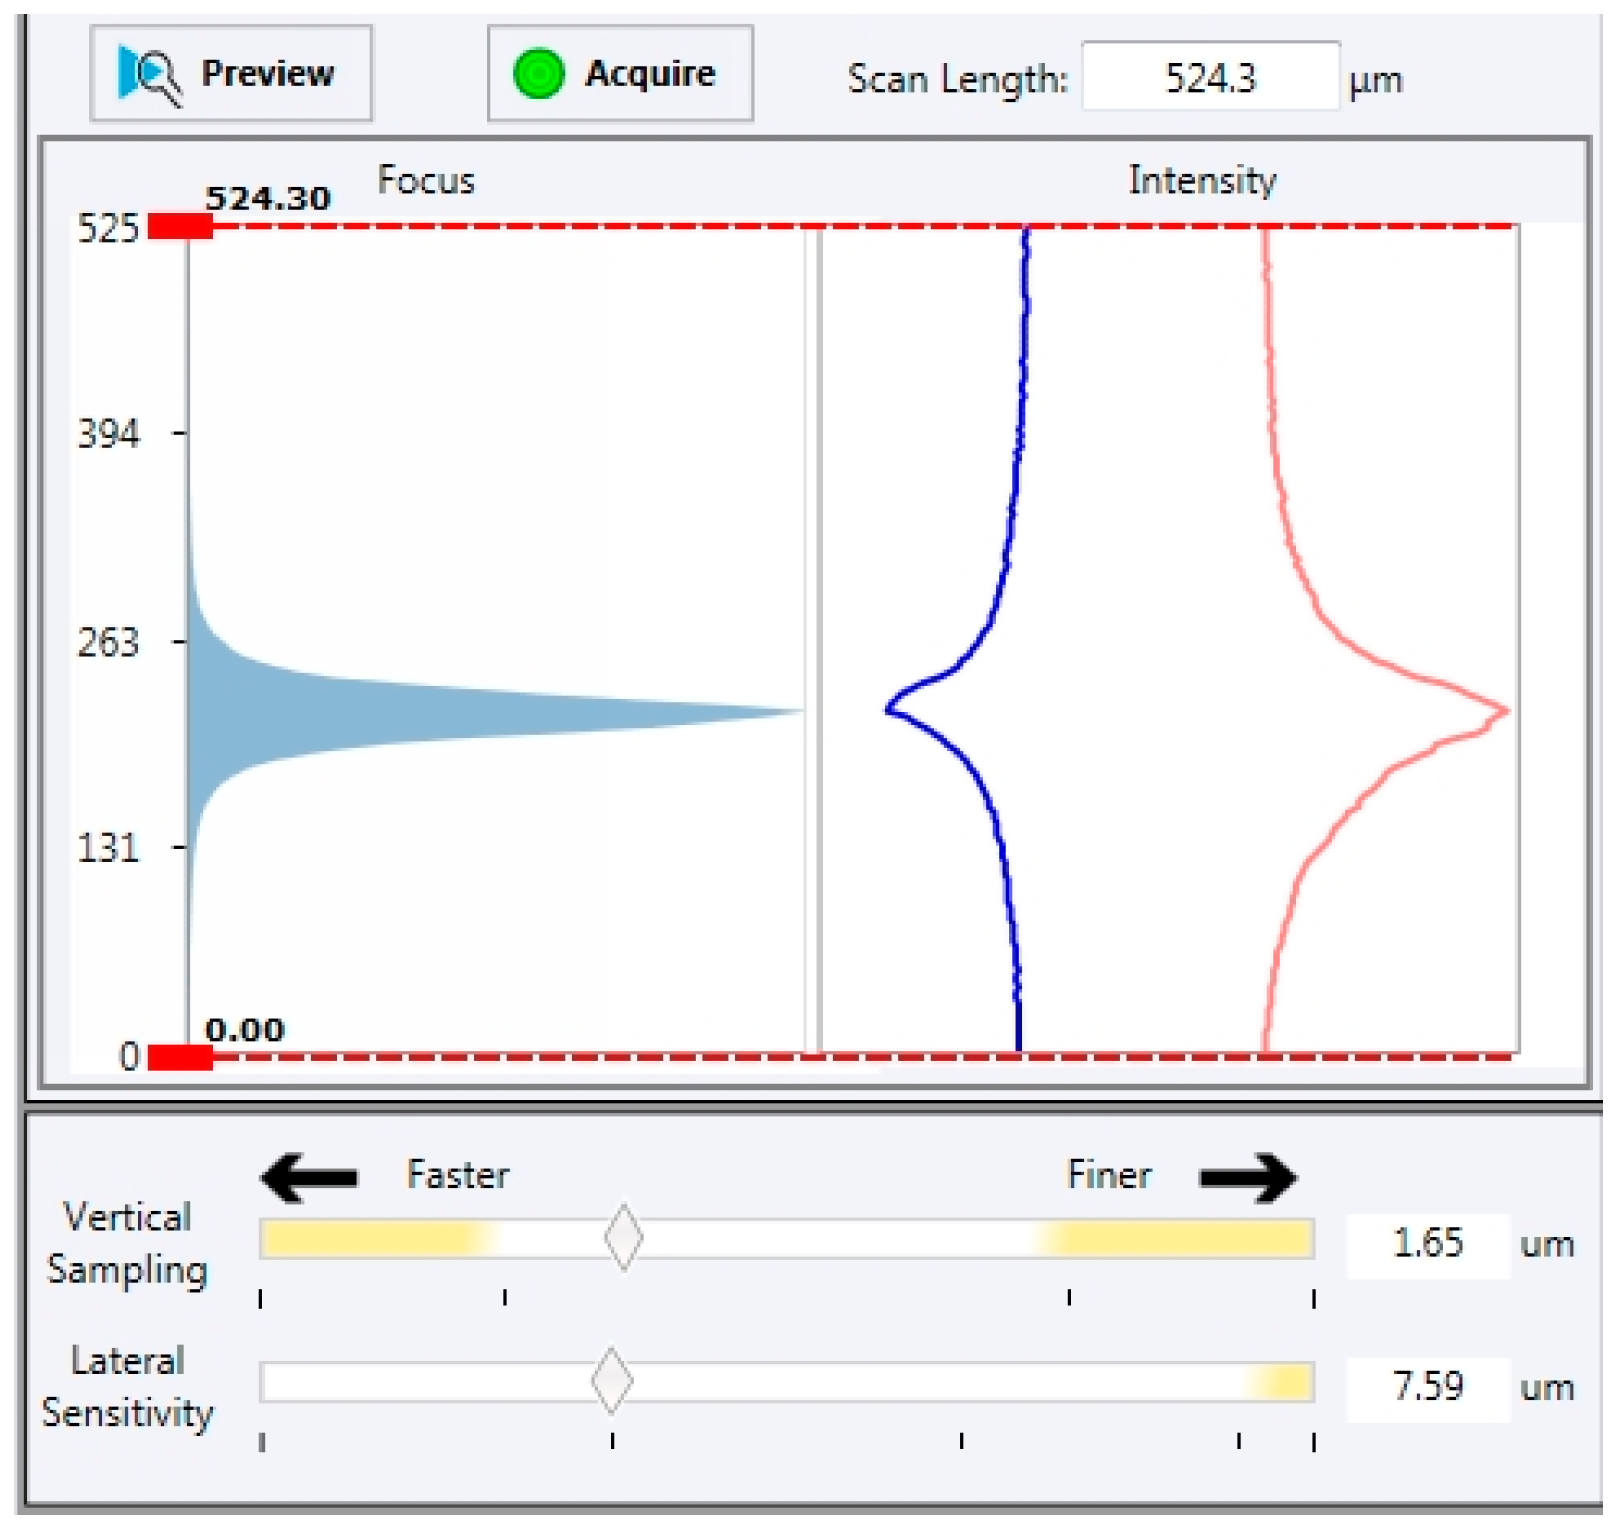
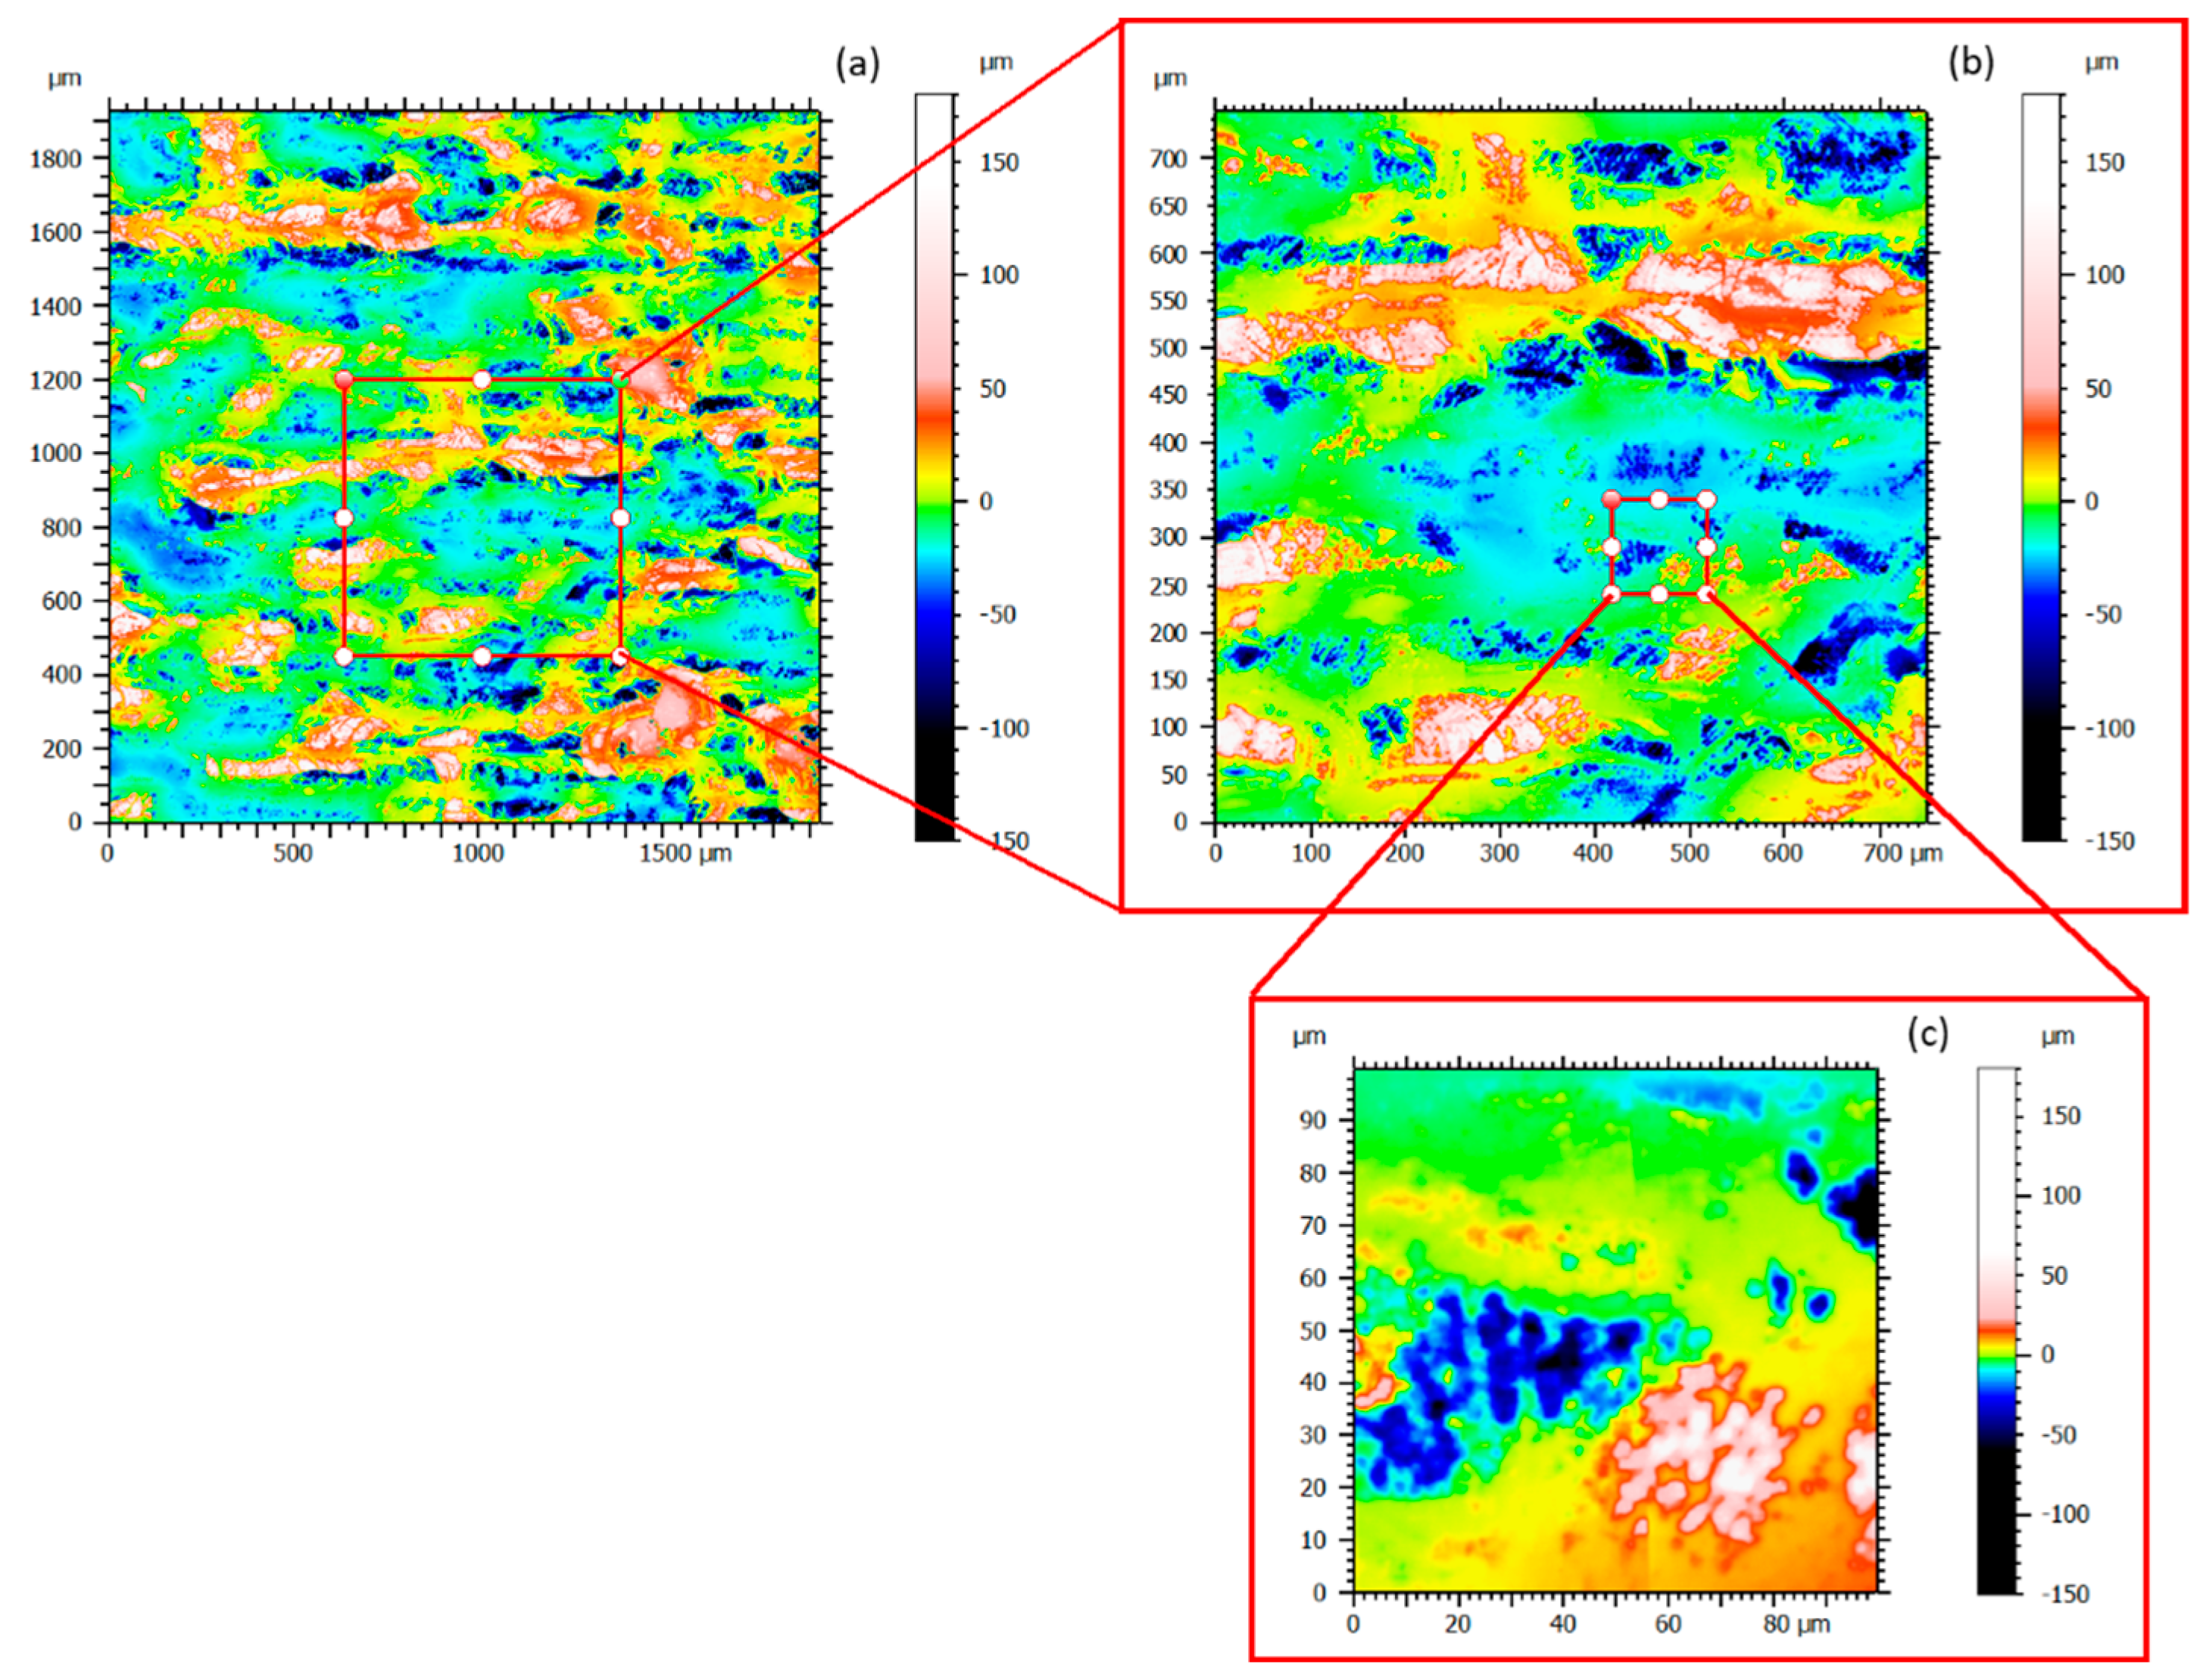
2.2. Topographic Analysis

The surface topographic study was realized using a focus variation microscopy of Bruker (Contour LSK, Bruker, Eden Prairie, MN, USA). Using a focus variation microscopy (Figure 4) allows acquiring very rough surfaces that other technologies (interferometric microscopy) do not permit obtaining [30].
In most optical techniques, the lateral resolution of the lenses is a limiting factor in the measurement. It is especially true when measuring surfaces with steep slopes; there is a rapid loss of lateral resolution (sparrow criteria). The focus variation technique is different and uses both the lens properties (lateral resolution of the lenses and minimal depth of field) and the lateral sensitivity of the camera. The topography computation principle calculates the standard deviation of the grey levels of the image acquired in small local areas. Being based on image analysis, light management in the focus variation is strategic in acquiring topographic information. Therefore, Bruker developed tools that allow the user to know more or less the saturation quality of the CCD camera. This graphical interface allows the user to modulate the sample lighting by using the light ring for indirect illumination or the coaxial light for direct illumination (Figure 5).
The graphical interface gives access to relevant topographic information where other techniques fail due to a lack of information or are much slower. The use of nearby neighbors for height determination provides a more efficient resolution. This technique associates a map of standard deviations of grey levels between close neighbors (quality map), informing the user of the relevant topographic result obtained. The Bruker prototype gives a topographic map without bias to ensure topographical signal richness. Thus, it is possible to filter or modulate the quality map according to the scales we want to reveal for the study later. Then, the stitching method is used to widen the topographic field of view. This mathematical technique assembles the individual topography into a single global one. It creates a wide field of view while maintaining a high spatial resolution. A wide topographic field is obtained to analyze all spatial scales.
Figure 6a shows a topography measurement by stitching 2 mm × 2 mm from the contour LSK Brüker. Such a critical measure gives a general state of the sample’s surface (ripples, large clusters, bumps, and shape, etc.). Although this surface measurement is enormous, some zones stand out like droplets around a hundred or a few micrometers in diameter. Zoom in a bump zone is performed and the extracted zone of 0.75 mm × 0.75 mm (Figure 6b) can still be studied thanks to the precision of the apparatus. A new topographical image is highlighted on this first zoom (Figure 6b). The big clusters that appear first as homogeneous are finally a bump with clusters on the surface: they are not smooth. Therefore, to try to understand what is shown exactly, another zoom is conducted and the extracted zone measured as 100 µm × 100 µm (Figure 6c). Instead of the enormous scale change, the topography obtained is still being studied. When the last extracted zone (Figure 6c) is compared to the initial topography without any zoom (Figure 6a), some clusters become visible, whereas they were almost invisible before extracting a smaller zone. The asperities were measured successfully, but for a more general observation (a few mm2), they were not observed because of the scale difference between the stitched surface and the smaller element.

3. Results and Discussion

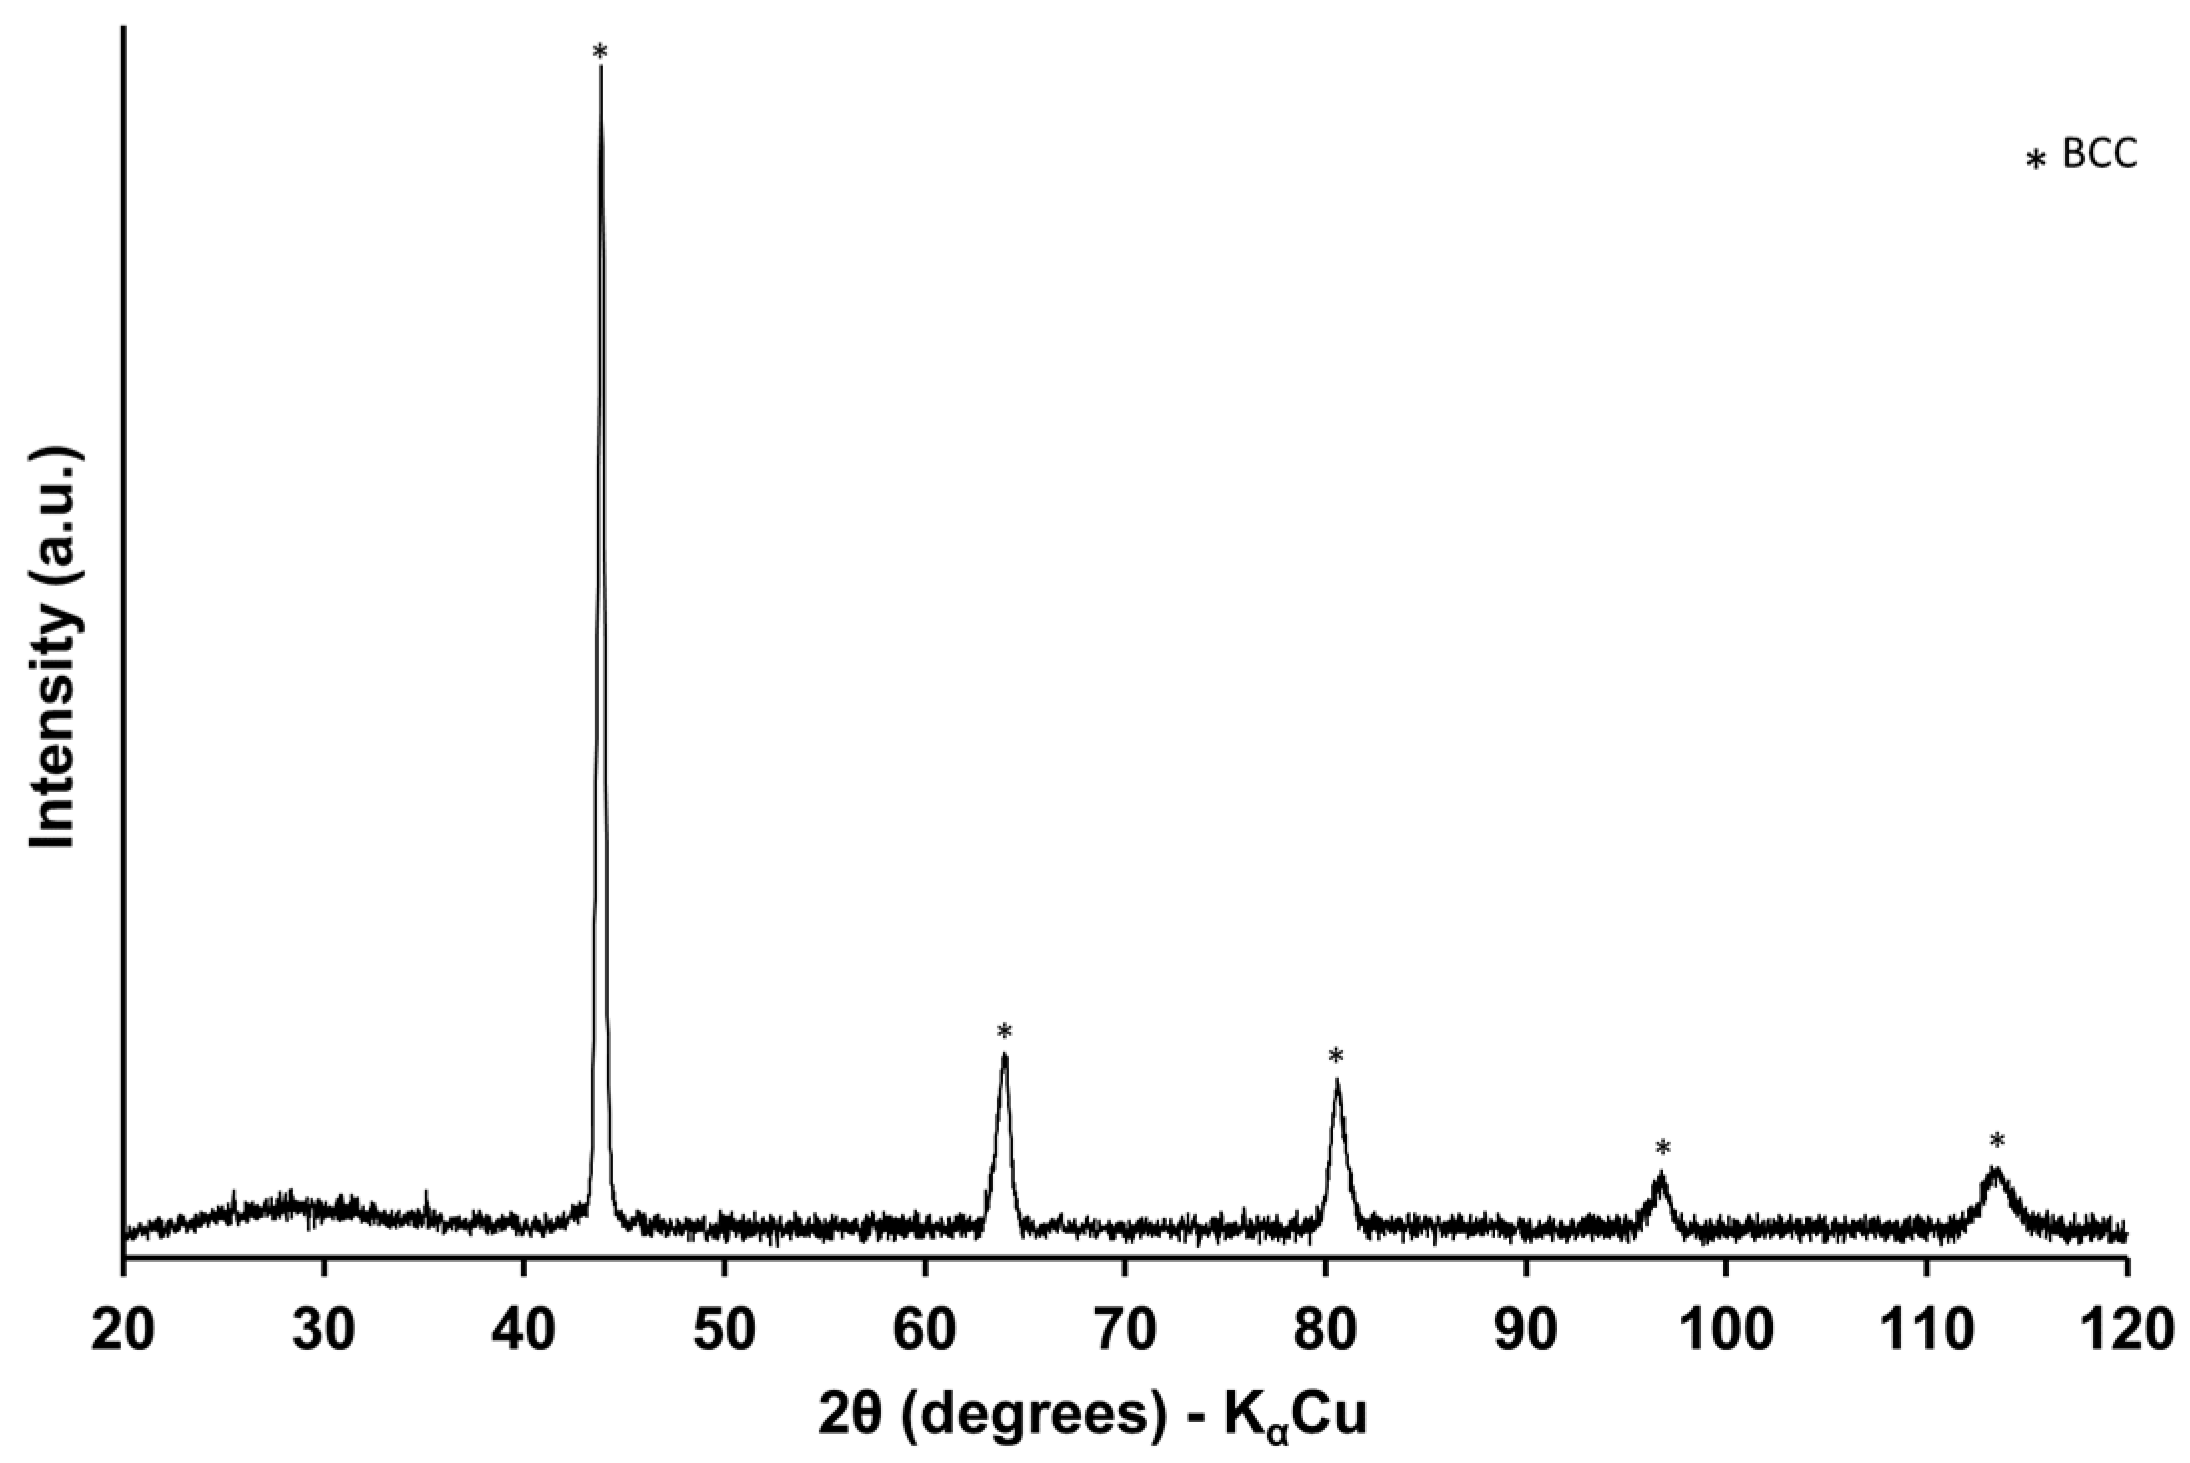
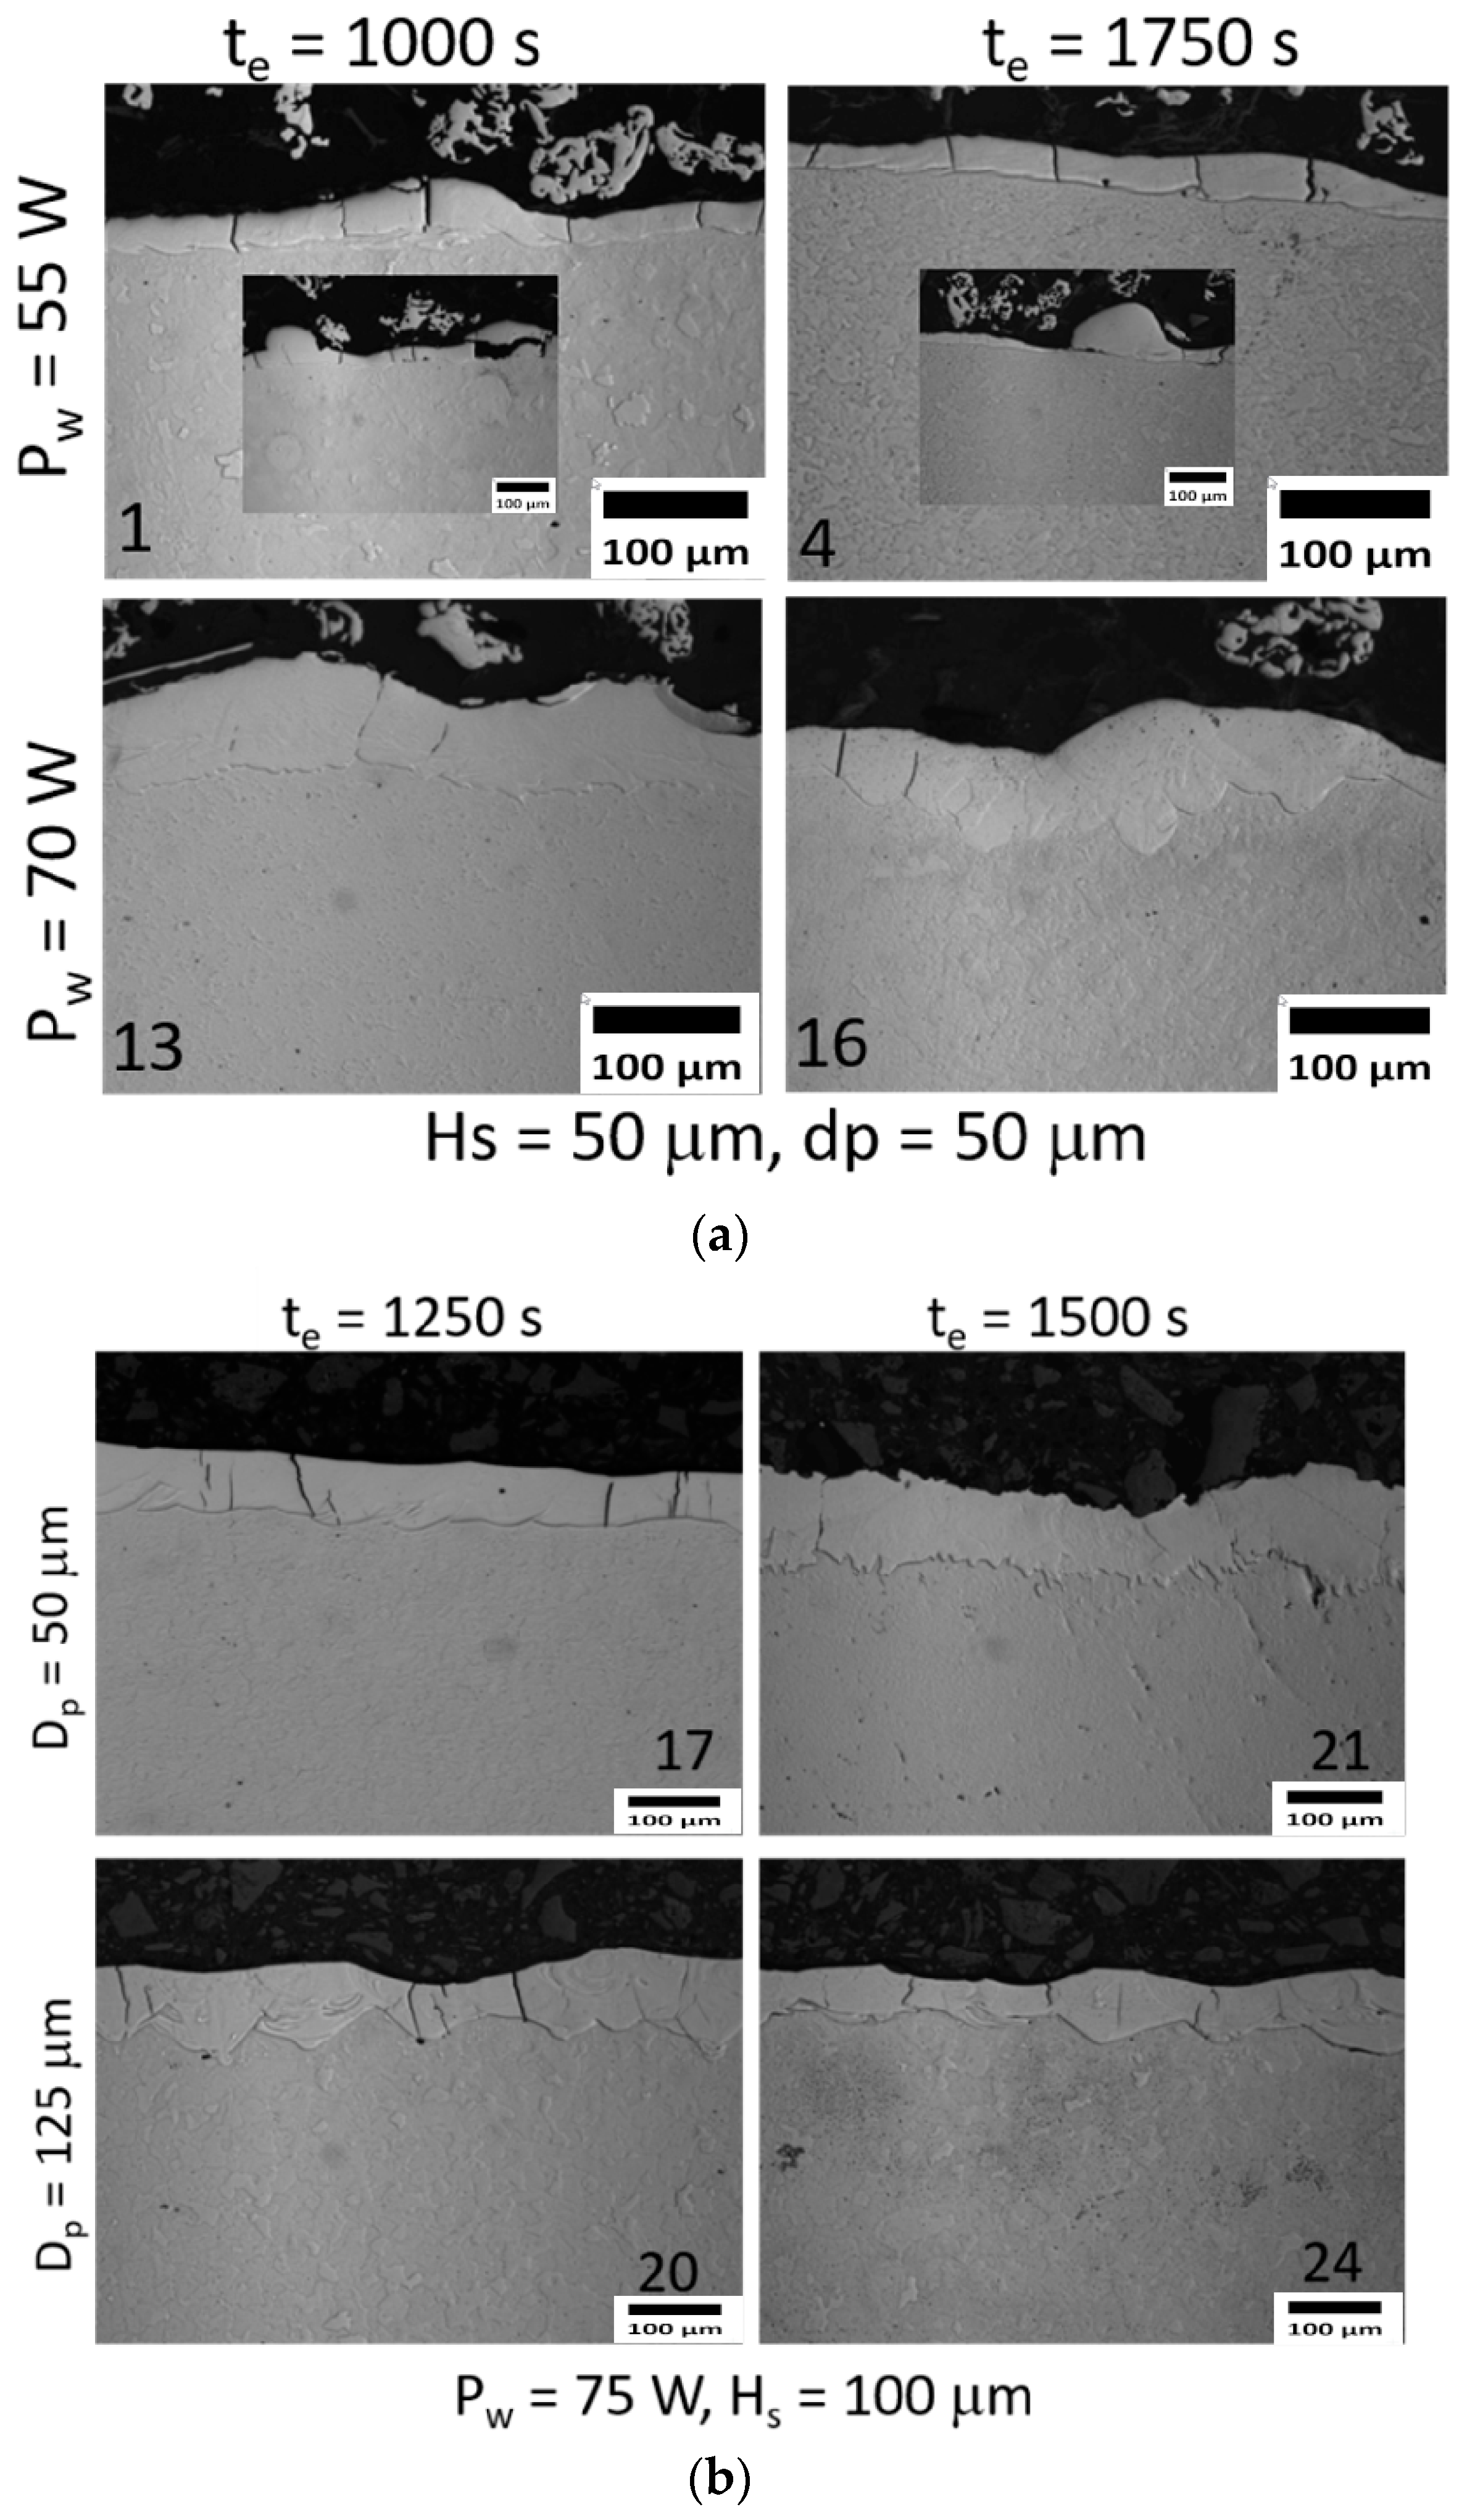
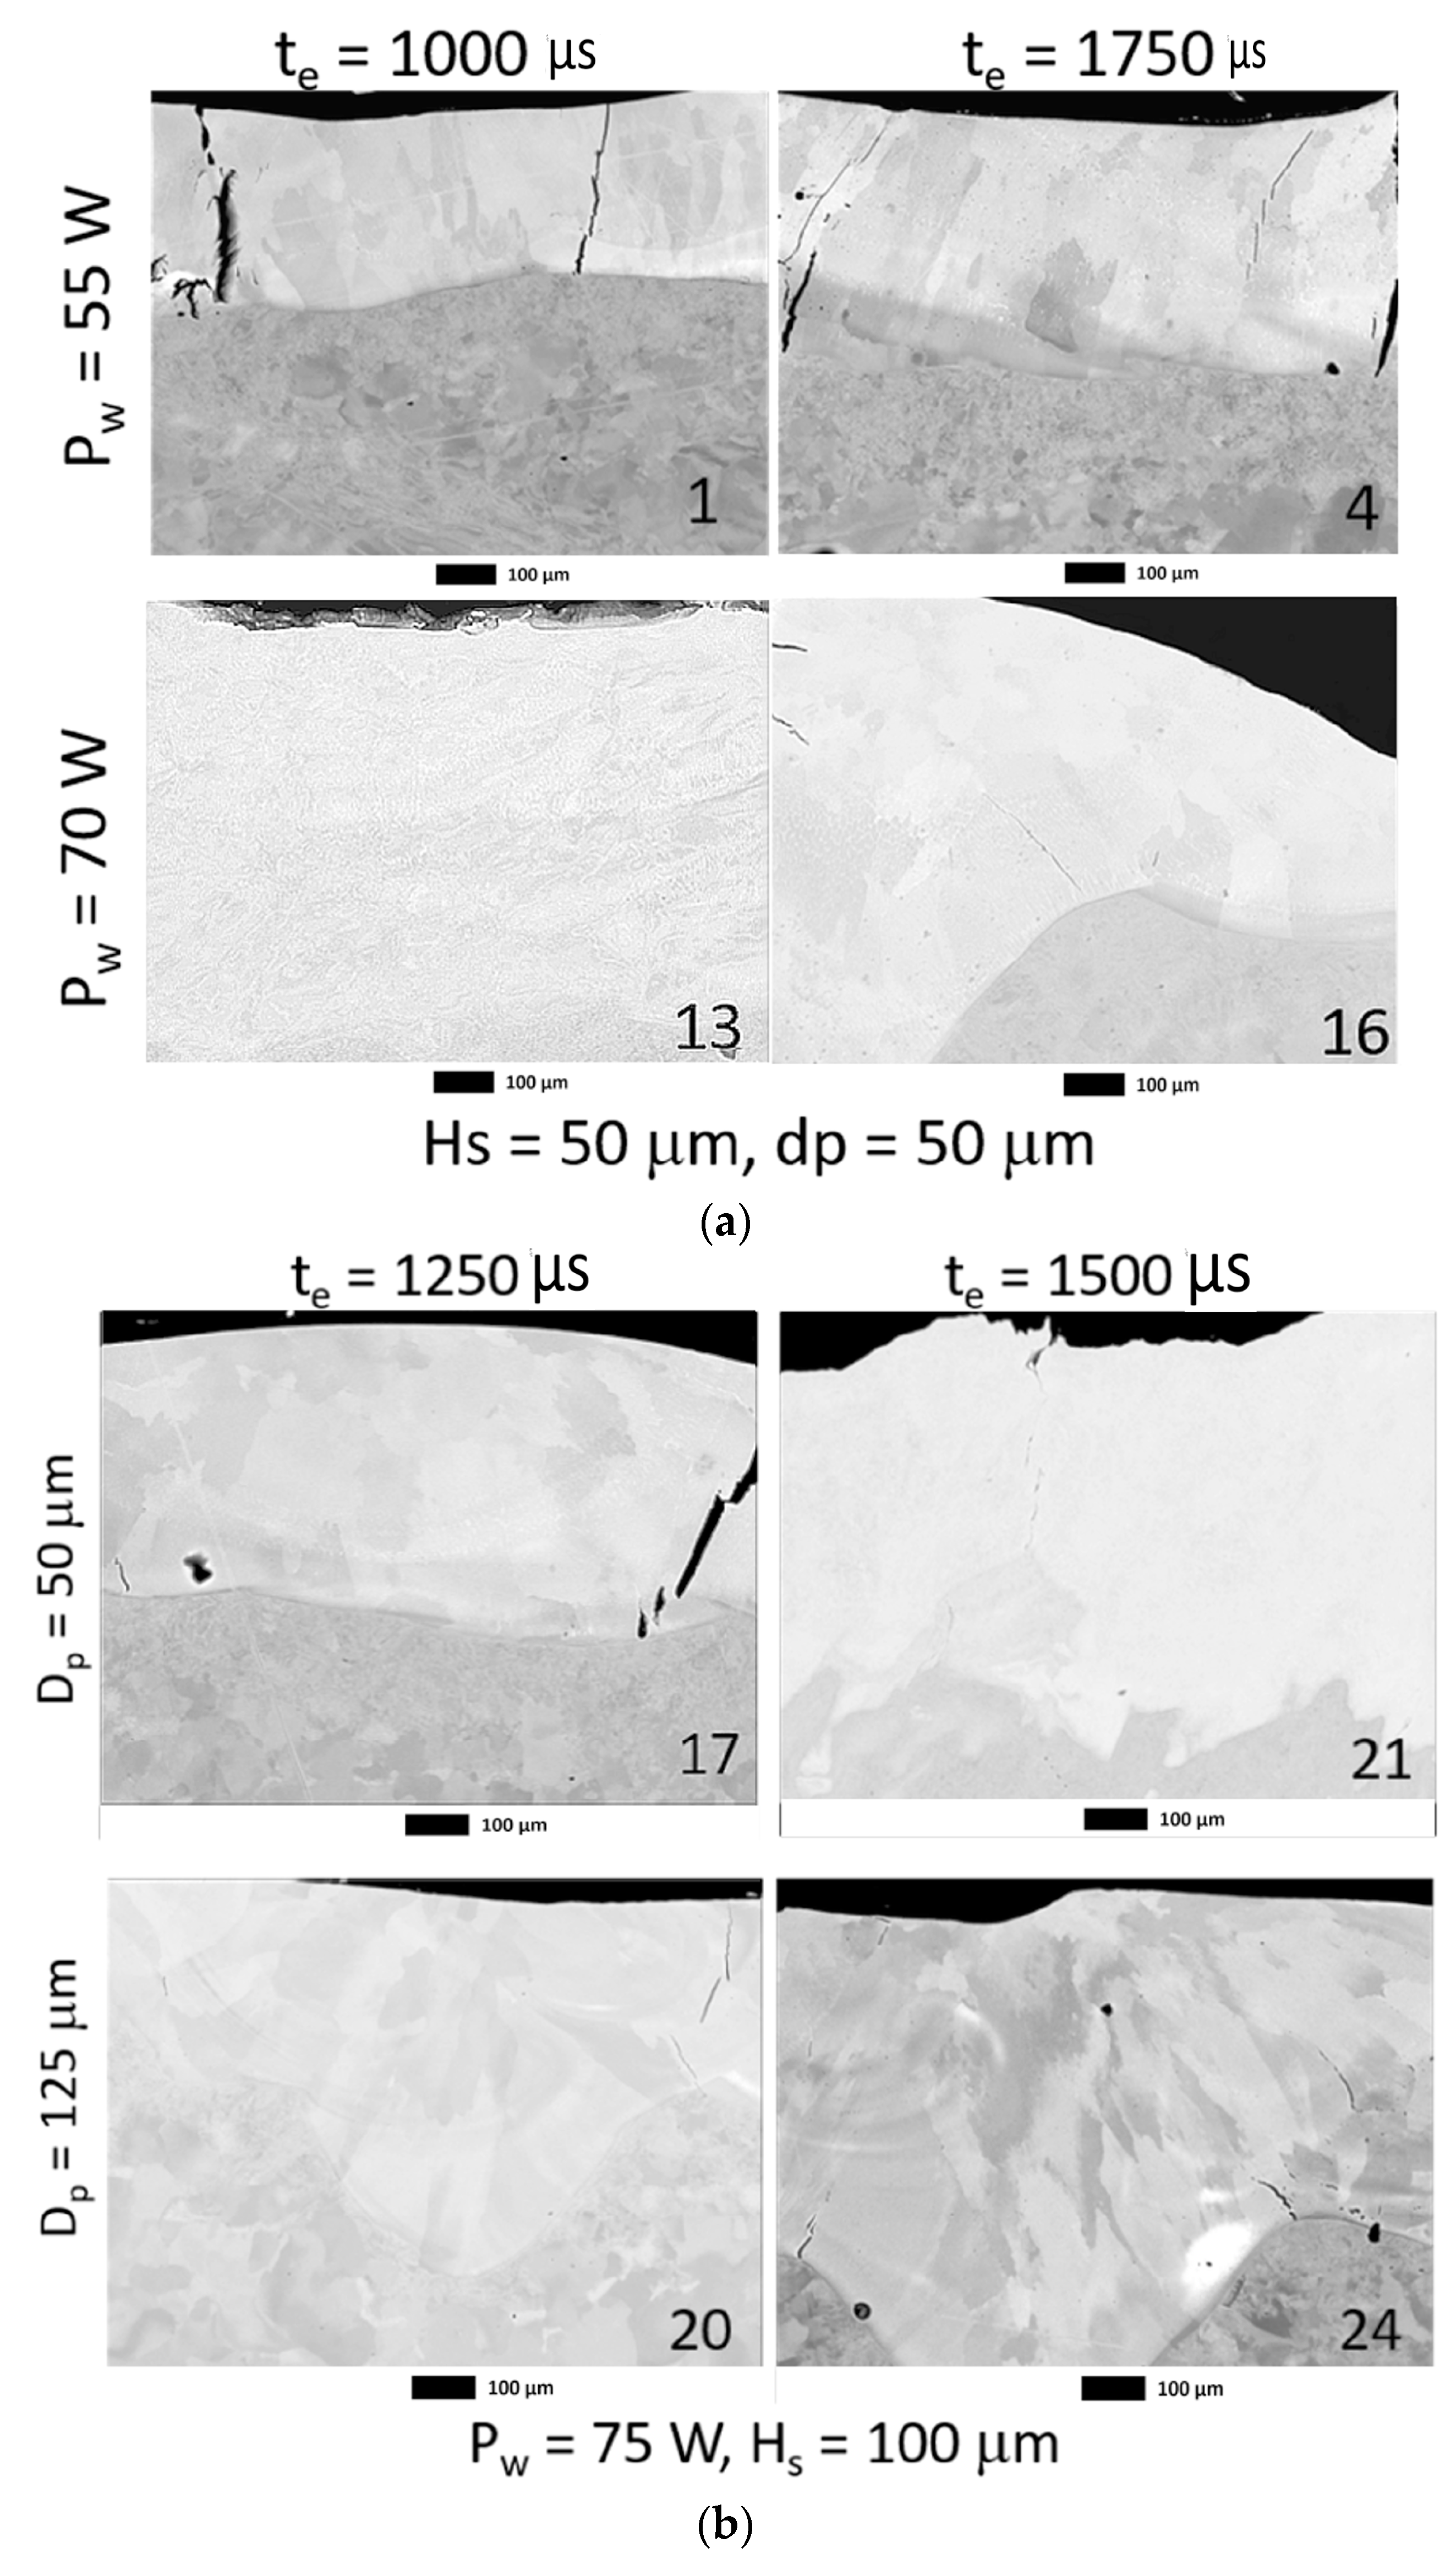
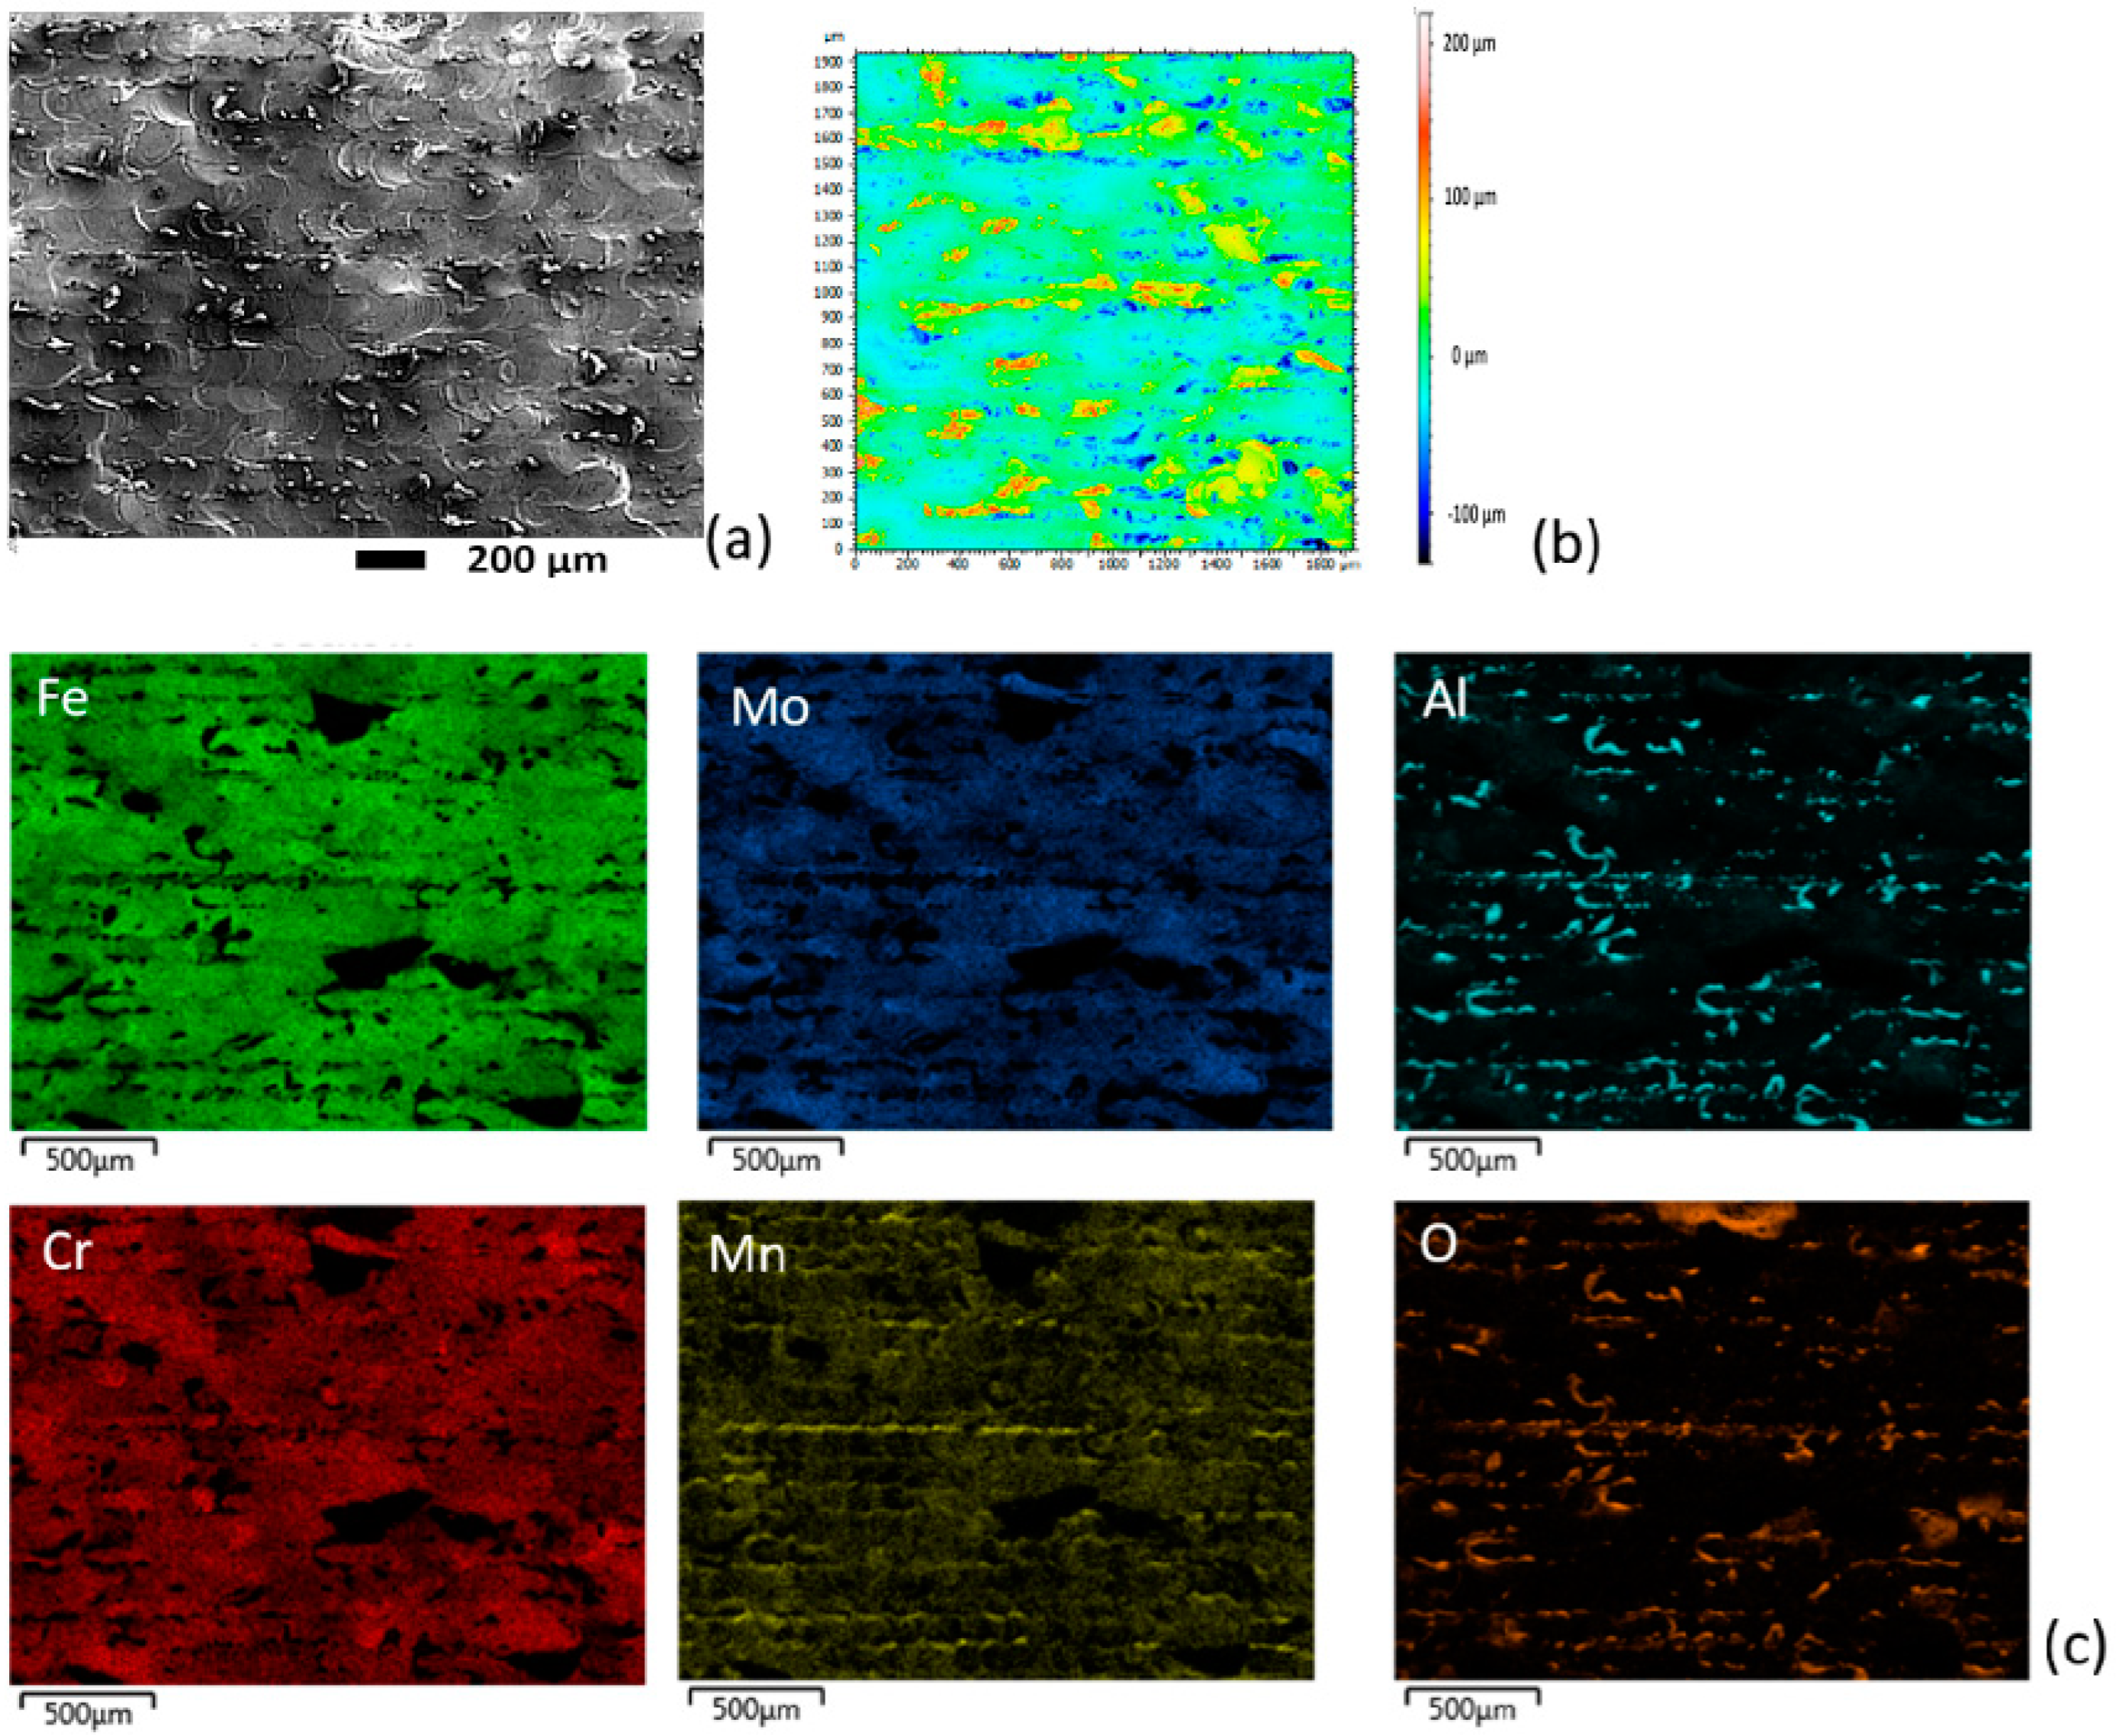
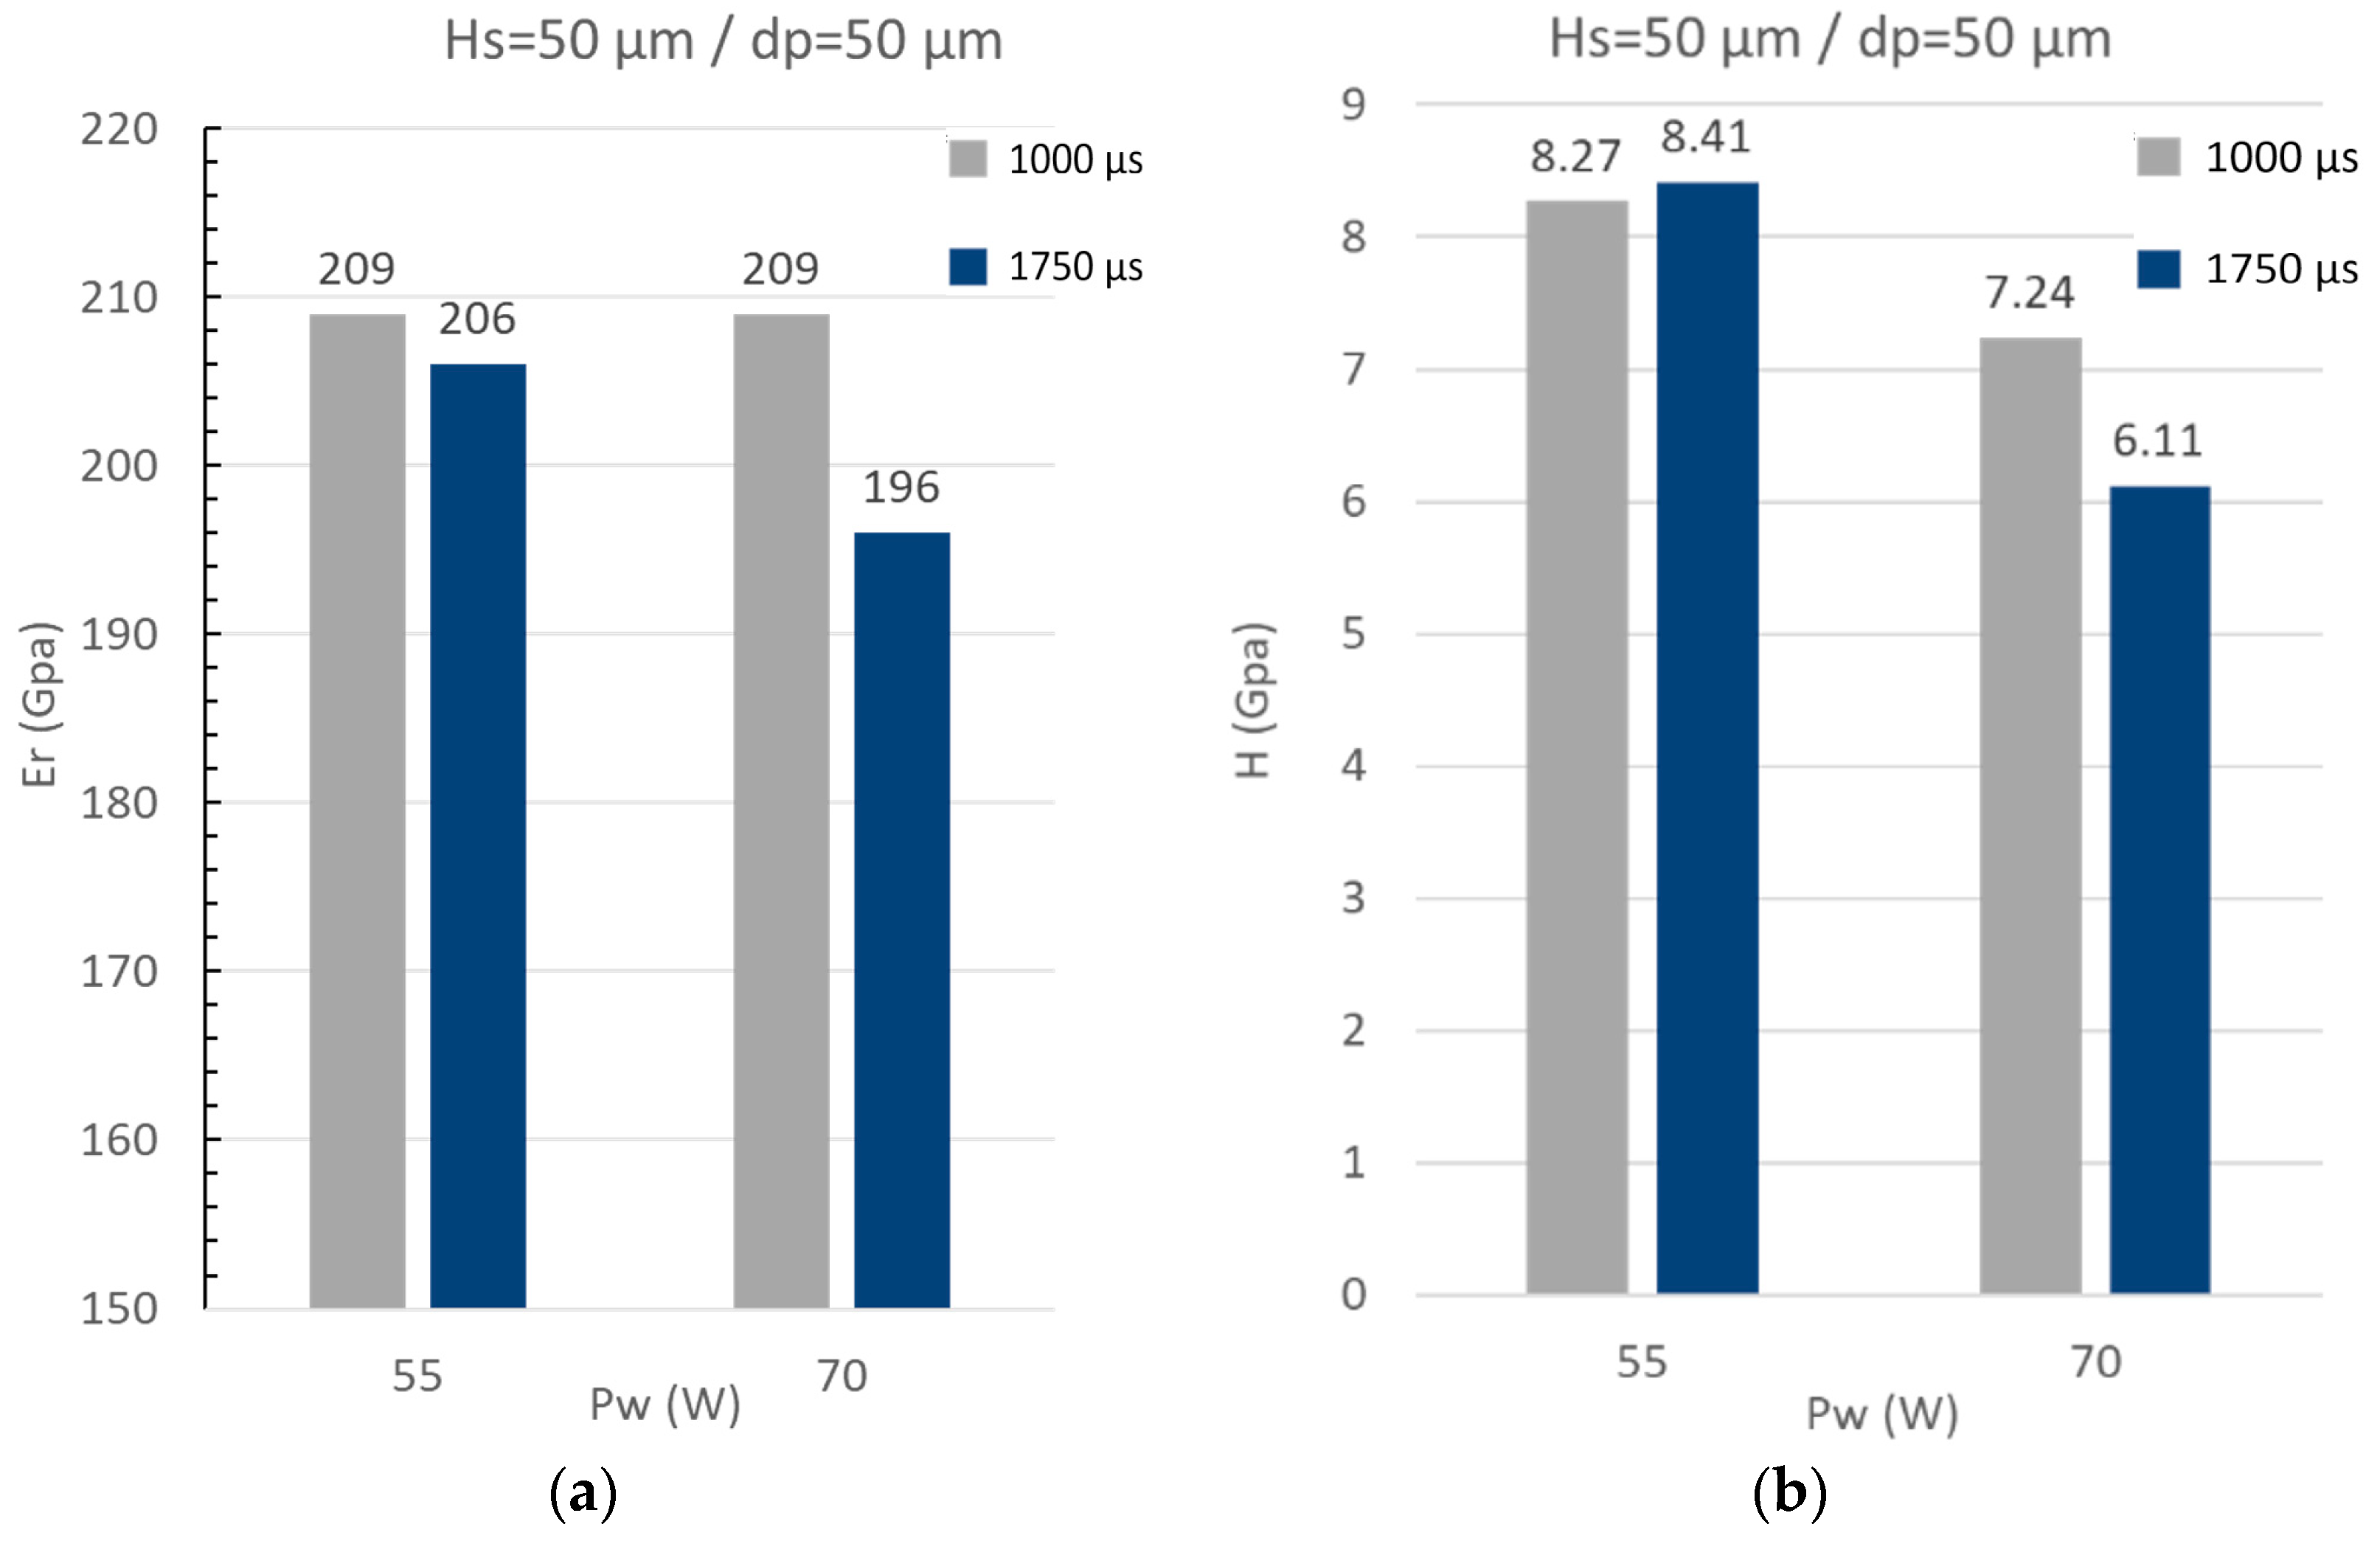
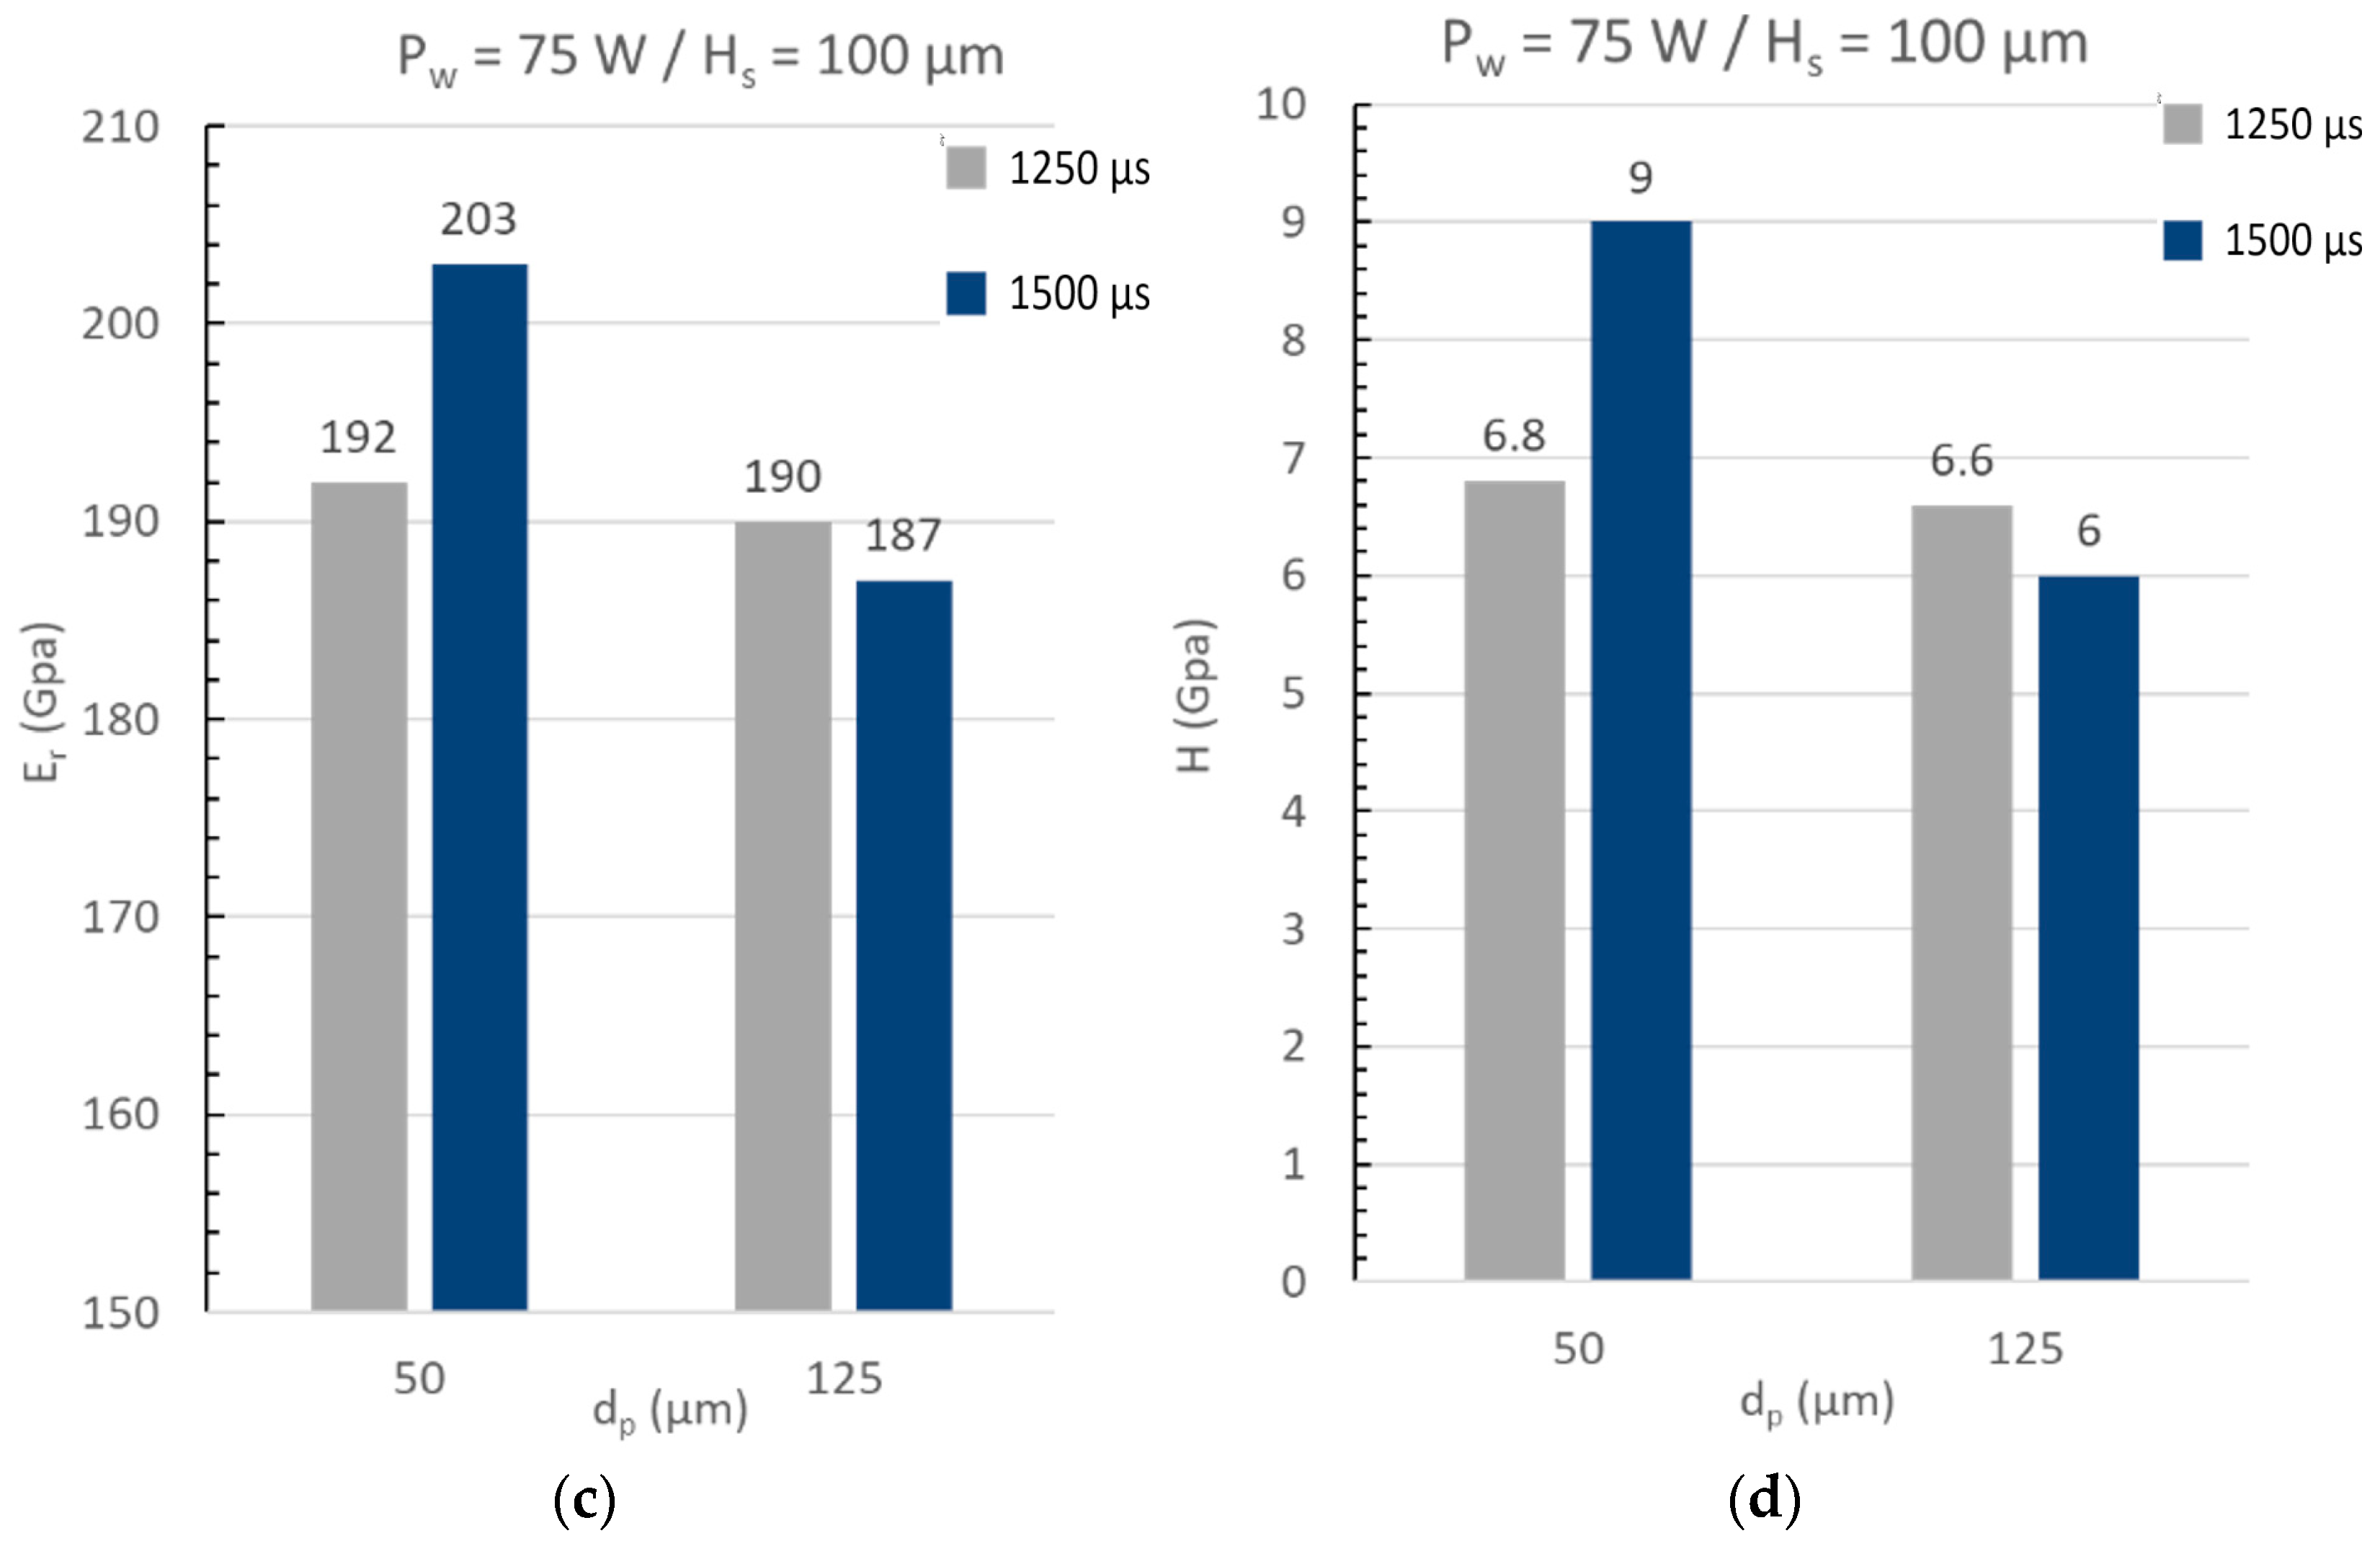
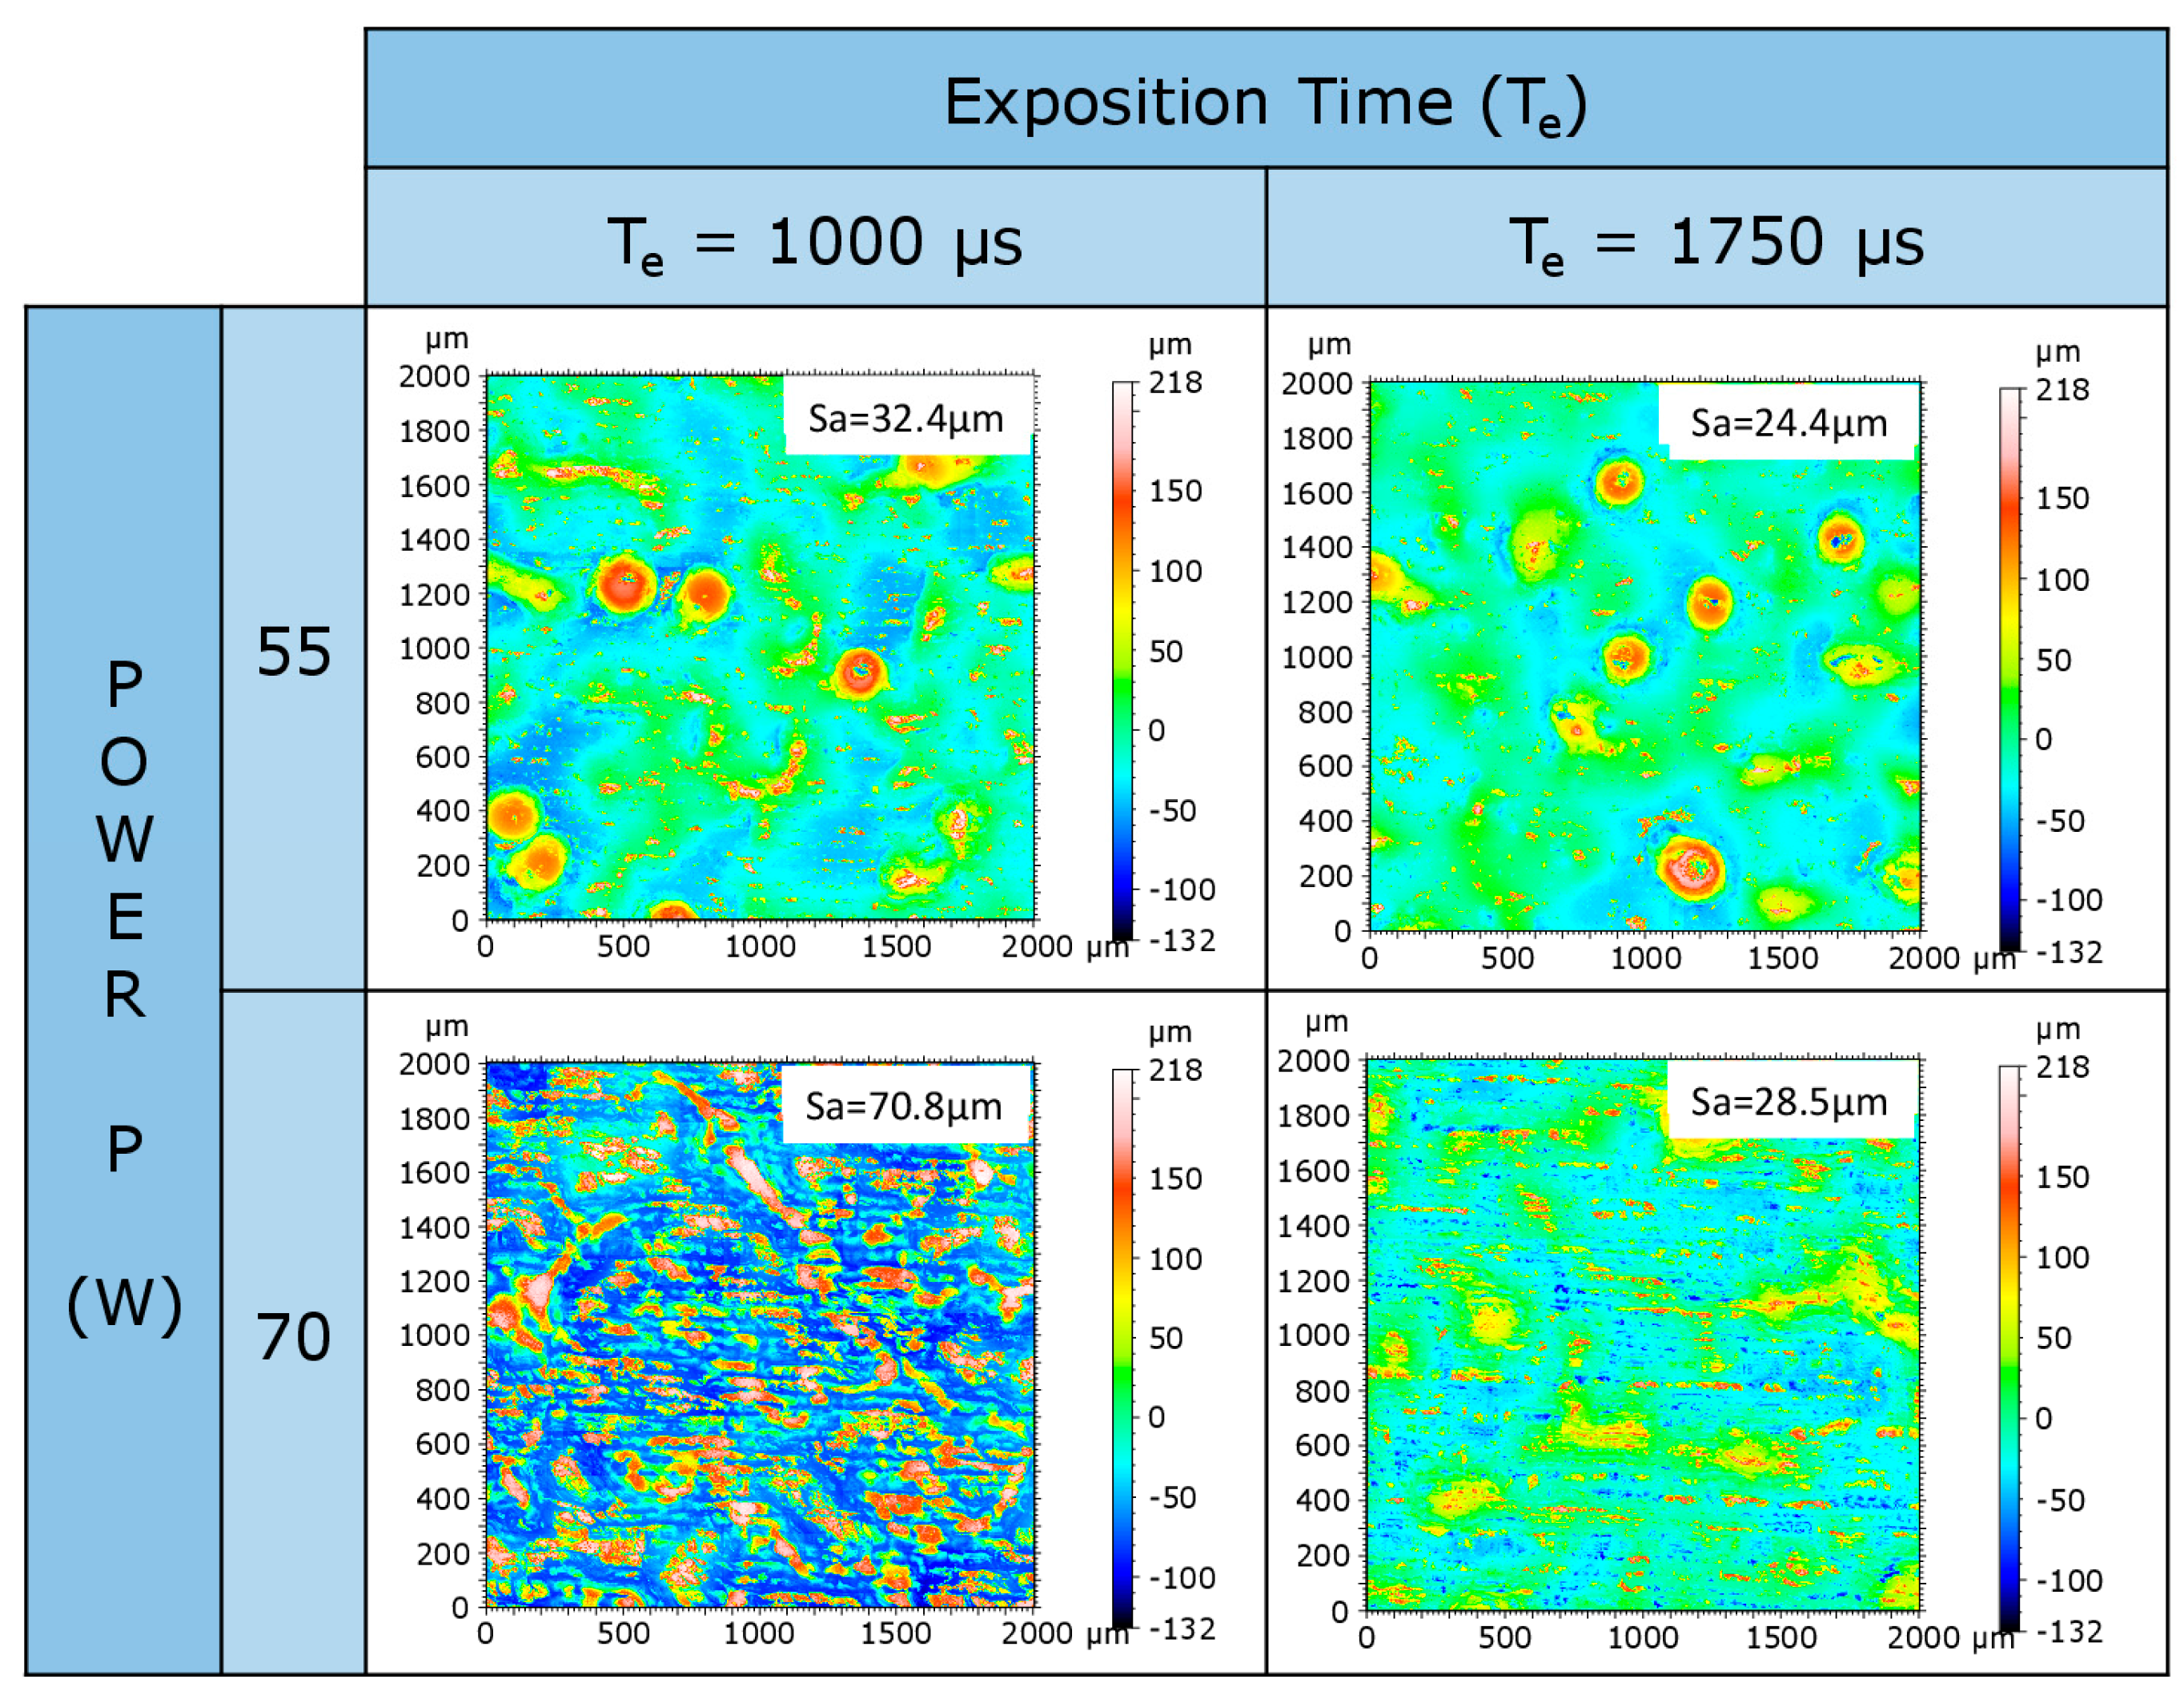
3.1. Characterization of the Coatings

An X-ray diffraction analysis was also carried out on the surface of the samples. Figure 7 presents a representative spectrum of the coatings; the structure consists of a single-phase BCC.
The coatings were characterized through the cross-section, and the extreme deposition conditions were selected. The chemical analyses by EDS are shown in Table 2 and Table 3 and the images obtained by optical microscopy (OM) and scanning electron microscopy (SEM) are shown in Figure 8 and Figure 9. For all the conditions observed in Figure 8, cracks were found perpendicular to the surface of the coating, these were in smaller quantities for the conditions of higher laser power (Hs and Dp of 50 μm). In addition, the coatings’ thickness, measured by OM image analysis at 100×, presented more influence on the laser power. Accordingly, a slight increase from 55 W to 65 W was observed with approximate values between 30 μm and 50 μm, and then at 70 W the thickness was more than double with high variation (80 μm and 90 μm). For the conditions deposited at 55 W denudation of the substrate and balling effect were observed, as can be shown in the micrographs of Figure 8. This phenomenon has been studied by different authors [17,21,23,24,25].
Furthermore, the surface morphology of the coatings was observed by SEM and a representative micrograph of the coating for the sample N° 24 is presented in Figure 10a. It shows the presence of irregular splashing oriented in a direction that could correspond to the direction of the laser’s path, such as was found by Wang et al. in 2017 [19] and Tonelli et al. in 2020 [17]. It was widely studied that the laser melting technique produces highly rough surfaces due to the formation of drop spatter that then solidifies. The EDS mapping shows that these irregular droplets on the surface of the coatings contain aluminum and oxygen, which could correspond to aluminum oxide (Figure 10c). As explained by Wang et al. in 2017, the spatter powder can change its composition, for example, by reacting with oxygen.
It was also evidenced in the EDS analysis (Table 2 and Table 3) that the chemical composition of the coatings changed respecting the initial powder mixing Fe28Cr22Al20Mn19Mo11. Therefore, the coatings were enriched in iron and depleted in the other elements as the laser power increased, possibly due to the dilution of the alloying elements in the substrate.
The mechanical properties are determined for the extreme conditions (i.e., 55 W and 70 W) of laser power (Figure 11a,b) and the coatings obtained at 75 W for the distance between two pulses (dp) of 50 μm and 125 μm (Figure 11c,d). The results of hardness for the coatings obtain at 55 W of laser power were approximately 8 GPa and for 70 W varied between 6 and 7 GPa. The standard deviation for all measures was 0.5 GPa, therefore, it could be observed that the hardness decreases with the laser power possibly due to the diminution of elements such as Al, Mo, and Mn and an increase of Fe, such as have been referenced by other work [31]. The laser exposition time (te) has not shown significant variations in the hardness. Moreover, when the laser power was constant at 75 W, the hardness was approximately 6 ± 0.5 GPa for all conditions except for the coatings deposited with a dp of 50 μm where the hardness was ~9 Gpa. It was supposed that the apparent grain size for this coating was smaller compared with the other conditions, as can be observed in Figure 9b for sample 21. The reduced elastic modulus determined for all conditions variated between 187 and 209 GPa with standard deviations between 5 and 10 GPa, therefore, it was not found that the variations of depositions parameters influence this property.
The topographical image for these coatings (Figure 10b) shows the droplets, which generate a high surface roughness (i.e., Sa of ~24 μm for sample 24). According to the EDS analysis shown previously, these droplets could correspond to aluminum oxide. The morphological heterogeneity created as well as the surface condition can be quantified. It would be sufficient to determine the most homogeneous surface.
The topographic analysis for the extreme condition of the samples from N° 1 to N° 16 is shown in Figure 12. The values obtained for the surface roughness (Sa) varied between 70 and 24 µm.

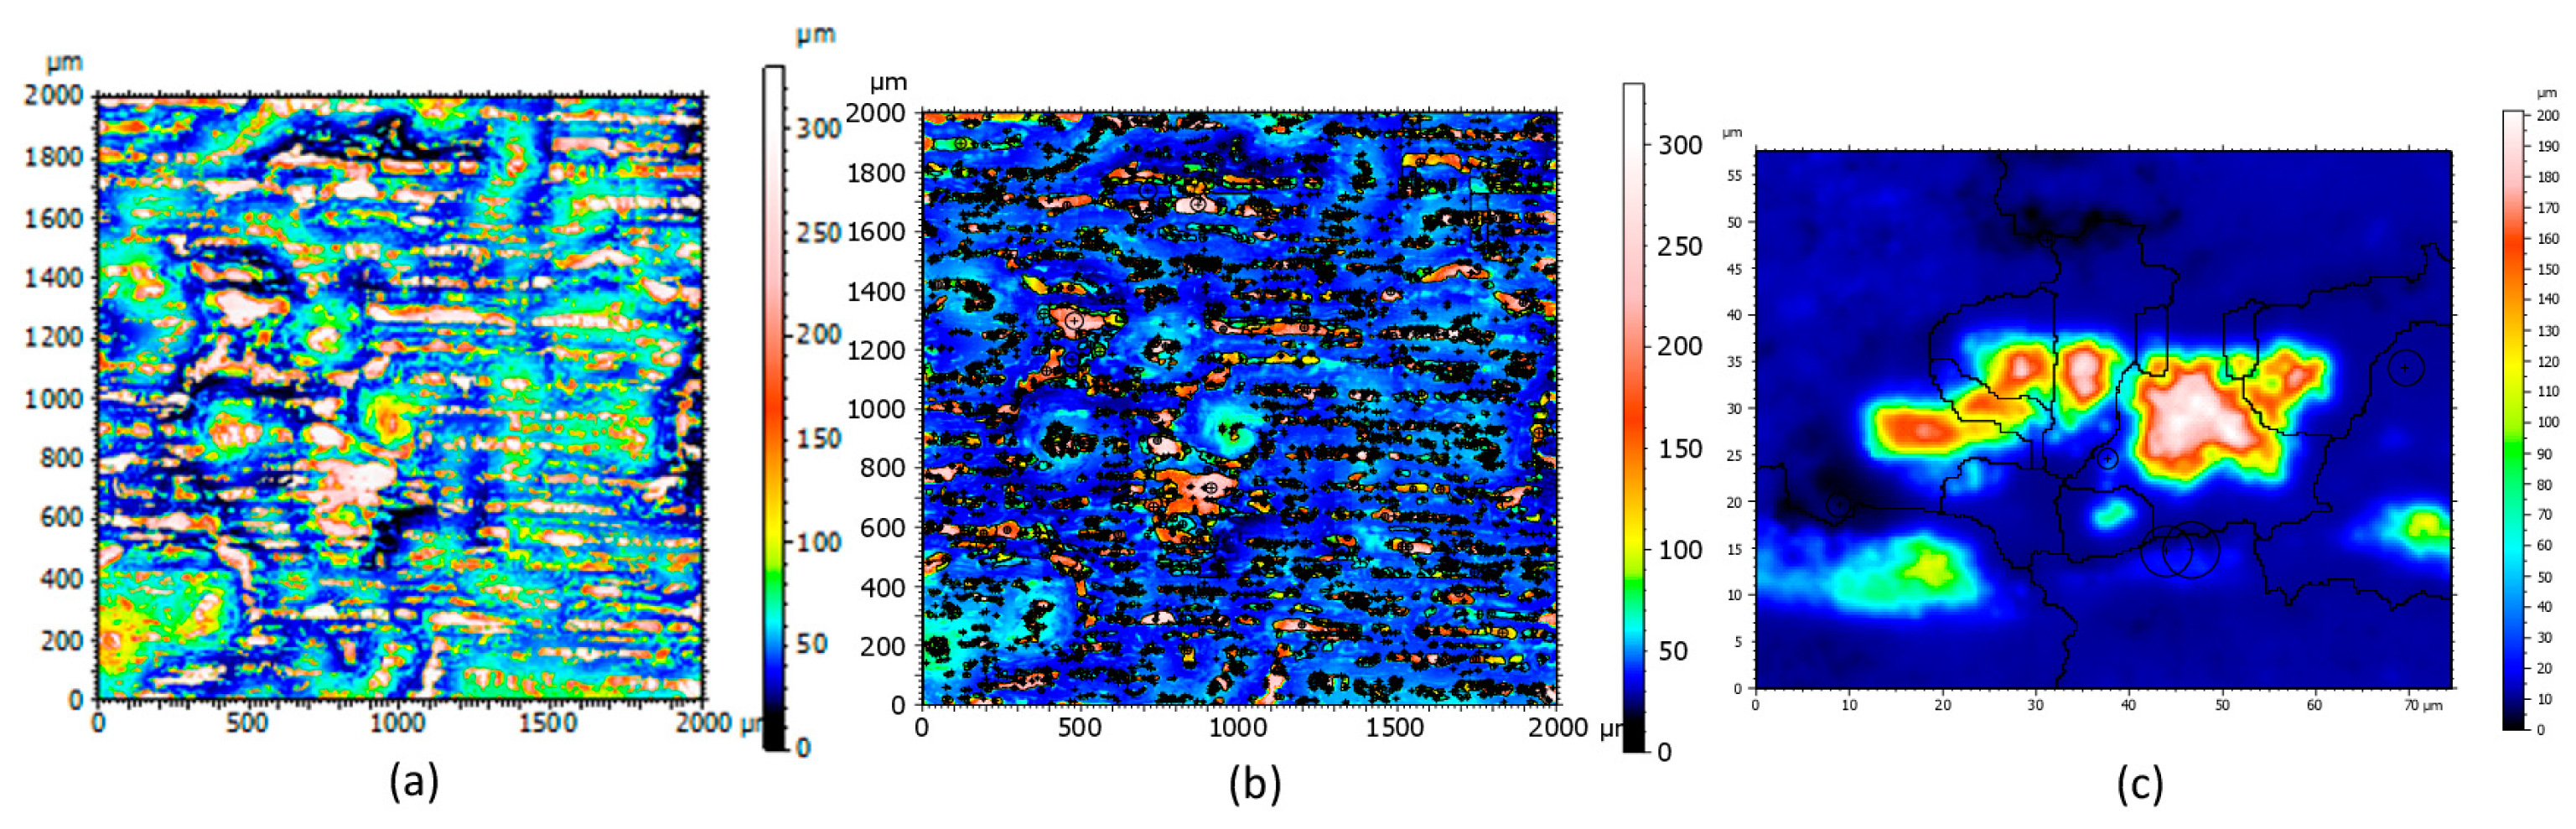
3.2. Morphological Treatment

The morphological treatment will be explained on the topographical map of sample N° 10 (Figure 13a).
An oriented zone appears visually. It seems to be constituted of clusters and laser scan way oriented. The measured step is 100 µm. Under the previously described clusters, a rippled structure emerges. To separate both structures, after a multi-scale analysis with different filters, a high-pass filter with 500 µm cut-offs enables a pretty good partition of the shape and the clusters.
It is therefore clearly advisable to isolate these clusters and carry out a morphological analysis of their shapes rather than using conventional statistical indicators of roughness calculated overall image. To this end, Scott [32] created a method for segmenting a topographic image that is standardized in the field of surface topography [33]. This new segmentation method is now included in ISO 25178 as a method for discriminating significant peaks and valleys as a method for characterizing 3D patterns. This method is based on the application of a watershed algorithm combined with an algorithm for simplifying the graph of relations between particular points. An algorithm called Wolf pruning, allows sub-patterns to be gathered into significant patterns [34]. This peak merging is obtained by applying a threshold to motif heights concerning a height threshold, which is usually specified as a percentage of the total height of the map. This step is important for the calculation of the peak density, peak height, peak orientation, and peak curvature, etc. [35].
Then, the motif decomposition method is applied which allows for isolating the motifs. A Wolf Pruning threshold at 5% (the classical threshold used by default) permits the extraction of an elementary topography for each motif to gather them in a statistical description (Figure 13b,c). In some ways, this decomposition method performs a cluster grain size analysis of the topographical map.
With the adaptation of the motif methods, only heterogeneous topographical zones are considered motifs. In other words, this algorithm was used for shape detection and classification. The total area of the clusters, characterized by the summation of all the elementary areas of each motif, can be calculated to obtain an acceptable cluster percentage by surface unity. This algorithm was applied on all topographical maps without any changes in morphological parameters to obtain the heterogeneity percentage, renamed surface heterogeneity (Figure 14). A smaller percentage means a more homogeneous surface. This percentage also highlights the lousy melting percentage of the powder in ink.
As five measurements were performed at random on all the surface coatings, the uncertainty of the surface heterogeneity coefficient can be determined. Figure 14 depicts, for all the experiments gathered in Table 1, the value of the surface heterogeneity coefficient and its relative uncertainty (confidence interval at 95% of the average). The graph shows a clear heterogeneity difference from 10% to 80% depending on the experiments. One can notice that the associate dispersion is relatively low for a low heterogeneity. However, substantial heterogeneity seems to imply a higher associate dispersion. It may show a poorer surface state control when the complete melting of the powder is not insured.

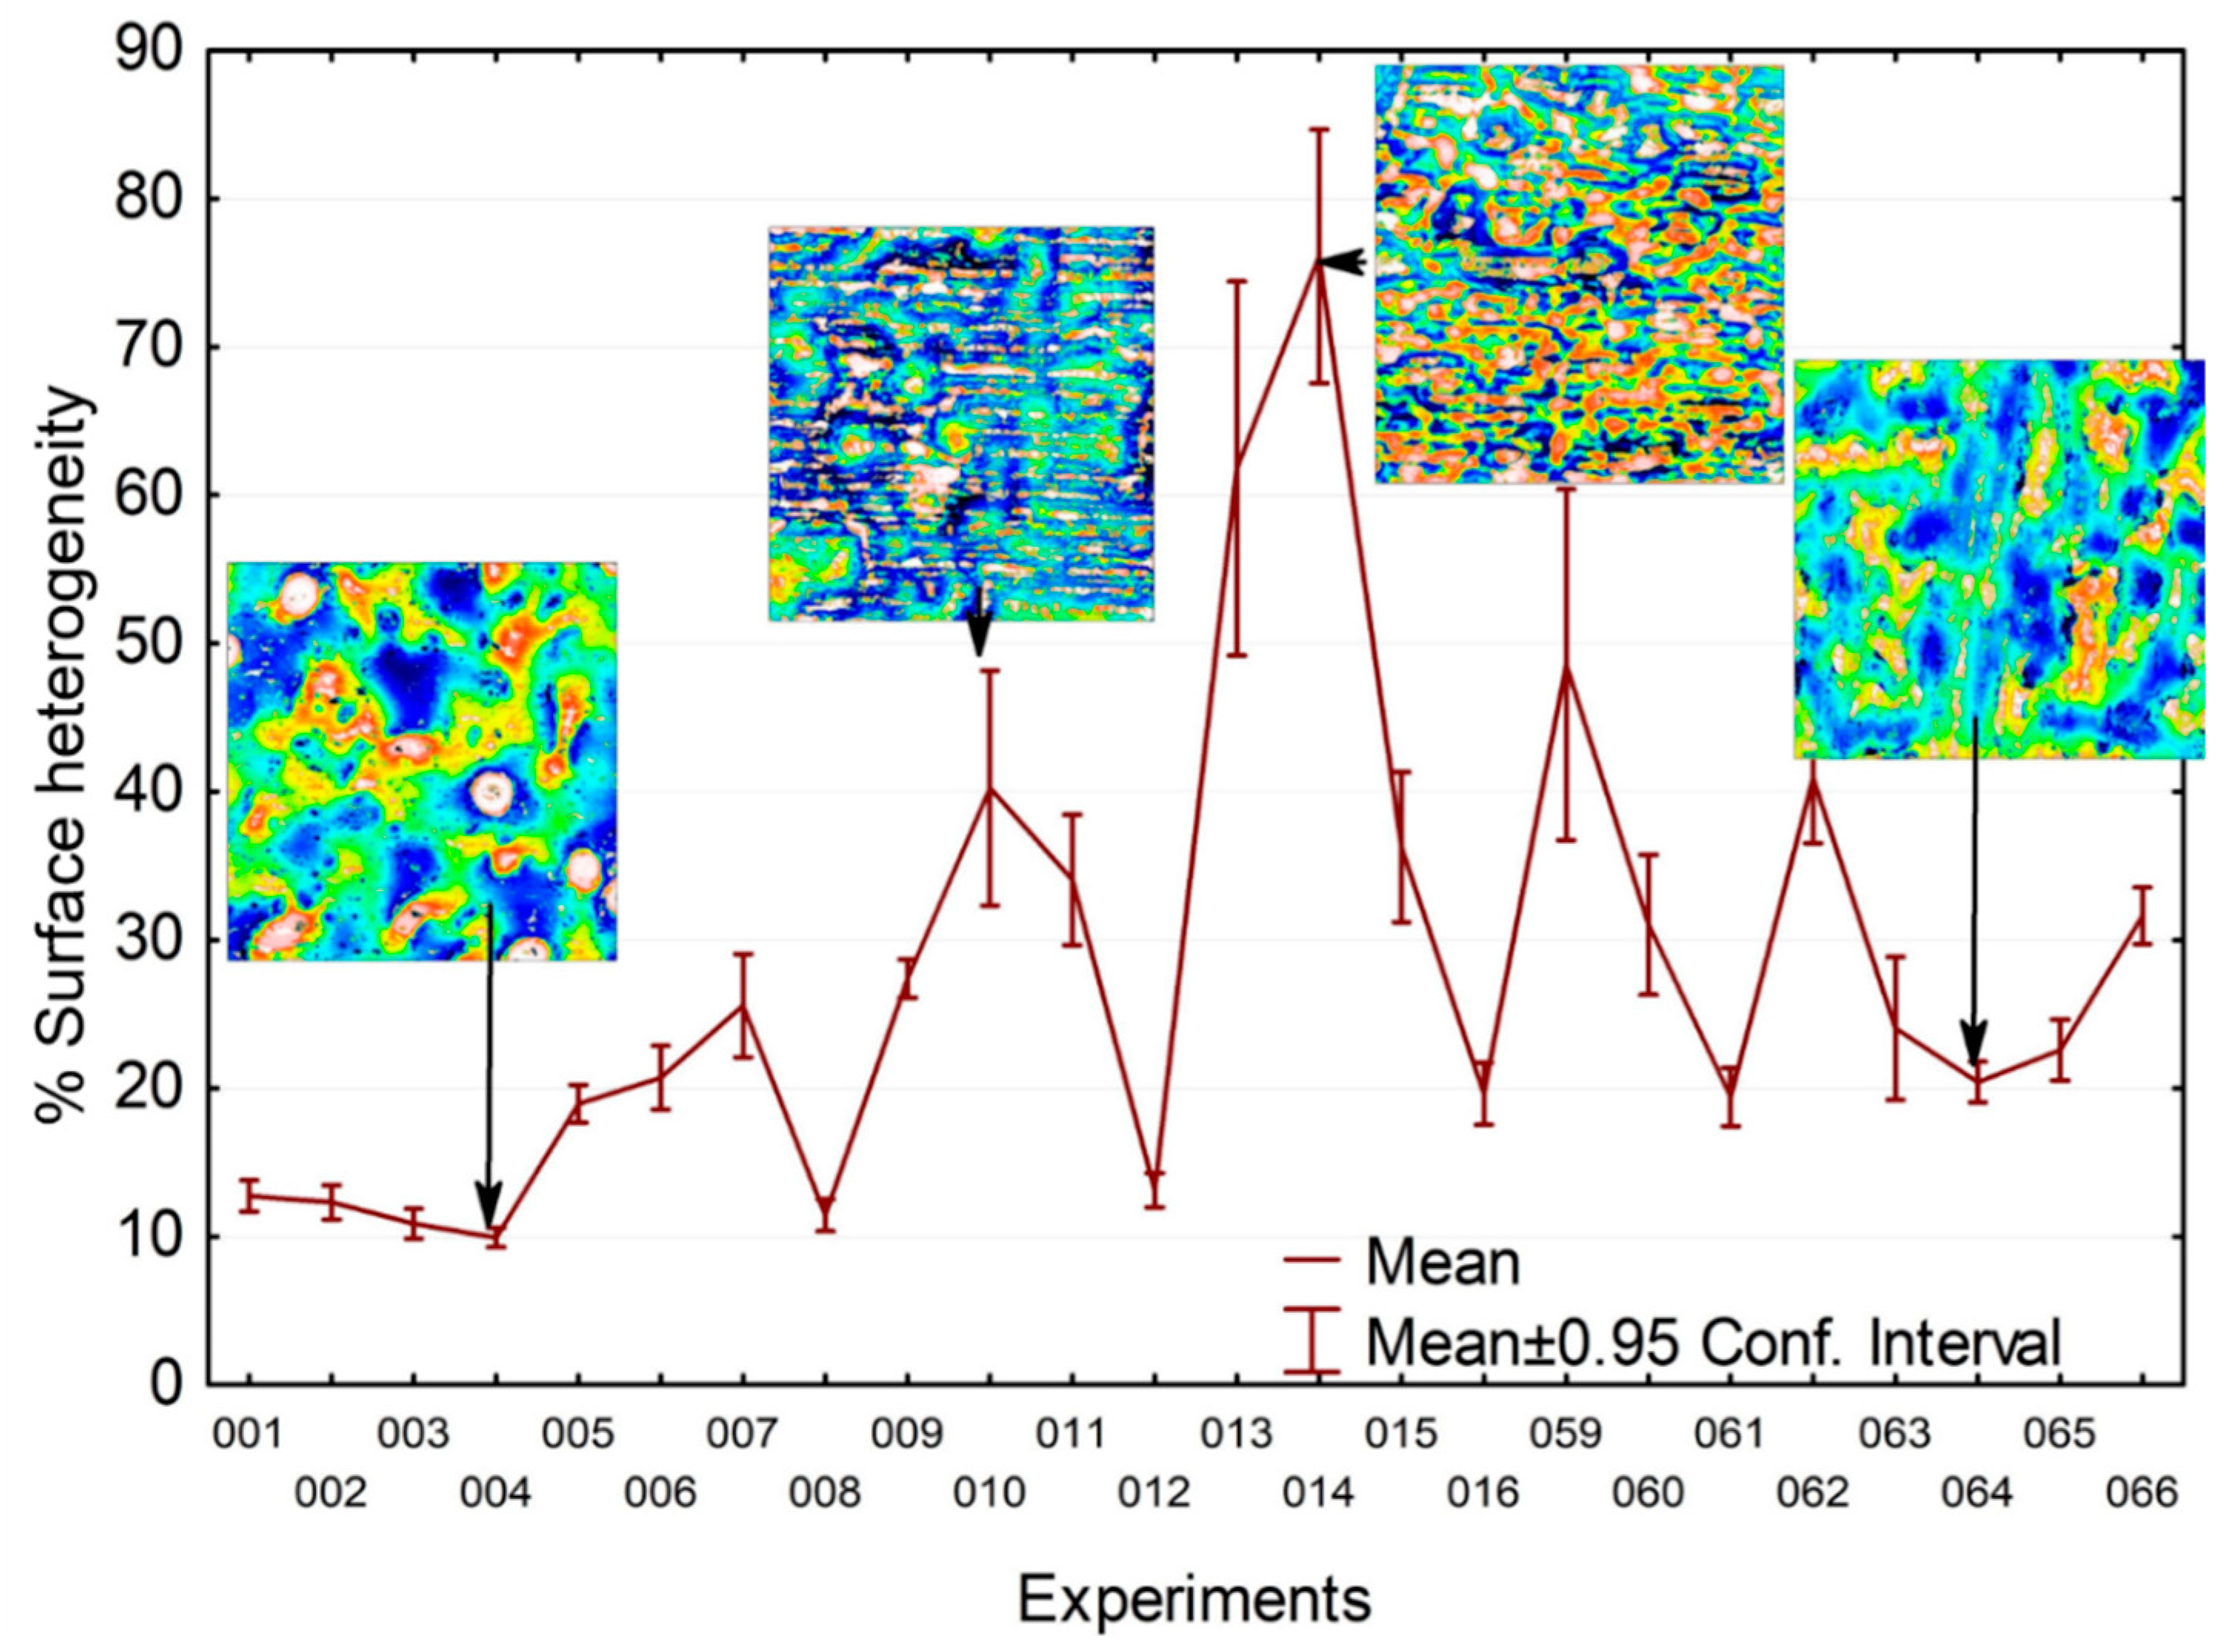
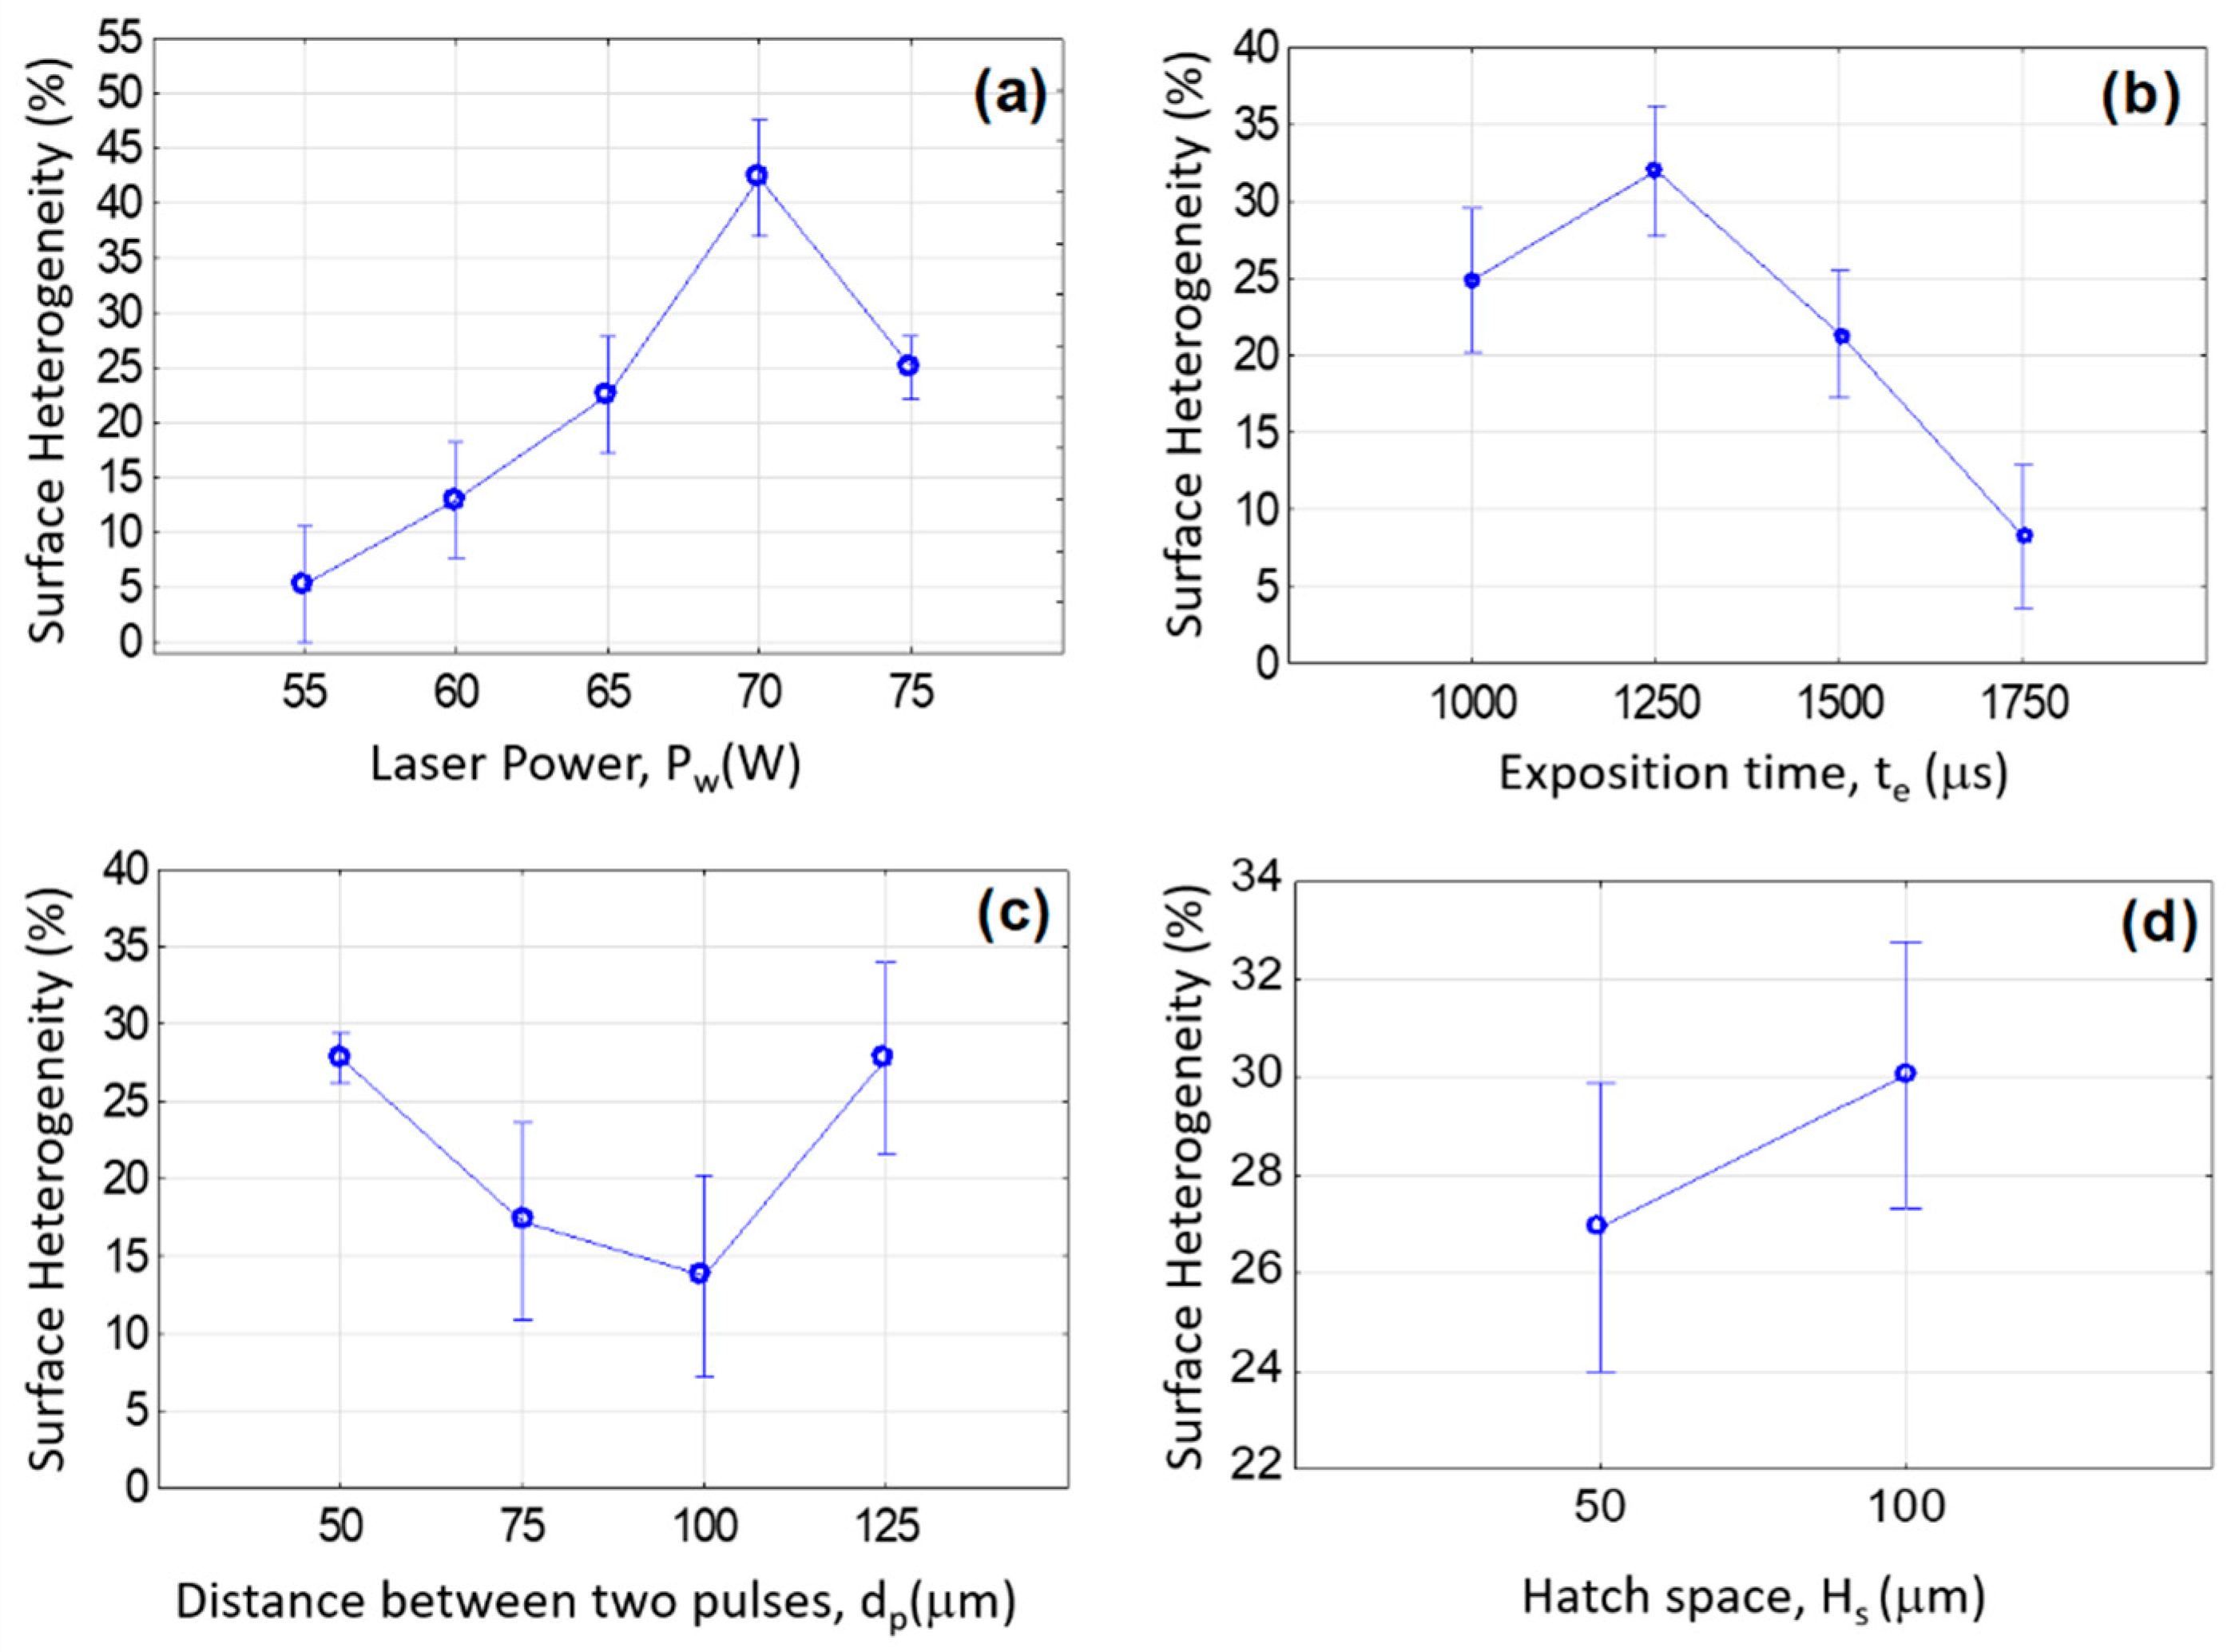
3.3. Statistical Treatments

Practically, the test plan of Table 1 is neither a factorial nor a pure fractional plan. Real effects of the melting process parameters (power, exposition time, distance between two pulses, and hatch space) on the quality of the surface must be treated with appropriate statistical tools. To analyze the effects of these four parameters mentioned above, we will use a General Linear Model (GLM) regression analysis using the statistical language SASTM (SAS Institute, North Carolina, USA). The Fisher random variable (F) value is used to determine the influence or non-influence of each process parameter. After processing statistical analysis, the following influences on each processing parameter for surface heterogeneity are obtained:
The most substantial influence comes from the power factor (Pw) (F = 77, p-value < 0.00000);
Another one that influenced the surface heterogeneity strongly is the exposition time (te) (F = 48, p-value = 0.00001);
The distance between two pulses (dp) has a small influence on the surface heterogeneity (F = 6.9, p-value = 0.0002);
Surprisingly, the Hatch space (Hs) has almost no statistical influence (F = 4.5, p-value = 0.035).
Figure 15 depicts the evolution of the surface heterogeneity versus different values of the four LM process parameters Pw, te, dp, and Hs of the LM process (Table 1). The graphs (Figure 15) show the non-linearity of the process parameters Pw, te, and dp associated with the 95% confidence intervals. The surface heterogeneity could be minimized if the melting operating parameters are optimized. After the optimization of the multi-varied equation obtained by GLM, the best LM parameter values to minimize surface heterogeneity are Pw = 55 W, te = 1750 µs, and dp = 100 µm (the worst is Pw = 70 W, te = 1250 µs, dp = 125 µm).
Each motif corresponds to a particular geometrical shape. Thus, after a global analysis based on the area percentage of the motifs, it is safe to examine the morphology of each motif. Some morphological parameters are associated with each motif, such as its area, height, anisotropy, and curvature. Figure 16 shows the motifs’ area and height values for all experiments. These parameters are gathered in a morphological parameter vector. This way, for each morphological parameter, its empirical probability density can be estimated to include stochastic variation from the melting process. One of the most important morphological parameters representing the basis on which the motif morphology is defined is the motif equivalent diameter.

4. Discussion

The equivalent motif diameter histograms are depicted in Figure 17 (orange curve) with a logarithmic scale. This curve was established with almost 1.3 million motifs. The match between this repartition and a Gaussian law can be observed on the data with a logarithmic scale. It is equivalent to trying the match with a lognormal density law (red curve) [36]. The median particle size is highlighted, and its value is 10 µm (95% confidence interval). We used the logarithmic distribution to admit that the powder creation can be linked to a multiplicative process. Mitzenmacher [37] described these mechanisms by introducing the notion of power laws and proposed an interesting review of the origin of this law based on an information theory approach. The lognormal repartition of the equivalent diameter leads to thinking about classical particle repartition mechanisms. Smith and Jordan [38] proposed an interpretation of these parameters compared to the Gaussian laws and proved that this is an excellent mathematical model for particle size distribution. However, the physical processes are not introduced clearly. Applied to powder, authors justify the excellent fit of the diameter with the lognormal laws (on particle size in gas atomization of rapidly solidified aluminum powders [39], in SLM [40], and monocrystalline powder [41]. Even if the lognormal distribution is admitted in powder morphology [42,43], the physical processes that lead to the lognormal probability function are not explained. However, it remains a difficult task to explain the aims of this distribution. Smoluchowski [44] proposed that the lognormal law can be justified by coagulation and mass conservation, but the lognormal law is only obtained under certain conditions. More recently, Kiss et al. proposed a model for particle growth that can predict the well-known lognormal particle size distribution [45]. The basic idea is to suppose that the particle’s radius is “perfectly” linearly time-dependent (i.e., r ∝ t without Probability Density Function), and the time distribution is lognormal [46]. We have a program for the monte simulation proposed by Söderlund et al. [46] and find a good fit of our data with the model.
However, it is essential to underline the lack of outliers. This homogeneous statistical distribution verifies the morphological method to segments by heterogeneous zones. A comparison between this distribution of motifs and the distribution of initial powders will be made. These analyses may highlight a potential link between the initial size of the particles introduced into the ink and the size of these clusters with the origin still undetermined. Figure 17 is the superimposition of the empirical probability density of powder diameter and the probability density associated with this diameter. A similarity between the powder diameter distribution and motif equivalent diameter repartition appears. There are fewer motifs for small equivalent diameters (>3 µm). Generally, extreme values tend to have a uniform repartition. This leads to a hypothesis: each motif corresponds to a non-melted ball.
This counting method can be applied to powder metallurgy to test the melting homogeneity of the surface and, of course, it can be generalized to additive manufacturing (SLM, etc.).
A physical interpretation (Figure 18) is now sought to create these non-homogeneous structures. Thus, for each experiment of the plan (24 experiments), the motif equivalent diameter (partial melting zones), and the median motif equivalent diameter are calculated. Then this average height (H) is plotted according to each experiment’s median diameter.
Figure 18 highlights some phenomena: the height/diameter relationship is linear (linear line, blue dashed line). However, this link is not affined, which means a zero diameter does not correspond to a zero height. In a way, the geometric motif shapes are not homothety. To isolate the roughness peaks and show the laws of homothetic, one uses the motifs [47]. The motif decomposition method enables determining a gap in this homothetic. If the link diameter/motif analysis is less precise, a linear approximation is not the best statistical method to reproduce the function between height and diameter. Indeed, a power law describes this relation more precisely. The regression models were equal to H = 69 Dequi0.31 (solid red line). This non-linearity, with an exponent smaller than unity, underlines a smaller increase in the pattern’s height as its diameter increases. This non-linearity leads to the deduction of an elementary physical phenomenon: the stability of the building in height cannot increase indefinitely with a mean diameter, whereas it will always be possible to create lateral clusters which will tend to increase the mean diameter by keeping the height more and more constant. Concretely, an increase in the equivalent diameter is related to the percolation of melting balls between them, increasing the average of all the unmelted balls slightly.
By extending the linear approximation, we end up with a motif height of 105 μm (cf. red circle of Figure 18). This asymptotic value leads to the limited height of the pattern. This value of 105 μm is reached for a zero-equivalent diameter. It represents a melted height free of diameter. The physical interpretation implies a total absence of non-melted particles, so the melting of sprayed powders is completed. The coating thickness may be reached when all the balls are melted; in other words, the asymptotic value represents the thickness of the ideal homogeneous coating sprayed.

5. Conclusions

The use of Focus Variation microscopy has made it possible to investigate the highly rough surfaces produced by laser melting with sufficient precision to detect the physical mechanisms of powder melting. We have shown that a refined analysis of the three-dimensional roughness allows us to quantify the melting quality of powders by LM. For this purpose, a quantification method using the pattern method allowed the isolation of the heterogeneous zones. A dimensionless indicator bounded between 0 and 100 called “surface heterogeneity” was introduced, which allowed the determination of the optimal conditions of the manufacturing process parameters. The statistical analysis highlights the chemical segregation according to some process parameters that allowed for obtaining the best process parameters to develop the best surface morphology.
Analyzing the statistical distribution of the equivalent diameters of the patterns, we obtain a lognormal probability density function identical to that of the particle size distribution of the powders used. By completing this description by the heights H, a power-law H = 69 Dequi0.31 is found, showing a substantial deviation from the homothetic morphology involving fractal aspects due to the sphere-sphere aggregation of the powders during the melting process. A linearization of this fractal law allows us to obtain (in the limit d → 0) a Euclidean estimate of the surface corresponding to the thickness of the ideally smooth final coating, i.e., with a homogeneous total fusion of the powders by the LM process. Numerical simulations would validate this phenomenological modeling and describe the diffusion mechanisms encountered during fusion.
According to characterization results, the coatings obtained with a laser power of 75 W, dp of 50 μm, and exposition time of 1500 s presented higher hardness and fewer defects. Therefore, it seems that parameters such as laser power and distance between two pulses (dp) are the most influential on the properties and topography of the surface. It would be recommended in the next works to deposit coatings with the best conditions of morphological treatment obtained in this study, to validate this analysis.

Author Contributions

Conceptualization, review & editing, M.B.; Morphological treatments, A.G.; Writing—review & editing, Y.Y.S.; Experimental measurement, H.M.; Review & editing, M.D.; Experimental Design, J.-F.T.; Coating preparation, L.B.; Metrology, E.P. All authors have read and agreed to the published version of the manuscript.

Funding

This work is supported by the department of the research programs of the DGO6 (Wallonia) and the Fonds Européen de Développement Régional (FEDER) through the INTERREG V France-Wallonie-Vlaanderen program “Allihentrop”. The authors also thank the project ELSAT 2020 supported by the European Union with the European Regional Development Fund, the French State, and the Hauts-de-France Region Council.

Conflicts of Interest

The authors declare no conflict of interest.

References

  1. Costa, M. Toxicity and Carcinogenicity of Cr(VI) in Animal Models and Humans. Crit. Rev. Toxicol. 1997, 27, 431–442. [Google Scholar] [CrossRef] [PubMed]
  2. Yeh, J.W.; Chen, S.K.; Lin, S.J.; Gan, J.Y.; Chin, T.S.; Shun, T.T.; Tsau, C.H.; Chang, S.Y. Nanostructured High-Entropy Alloys with Multiple Principal Elements: Novel Alloy Design Concepts and Outcomes. Adv. Eng. Mater. 2004, 6, 299–303. [Google Scholar] [CrossRef]
  3. Cantor, B.; Chang, I.T.H.; Knight, P.; Vincent, A.J.B. Microstructural development in equiatomic multicomponent alloys. Mater. Sci. Eng. A 2004, 375–377, 213–218. [Google Scholar] [CrossRef]
  4. Ye, X.; Ma, M.; Liu, W.; Li, L.; Zhong, M.; Liu, Y.; Wu, Q. Synthesis and Characterization of High-Entropy Alloy AlxFeCoNiCuCr by Laser Cladding. Adv. Mater. Sci. Eng. 2011, 2011, 485942. [Google Scholar] [CrossRef] [Green Version]
  5. Ye, Q.; Feng, K.; Li, Z.; Lu, F.; Li, R.; Huang, J.; Wu, Y. Microstructure and corrosion properties of CrMnFeCoNi high entropy alloy coating. Appl. Surf. Sci. 2017, 396, 1420–1426. [Google Scholar] [CrossRef]
  6. Jiang, Y.Q.; Li, J.; Juan, Y.F.; Lu, Z.J.; Jia, W.L. Evolution in microstructure and corrosion behaviour of AlCoCrxFeNi high-entropy alloy coatings fabricated by laser cladding. J. Alloys Compd. 2019, 775, 1–14. [Google Scholar] [CrossRef]
  7. Wu, W.; Li, J.; Hui, J.; Pan, X.M.; Cao, Z.Q.; Deng, D.W.; Wang, T.M.; Li, T.J. Phase Evolution and Properties of Al2CrFeNiMox High-Entropy Alloys Coatings by Laser Cladding. J. Therm. Spray Technol. 2015, 24, 1333–1340. [Google Scholar] [CrossRef]
  8. Shu, F.; Zhang, B.; Liu, T.; Sui, S.; Liu, Y.; He, P.; Liu, B.; Xu, B. Effects of laser power on microstructure and properties of laser cladded CoCrBFeNiSi high-entropy alloy amorphous coatings. Surf. Coat. Technol. 2019, 358, 667–675. [Google Scholar] [CrossRef]
  9. Liu, H.; Liu, J.; Chen, P.; Yang, H. Microstructure and high temperature wear behaviour of in-situ TiC reinforced AlCoCrFeNi-based high-entropy alloy composite coatings fabricated by laser cladding. Opt. Laser Technol. 2019, 118, 140–150. [Google Scholar] [CrossRef]
  10. Jin, G.; Cai, Z.; Guan, Y.; Cui, X.; Liu, Z.; Li, Y.; Dong, M.; Zhang, D. High temperature wear performance of laser-cladded FeNiCoAlCu high-entropy alloy coating. Appl. Surf. Sci. 2018, 445, 113–122. [Google Scholar] [CrossRef]
  11. Chen, C.-L.; Suprianto. Microstructure and mechanical properties of AlCuNiFeCr high entropy alloy coatings by mechanical alloying. Surf. Coat. Technol. 2020, 386, 125443. [Google Scholar] [CrossRef]
  12. Xiao, J.-K.; Tan, H.; Wu, Y.-Q.; Chen, J.; Zhang, C. Microstructure and wear behaviour of FeCoNiCrMn high entropy alloy coating deposited by plasma spraying. Surf. Coat. Technol. 2020, 385, 125430. [Google Scholar] [CrossRef]
  13. Srivastava, M.; Jadhav, M.; Chethan Chakradhar, R.P.S.; Muniprakash, M.; Singh, S. Synthesis and properties of high velocity oxy-fuel sprayed FeCoCrNi2Al high entropy alloy coating. Surf. Coat. Technol. 2019, 378, 124950. [Google Scholar] [CrossRef]
  14. Khan, N.A.; Akhavan, B.; Zhou, H.; Chang, L.; Wang, Y.; Sun, L.; Bilek, M.M.; Liu, Z. High entropy alloy thin films of AlCoCrCu0.5FeNi with controlled microstructure. Appl. Surf. Sci. 2019, 495, 143560. [Google Scholar] [CrossRef]
  15. Brif, Y.; Thomas, M.; Todd, I. The use of high-entropy alloys in additive manufacturing. Scr. Mater. 2015, 99, 93–96. [Google Scholar] [CrossRef]
  16. Leary, M. 4—Surface roughness optimisation for selective laser melting (SLM): Accommodating relevant and irrelevant surfaces. In Laser Additive Manufacturing, Materials Design, Technologies, and Applications; Woodhead Publishing Series in Electronic and Optical Materials; Woodhead Publishing: Sawston, UK, 2017; pp. 99–118. [Google Scholar] [CrossRef]
  17. Tonelli, L.; Fortunato, A.; Ceschini, L. CoCr alloy processed by Selective Laser Melting (SLM): Effect of Laser Energy Density on microstructure, surface morphology, and hardness. J. Manuf. Process. 2020, 2, 106–119. [Google Scholar] [CrossRef]
  18. Sun, Y.; Bailey, R.; Moroz, A. Surface finish and properties enhancement of selective laser melted 316L stainless steel by surface mechanical attrition treatment. Surf. Coat. Technol. 2019, 378, 124993. [Google Scholar] [CrossRef]
  19. Wang, D.; Shibiao, W.; Fu, F.; Mai, S.; Yang, Y.; Liu, Y.; Song, C. Mechanisms and characteristics of spatter generation in SLM processing and its effect on the properties. Mater. Des. 2017, 117, 121–130. [Google Scholar] [CrossRef]
  20. Alrbaey, K.; Wimpenny, D.; Tosi, R.; Manning, W.; Moroz, A. On Optimization of Surface Roughness of Selective Laser Melted Stainless Steel Parts: A Statistical Study. J. Mater. Eng. Perform. 2014, 23, 2139–2148. [Google Scholar] [CrossRef]
  21. Zhou, X.; Liu, X.; Zhang, D.; Shen, Z.; Liu, W. Balling phenomena in selective laser melted tungsten. J. Mater. Process. Technol. 2015, 222, 33–42. [Google Scholar] [CrossRef]
  22. Qiu, C.; Panwisawas, C.; Ward, M.; Basoalto, H.C.; Brooks, J.W.; Attallah, M.M. On the role of melt flow into the surface structure and porosity development during selective laser melting. Acta Mater. 2015, 96, 72–79. [Google Scholar] [CrossRef] [Green Version]
  23. Tolochko, N.K.; Mozzharov, S.E.; Yadroitsev, I.A.; Laoui, T.; Froyen, L.; Titov, V.I.; Ignatiev, M.B. Balling processes during selective laser treatment of powders. Rapid Prototyp. J. 2004, 10, 78–87. [Google Scholar] [CrossRef]
  24. Kruth, J.P.; Froyen, L.; Van Vaerenbergh, J.; Mercelis, P.; Rombouts, M.; Lauwers, B. Selective laser melting of iron-based powder. J. Mater. Process. Technol. 2004, 149, 616–622. [Google Scholar] [CrossRef]
  25. Yadroitsev, I.; Smurov, I. Surface Morphology in Selective Laser Melting of Metal Powders. Phys. Procedia 2011, 12, 264–270. [Google Scholar] [CrossRef] [Green Version]
  26. Bidare, P.; Bitharas, I.; Ward, R.M.; Attallah, M.M.; Moore, A.J. Fluid and particle dynamics in laser powder bed fusion. Acta Mater. 2018, 142, 107–120. [Google Scholar] [CrossRef]
  27. Gorsse, S.; Nguyen, M.H.; Senkov, O.N.; Miracle, D.B. Database on the mechanical properties of high entropy alloys and complex concentrated alloys. Data Brief 2018, 21, 2664–2678. [Google Scholar] [CrossRef]
  28. Phani, P.S.; Oliver, W. A critical assessment of the effect of indentation spacing on the measurement of hardness and modulus using instrumented indentation testing. Mater. Des. 2019, 164, 107563. [Google Scholar] [CrossRef]
  29. Oliver, W.; Pharr, G. An improved technique for determining hardness and elastic modulus using load and displacement sensing indentation experiments. J. Mater. Res. 1992, 7, 1564–1583. [Google Scholar] [CrossRef]
  30. Leach, R. Introduction to Surface Texture Measurement. In Optical Measurement of Surface Topography; Leach, R., Ed.; Springer: Berlin/Heidelberg, Germany, 2011; pp. 1–11. ISBN 978-3-642-12011-4. [Google Scholar]
  31. Jin, B.; Zhang, N.; Yu, H.; Hao, D.; Ma, Y. AlxCoCrFeNiSi high entropy alloy coatings with high microhardness and improved wear resistance. Surf. Coat. Technol. 2020, 402, 126328. [Google Scholar] [CrossRef]
  32. Scott, P. Foundation of topological characterization of surface texture. In Proceedings of the 7th International Conference on Metrology and Properties of Engineering Surfaces, Goteborg, Sweden, 2–4 April 1997. [Google Scholar]
  33. ISO 25178-2:2012; Geometrical Product Specifications (GPS)—Surface Texture: Areal—Part 2: Terms, Definitions and Surface Texture Parameters. ISO: Geneva, Switzerland, 2012. Available online: https://www.iso.org/standard/42785.html (accessed on 1 December 2021).
  34. Wolf, G.W. Surfaces—Topography and topology. Surf. Topogr. Metrol. Prop. 2020, 8, 014003. [Google Scholar] [CrossRef] [Green Version]
  35. Rana, S. Topological Data Structures for Surfaces; Wiley: Chichester, UK, 2004. [Google Scholar]
  36. Gaddum, J.H. Lognormal distributions. Nature 1945, 156, 463–466. [Google Scholar] [CrossRef]
  37. Mitzenmacher, M. A brief history of generative models for power law and lognormal distributions. Internet Math. 2004, 1, 226–251. [Google Scholar] [CrossRef] [Green Version]
  38. Smith, J.E.; Jordan, M.L. Mathematical and graphical interpretation of the log-normal law for particle size distribution analysis. J. Colloid Sci. 1964, 19, 549–559. [Google Scholar] [CrossRef]
  39. Ünal, A. Effect of processing variables on particle size in gas atomization of rapidly solidified aluminium powders. Mater. Sci. Technol. 1987, 3, 1029–1039. [Google Scholar] [CrossRef]
  40. Liu, Y.; Zhao, X.-H.; Lai, Y.-J.; Wang, Q.-X.; Lei, L.-M.; Liang, S.-J. A brief introduction to the selective laser melting of Ti6Al4V powders by supreme-speed plasma rotating electrode process. Prog. Nat. Sci. Mater. Int. 2020, 30, 94–99. [Google Scholar] [CrossRef]
  41. Wang, Q.; Yang, H.; Shi, J.; Zou, G. Preparation and characterization of nanocrystalline powders of Cu–Zn alloy by wire electrical explosion method. Mater. Sci. Eng. A 2001, 307, 190–194. [Google Scholar] [CrossRef]
  42. Zhang, L.P.; Zhao, Y.Y. Particle size distribution of tin powder produced by centrifugal atomisation using rotating cups. Powder Technol. 2017, 318, 62–67. [Google Scholar] [CrossRef]
  43. Xie, J.W.; Zhao, Y.Y.; Dunkley, J.J. Effects of processing conditions on powder particle size and morphology in centrifugal atomisation of tin. Powder Metall. 2004, 47, 168–172. [Google Scholar] [CrossRef]
  44. Smoluchowski, M.V. Versuch einer mathematischen Theorie der Koagulations kinetik kolloider Lösungen. Zeitschrift f. Physik. Chemie 1917, 92, 129–168. [Google Scholar] [CrossRef]
  45. Kiss, L.B.; Söderlund, J.; Niklasson, G.A.; Granqvist, C.G. New approach to the origin of lognormal size distributions of nanoparticles. Nanotechnology 1999, 10, 25–28. [Google Scholar] [CrossRef]
  46. Söderlund, J.; Kiss, L.B.; Niklasson, G.A.; Granqvist, C.G. Lognormal size distributions in particle growth processes without coagulation. Phys. Rev. Lett. 1998, 80, 2386–2388. [Google Scholar] [CrossRef]
  47. Marteau, J.; Bigerelle, M.; Mazeran, P.-E.; Bouvier, S. Relation between roughness and processing conditions of AISI 316L stainless steel treated by ultrasonic shot peening. Tribol. Int. 2015, 82, 319–329. [Google Scholar] [CrossRef]
Figure 1. Diagram of the powder diameter repartition of the initial mix FeCrAlMnMo showing the grain size of the commercial mono-elementary powder after mixing.
Materials 16 00629 g001
Figure 2. X-ray diffraction pattern of the initial powders FeCrAlMnMo after mixing, evidencing the presence of elemental components.
Materials 16 00629 g002
Figure 3. Schema of the different laser melting parameters selected to variate.
Materials 16 00629 g003
Figure 4. Image of focus variation microscopy (Contour LSK) developed.
Materials 16 00629 g004
Figure 5. Contour LSK Bruker Interface. Histogram on the left represents the focus information curve. On the right, blue curve represents the lower intensity of pixels and the red one the higher intensity.
Materials 16 00629 g005
Figure 6. Stitching 2 mm × 2 mm in one topography measurement (a) Original topography Map; (b) X2 Zoom; (c) X20 Zoom.
Materials 16 00629 g006
Figure 7. XRD of the selective laser melting HEAs coating.
Materials 16 00629 g007
Figure 8. Images of the cross-section of coatings obtained by optical microscopy. The number (a) for Hs = 50 µm and dp = 50 µm (b) Pw = 75 W and Hs = 100 µm.
Materials 16 00629 g008
Figure 9. Images of the cross-section of coatings obtained by SEM. (a) for Hs = 50 µm and Dp = 50 µm (b) Pw = 75 W and Hs = 100 µm.
Materials 16 00629 g009
Figure 10. Surface analysis of the sample N° 24 for the laser melting HEAs coating. (a) SEM micrography, (b) topographical measure (c) EDS analysis.
Materials 16 00629 g010
Figure 11. Graphs of hardness and reduced elastic modulus for different conditions of coatings. (a) Young modulus Er for Hs = 100 µm and dp = 50 µm with two laser exposition time of 1000 µs and 1750 µs; (b) Hardness H for Hs = 100 µm and dp = 50 µm with two laser exposition time of 1000 µs and 1750 µs; (c) Young modulus Er for Pw = 75 W and Hs = 100 µm with two laser exposition time of 1250 µs and 1500 µs; (d) Hardness H for Pw = 75 W and Hs = 100 µm with two laser exposition time of 1250 µs and 1500 µs.
Materials 16 00629 g011aMaterials 16 00629 g011b
Figure 12. Topographic measures of extreme samples from N° 1 to N° 16.
Materials 16 00629 g012
Figure 13. Topography measure of the sample N° 10: (a) amplitude map, (b) Motifs decomposition, and (c) zoom of motifs.
Materials 16 00629 g013
Figure 14. A graph of the percentage of surface heterogeneity for all samples of the experimental design showed in Table 1.
Materials 16 00629 g014
Figure 15. Statistical effects on the surface heterogeneity for different LM parameters. (a) The laser power effect, (b) the laser exposition time effect, (c) the distance between pulses, and (d) the hatch space.
Materials 16 00629 g015
Figure 16. Results of the two variance analyses of all the process parameters: (a) Exposition time, (b) laser power, and (c) distance between two pulses and (d) Hatch space. Orange Curves represent the motif area and the blue curves represent the motif height.
Materials 16 00629 g016
Figure 17. The number of motif counts vs. equivalent diameter.
Materials 16 00629 g017
Figure 18. Graphics of height motif amplitude (H) versus motif equivalent diameter (Dequi) of partial melting zones.
Materials 16 00629 g018
Table 1. Description of the samples according to the process parameters: Laser Power (Pw), Hatch Space (Hs), laser exposition time (te), and distance between two pulses (dp).
N° of the Sample12345678
Pw (W)5555555560606060
Hs (µm)5050505050505050
te (µs)10001250150017501000125015001750
dp (µm)5050505050505050
N° of the sample910111213141516
Pw (W)6565656570707070
Hs (µm)5050505050505050
te (µs)10001250150017501000125015001750
dp (µm)5050505050505050
N° of the sample1718192021222324
Pw (W)7575757575757575
Hs (µm)100100100100100100100100
te (µs)12501250125012501500150015001500
dp (µm)50751001255075100125
Table 2. Results of chemical composition by EDS and thickness of coatings deposited with Hs and dp of 50 μm.
SamplePw (W)te (s)Chemical Composition (% at.)Thickness (μm)
AlCrMnFeMo
155100014.9 ± 3.319.5 ± 3.27.7 ± 2.046.1 ± 10.011.8 ± 1.734 ± 8
455175015.1 ± 1.524.2 ± 1.712.9 ± 1.434.9 ± 4.012.9 ± 2.332 ± 5
560100016.8 ± 1.722.3 ± 3.96.1 ± 1.541.1 ± 4.113.7 ± 0.951 ± 17
860175015.9 ± 1.024.1 ± 1.312.8 ± 1.534.4 ± 1.312.7 ± 0.537 ± 9
965100013.0 ± 2.217.5 ± 4.53.3 ± 0.953.6 ± 9.012.6 ± 2.640 ± 11
1265175011.3 ± 2.114.5 ± 1.29.1 ± 0.953.7 ± 6.211.4 ± 3.347 ± 9
137010007.7 ± 1.99.7 ± 2.62.0 ± 0.874.4 ± 5.26.2 ± 1.790 ± 18
1670175010.9 ± 1.113.8 ± 1.42.6 ± 0.361.8 ± 1.710.9 ± 0.978 ± 32
Table 3. Results of chemical composition by EDS and thickness of coatings deposited with Hs of 100 μm and Pw of 75 W.
Samplete (µs)Dp (μm)AlCrMnFeMoThickness (μm)
1712505013.4 ± 0.9 17.2 ± 0.84.5 ± 0.951.8 ± 3.013.1 ± 1.459 ± 6
2012501259.4 ± 1.712.1 ± 2.66.0 ± 0.865.6 ± 6.46.9 ± 1.5 60 ± 16
2115005011.5 ± 0.9 12.7 ± 0.63.4 ± 0.660.8 ± 2.711.6 ± 2.1 87 ± 17
24150012510.7 ± 0.6 13.7 ± 0.96.1 ± 0.4 60.7 ± 1.08.8 ± 0.379 ± 25
Disclaimer/Publisher’s Note: The statements, opinions and data contained in all publications are solely those of the individual author(s) and contributor(s) and not of MDPI and/or the editor(s). MDPI and/or the editor(s) disclaim responsibility for any injury to people or property resulting from any ideas, methods, instructions or products referred to in the content.

