
In Situ Observation of Micro-Patterned Elastomeric Surfaces: The Formation of the Area of Real Contact and the Influence on Its Friction and Deformation Behaviour
 , , and
Abstract
:1. Introduction
2. Materials and Methods
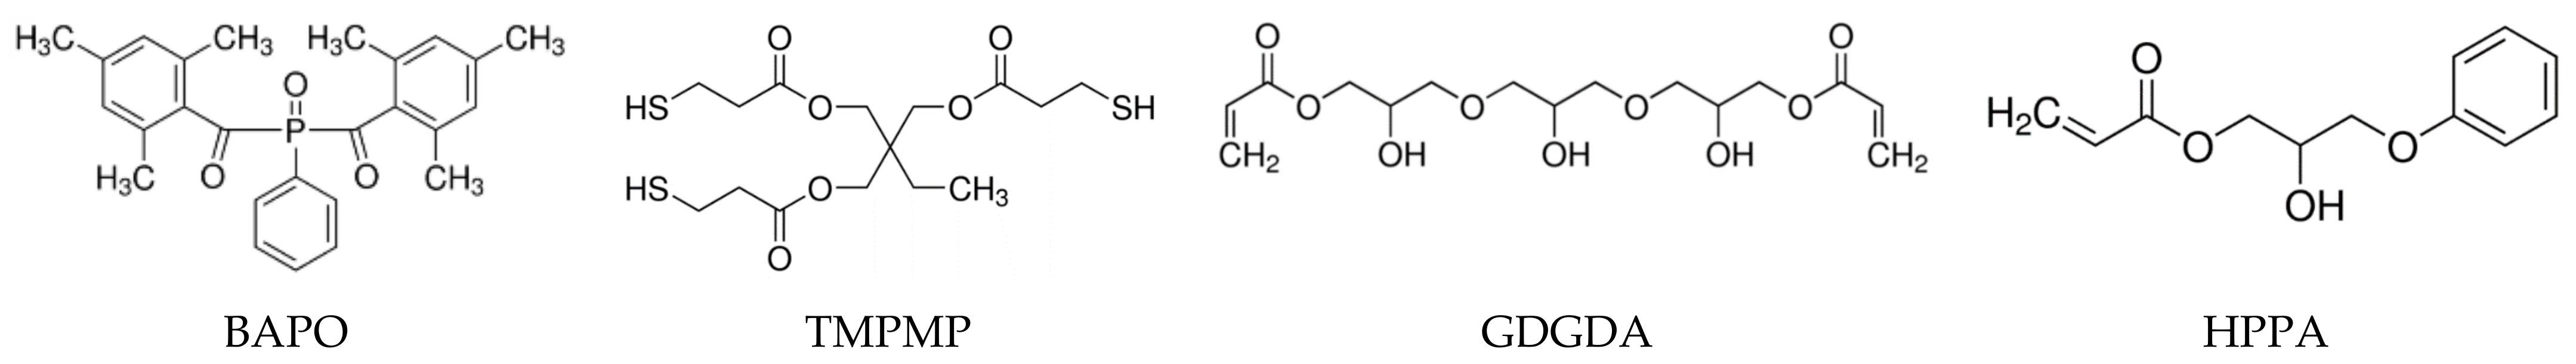
2.1. Materials and Chemicals
2.2. Preparation of the Resin
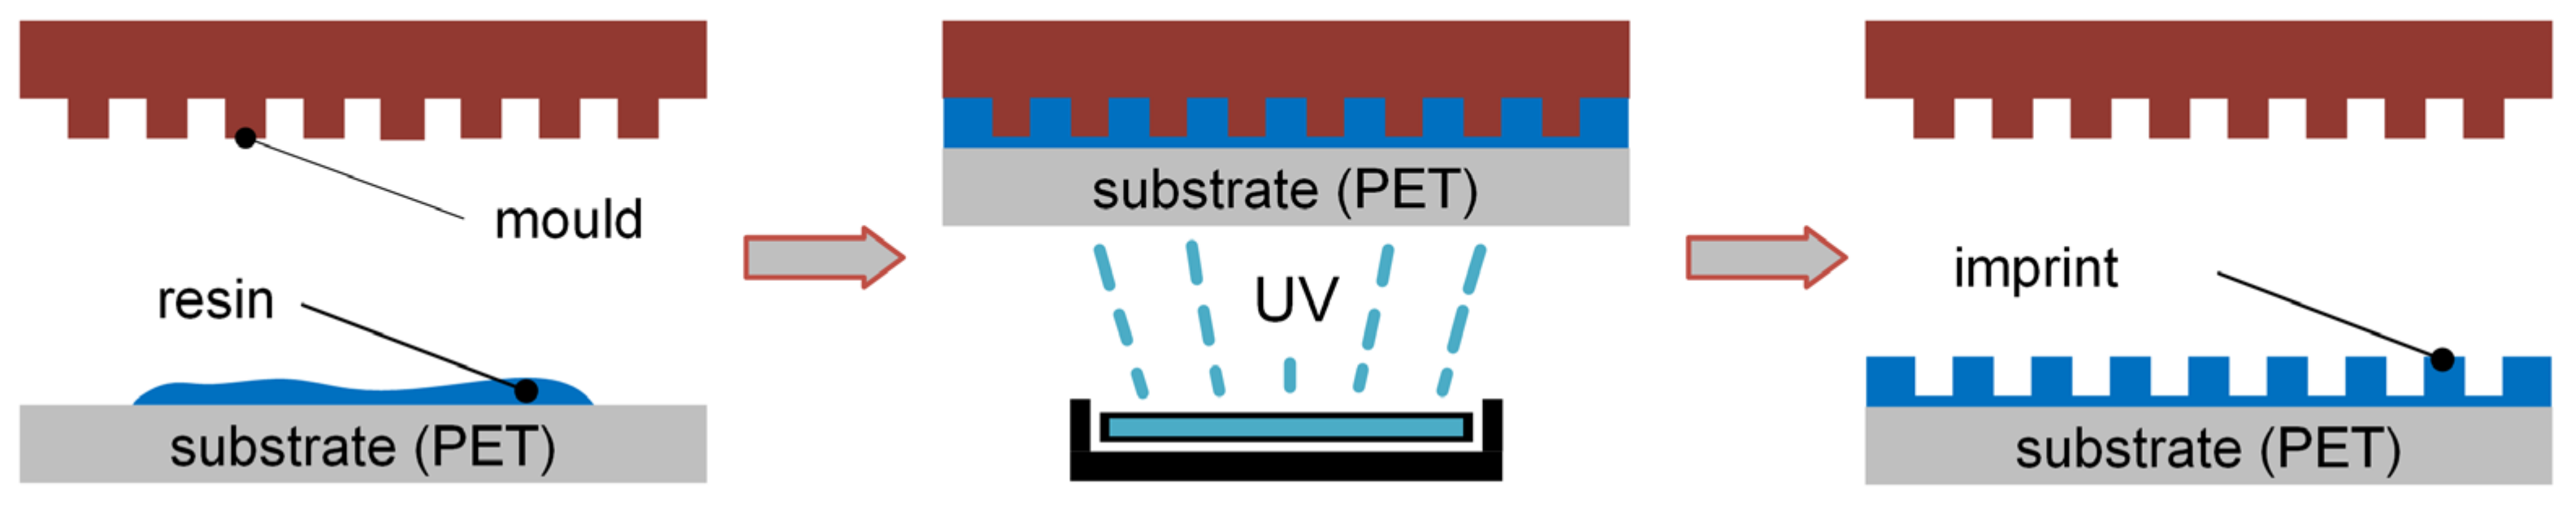
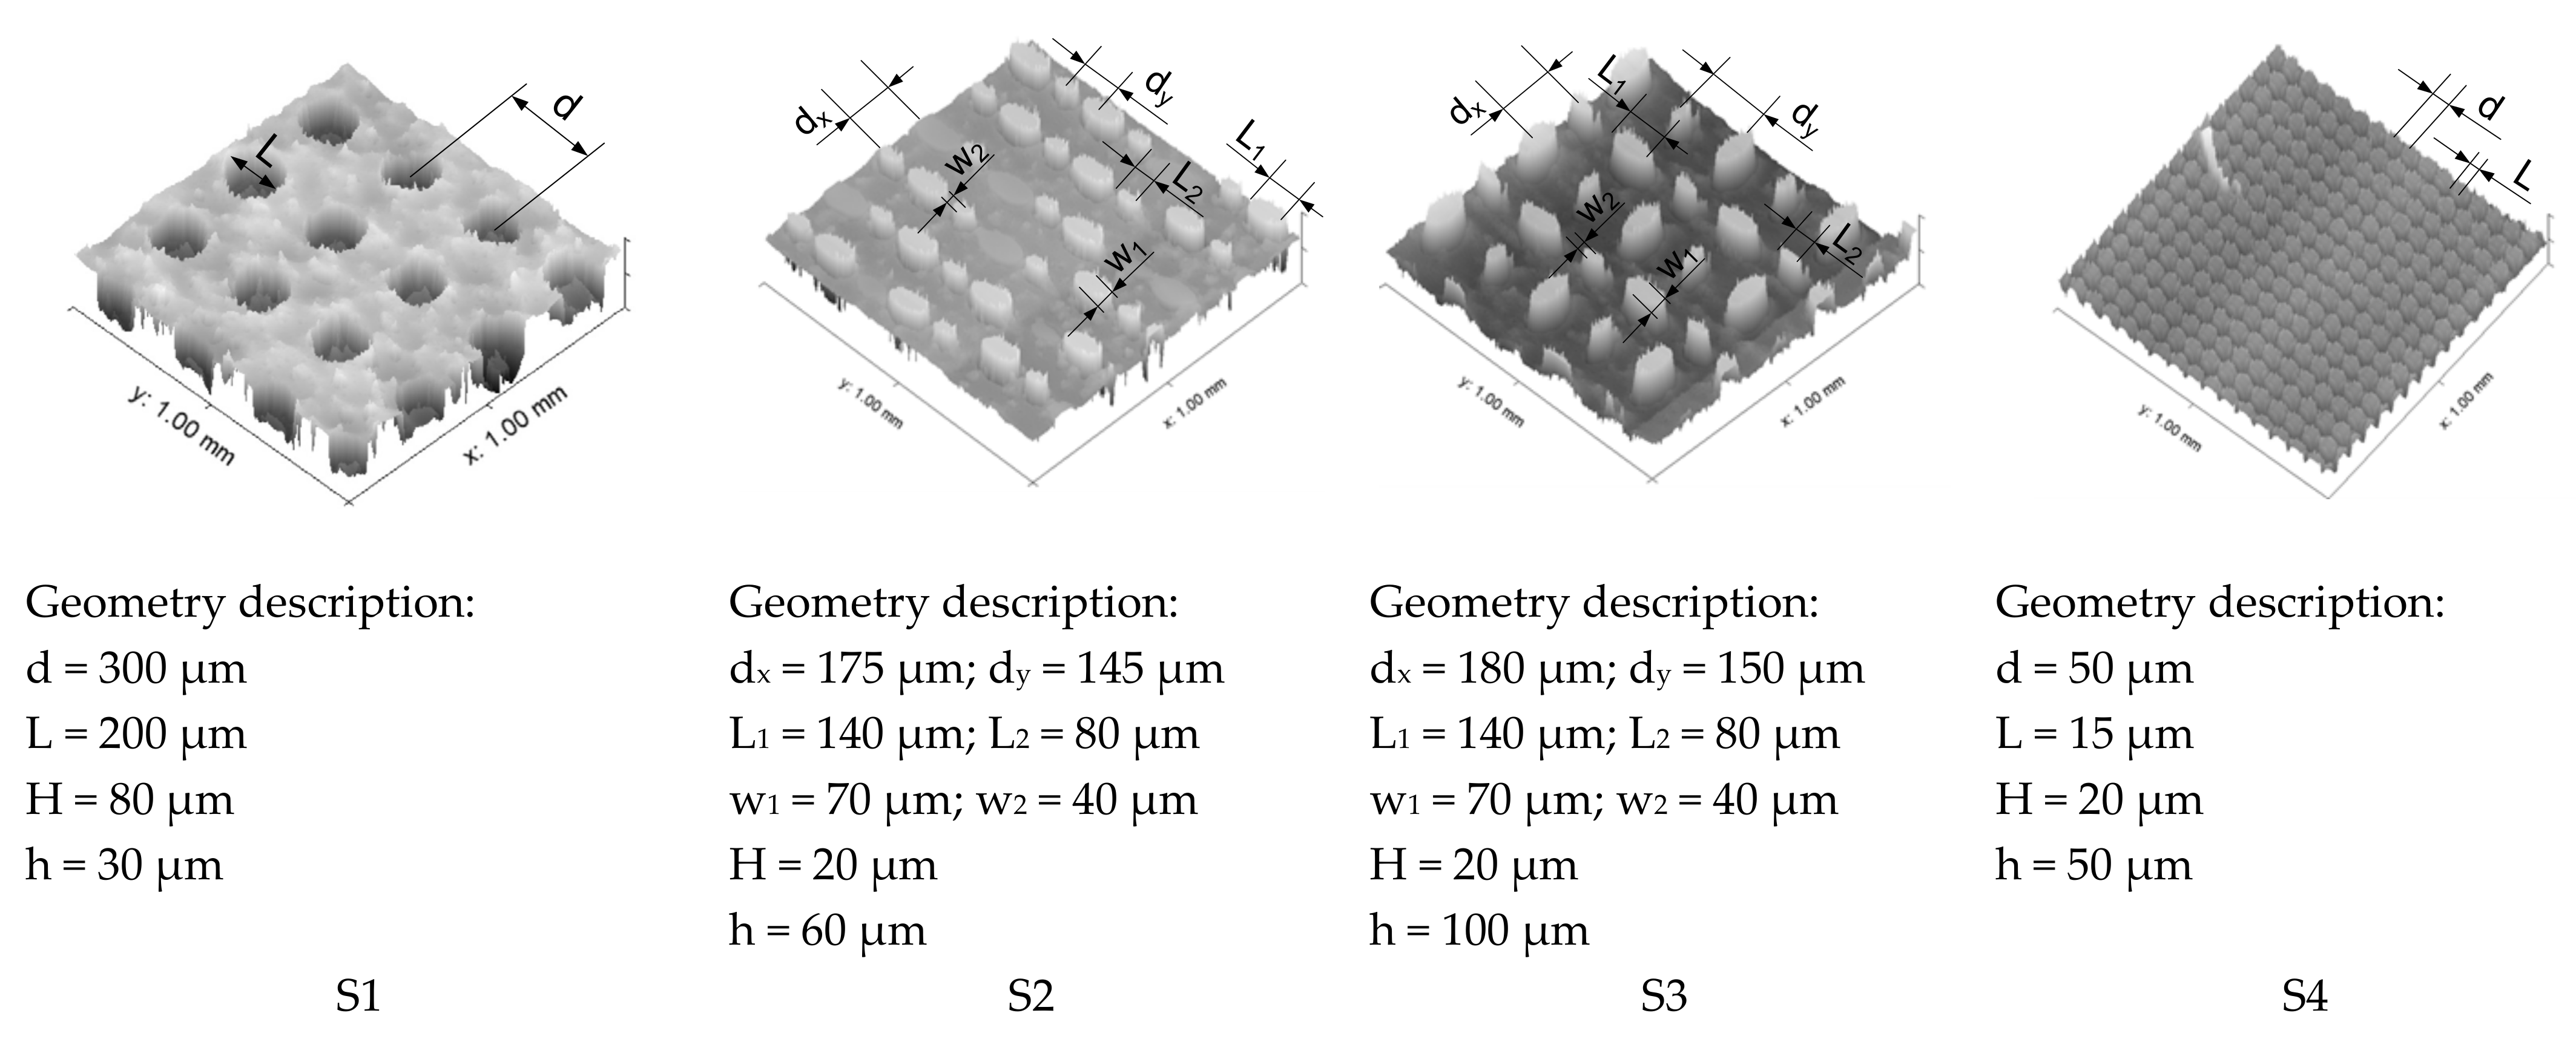
2.3. Surface Production and Analytics
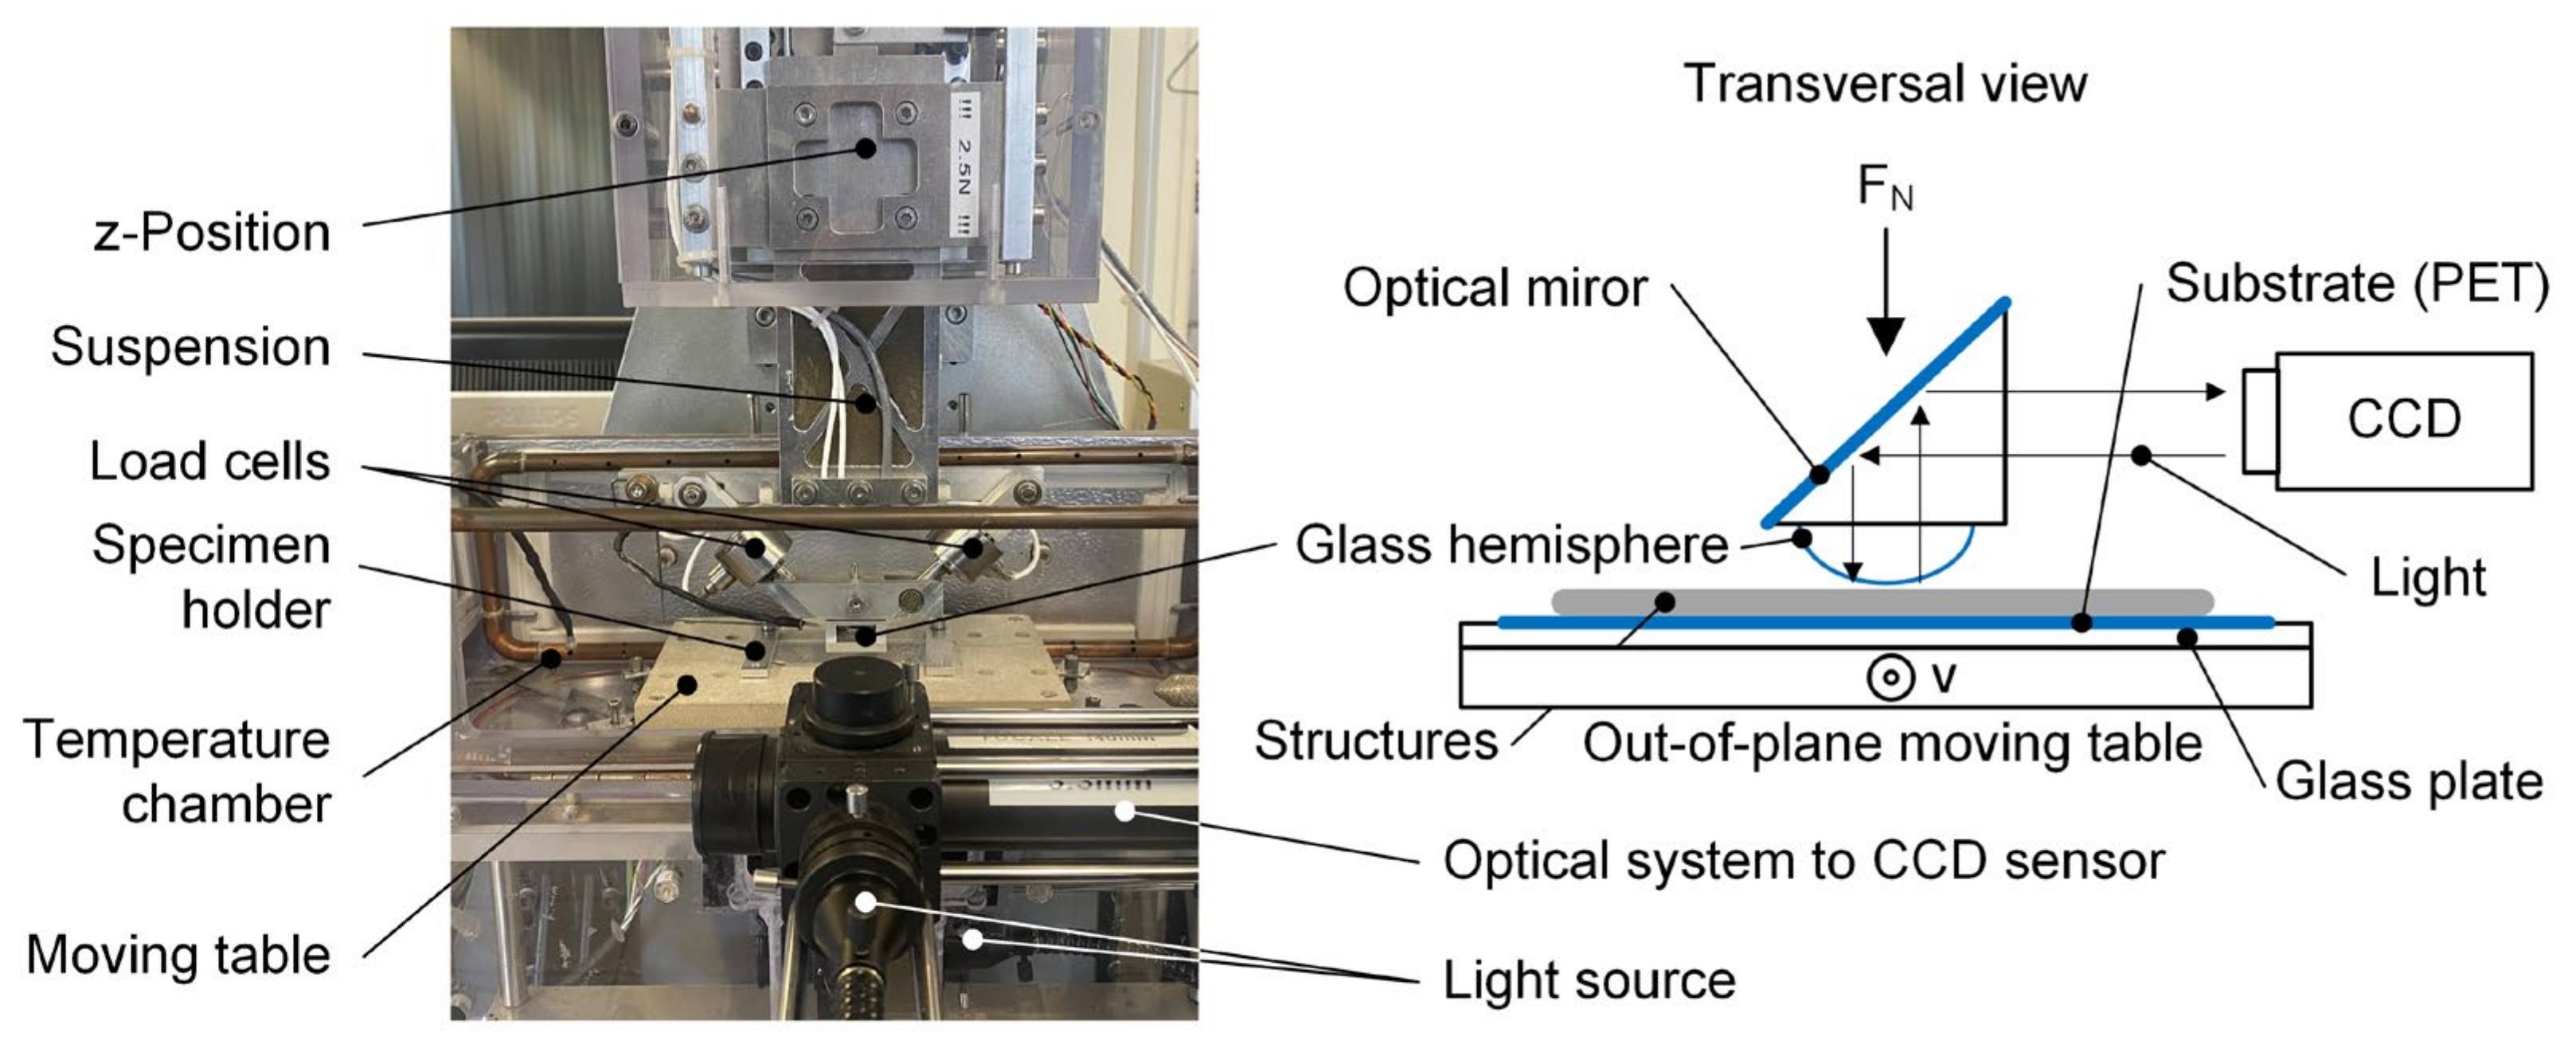
2.4. In Situ Tribometer
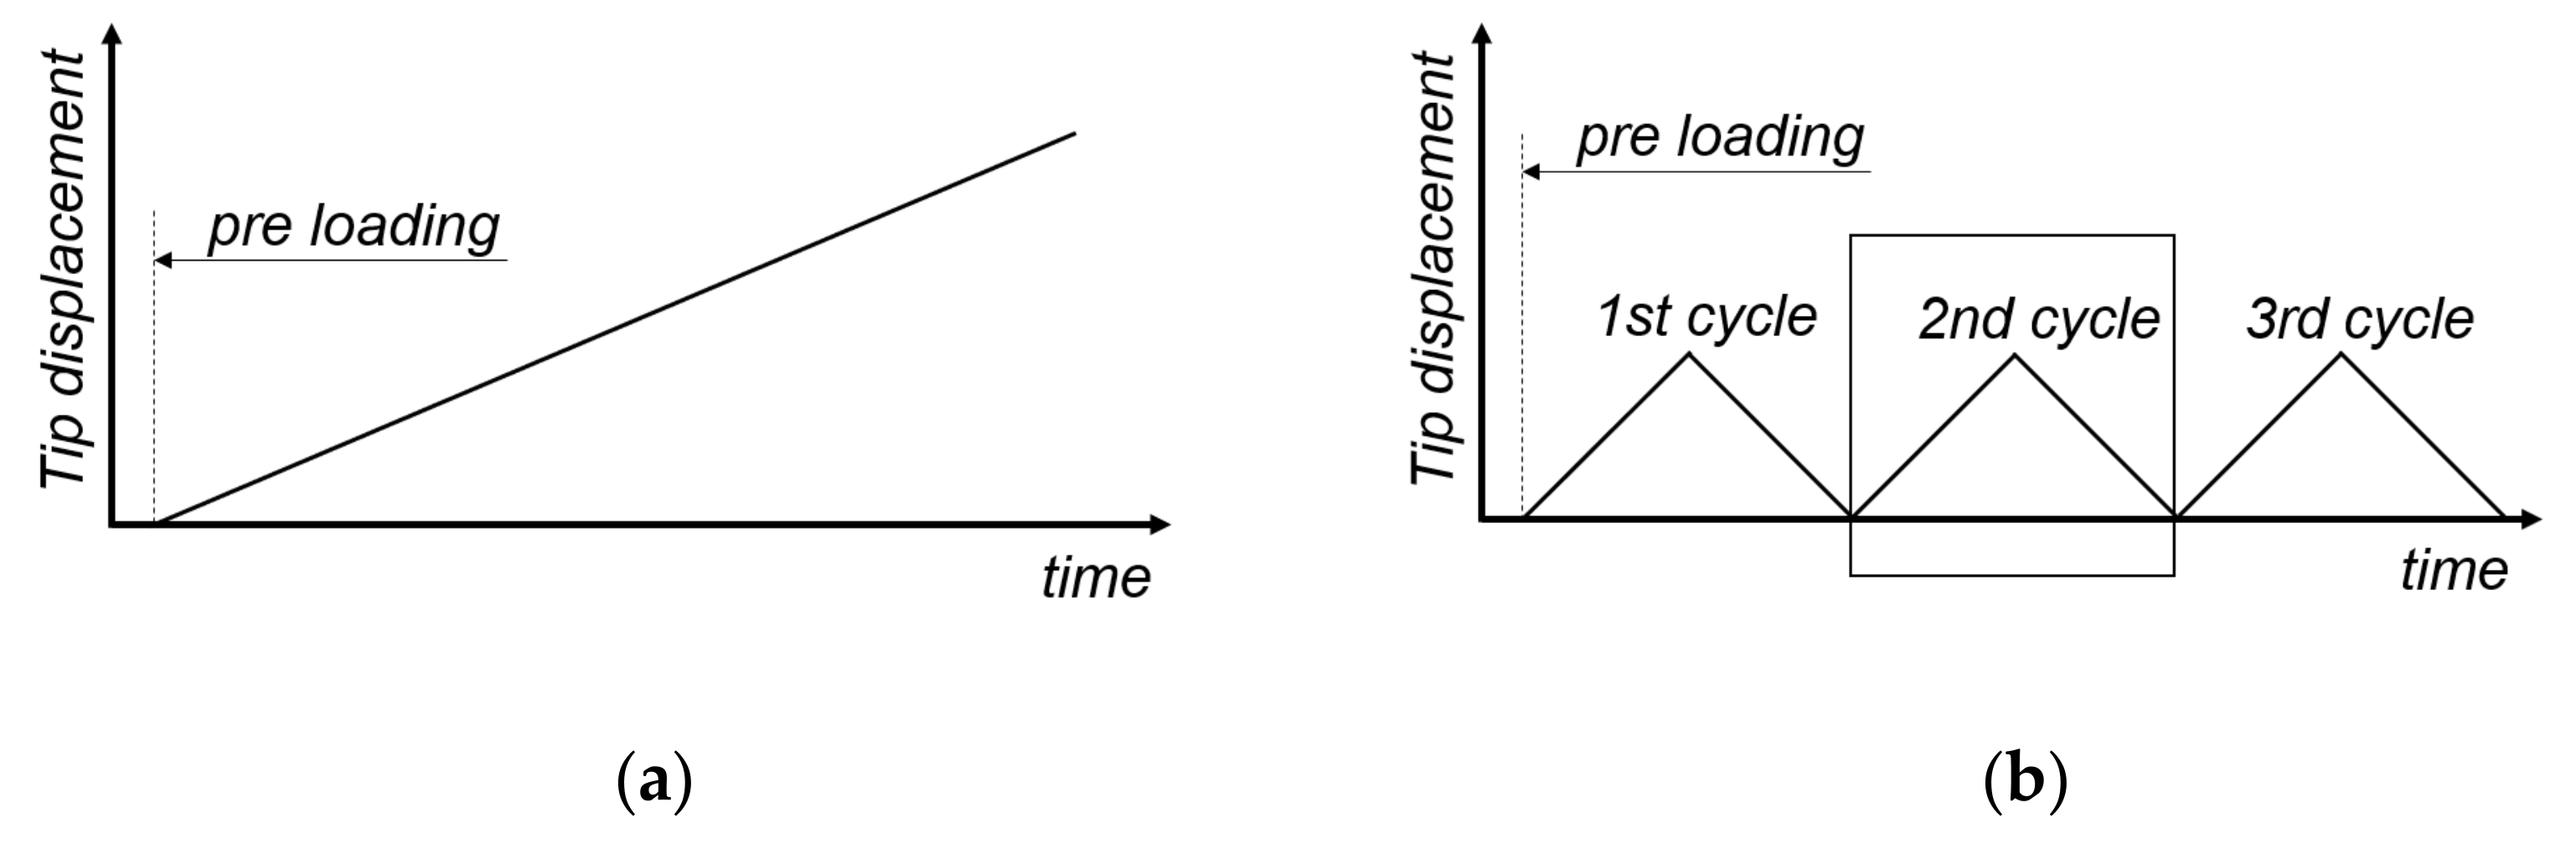
2.5. Linear and Cyclic Motion Testing
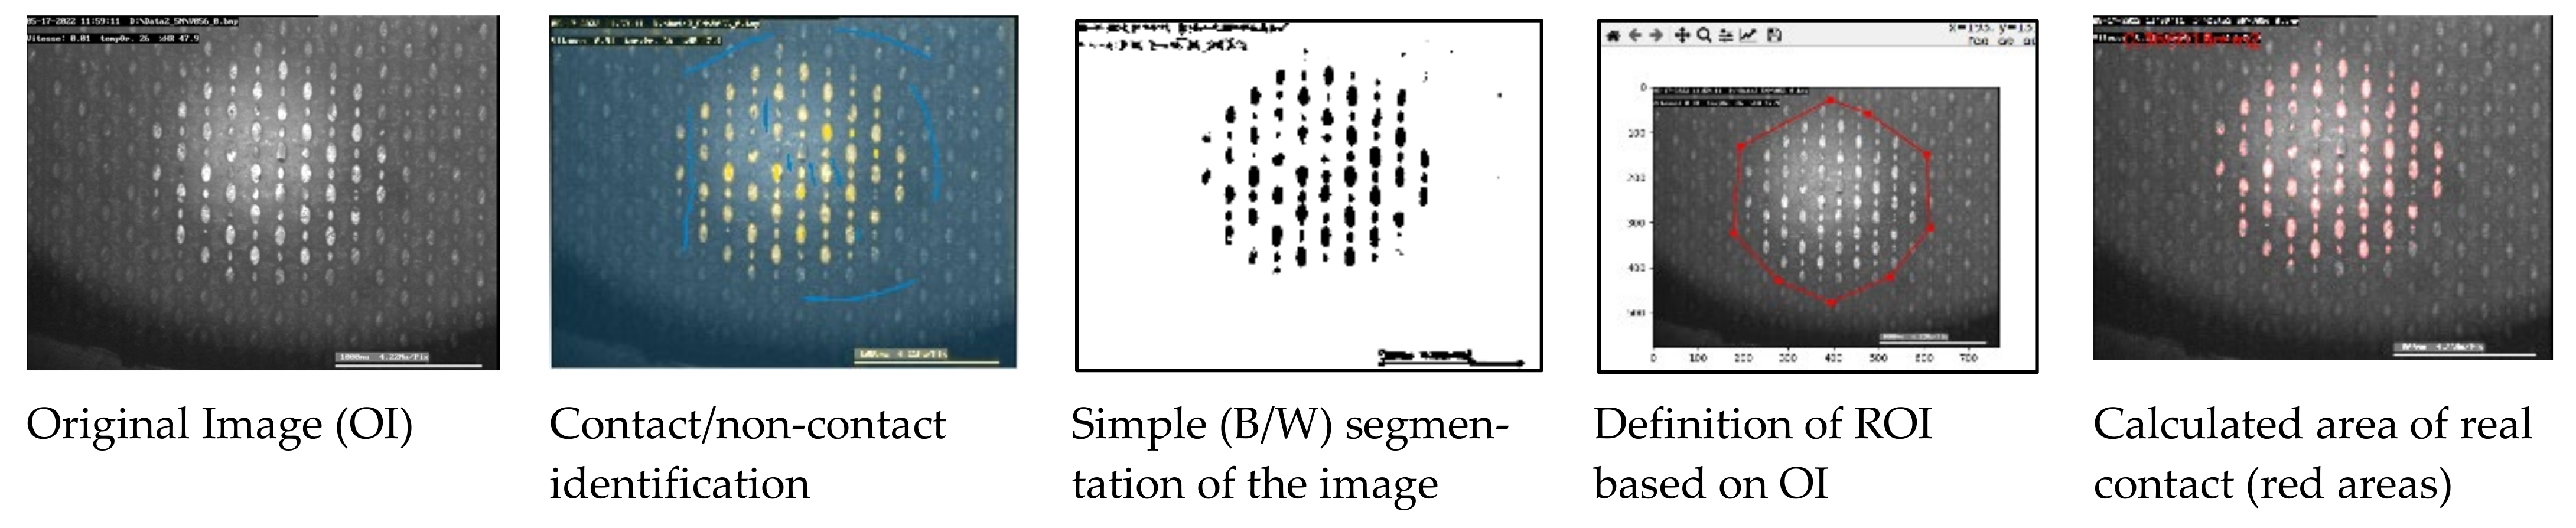
2.6. Area of Real Contact Calculations
2.7. Evaluation of the Contact Parameters
3. Results
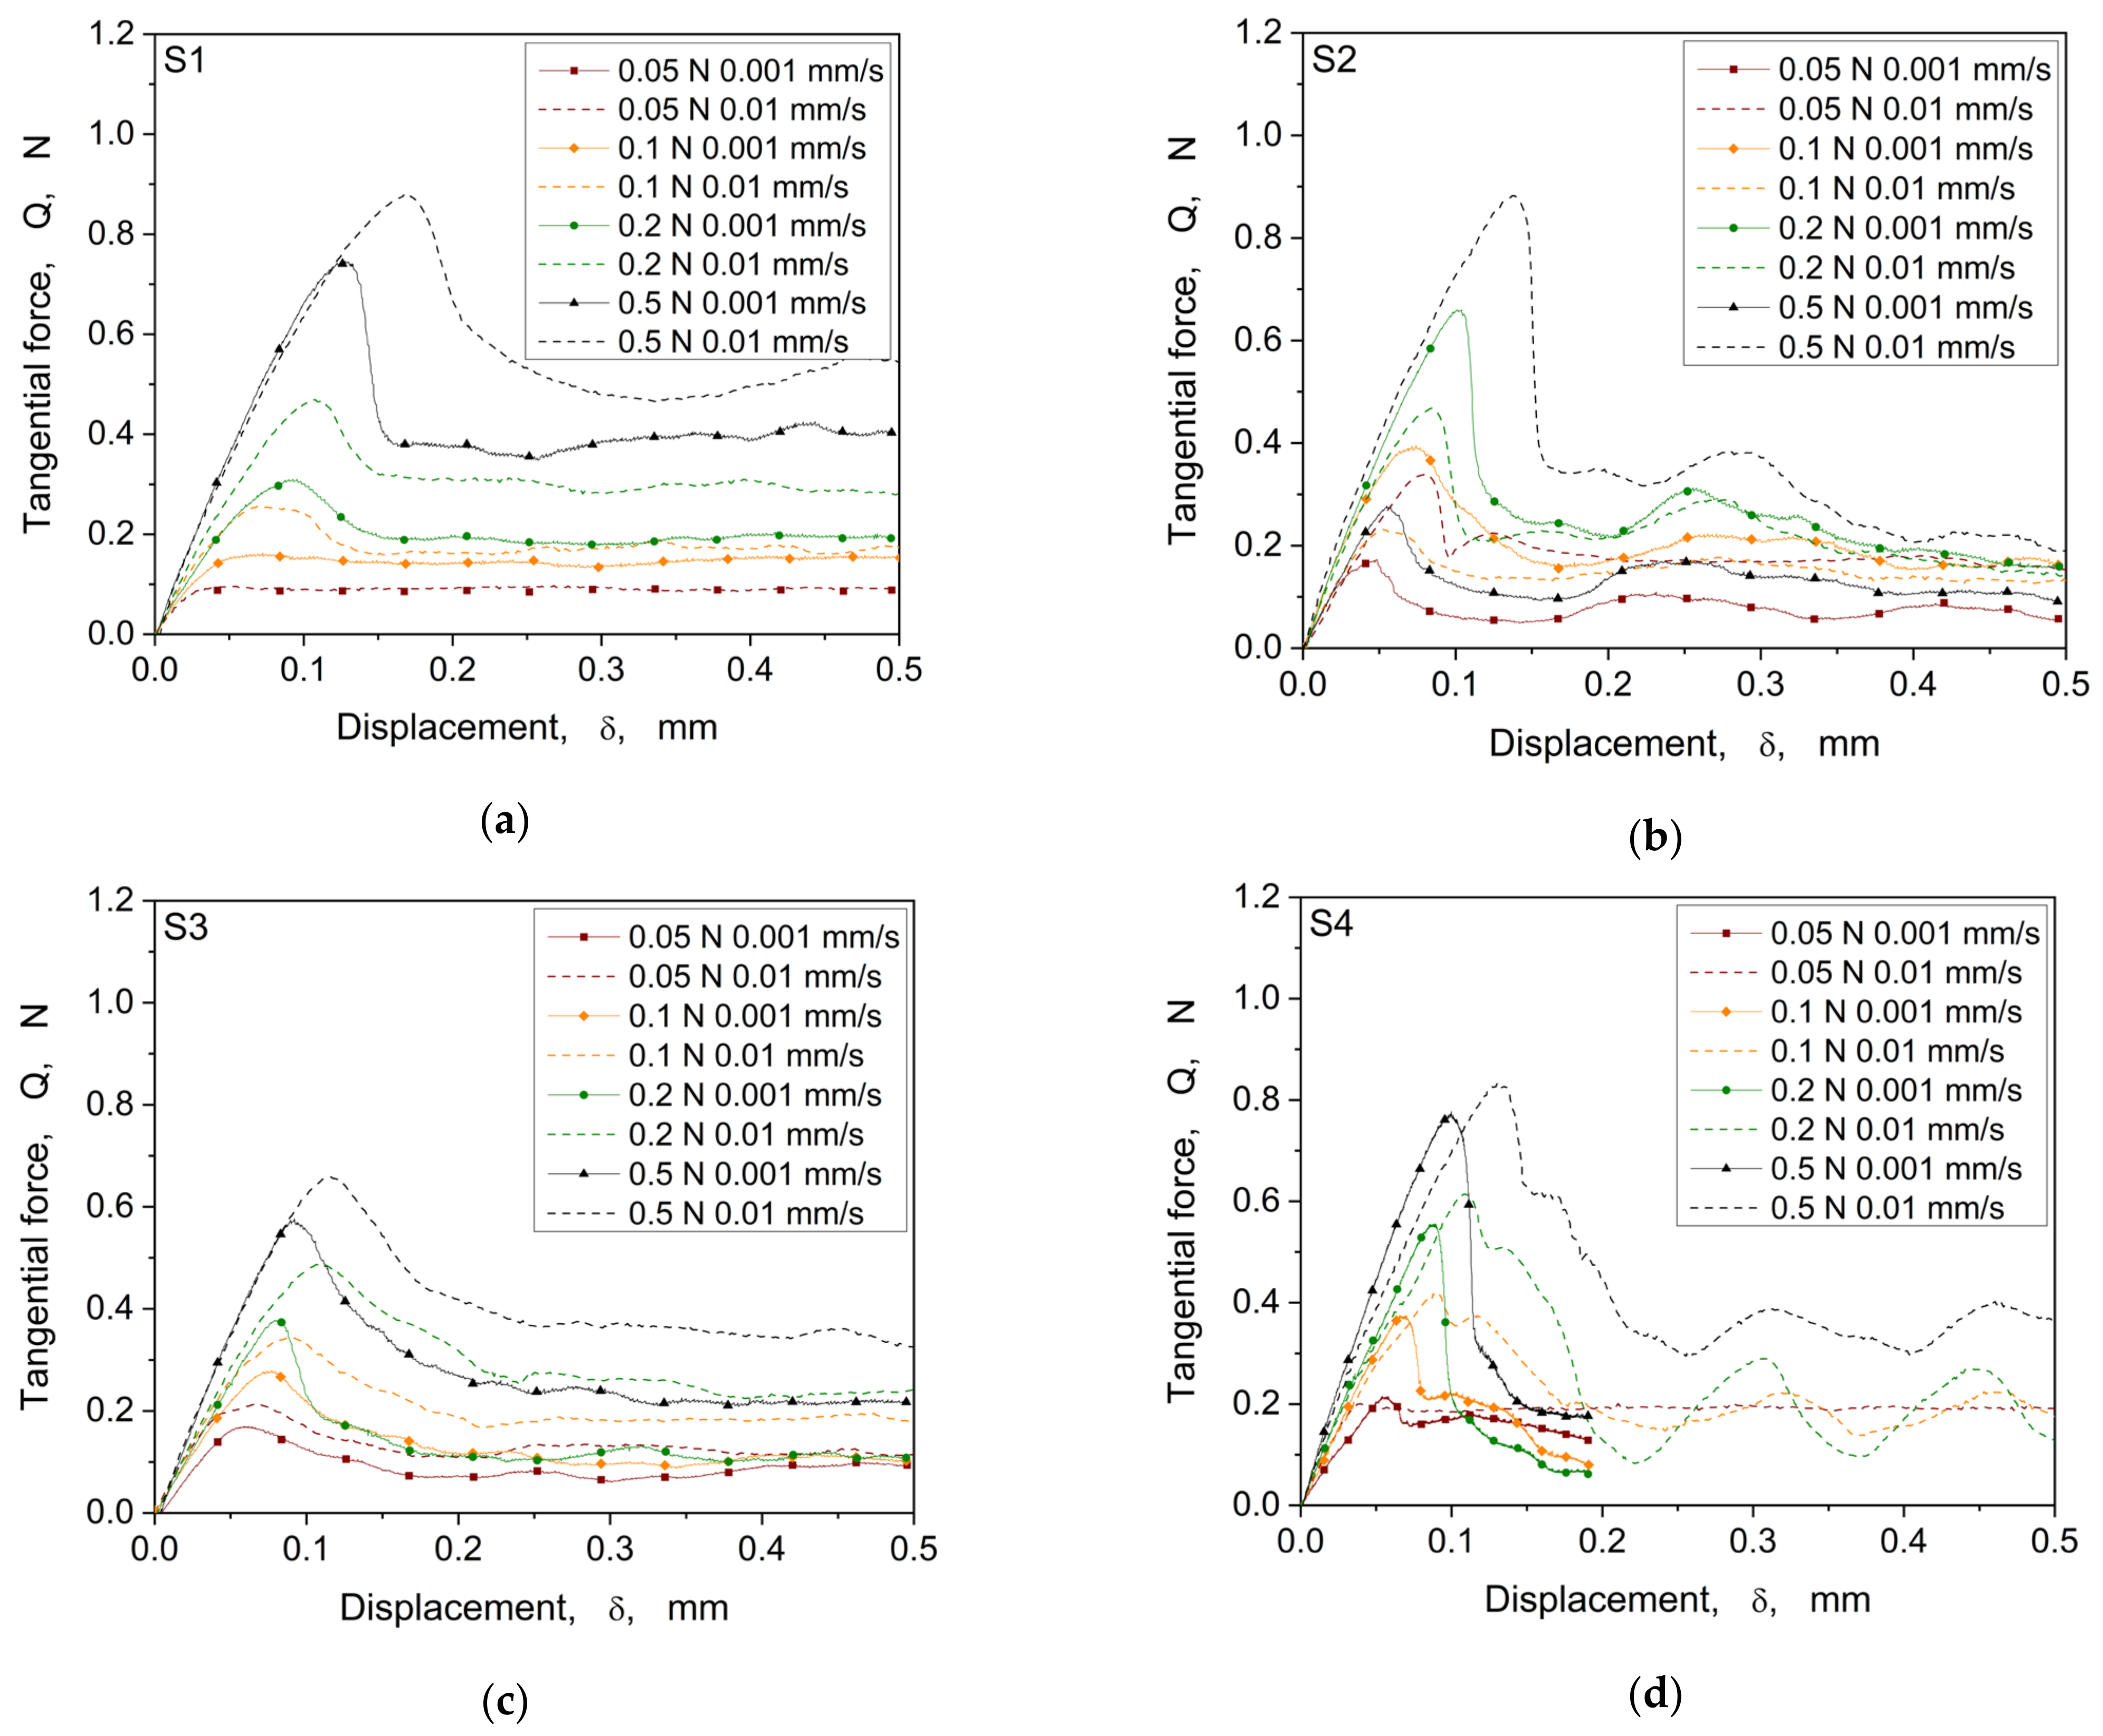
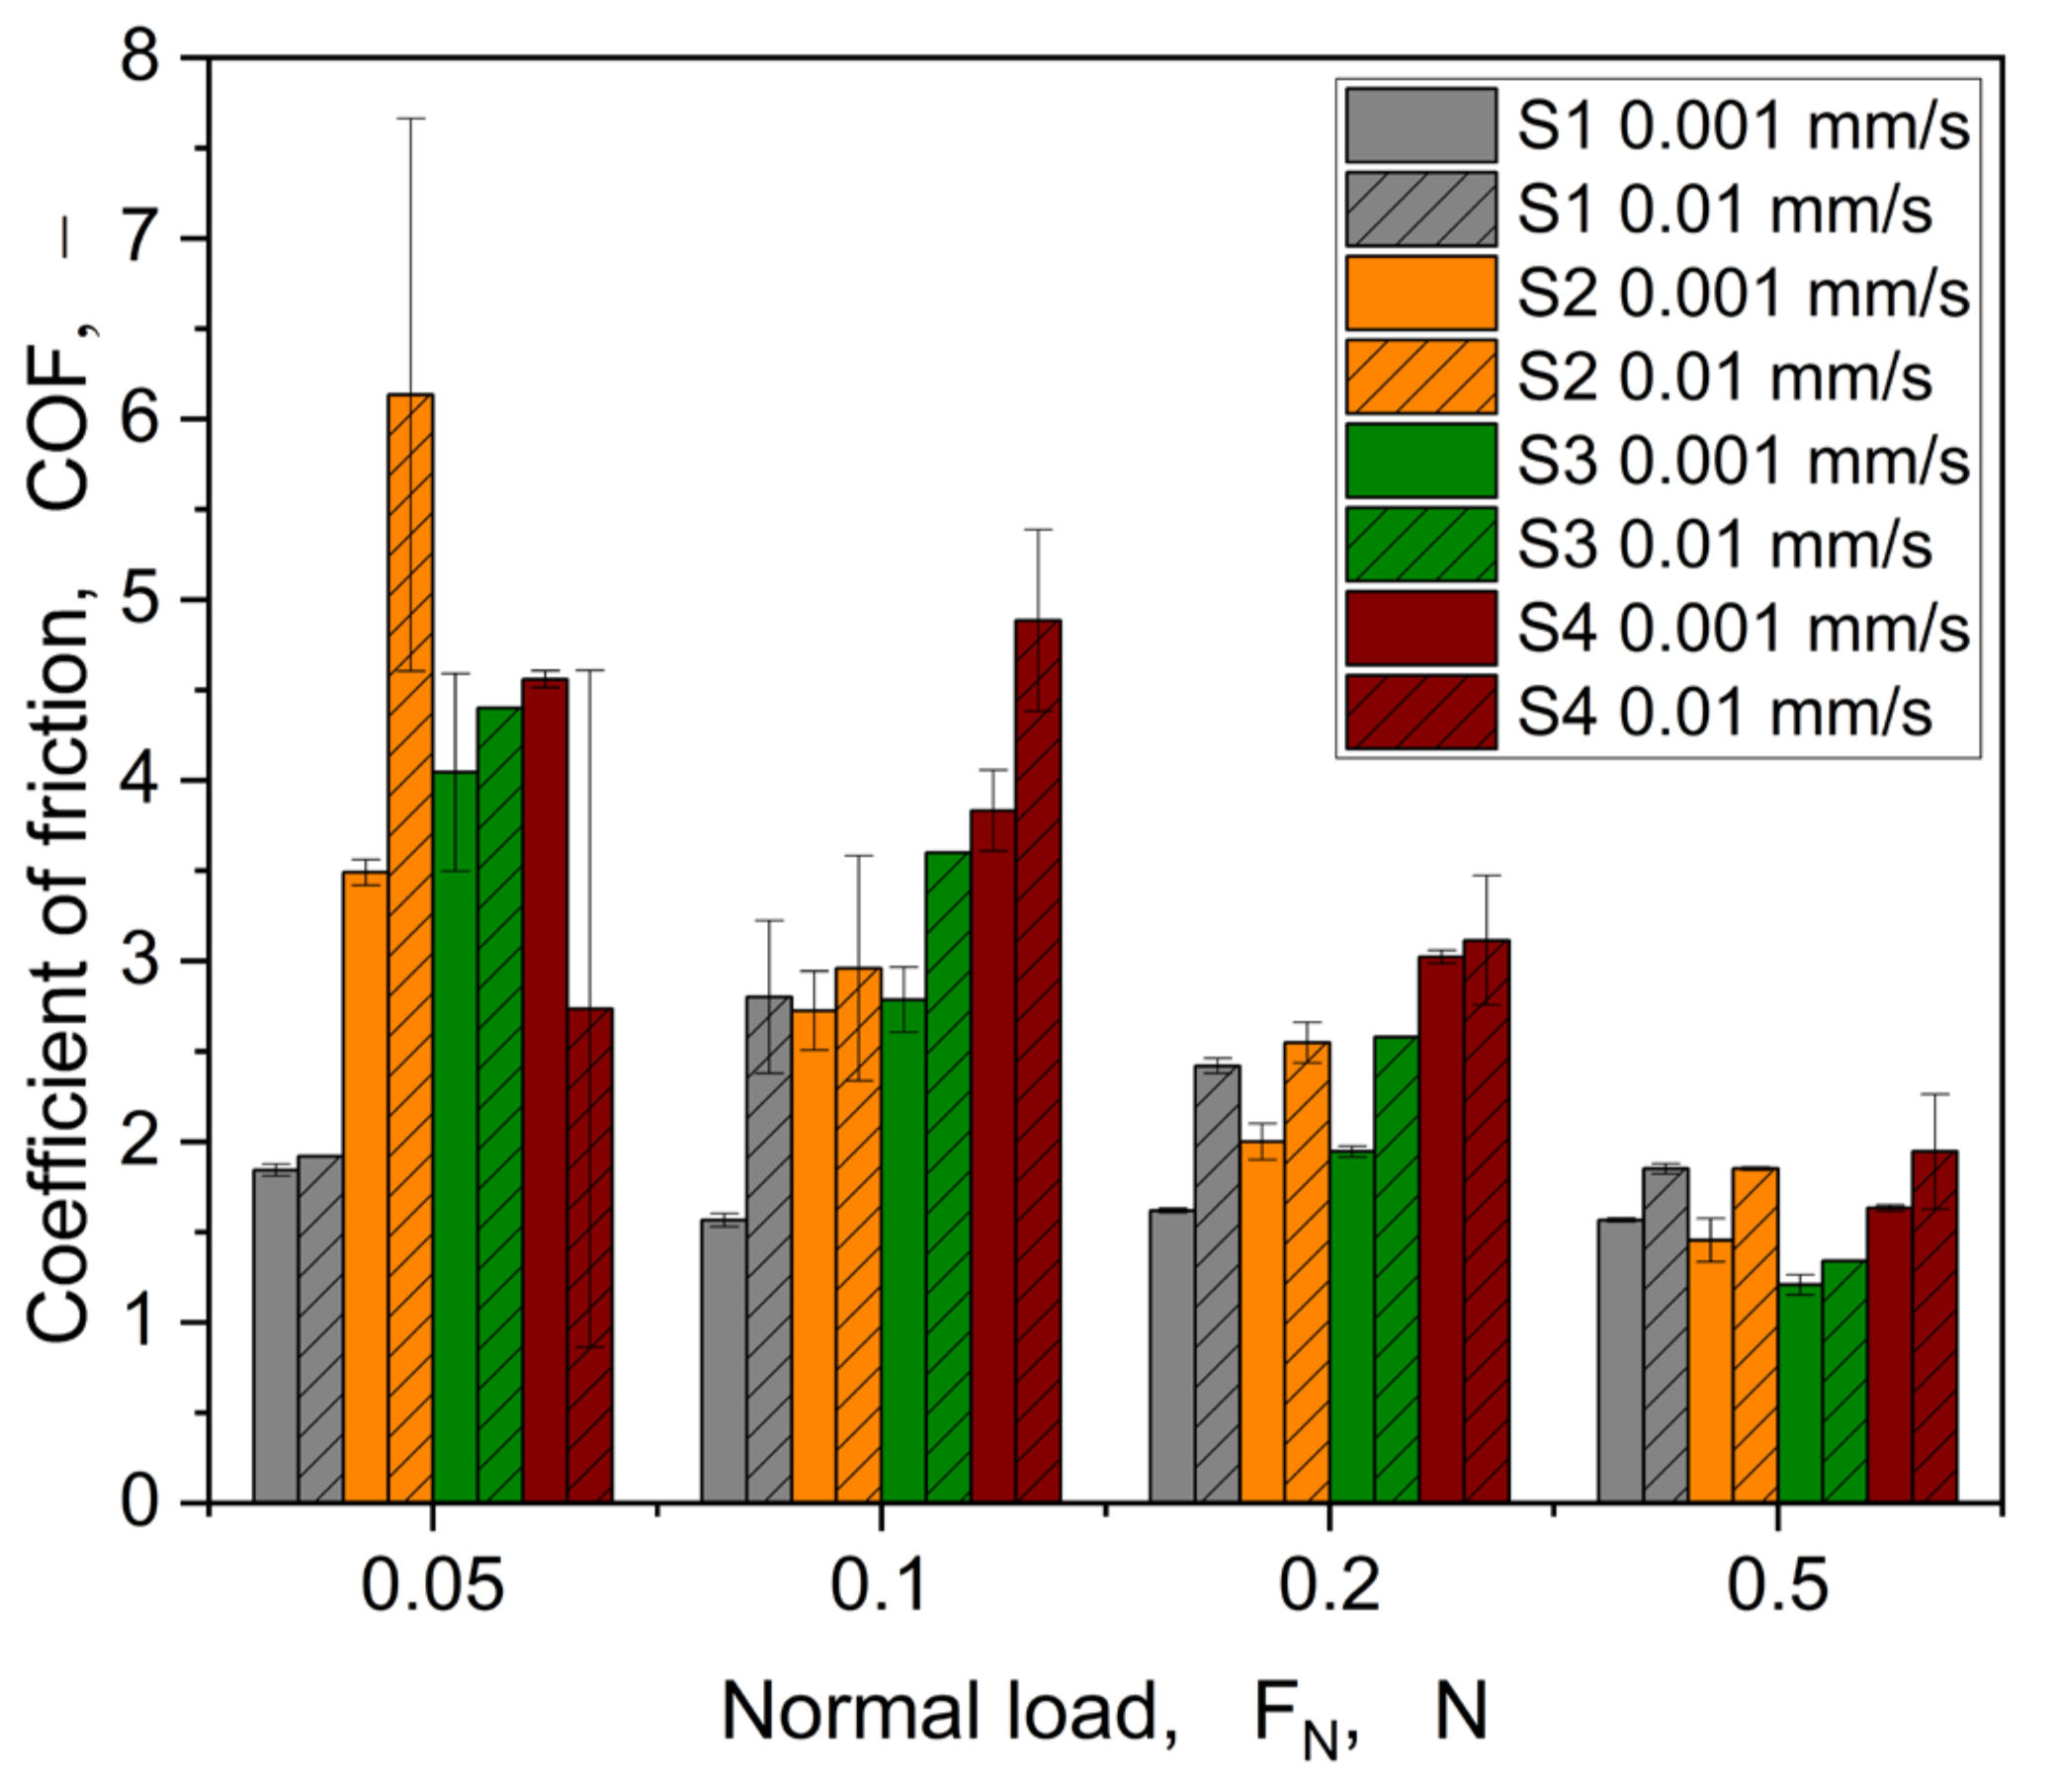
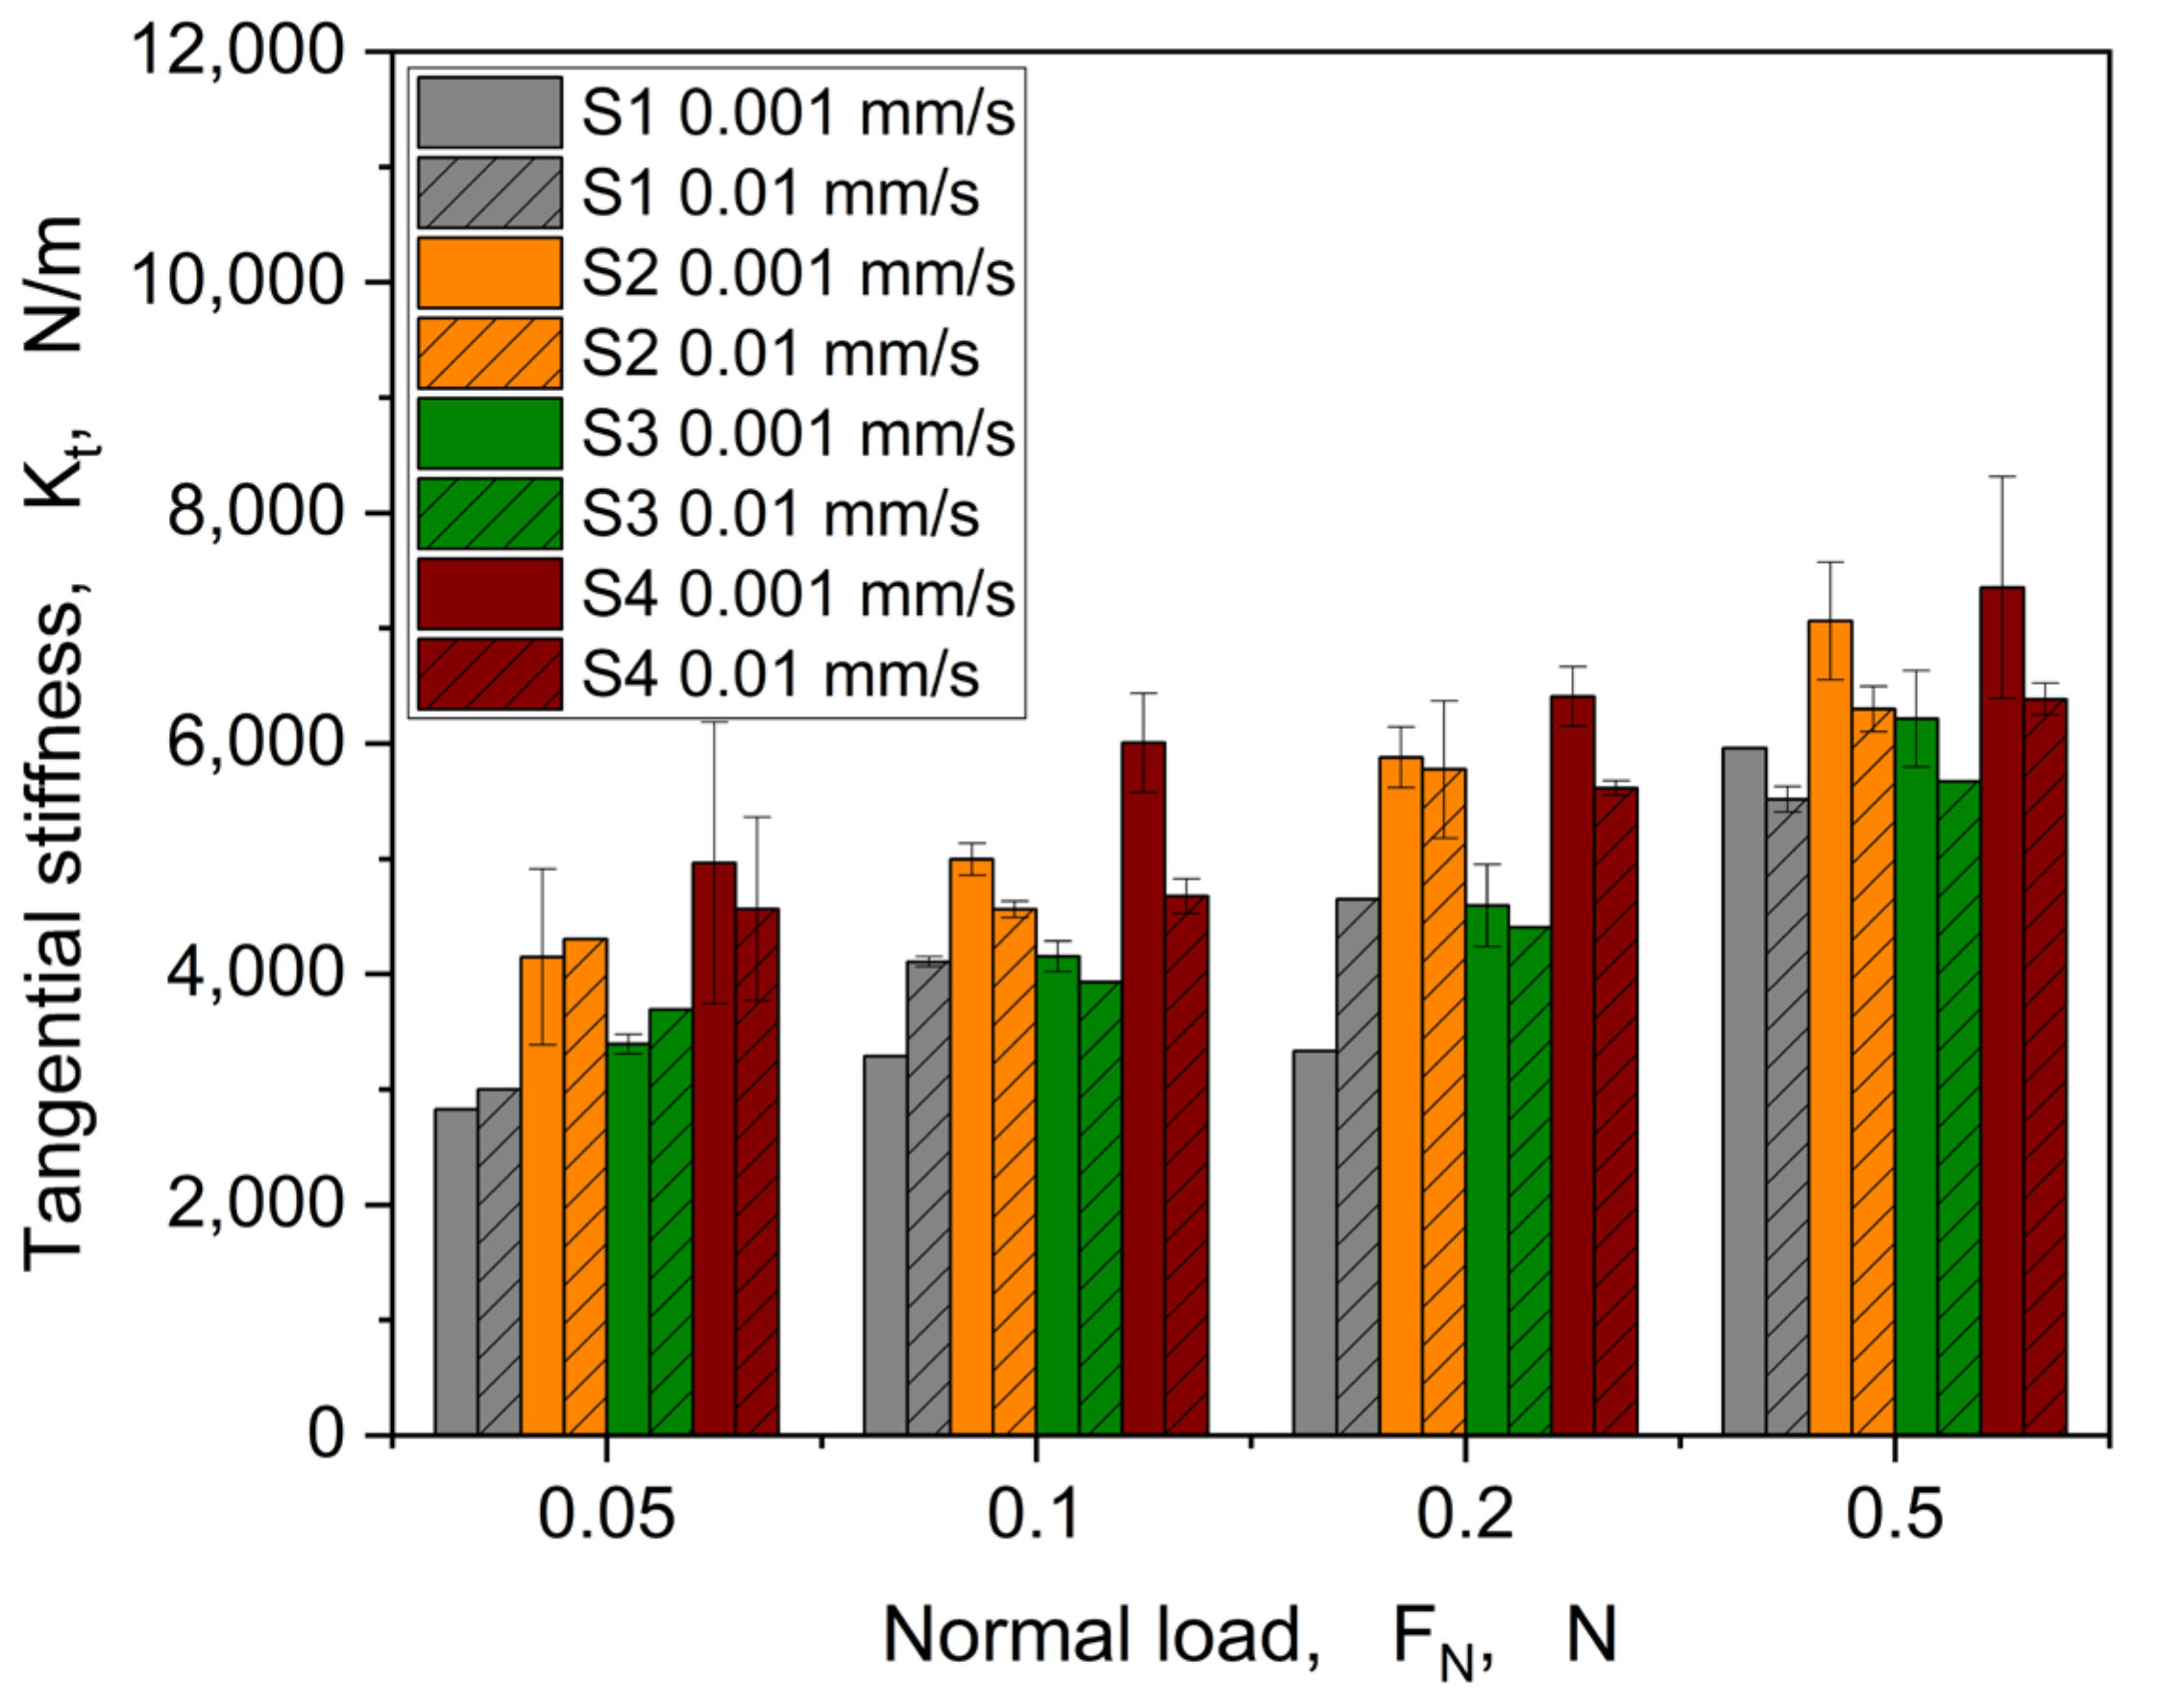
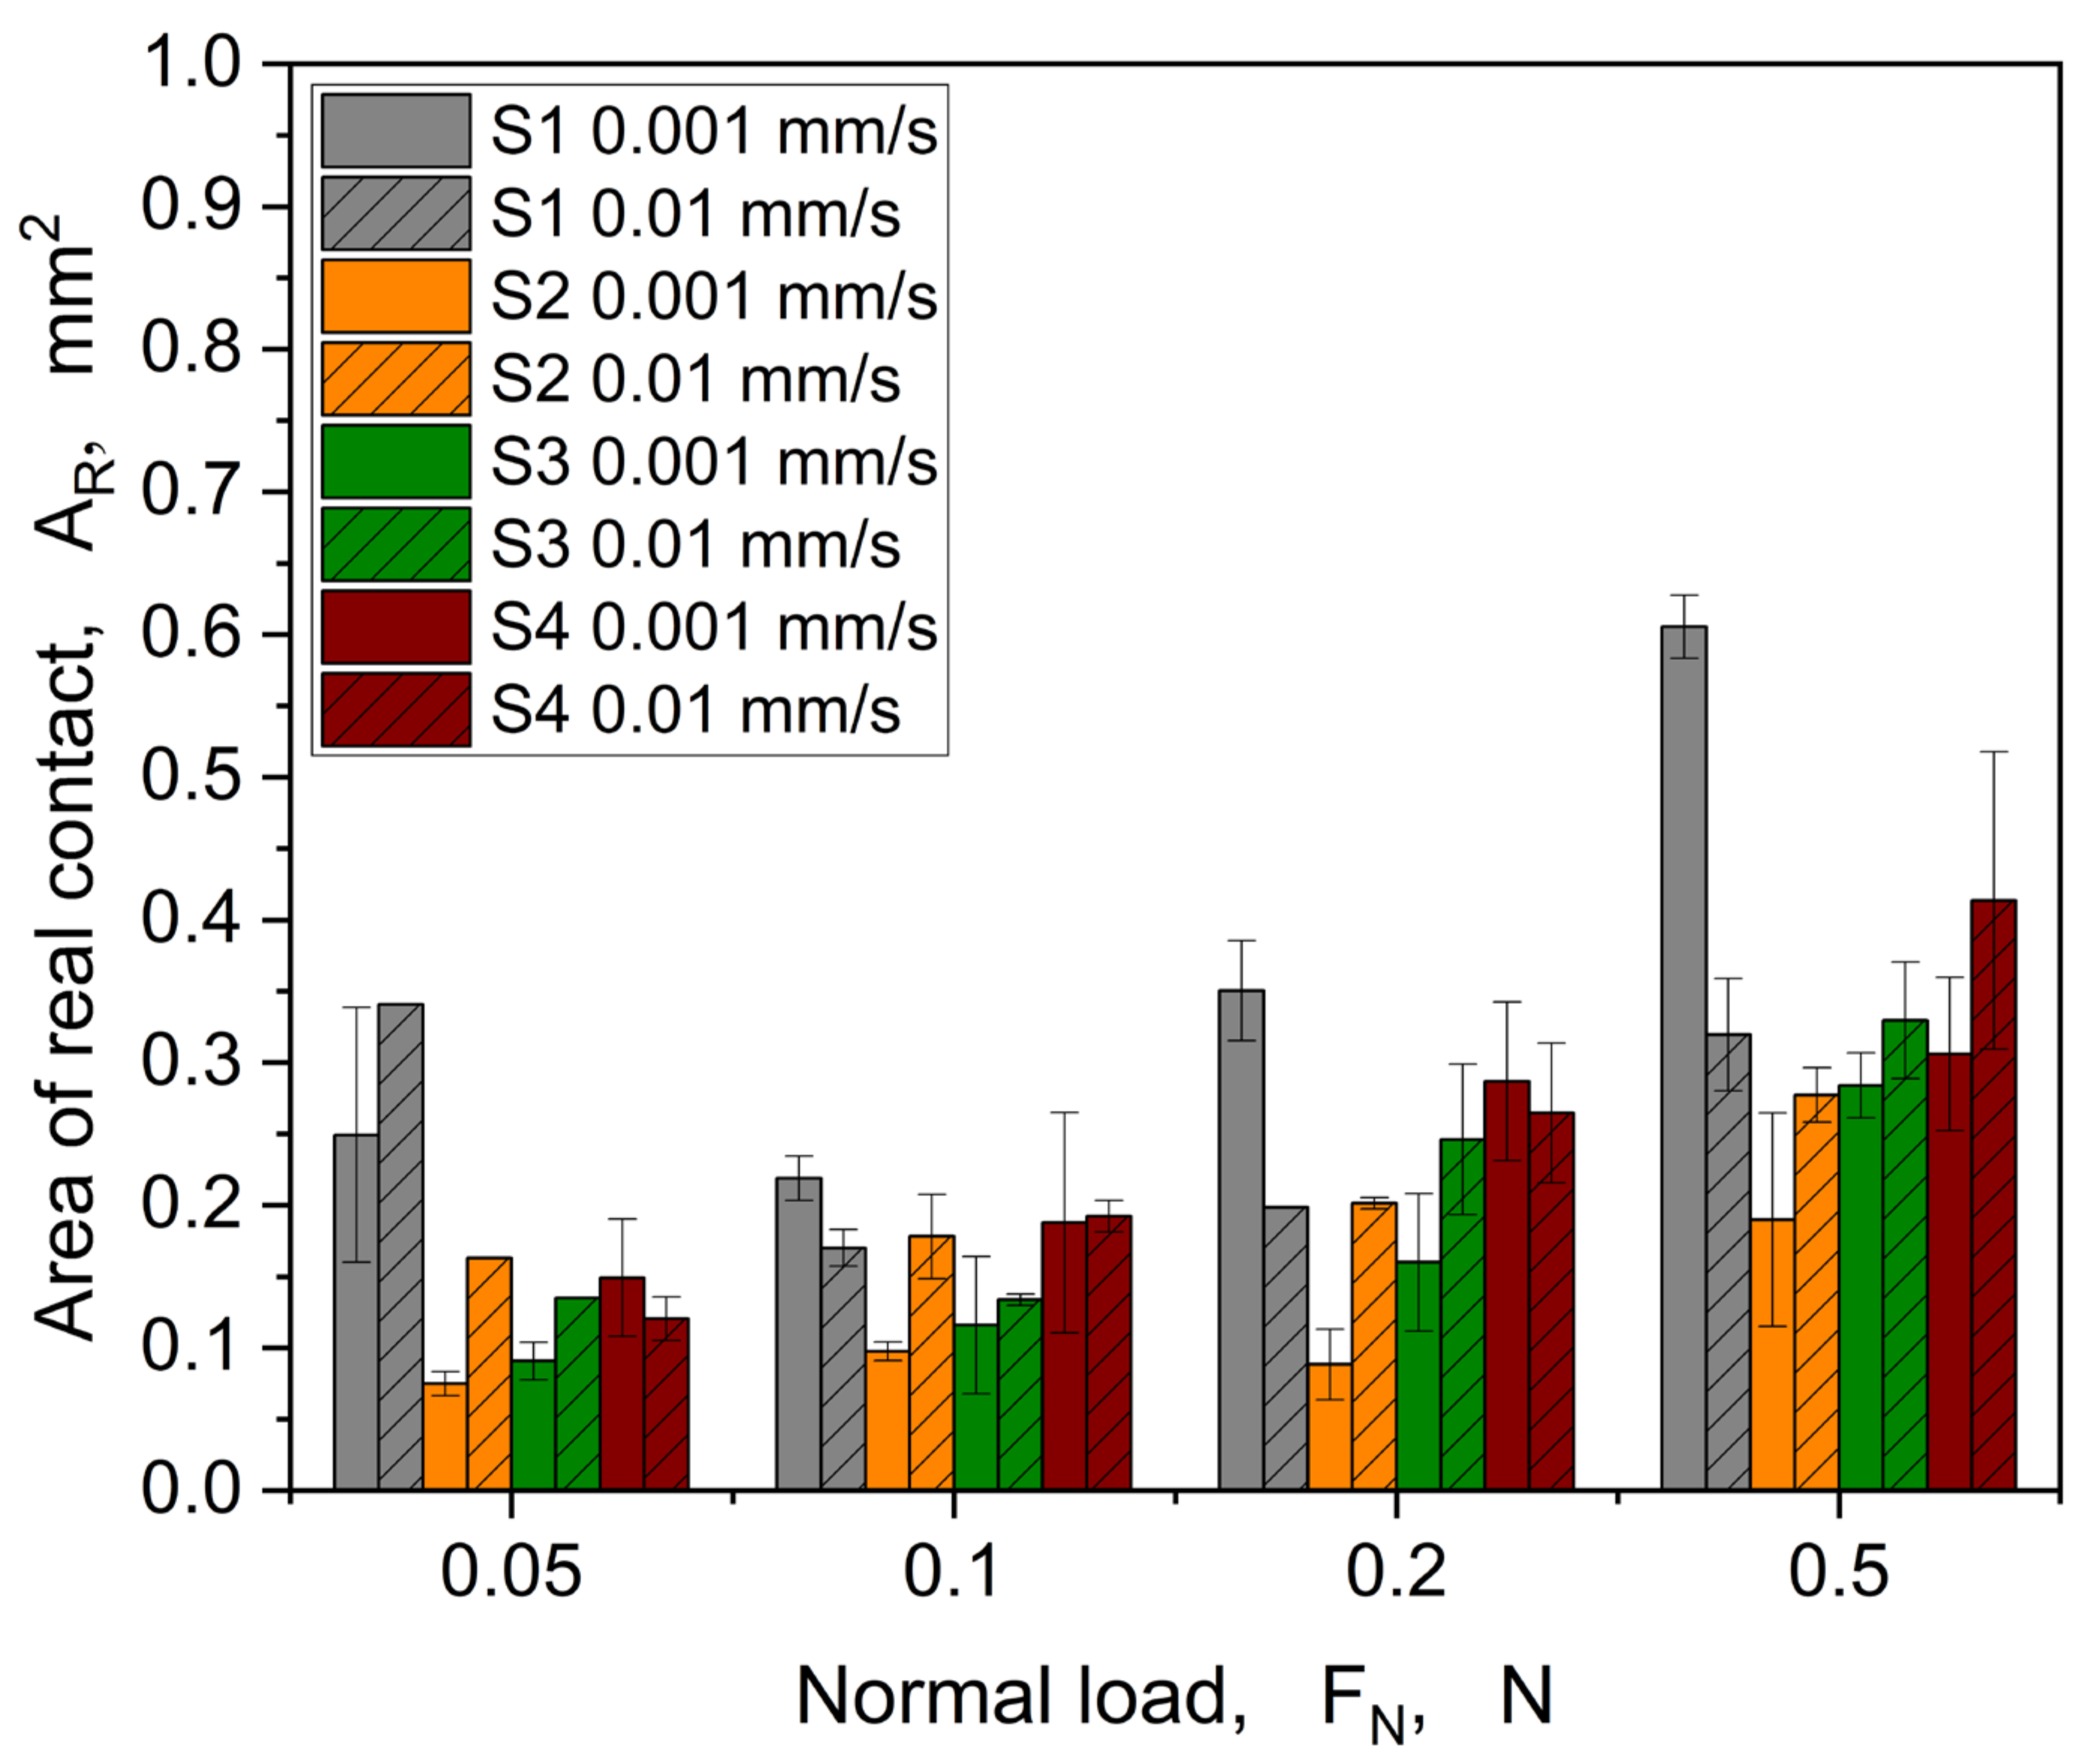
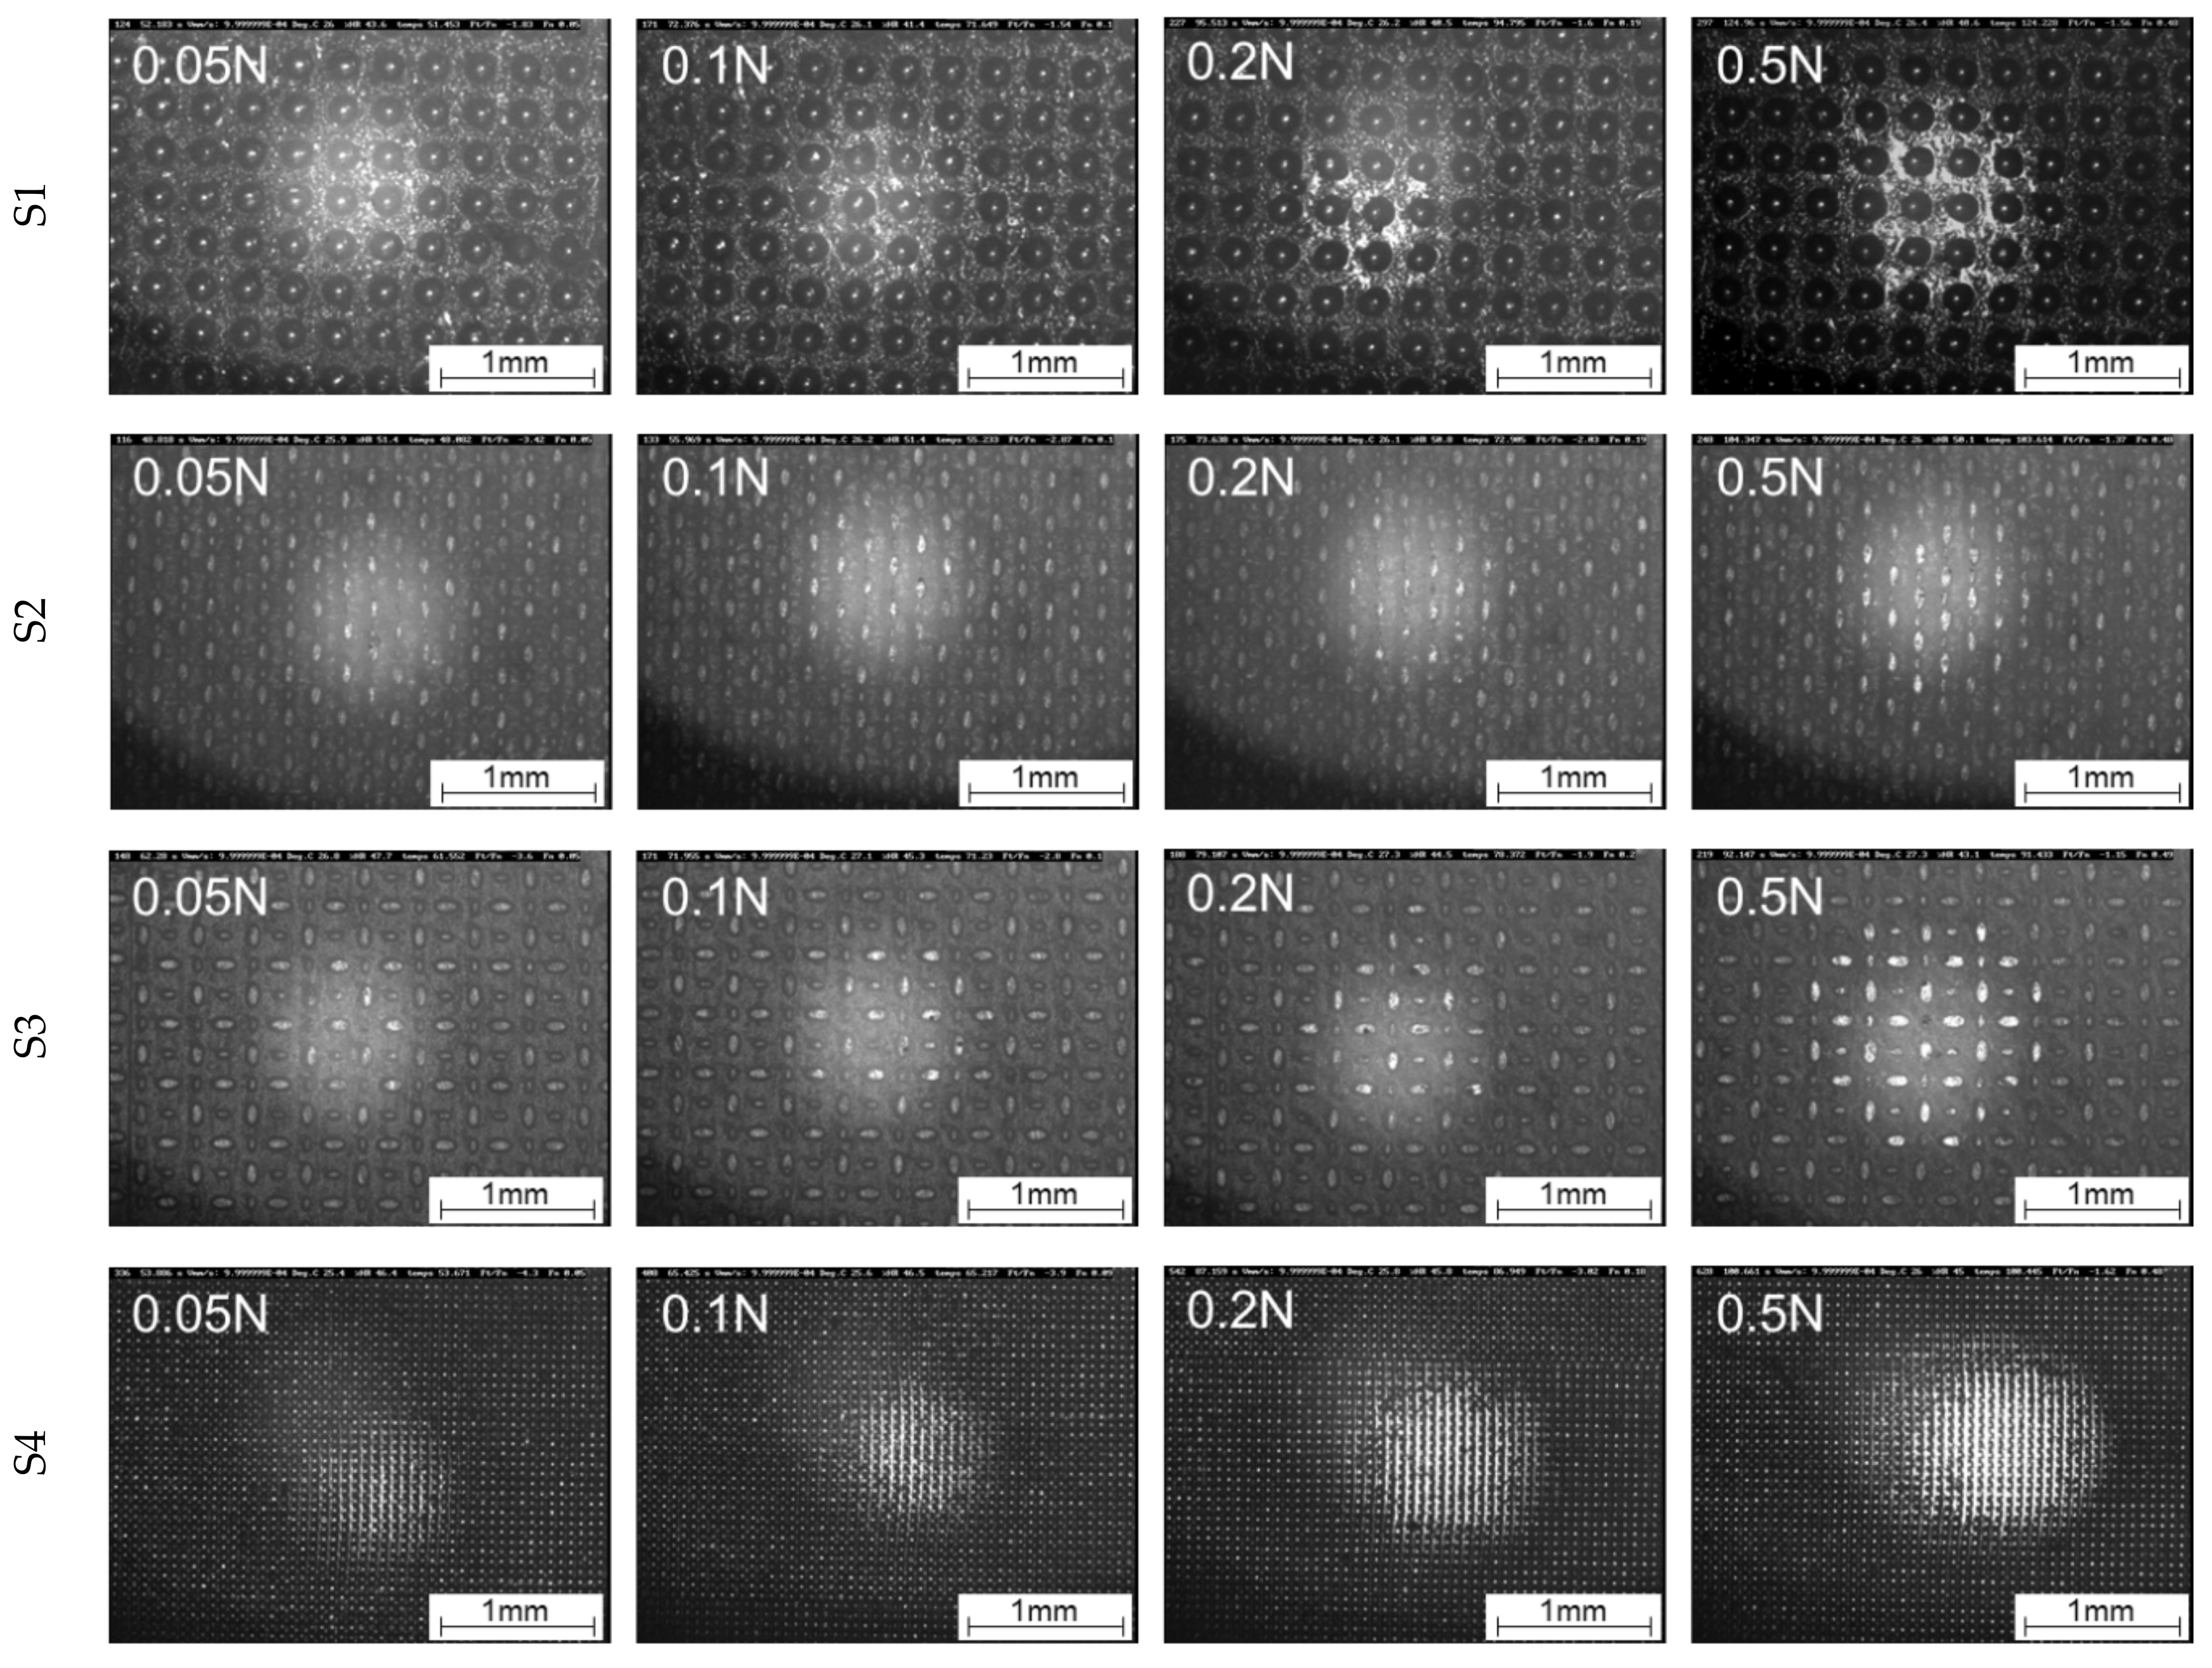
3.1. Linear Motion
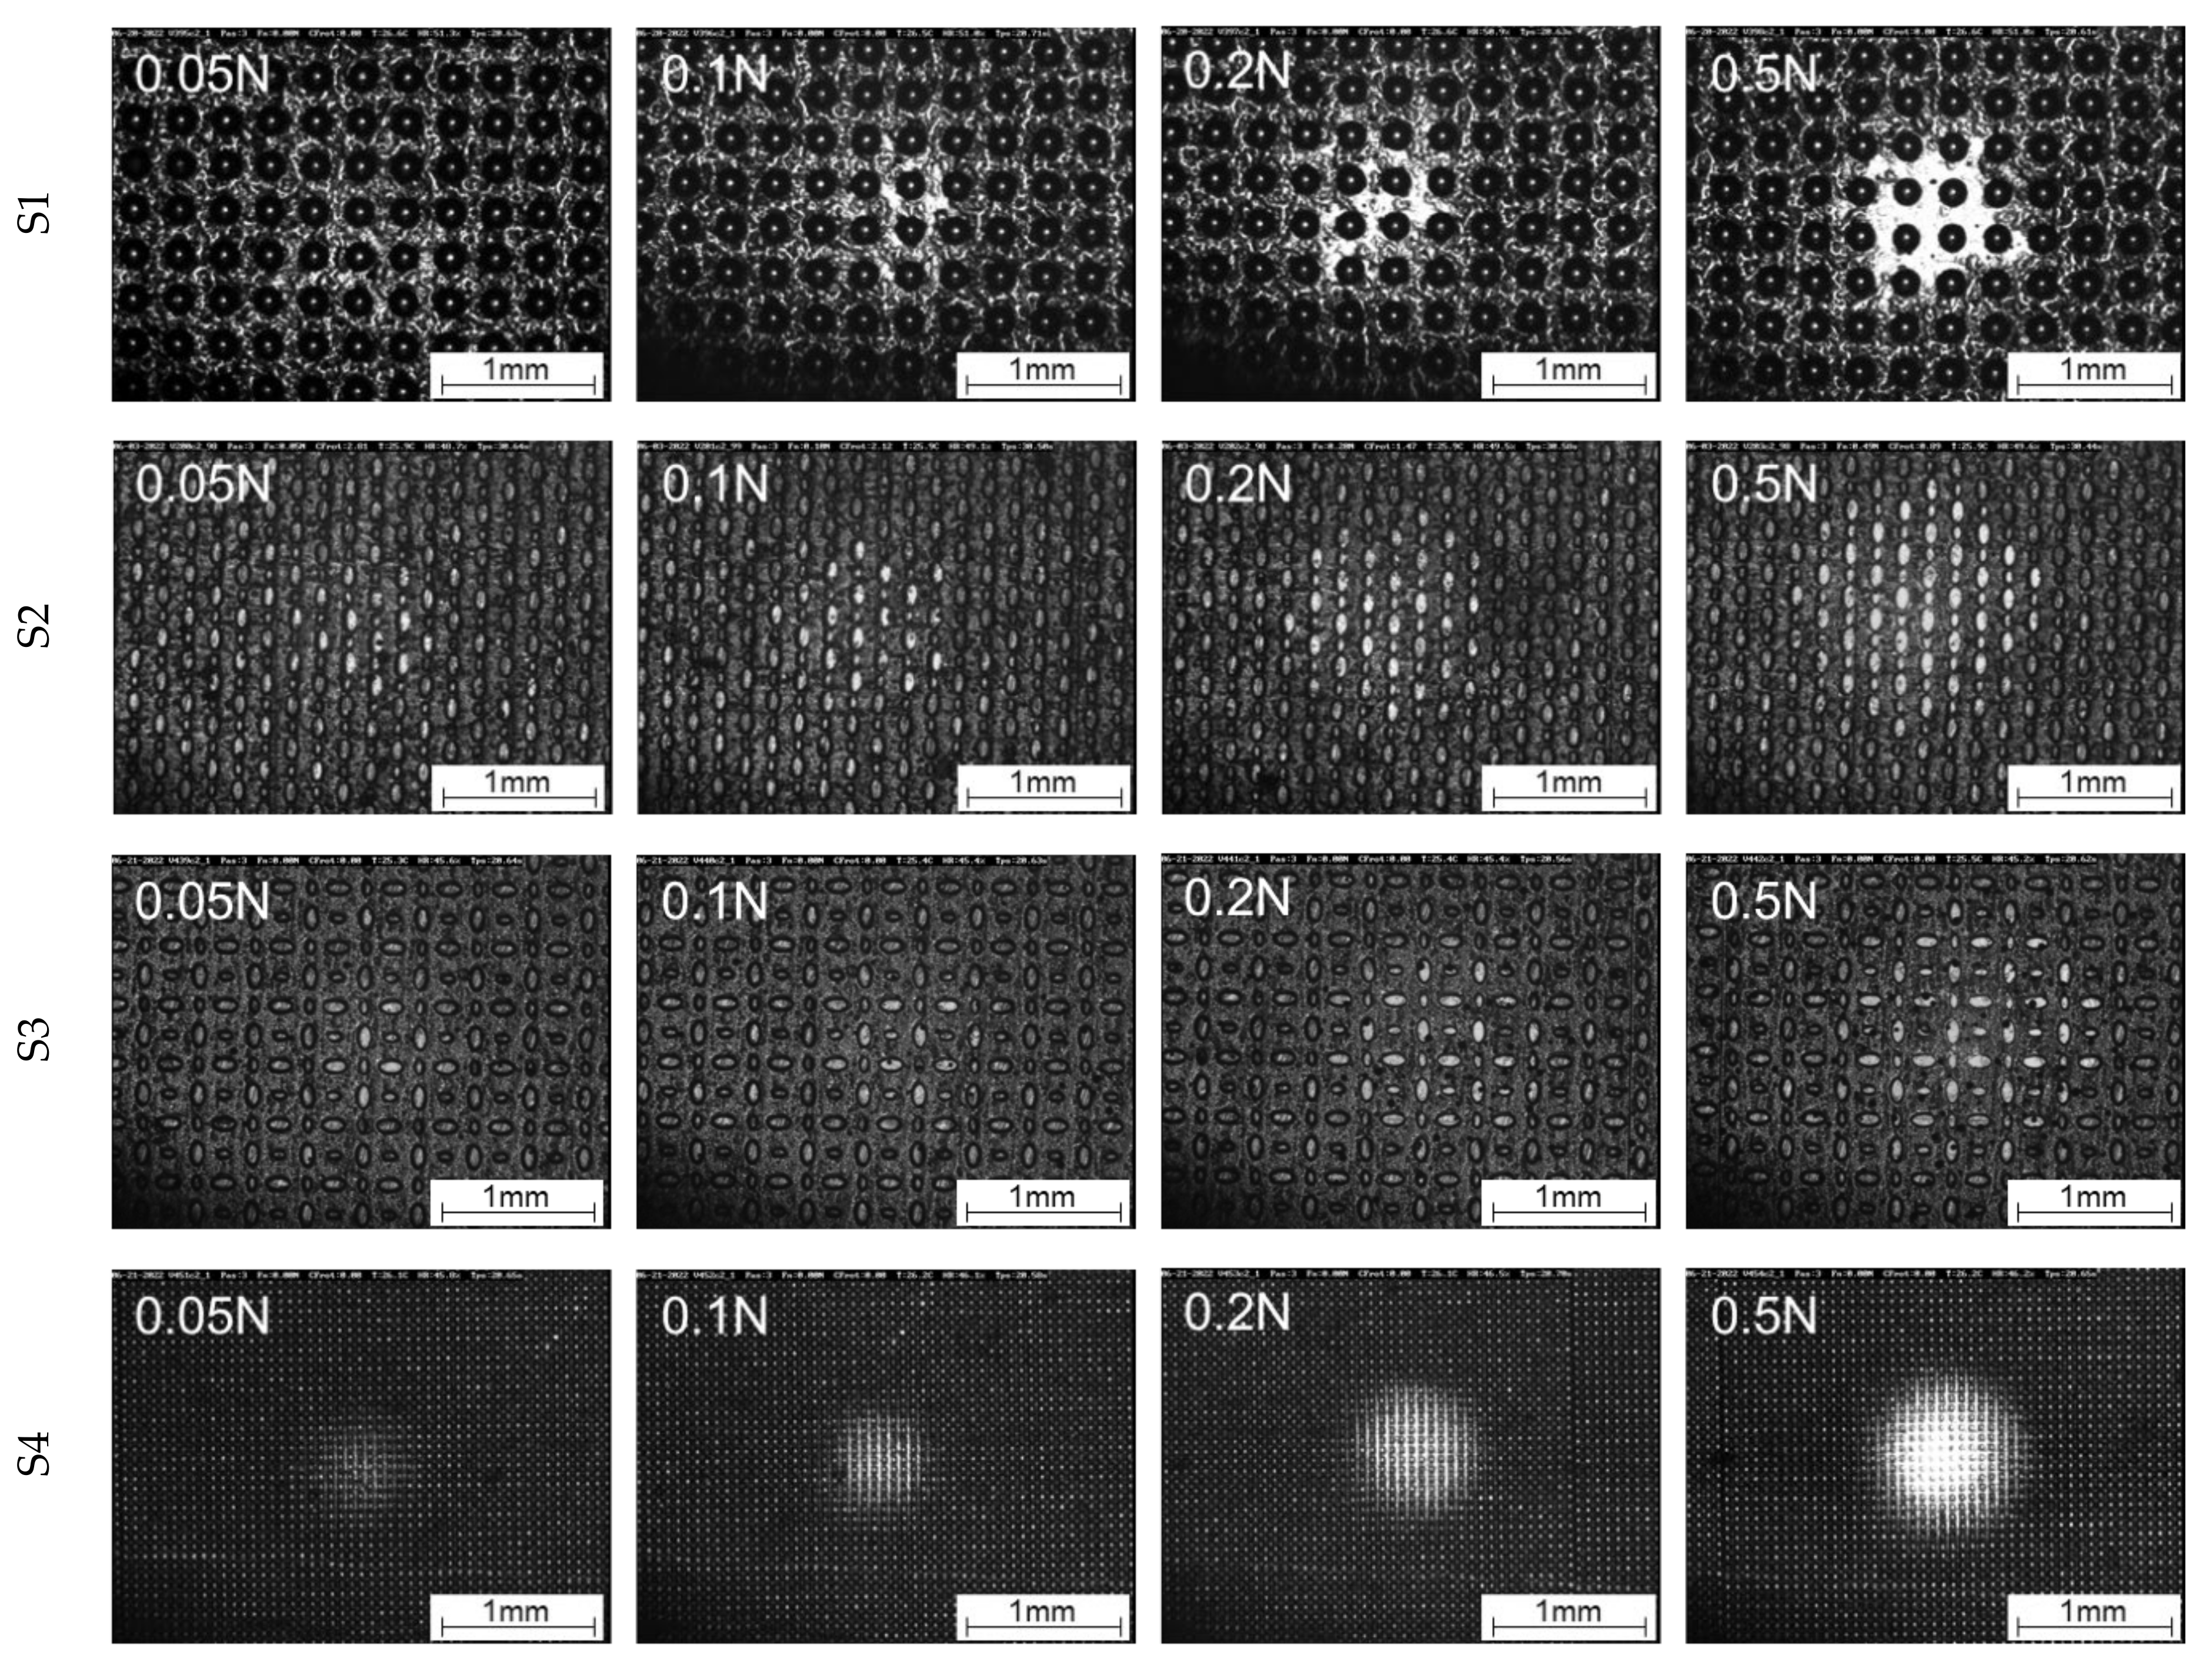
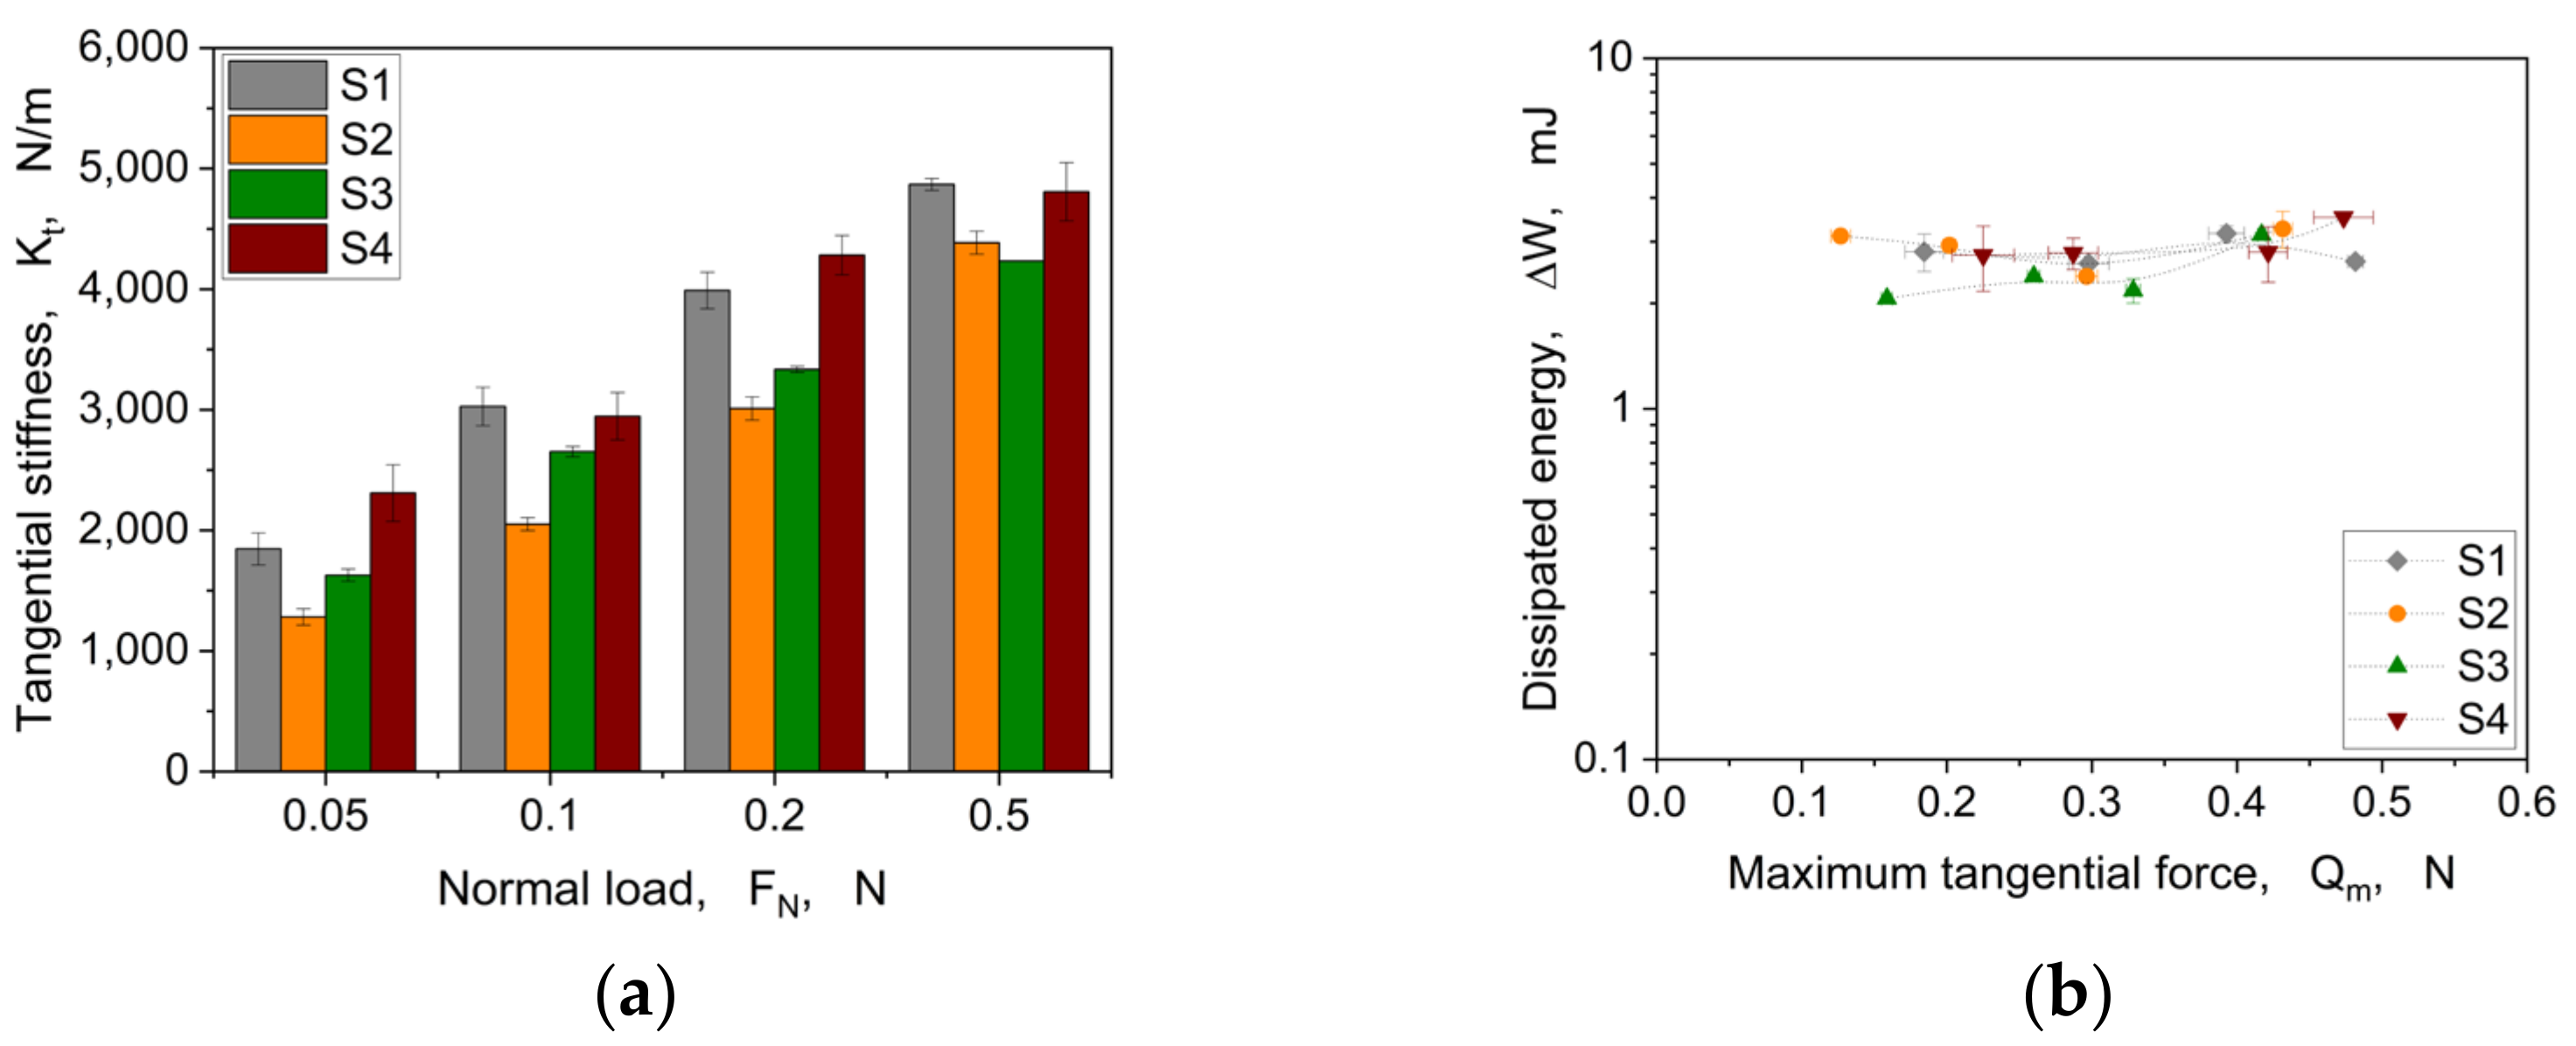
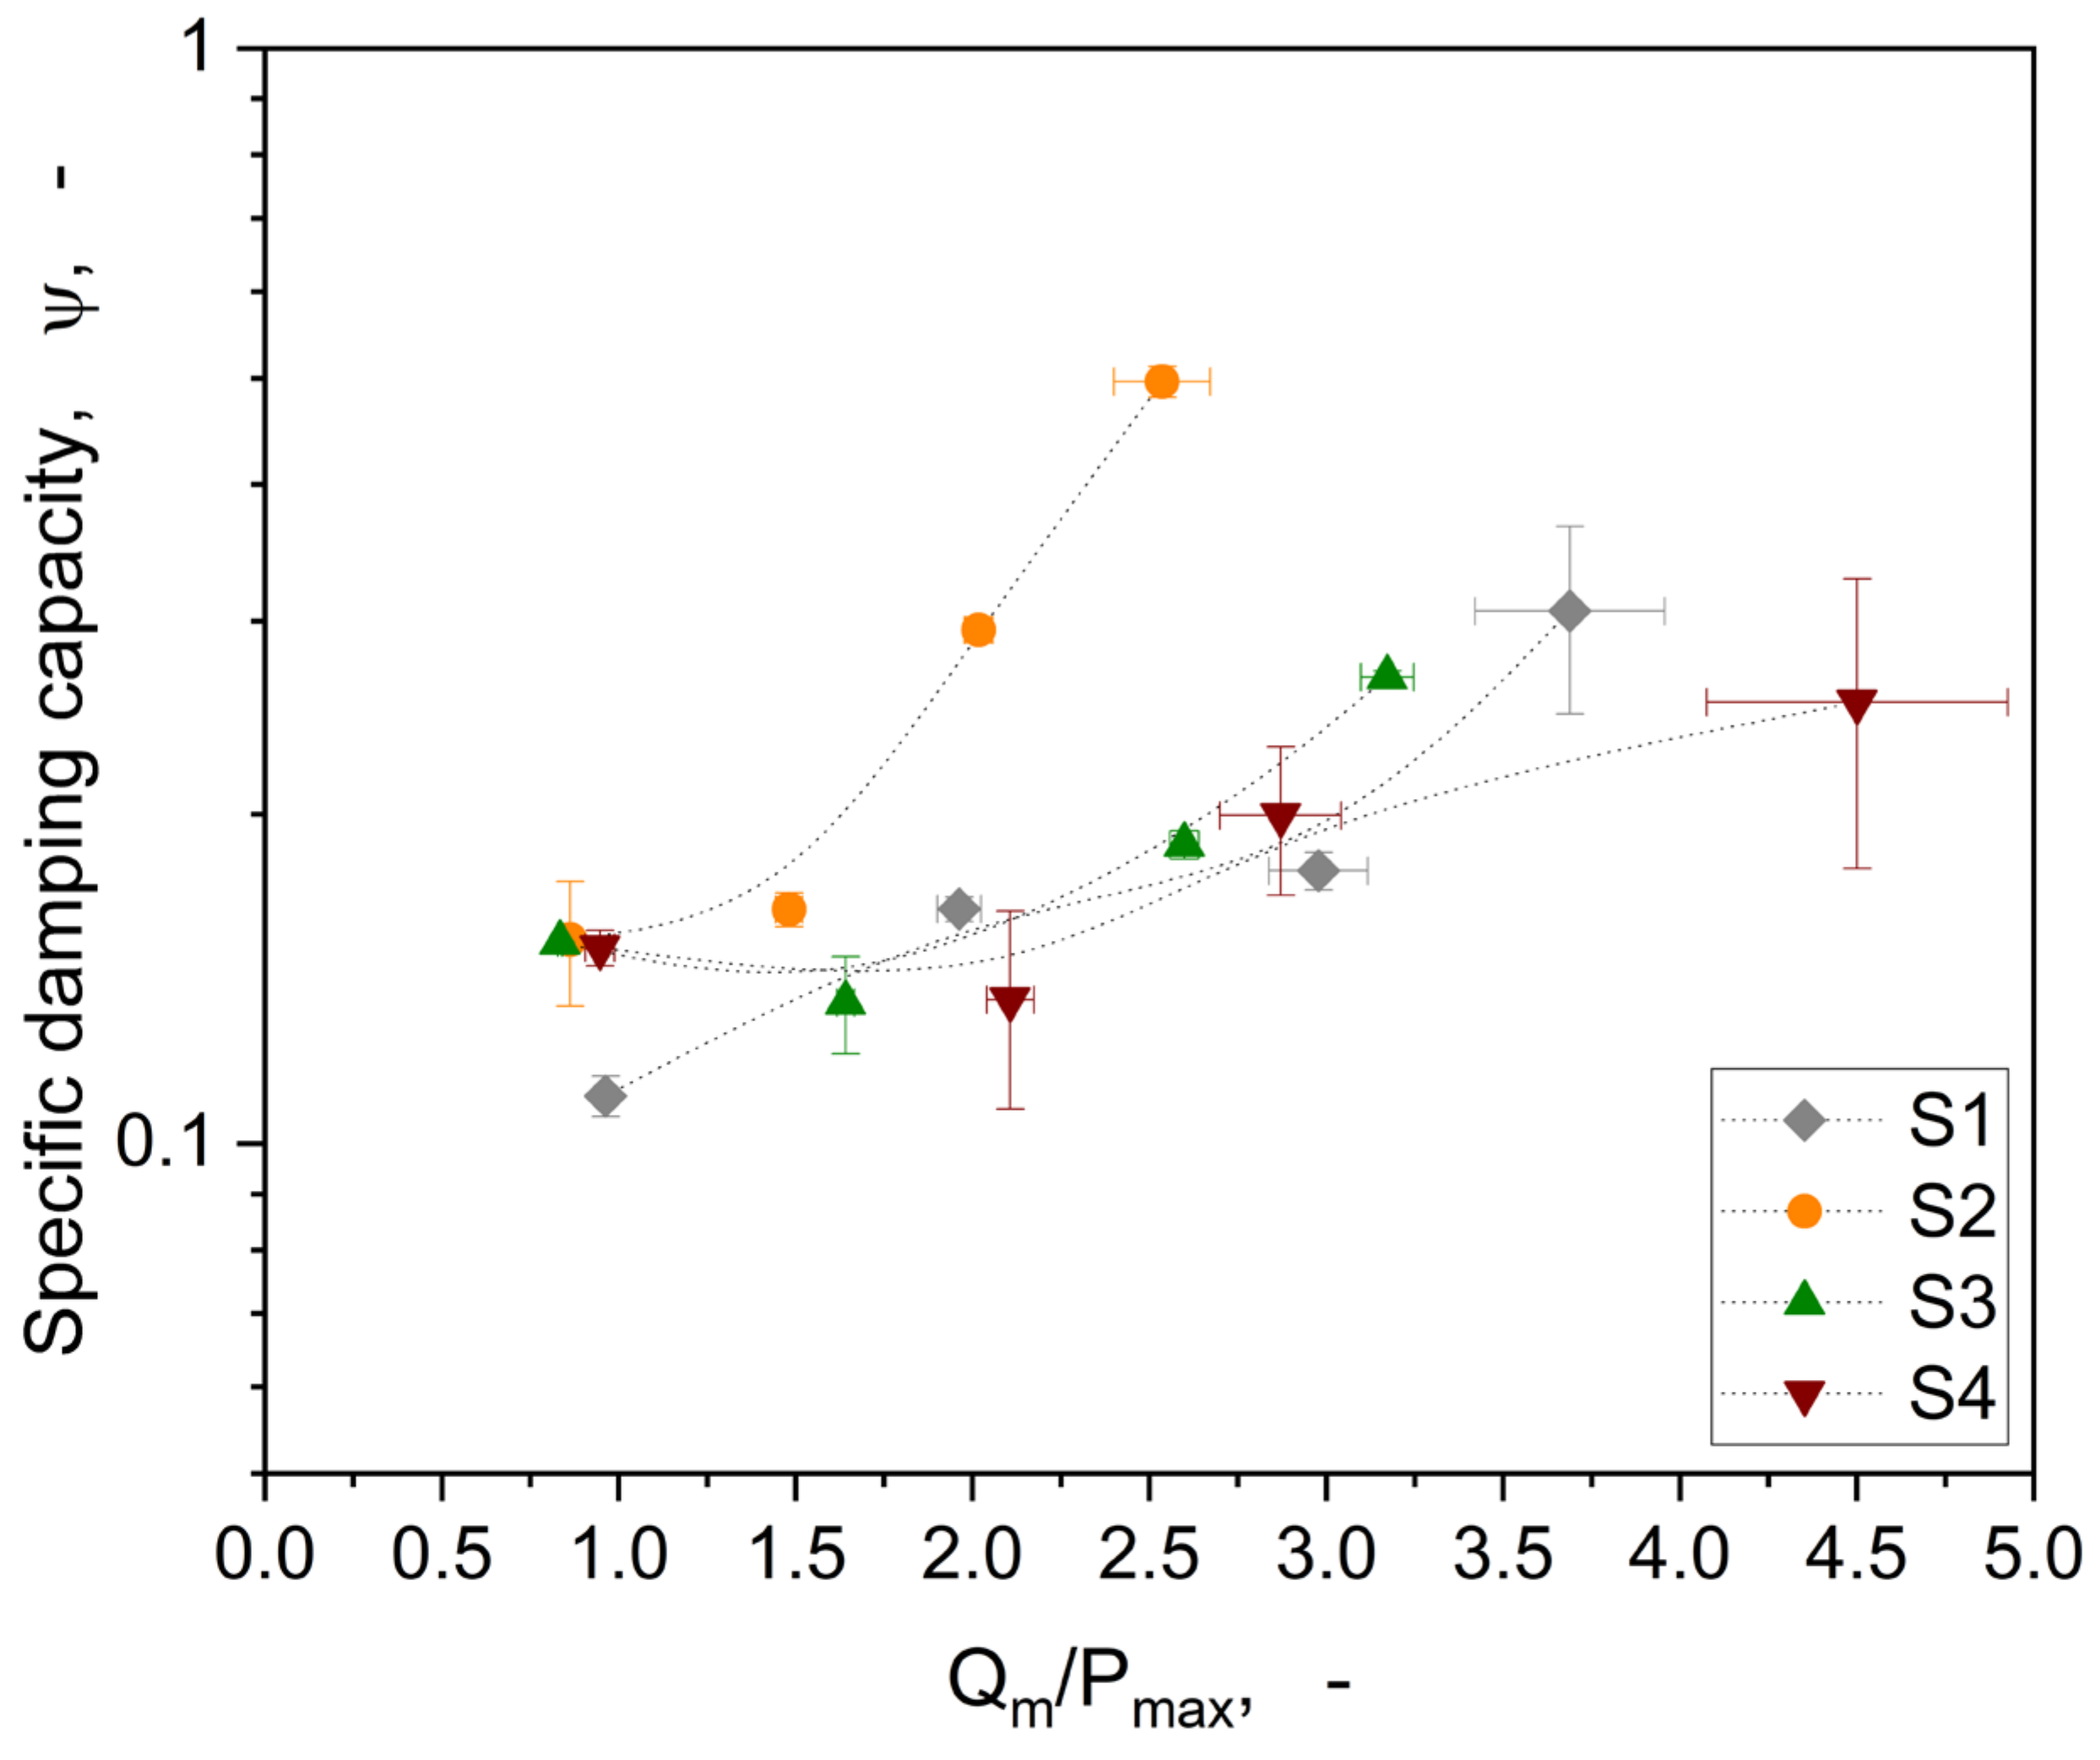
3.2. Cyclic Motion
4. Conclusions
Supplementary Materials
Author Contributions
Funding
Institutional Review Board Statement
Informed Consent Statement
Data Availability Statement
Acknowledgments
Conflicts of Interest
References
- Tan, D.; Wang, X.; Liu, Q.; Shi, K.; Yang, B.; Liu, S.; Wu, Z.-S.; Xue, L. Switchable Adhesion of Micropillar Adhesive on Rough Surfaces. Small 2019, 15, e1904248. [Google Scholar] [CrossRef]
- Tian, Y.; Qi, H.; Wu, H.; Zhang, D. Friction behavior of gecko-inspired polydimethylsiloxane micropillar array with tailored Young’s modulus by incorporation of ZrO2 particles. Chem. Phys. Lett. 2021, 763, 138202. [Google Scholar] [CrossRef]
- Feng, L.; Li, S.; Li, Y.; Li, H.; Zhang, L.; Zhai, J.; Song, Y.; Liu, B.; Jiang, L.; Zhu, D. Super-Hydrophobic Surfaces: From Natural to Artificial. Adv. Mater. 2002, 14, 1857–1860. [Google Scholar] [CrossRef]
- Bae, W.-G.; Kim, H.N.; Kim, D.; Park, S.-H.; Jeong, H.E.; Suh, K.-Y. 25th anniversary article: Scalable multiscale patterned structures inspired by nature: The role of hierarchy. Adv. Mater. 2014, 26, 675–700. [Google Scholar] [CrossRef]
- Ryu, B.-H.; Kim, D.-E. Development of highly durable and low friction micro-structured PDMS coating based on bio-inspired surface design. CIRP Ann. 2015, 64, 519–522. [Google Scholar] [CrossRef]
- Yu, Y.; Brió Pérez, M.; Cao, C.; Beer, S.d. Switching (bio-) adhesion and friction in liquid by stimulus responsive polymer coatings. Eur. Polym. J. 2021, 147, 110298. [Google Scholar] [CrossRef]
- Liu, F.; Urban, M.W. Recent advances and challenges in designing stimuli-responsive polymers. Prog. Polym. Sci. 2010, 35, 3–23. [Google Scholar] [CrossRef]
- Tang, Z.; Guo, L.; Xu, M.; Ruan, H.; Yang, J.; Wang, T.; Zhang, J.; Wang, Q.; Zhang, Y. Tribological behavior of shape memory cyanate ester materials and their tunable friction mechanism. Friction 2023, 11, 1794–1803. [Google Scholar] [CrossRef]
- Rossegger, E.; Nees, D.; Turisser, S.; Radl, S.; Griesser, T.; Schlögl, S. Photo-switching of surface wettability on micropatterned photopolymers for fast transport of water droplets over a long-distance. Polym. Chem. 2020, 11, 3125–3135. [Google Scholar] [CrossRef]
- Rossegger, E.; Hennen, D.; Griesser, T.; Roppolo, I.; Schlögl, S. Directed motion of water droplets on multi-gradient photopolymer surfaces. Polym. Chem. 2019, 10, 1882–1893. [Google Scholar] [CrossRef]
- Bratek-Skicki, A. Towards a new class of stimuli-responsive polymer-based materials—Recent advances and challenges. Appl. Surf. Sci. Adv. 2021, 4, 100068. [Google Scholar] [CrossRef]
- González-Sálamo, J.; Ortega-Zamora, C.; Carrillo, R.; Hernández-Borges, J. Application of stimuli-responsive materials for extraction purposes. J. Chromatogr. A 2021, 1636, 461764. [Google Scholar] [CrossRef]
- Rayate, A.; Jain, P.K. A Review on 4D Printing Material Composites and Their Applications. Mater. Today Proc. 2018, 5, 20474–20484. [Google Scholar] [CrossRef]
- Shie, M.-Y.; Shen, Y.-F.; Astuti, S.D.; Lee, A.K.-X.; Lin, S.-H.; Dwijaksara, N.L.B.; Chen, Y.-W. Review of Polymeric Materials in 4D Printing Biomedical Applications. Polymers 2019, 11, 1864. [Google Scholar] [CrossRef] [PubMed]
- Lu, P.; Wood, R.J.K.; Gee, M.G.; Wang, L.; Pfleging, W. A Novel Surface Texture Shape for Directional Friction Control. Tribol. Lett. 2018, 66, 51. [Google Scholar] [CrossRef]
- Bhushan, B. Springer Handbook of Nanotechnology, 4th ed.; Springer: Berlin/Heidelberg, Germany, 2017; ISBN 9783662543573. [Google Scholar]
- Matsuda, K.; Hashimoto, D.; Nakamura, K. Real contact area and friction property of rubber with two-dimensional regular wavy surface. Tribol. Int. 2016, 93, 523–529. [Google Scholar] [CrossRef]
- Maegawa, S.; Itoigawa, F.; Nakamura, T. Effect of normal load on friction coefficient for sliding contact between rough rubber surface and rigid smooth plane. Tribol. Int. 2015, 92, 335–343. [Google Scholar] [CrossRef]
- Nguyen, D.T.; Ramakrishna, S.; Fretigny, C.; Spencer, N.D.; Le Chenadec, Y.; Chateauminois, A. Friction of Rubber with Surfaces Patterned with Rigid Spherical Asperities. Tribol. Lett. 2013, 49, 135–144. [Google Scholar] [CrossRef]
- Murarash, B.; Itovich, Y.; Varenberg, M. Tuning elastomer friction by hexagonal surface patterning. Soft Matter 2011, 7, 5553. [Google Scholar] [CrossRef]
- Kumar, C.; Speck, T.; Le Houérou, V. Local contact formation during sliding on soft adhesive surfaces with complex microstructuring. Tribol. Int. 2021, 163, 107180. [Google Scholar] [CrossRef]
- Kasem, H.; Shriki, H.; Ganon, L.; Mizrahi, M.; Abd-Rbo, K.; Domb, A.J. Rubber plunger surface texturing for friction reduction in medical syringes. Friction 2019, 7, 351–358. [Google Scholar] [CrossRef]
- Zambrano, V.; Brase, M.; Hernández-Gascón, B.; Wangenheim, M.; Gracia, L.A.; Viejo, I.; Izquierdo, S.; Valdés, J.R. A Digital Twin for Friction Prediction in Dynamic Rubber Applications with Surface Textures. Lubricants 2021, 9, 57. [Google Scholar] [CrossRef]
- Shaukat, U.; Rossegger, E.; Schlögl, S. Thiol–acrylate based vitrimers: From their structure–property relationship to the additive manufacturing of self-healable soft active devices. Polymer 2021, 231, 124110. [Google Scholar] [CrossRef]
- Rossegger, E.; Höller, R.; Reisinger, D.; Strasser, J.; Fleisch, M.; Griesser, T.; Schlögl, S. Digital light processing 3D printing with thiol–acrylate vitrimers. Polym. Chem. 2021, 12, 639–644. [Google Scholar] [CrossRef]
- Kriston, A.; Fülöp, T.; Isitman, N.A.; Kotecký, O.; Tuononen, A.J. A novel method for contact analysis of rubber and various surfaces using micro-computerized-tomography. Polym. Test. 2016, 53, 132–142. [Google Scholar] [CrossRef]
- Eriten, M.; Chen, S.; Usta, A.D.; Yerrapragada, K. In Situ Investigation of Load-Dependent Nonlinearities in Tangential Stiffness and Damping of Spherical Contacts. J. Tribol. 2021, 143, 061501. [Google Scholar] [CrossRef]
- Sahli, R.; Pallares, G.; Ducottet, C.; Ben Ali, I.E.; Al Akhrass, S.; Guibert, M.; Scheibert, J. Evolution of real contact area under shear and the value of static friction of soft materials. Proc. Natl. Acad. Sci. USA 2018, 115, 471–476. [Google Scholar] [CrossRef]
- Mindlin, R.D. Compliance of Elastic Bodies in Contact. J. Appl. Mech. 1949, 16, 259–268. [Google Scholar] [CrossRef]
- Cattaneo, C. Sul Contatto di due Corpi Elasticie: Distribution Locale Degli Sforzi. Reconditi Dell Acad. Naz. Die Lincei 1938, 27, 474–478. [Google Scholar]
- Persson, B.N.J. Theory of rubber friction and contact mechanics. J. Chem. Phys. 2001, 115, 3840–3861. [Google Scholar] [CrossRef]
- Popov, V.L.; Voll, L.; Kusche, S.; Li, Q.; Rozhkova, S.V. Generalized master curve procedure for elastomer friction taking into account dependencies on velocity, temperature and normal force. Tribol. Int. 2018, 120, 376–380. [Google Scholar] [CrossRef]
- Sahli, R.; Pallares, G.; Papangelo, A.; Ciavarella, M.; Ducottet, C.; Ponthus, N.; Scheibert, J. Shear-Induced Anisotropy in Rough Elastomer Contact. Phys. Rev. Lett. 2019, 122, 214301. [Google Scholar] [CrossRef] [PubMed]
- Lengiewicz, J.; Souza, M.d.; Lahmar, M.A.; Courbon, C.; Dalmas, D.; Stupkiewicz, S.; Scheibert, J. Finite deformations govern the anisotropic shear-induced area reduction of soft elastic contacts. J. Mech. Phys. Solids 2020, 143, 104056. [Google Scholar] [CrossRef]
- Afshar-Mohajer, M.; Yang, X.; Long, R.; Zou, M. Understanding the friction and deformation behavior of micro/nano-hierarchical textures through in-situ SEM observation and mechanics modeling. Tribol. Int. 2022, 165, 107271. [Google Scholar] [CrossRef]
- Wang, C.; Bonyadi, S.Z.; Grün, F.; Pinter, G.; Hausberger, A.; Dunn, A.C. Precise Correlation of Contact Area and Forces in the Unstable Friction between a Rough Fluoroelastomer Surface and Borosilicate Glass. Materials 2020, 13, 4615. [Google Scholar] [CrossRef]
- MAEGAWA, S.; ITOIGAWA, F.; NAKAMURA, T. Optical measurements of real contact area and tangential contact stiffness in rough contact interface between an adhesive soft elastomer and a glass plate. J. Adv. Mech. Des. Syst. Manuf. 2015, 9, JAMDSM0069. [Google Scholar] [CrossRef]
- Hisler, V.; Palmieri, M.; Le Houerou, V.; Gauthier, C.; Nardin, M.; Vallat, M.-F.; Vonna, L. Scale invariance of the contact mechanics of micropatterned elastic substrates. Int. J. Adhes. Adhes. 2013, 45, 144–149. [Google Scholar] [CrossRef]
- Owens, D.K.; Wendt, R.C. Estimation of the surface free energy of polymers. J. Appl. Polym. Sci. 1969, 13, 1741–1747. [Google Scholar] [CrossRef]
- Rabel, W. Einige Aspekte der Benetzungstheorie und ihre Anwendung auf die Untersuchung und Veränderung der Oberflächeneigenschaften von Polymeren. Farbe Und Lack 1971, 77, 997–1005. [Google Scholar]
- Kaelble, D.H. Dispersion-Polar Surface Tension Properties of Organic Solids. J. Adhes. 1970, 2, 66–81. [Google Scholar] [CrossRef]
- Gauthier, C.; Schirrer, R. Time and temperature dependence of the scratch properties of poly(methylmethacrylate) surfaces. J. Mater. Sci. 2000, 35, 2121–2130. [Google Scholar] [CrossRef]
- Wittmann, B.; Gauthier, C.; Burr, A.; Agassant, J.-F.; Favier, D.; Montmitonnet, P.; Casoli, A. Study of scratch resistance of a hard-on-soft polymer bilayer: Combination of in situ vision, X-ray tomography and numerical simulations. Wear 2020, 452–453, 203271. [Google Scholar] [CrossRef]
- Sommer, C.; Straehle, C.; Koethe, U.; Hamprecht, F.A. Ilastik: Interactive learning and segmentation toolkit. In Proceedings of the 2011 IEEE International Symposium on Biomedical Imaging: From Nano to Macro, Chicago, IL, USA, 30 March–2 April 2011; pp. 230–233, ISBN 1945-8452. [Google Scholar]
- Brake, M.R. The Mechanics of Jointed Structures, 1st ed.; Springer International Publishing AG: Cham, Switzerland, 2017; ISBN 978-3-319-56816-4. [Google Scholar]
- Blau, P.J. Friction Science and Technology: From Concepts to Applications, 2nd ed.; CRC Press: Boca Raton, FL, USA, 2009; ISBN 9781420054101. [Google Scholar]
- Farkas, Z.; Dahmen, S.R.; Wolf, D.E. Static versus dynamic friction: The role of coherence. J. Stat. Mech. 2005, 2005, P06015. [Google Scholar] [CrossRef]
- Surface energy and the contact of elastic solids. Proc. R. Soc. Lond. A 1971, 324, 301–313. [CrossRef]


| Sample | Disperse Part [mN/m] | Polar Part [mN/m] | Total Surface Energy [mN/m] |
|---|---|---|---|
| S1 | 35.77 ± 1.10 | 3.80 ± 0.28 | 39.57 ± 1.38 |
| S2 | 33.55 ± 1.25 | 2.80 ± 0.25 | 36.35 ± 1.50 |
| S3 | 34.61 ± 0.94 | 5.14 ± 0.24 | 39.75 ± 1.18 |
| S4 | 30.30 ± 1.32 | 3.50 ± 0.30 | 33.80 ± 1.63 |
Disclaimer/Publisher’s Note: The statements, opinions and data contained in all publications are solely those of the individual author(s) and contributor(s) and not of MDPI and/or the editor(s). MDPI and/or the editor(s) disclaim responsibility for any injury to people or property resulting from any ideas, methods, instructions or products referred to in the content. |
© 2023 by the authors. Licensee MDPI, Basel, Switzerland. This article is an open access article distributed under the terms and conditions of the Creative Commons Attribution (CC BY) license (https://creativecommons.org/licenses/by/4.0/).
Share and Cite
Hausberger, A.; Pecora, M.; Favier, D.; Rossegger, E.; Tockner, M.; Ules, T.; Haselmann, M.; Schlögl, S.; Gauthier, C. In Situ Observation of Micro-Patterned Elastomeric Surfaces: The Formation of the Area of Real Contact and the Influence on Its Friction and Deformation Behaviour. Materials 2023, 16, 6489. https://doi.org/10.3390/ma16196489
Hausberger A, Pecora M, Favier D, Rossegger E, Tockner M, Ules T, Haselmann M, Schlögl S, Gauthier C. In Situ Observation of Micro-Patterned Elastomeric Surfaces: The Formation of the Area of Real Contact and the Influence on Its Friction and Deformation Behaviour. Materials. 2023; 16(19):6489. https://doi.org/10.3390/ma16196489
Chicago/Turabian StyleHausberger, Andreas, Marina Pecora, Damien Favier, Elisabeth Rossegger, Martin Tockner, Thomas Ules, Matthias Haselmann, Sandra Schlögl, and Christian Gauthier. 2023. "In Situ Observation of Micro-Patterned Elastomeric Surfaces: The Formation of the Area of Real Contact and the Influence on Its Friction and Deformation Behaviour" Materials 16, no. 19: 6489. https://doi.org/10.3390/ma16196489