Article

Multi-Criteria Optimization of Cost-Effective and Environmentally Friendly Reactive Powder Concrete Incorporating Waste Glass and Micro Calcium Carbonate

by
Joaquín Abellán-García
1,*,
Nemesio Daza
2,
Marielena Molinares
3,
Yassir M. Abbas
4 and
Mohammad Iqbal Khan
4,*
1
Department of Civil and Environmental Engineering, Universidad Del Norte, Barranquilla 081007, Colombia
2
Department of Civil Engineering, Universidad Simón Bolivar, Barranquilla 111321, Colombia
3
Department of Industrial, Manufacturing, and Systems Engineering, Texas Tech University, Lubbock, TX 79409, USA
4
Department of Civil Engineering, College of Engineering, King Saud University, P.O. Box 800, Riyadh 11421, Saudi Arabia
*
Authors to whom correspondence should be addressed.
Materials 2023, 16(19), 6434; https://doi.org/10.3390/ma16196434
Submission received: 8 September 2023 / Revised: 19 September 2023 / Accepted: 21 September 2023 / Published: 27 September 2023

Abstract

:
In pursuit of developing an eco-friendly and cost-effective reactive powder concrete (RPC), we utilized a multi-objective optimization technique. This approach pivoted on the incorporation of byproducts, with a spotlight on ground glass powder (GP) as a pivotal supplementary cementitious material (SCM). Our goal was twofold: engineering cost-efficient concrete while maintaining environmental integrity. The derived RPC showcased robust mechanical strength and impressive workability. Rigorous evaluations, containing attributes like compressive strength, resistance to chloride ion penetration, ultrasonic pulse speed, and drying shrinkage, highlighted its merits. Notably, the optimized RPC, despite an insignificant decrease in compressive strength at 90 days compared to its traditional counterpart, maintained steady strength augmentation over time. The refinement process culminated in a notable 29% reduction in ordinary Portland cement (OPC) usage and a significant 64% decrease in silica fume (SF), with the optimized mix composition being 590 for cement, 100 for SF, 335 for GP, and 257 kg/m3 for calcium carbonate. Additionally, the optimized RPC stood out due to the enhanced rheological behavior, influenced by the lubricative properties of calcium carbonate and the water conservation features of the glass powder. The reactive properties of SF, combined with GP, brought distinct performance variations, most evident at 28 days. Yet, both mixtures exhibited superior resistance to chloride, deeming them ideal for rigorous settings like coastal regions. Significantly, the RPC iteration, enriched with selective mineral admixtures, displayed a reduced tendency for drying-induced shrinkage, mitigating potential crack emergence.

1. Introduction

The increase in greenhouse gas emissions from ordinary Portland cement (OPC) has led to a growing demand for sustainable cementitious materials. Cement production is responsible for more than 8% of the world’s carbon dioxide emissions, making it crucial to reduce its environmental impact [1,2]. Developed in the 1990s for the building industry, reactive powder concrete (RPC) is an innovative type of cement composite with exceptional strength and superior characteristics compared to conventional concrete [3]. RPC’s microstructure features a high density of fine, and mostly reactive, particles, which leads to low porosity and high compressive strength (CS). It also exhibits high tensile strength and ductility, making it capable of withstanding high stress and deformation without cracking or fracturing [4].
Although RPC has been widely recognized as a superior material for construction, its production has been limited in many countries, particularly in developing nations, due to several factors. As noted by Peng et al. [5] and Mayhoub [6], the hard-to-find aspect and high cost of some of the component elements, such as high-performance silica fume and ultrafine powders, make it difficult to produce RPC at a large scale, especially in areas where these materials are not readily available [1,2]. Furthermore, the use of these materials can also result in environmental degradation and unsustainable resource consumption. As such, researchers have been exploring alternative methods for RPC production, such as using waste materials or locally sourced resources, in order to make RPC more accessible and sustainable [7,8]. According to Nasr et al. [9], incorporating waste materials such as fly ash and slag can reduce the environmental impact of RPC and lower its production costs while maintaining its superior properties. Such efforts are crucial for making RPC more widely available and sustainable, particularly in regions where traditional cement-based materials are not ideal due to their lower durability and strength.
Further from the carbon footprint problems, the increased cement need in RPC has various negative implications on the performance of the concrete due to shrinkage and microcracking concerns [3]. Furthermore, specific and more expensive ingredients such as silica fume (SF) play an important role in RPC, improving the microstructure of this particular concrete [4,10]. The addition of SF to RPC can enhance its mechanical qualities [4,11] (and durability) by decreasing its permeability to water and chemicals and enhancing its resilience to freeze–thaw cycles [7,12,13].
Several researchers have conducted experimental works to analyze the effect of SF dosage on the properties of reactive powder concrete (RPC) [14]. According to Al-Hassani et al. [15], increasing the SF content in RPC resulted in a significant increase in compressive strength but a comparatively modest improvement in tensile strength. Additionally, the addition of steel fibers improved the tensile strength and load-deflection behavior of RPC. Chan and Chu [14] discovered that incorporating SF significantly increased the bond strength between fiber and matrix, particularly the fiber pullout energy. The authors state that for bond properties, the ideal SF dose ranged between 20 and 30% [11,14]. However, the high cost and influence of SF on the water-to-binder ratio, and thus on concrete shrinkage, are some of the drawbacks associated with this high-silicon-oxide and ultra-fine mineral admixture [16,17].
On the other hand, as recycled glass (GP) is used progressively more, the capacity of landfills to properly handle it and dispose of it permanently is being exceeded [18]. It is discouraging that while being a highly recyclable material, it leaves behind a significant amount of waste when disposed of in quarries due to the fact that it is not biodegradable [19]. While this problem remains, interest in integrating GP as a study material for implementation within the construction industry, particularly in the development of structural elements [20], has increased due to its accessibility, low cost, and favorable properties within the mixtures [21,22]. In turn, this helps lessen its environmental impact [23].
Numerous studies in the sector have recently focused on recycled glass as a potential concrete component to enhance its qualities, affordability, and carbon footprint. According to Kaminsky et al. [24], the properties of the treated GP allow for the possibility of using it as a supplementary cementitious material (SMC) in concrete mixtures. A study by Sadiqul et al. [23] looked into using GP as a binder in mortar and concrete mixtures when combined with cement. According to these researchers, they increased compressive strength by 8% above the control mixture by employing 20% GP as a binder.
Du and Tan [25], who examined the mechanical and durability characteristics of concrete mixtures employing GP as a replacement for cement, came to similar conclusions. These authors claimed that when GP content was increased to at least 30%, compressive strength improved by up to 27%, water absorption capacity decreased by 75%, and electrical conductivity decreased by 88%. Similar results were reported by other authors [19,26]. Low Ca/Si ratios are thought to be responsible for these improvements because they induce the production of C-S-H gel, which enhances the microstructure of the cementitious matrix and lowers ion concentrations in the pore solution [25,26]. In a thorough investigation of the mechanical and durability attributes of concrete, Lal Jain et al. [27] substituted varying amounts of GP (5, 10, 15, 20, and 25%) and granite powder (GrP, 10, 20, 30, 40, and 50%) for cement and fine aggregate, respectively. A higher GP dosage led to a rise in compressive strength (CS) at 28 days compared to the control mix, and mixtures containing 20% GP and 0% GrP showed a significant 24.8% increase in strength. Furthermore, concretes containing 15% GP and 30% GrP revealed a 34% increase in CS over the control combination. Kou and Xing [22] achieved similar results when they explored the use of recycled GP (15% and 30% by weight) in combination with SF as SMCs for fiber-reinforced UHPC mixtures. According to their findings, larger GP dosages resulted in decreased workability, while CS increased by 7.0% and 2.8%, respectively, when compared to the control mixture. The chemical stimulation given by GP, which combines with CH to form a low basicity C-S-H, can be linked to the achievement of CS by means of the pozzolanic reaction [21,26].
Al-Awabdeh et al. [28] used a water-to-cement ratio of 0.46 and partially substituted fine and coarse aggregates at levels of 30% and 50% to study the effects of silane-treated glass cullet on concrete mixtures. Glass powder was added to the mixes in amounts ranging from 2% to 5% by weight. The results of this investigation showed that the absorption capacity was significantly reduced by up to 87% when treated broken glass was added. However, compressive strength was reduced by as much as 46% when treated glass was employed to partially replace fine and coarse stones. Castro and Brito [29] studied the use of GP as a replacement for 5, 10, and 20% of fine aggregate in concrete mixes and found that similar results were obtained. The employment of 20% GP boosts concrete workability, according to the researchers. Wang [30] also found similar outcomes when he looked at the impact of using GP as a fine aggregate replacement in three different concrete mix designs with target strengths of 21, 28, and 35 MPa. According to Wang’s study, adding more GP than 20% had a negative impact on how well concrete mixtures worked. In addition, the cementitious matrix’s compressive strength was raised, and chloride ion penetration was decreased when 20% of the fine aggregate was replaced with GP [31,32].
Due to the alkali nature of glass and its high silica content, which is primarily in the amorphous condition, the alkali–silica reaction (ASR) is an expected but adverse behavior that must be properly handled when adding glass waste into the manufacture of concrete. ASR is mostly detected in the later phases of curing as a formation of cracks and expansion of the cement matrix, which ultimately can cause considerable structural damage [33]. However, glass powder silica oxide can react with CH to generate C-S-H when water is included [26], and therefore, optimal dosages and treatments of GP could improve the mechanical properties of concrete compositions. In glass powder concrete, Guo et al. [34] discovered that including (SCMs) such as fly ash can significantly reduce the rate of early-age alkali–silica reaction (ASR) growth while Dhir et al. [35] established that the addition of slag and metakaolin mitigates this expansion. Glass particle reactivity is regulated by size, and particles smaller than 600 m do not generate deleterious ASR even when ASR suppressants are used [36]. These data imply that the negative impacts of using recycled glass in concrete, particularly with regard to ASR, can be mitigated by the use of SCMs or GP particles smaller than the #30 sieve size.
On the other hand, the mechanical properties of ultra-high-strength concrete with particle packing density, such as RPC, may benefit from GP, according to some research. For example, in order to partially substitute cement in RPC, Hussain et al. [37] used GP, and the results showed that adding 20% sustainable GP to cement enhanced CS and flexural behavior. Similar findings were reported by other investigations [38,39].
Furthermore, multiple research projects have been conducted to explore the impact and synergistic effects of various SCMs, in addition to SF, in the construction of environmentally friendly RPC concrete [38,40,41]. Based on the foregoing findings, it is reasonable to conclude that GP offers the potential as a viable option for traditional materials in the development of RPC [42,43].
Despite its benefits, RPC has two key drawbacks: a high cost and a large carbon impact. Numerous research has looked at the use of inexpensive, ecologically benign, and locally accessible minerals as additives in RPC combinations [20,21], but their effects on parameters other than compressive strength (CS) have received little attention. In order to fill this knowledge gap, our project experimentally evaluates a wide variety of mechanical and durability parameters. To serve as binding components in RPC combinations, calcium carbonate and ground glass powders must be combined in the most advantageous, economical, and environmentally responsible way possible.
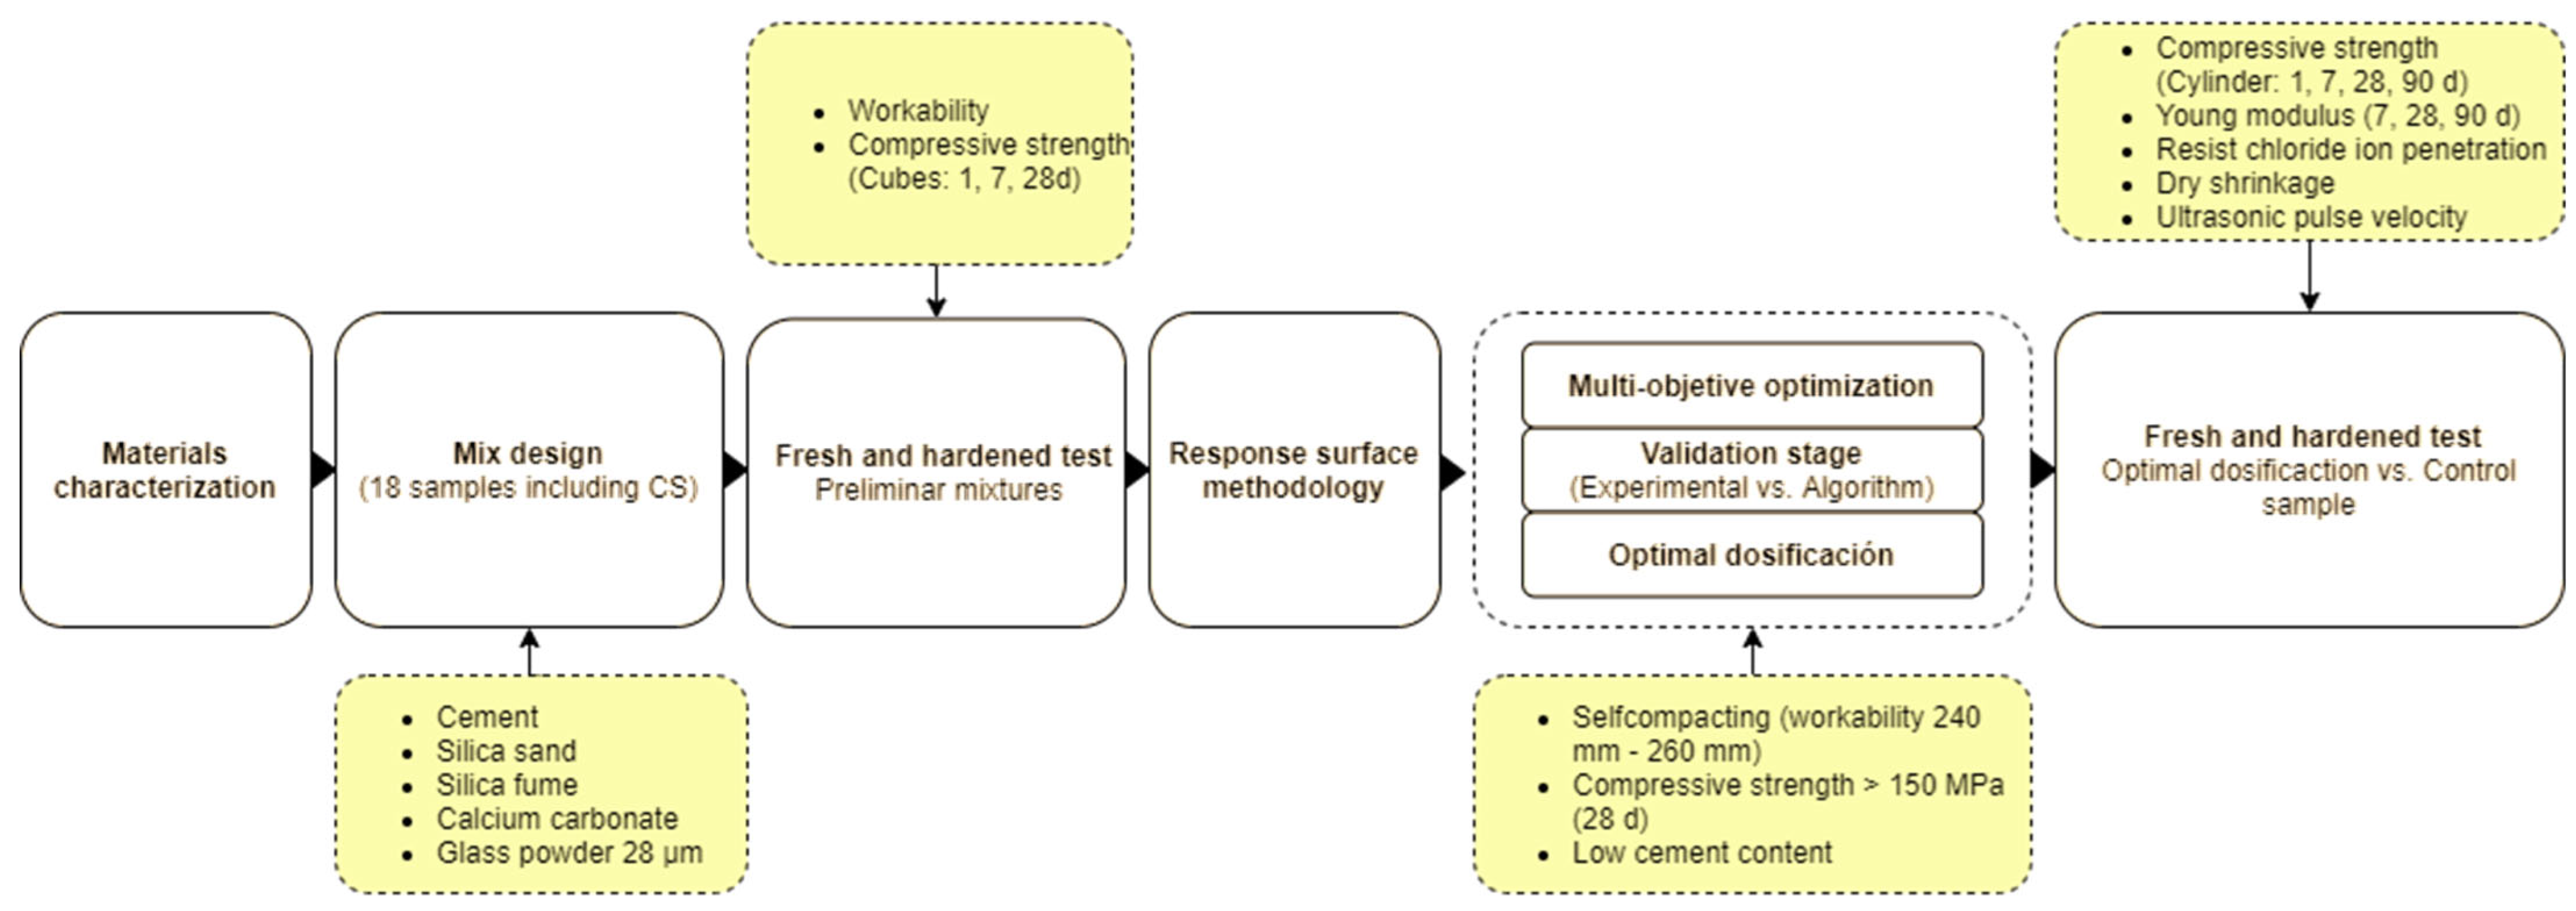
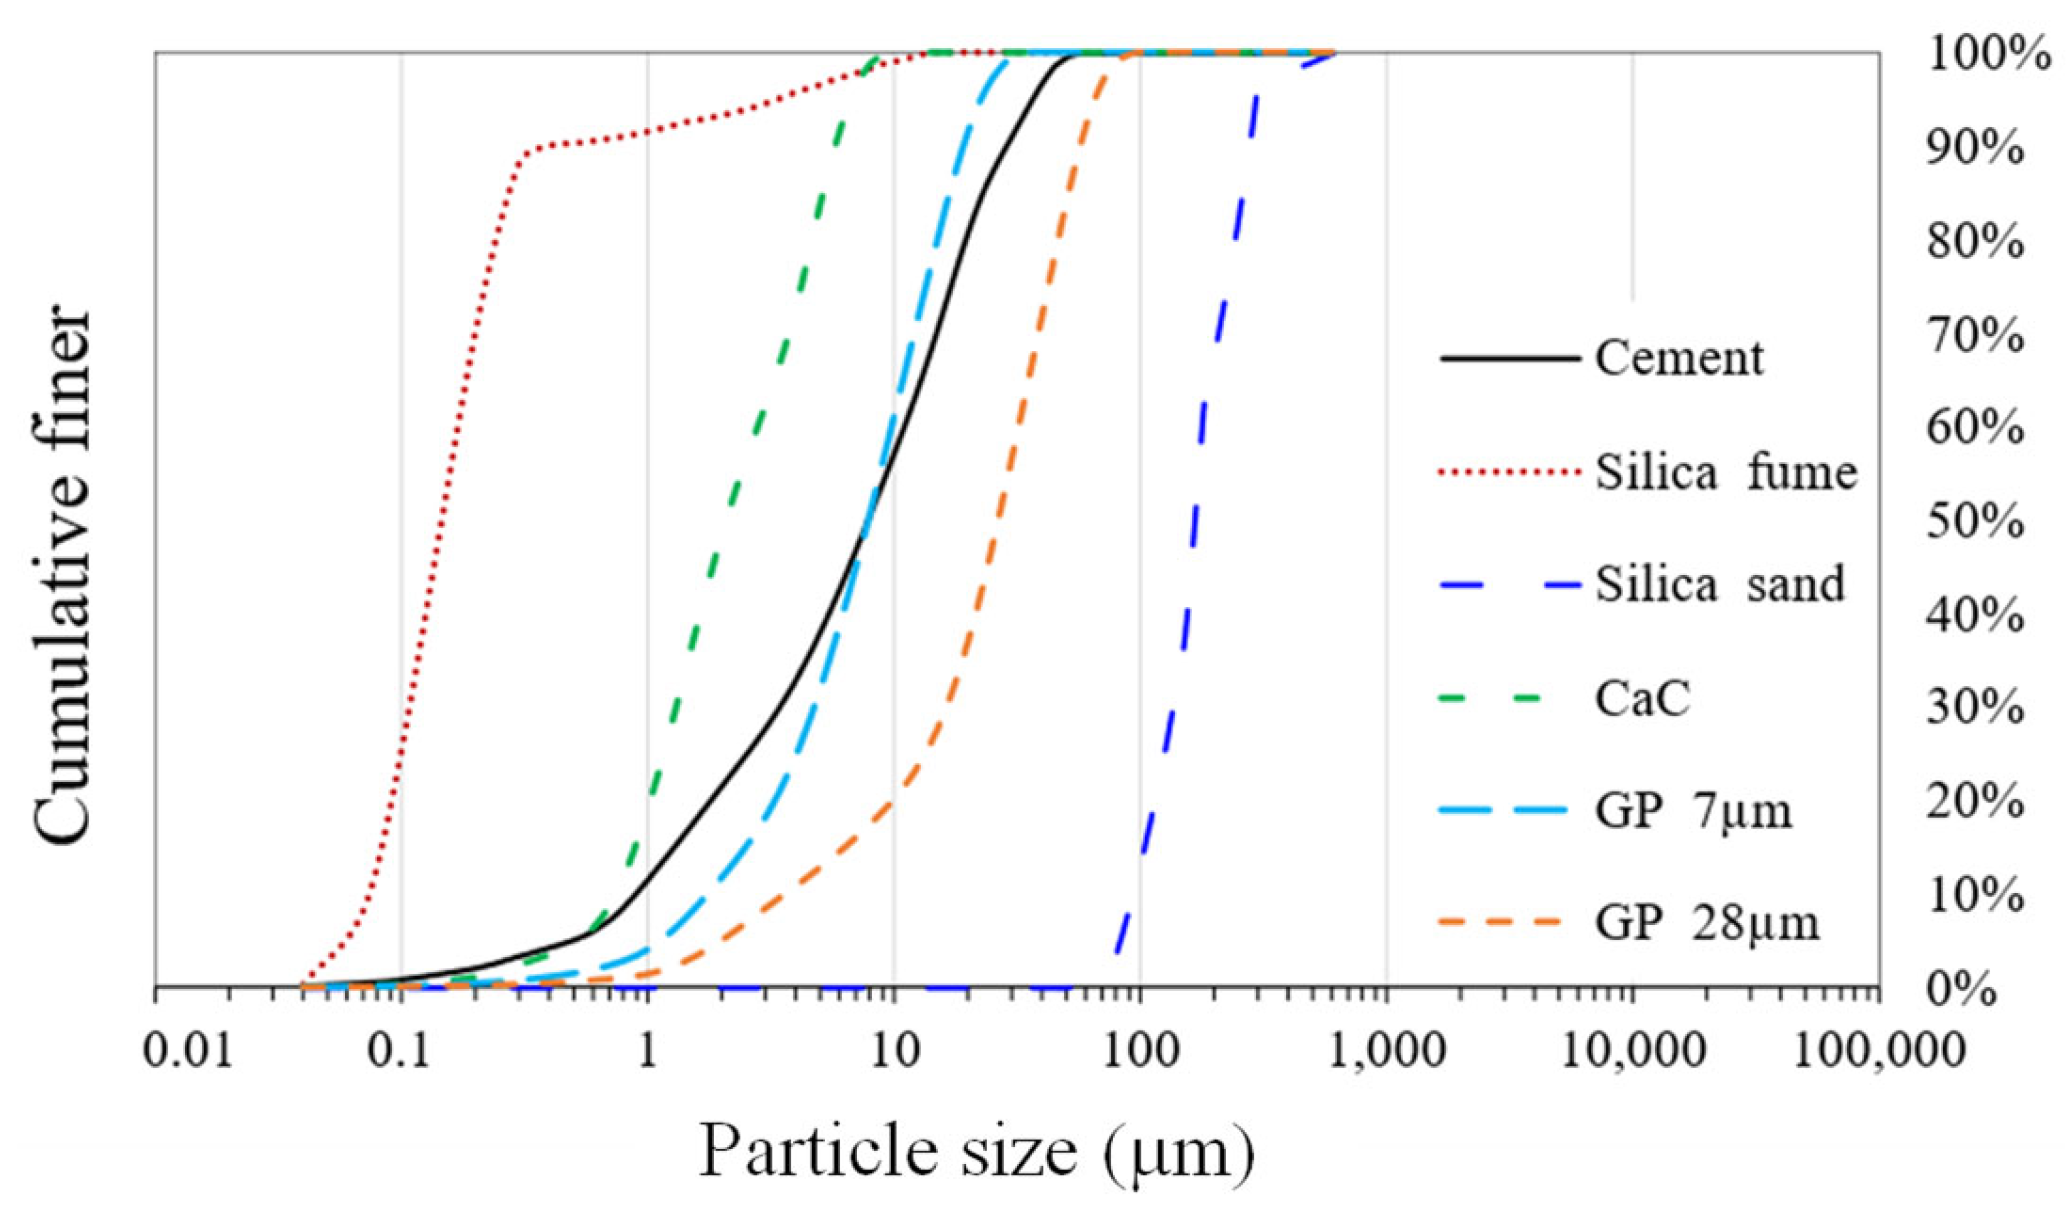
Numerous endeavors have been made to refine RPC formulations, yet the current research uniquely pivots towards the incorporation of eco-friendly components like waste glass and micro calcium carbonate. Hence, we not only advocate for pioneering waste management solutions but also underscore the significance of sustainable construction methodologies. Beyond formulation, we have explored the performance metrics of these novel RPC mixtures, spanning from their workability to their durability under various conditions, such as chloride ion exposure. The utilized methodology, underscored by the adoption of the Modified Andreasen and Andersen (MAA) model, offers a robust approach to assessing particle distribution and density, amplifying the reliability of the outcomes.

2. Materials and Methodology

Figure 1 presents the testing plan, along with the components used to formulate the RPC, the amounts of the concrete mixture, and the experimental techniques utilized in this study.

2.1. Characterization of the RPC-Making Materials

The RPC doses were made using raw components from the Colombian market. The cement had a mean particle size of 9 μm and a specific density of 3.14. The employed SF conformed to ASTM C-1240 [44] and had a specific density of 2.21 and a d50 of 0.15 μm. Additionally, silica sand was used, which has a d50 of 165 m, a maximum particle size of 600 μm (dmax), and a specific density of 2.65. In order to lower the cement and SF content, calcium carbonate powder (CaC) and waste glass powder (GP) were added to the optimal dose. CaC has a d50 value of 2 μm and a specific density of 2.74; the d50 value for glass powder was 28 μm. The specific density of both of the glass powders was 2.61. The results of particle size distribution (PSD), the mineralogical investigations carried out using X-ray diffraction (XRD), and the scanning electron microscopy (SEM) study of the constituents are shown in Figure 2, Figure 3 and Figure 4, respectively.
Table 1 and Table 2 summarize the elemental chemical composition obtained by XRF and the physical properties of cement, SF, CaC, and GP28, respectively.
The superplasticizer employed in this study was a high-range water reducer admixture (HRWR) based on polycarboxylate ether. It had a solids concentration of 40% and a specific gravity of 1.07.

2.2. Analytical Methodology

2.2.1. Packing Density Model

The packing density of the granular ingredients, especially powders, is crucial for designing an efficient RPC combination [6,45]. The packing density model for RPC design is based on the hypothesis that the mechanical properties of the final concrete may be significantly influenced by the packing density of the powders [40]. The particle size distribution of the each RPC component (PSD) is taken into account by the model to establish the ideal packing density for the mixture. Maximizing the density of the particles in the mixture is the aim of the packing density model [6,46]. This may be conducted by choosing the component’s particle sizes carefully (including powders), as well as by adding the right chemical admixtures to the combination to lower it. A RPC mixture’s packing density may be changed to increase compressive strength and durability, and the inclusion of fibers improves RPC’s post-cracking behavior under flexural or tensile loadings [7,12,47]. Modified Andreasen and Andersen (MAA), a continuous particle packing theory, is used in this study. References [48,49,50] provide further details regarding this particle packing model.

2.2.2. Design and Analysis of Experiments

The design of the experiment is a key component of statistical analysis that seeks to identify relevant factors and their impact on various attributes. The purpose of this research is to provide insight into the changes in RPC properties when SCMs are added to a conventional concrete mixture. The goal is to conduct as few tests as possible while keeping detailed information on the factors, their interactions, and their impact on the responses. An appropriate experimental zone is identified using response surface methodology (RSM).
Various methods for data collection can be examined using response surface methodology (RSM), in this case, central composite design (CCD) was selected for the mixing design since it stands out as the most efficient and commonly used in experimental studies. Its advantages include rotatability, exact estimations in all directions, and the ability to generate predictions that lie within the experimental range [51,52,53]. It is required to analyze the connection between variables, ensure the normal behavior and variance of the variables, and validate these assumptions at a 95% confidence level as part of the validation process [54]. Figure 5 represents the central composite design, which depicts the use of center, factorial, and axial design points in the current investigation.
Following previous works [55], the value reflecting the distance of the axial points from the center is fixed at 1.789. Table 3 displays the design point values as well as the associated coordinates in the CCD.
This study takes four repetitions of the central point into account. The design involves three factors: the amount of OPC (ordinary Portland cement) in kg/m3 [A], the water-to-binder ratio [B], and the volume ratio of HRWR (high-range water reducer) [C]. The MAA hypothesis is used to determine the remaining RPC component proportions. Table 4 shows the factor values for each design coordinate.
For the final analysis, a multi-objective optimization model is suggested in which concrete features such as self-compacting behavior, compressive strength, and low cement content are treated as response variables, and significant parameters are manipulated as input variables. This sort of optimization employs an analytical method based on the desirability function introduced by Derringer and Suich [56], which is based on a hierarchical model such as the RSM. The usefulness of functions is defined by whether the response must be maximized, minimized, or kept within a specific range, denoted by the upper (U) and lower (L) bounds. The goals intended to be reached using the optimization are specified in Table 5.
The abovementioned criteria optimization allows for the determination of proposed input variable values that can satisfy the desired conditions in response variables. These determined positions, known as simultaneous optimal points, may or may not always coincide with the control parameters. They are, instead, an achievable option that keeps all related variables within acceptable limits [53].

2.3. Experimental Methodology

2.3.1. Mixing Procedure and Curing

To begin the mixing process, the HRWR and water were combined and mixed at a minimum speed for 90 s. Afterward, the previously mixed binders were added to ensure homogeneity during mixing. The blending process continued until the mixture achieved a flowing consistency, which typically took 3–5 min, depending on the RPC mixture. Once the desired fluidity was achieved, the mixture was mixed at medium speed for 60 s. Next, the equipment was stopped, and the mold was scraped, after which the mixing process resumed for 180 s at high speed. Silica sand was then added and mixed for 60 s at a slow speed before the mixing process was completed at medium speed for an additional 4 min. The workability of each mixture was evaluated using the guidelines outlined in ASTM C1437 [57].
After the workability test, 50 mm mortar specimens were prepared in accordance with ASTM C109 [58], while concrete cylinders were prepared in accordance with ASTM C39 [59] (experimental phase 2). The molds were vibrated during the concrete pouring process and for an extra 60 s after pouring was finished in order to improve the true packing density of the RPC; to prevent water evaporation, protective paper was placed over both types of specimens. After 24 h, the specimens were demolded and allowed to cure in water at 23 °C according to the ASTM C109 [58] and ASTM C511 [60].

2.3.2. Fresh and Hardened Test

In this study, fresh and hardened concrete characteristics were used to assess the quality of sustainable concrete. Three samples were tested for each test, and the results were averaged. The workability of each mixture was evaluated using the guidelines outlined in ASTM C1437 [57]. For experimental stage 1, concrete cube compression tests were performed at 1, 7, and 28 days in line with ASTM C109 [58]. For experimental stage 2, cylinder compression tests were performed at 1, 7, 28, and 90 days in accordance with ASTM C39 [59]. A chloride resistance test was performed on three concrete discs, each corresponding to a different measurement age (7, 28, and 90 days), in accordance with the procedures outlined in ASTM C1202 [61]. The test involved applying a voltage potential to the discs while they were immersed in a sodium chloride solution.
A drying shrinkage test was conducted on three samples for each mixture according to the guidelines of ASTM C490 [62]. The temperature of the molding room was 23 °C with a relative humidity greater than 50%. Up to the age of 25 days, the sample length is measured and recorded every day. The drying shrinkage is calculated using the length difference between the initial record measurement and the following measurements. An ultrasonic pulse velocity test was carried out according to the guidelines of ASTM C597 [63]. This test determines the quality of concrete by measuring the speed of an ultrasonic pulse through the substance. The test involves a powerful electrical pulse from the transmitter causing the specimen to vibrate, with the receiver positioned on the opposite side. The concrete transmits the vibration to the receiver, and the speed of the wave can be approximated using the specimen length. This technique assesses tangible quality factors such as elastic modulus, internal flaws, and crack depth.

3. Results and Discussion

3.1. Influential Factors and Interactions in Central Composite Design: RSM Analysis

3.1.1. Slump Flow

Reactive powder concrete (RPC) was at its fresh stage, and the effects of components A, B, and C on the slump flow are shown in Figure 6. The water-to-binder ratio (w/b), which emerged as the most important component influencing this particular reaction, was shown to have a clear linear connection with the slump flow. Table 6 illustrates the workability of the central composite design.
High concentrations of Na2O in the GP used in UHPC mixtures (see Table 1) can lead to an alkali–silica reaction [26], which directly affects the compressive strength capacity of the mixture. As a result, it is critical to maintain an even distribution between the dosage of cement (factor A), GP, and superplasticizer (factor C) in order to obtain a flow range between 240 and 260 mm to be considered as a self-compacted mixture according to the European Federation of National Associations Representing for Concrete (EFNARC) [64].
The spread flow value is positively affected, as anticipated, by the presence of factor B (w/b) and the concentration of HRWR (factor C). Among these factors, w/b exerts the most significant influence in the current analysis. However, it should be noted that the high w/b ratio has a detrimental impact on the compressive strength, thus necessitating the consideration of a balanced approach, which will be discussed further below.
Workability increases in direct proportion to the increase in the w/b ratio, with no discernible impact from fluctuations in the percentage of HRWR. When low levels of HRWR are maintained, the concrete has poor workability at all dosage levels. If workability were the only consideration, maintaining values above the center points for the w/b ratio and HRWR would suffice, especially when using a low cement dosage. However, from a financial sense, this strategy may be impractical. As a result, the following part examines the same conditions in order to determine the ideal factor conditions inside the mix while adhering to the previously set limits.
A second-order model was generated using the workability response model, as shown in Table 7. Unlike the negative link between w/b and the amount of HRWR, the interaction between the cement dose and the w/b ratio has no appreciable impact on workability. The w/b ratio has the biggest impact on the straightforward parameters.

3.1.2. Compressive Strength

The average CS at 1, 7, and 28 days are shown in Table 8 after conducting the experiments based on the 18 points of the CCD design. The CS results are analyzed to identify the optimal mixture design in accordance with the conditions stipulated in Table 5.
Figure 7 illustrates the impact of factors B and C on the 1-, 7-, and 28-day CS while keeping factor C constant. The results indicate that factor A positively influenced the 1-day CS of RPC, yielding beneficial effects [55,65]. At 1 day, the response surface for CS reveals an inversely proportionate relationship between CS and factors B and C (w/b and superplasticizer, respectively). This is backed by existing research, which shows that a low w/b ratio leads to superior early strength [66]. However, variables B and C exhibited detrimental effects on this response. Furthermore, similar to the 1-day CS, a nonlinear relationship was observed between the 7-day CS and the investigated parameters under consideration.
According to Wang et al. [67], using polycarboxylate as a superplasticizer promotes the production of C-S-H at later ages, which improves the microstructure of the cementitious matrix at 28 days. However, Puertas et al. [68] stated that the polycarboxylate-based ether HRWR slows silicate hydration (especially the alite phase) and influences ettringite formation, which affects the compressive strength at early ages. This explains the different effects shown by the superplasticizer for the early strengths (1 and 7 days) and for the 28-day strength shown in Figure 7 and Figure 8.
Moreover, too much of this chemical additive (polycarboxylate-based superplasticizer) might make reactive powder concrete (RPC) in its fresh condition stickier than preferred. The maximum compressive strength is attained when factors C and A are both equal to α (2.56 and 673.67 kg/m3, respectively) and when factor B is equal to a -α (0.156), according to the response surface for compressive strength at 28 days.
It is worth noting that while the CS varies at 24 h and 7 days, the influence of the interactions is not as pronounced as it is after 28 days. For example, after 28 days, the interaction between water and cement, in addition to being significant, stops to have a proportional effect on resistance and becomes inverse. Given the substantial interaction between cement dose and plasticizer, the latter should be immediately incorporated into the model as a simple factor, as shown in Table 9.
Again, if this were a single answer, it would be appropriate to retain the amount of cement at both its lower and upper limiting values, while keeping w/b at its center point and plasticizer above its center point to maximize the 28-day strength value. Such observations, however, must consider the optimization of all responses, particularly workability and CS28, as explained in the following section.

3.2. Simultaneous-Criterion Optimization and Experimental Evaluation

Table 10 depicts the outcomes of the simultaneous-criterion optimization, displaying the expected responses according to the optimized factor levels. The optimized experimental approach resulted in a preferred 29% reduction in OPC dosage and a significant 64% reduction in SF when compared to the normal RPC dosage shown in Table 5. By partially substituting these chemicals with less expensive alternatives such as GP and CaC, the mixture not only reduces its carbon footprint significantly, but also delivers significant long-term cost savings.

3.3. Evaluation of Properties of Optimized RPC’s Mixture

Given the global importance of environmental issues, the use of waste materials such as recycled glass in the construction industry has grown in popularity [69,70]. This is especially important in the case of reactive powder concrete (RPC), which requires more cement and hence has a significant carbon footprint impact.
Incorporating locally available admixtures such as calcium carbonate could also assist in overall cost savings in RPC manufacture. However, care must be taken to ensure that the use of mineral admixtures as partial alternatives for ordinary Portland cement (OPC) and silica fume (SF) does not compromise three important features that have a substantial impact on material performance. These characteristics include: (i) achieving proper particle packing density using particle packing theories, (ii) using suitable high-range water-reducing polycarboxylate-based superplasticizers that allow for a low water-to-binder ratio (w/b), and (iii) ensuring proper chemical reactions among components, such as hydraulic and pozzolanic reactions, to generate adequate gel products [49,71].
On the one hand, the presence of GP 28 in the particle size distribution (PSD) curve (Figure 4) helps to maintain the packing density of reactive powder concrete (RPC) while reducing the amount of silica sand and ordinary Portland cement (OPC). Similarly, the addition of calcium carbonate powder with an average particle size of 2 microns can potentially reduce the SF quantity without affecting the packing density much. Furthermore, the use of GP 7, which has a PSD similar to cement, did not reduce RPC’s packing density. On the other hand, optimizing the RPC mixture by introducing GP has a number of upsides. GP has an X-ray diffraction pattern (Figure 3) and a chemical composition (Table 1) that includes a significant amount of non-crystalline silicon oxide. This addition of GP ensures a positive balance of highly pozzolanic components, which helps to strengthen the cementitious paste and allows for a lower SF concentration.
The w/b ratio and superplasticizer concentration are clearly different between the control RPC dose and the optimized mixture, which is contrasted in detail in Table 10 and Table 11. Additionally, Figure 9 shows the scheme of the paste’s packing density of both RPC mixtures. Due to its alkaline nature and high concentration of Na2O (as indicated in Table 1), the use of GP has several advantages, including lowering the amount of water needed and improving flow by dispersing cement particles [65,72,73]. Figure 4d,e show how the nonporous nature of the glass powder particles reduces water absorption, enabling a higher percentage of free water to contribute to the rheological performance of the fresh combination [65].
When SF is present in concrete mixtures in sufficient amounts, it decreases the quantity of free water that is readily accessible, which in turn limits static flow. In order to maintain acceptable workability in mixes with large SF content, greater amounts of superplasticizers are required [65,74,75,76].
Due to the considerable specific surface area of the control sample combination, which is differentiated by its greater SF dose, it requires more water to attain the necessary rheological characteristics [16,46,65,73,77,78]. Additionally, the addition of CaC to the mixture as a partial replacement for ordinary Portland cement (OPC) works as a lubricant.

3.3.1. Compressive Strength

The compressive strength at 90 days in the control mixture was 168.09 MPa ± 4.41, whereas, in the optimized mixture, it measured 161.45 ± 3.38 (3.95% lower), both showing a normal growth of strength (Table 12). Similar results were reported by Ahmad et al. [75], who conducted an optimization study on UHPC utilizing industrial waste materials as a cement replacement and silica fume. They found a compressive strength of 152 MPa at 28 days for UHPC with a flow of 255 mm and up to a 40% reduction in silica fume [69].
The growth rate ratio between the control sample and the optimized mixture decreased over time, reaching a similarity between 28 and 90 days, as depicted in Table 13. The significant variation observed between the ages of 1, 7, and 28 days could be attributed to the higher cement and silica fume content in the control mixture, resulting in greater C-S-H formation at early ages. The increased reactivity of SFs can be attributed to their abundant amorphous silica oxide (Table 1 and Figure 3c), smaller particle size, and larger specific surface area (Figure 4 and Figure 5). The results showed that while the compressive strength values of the optimized RPC were lower than those of the control sample, the performance of the mineral admixtures investigated as SMC of ordinary Portland cement and SF remained within acceptable limits.

3.3.2. Chloride Ion Penetration

At the 28-day mark, there is a noticeable difference between the control and optimized doses (Figure 10), which may be attributed to the SF’s pozzolanic activity and the waste glass’s (starting) operation. Over time, though, these differences become less pronounced.
The improved mixture’s chloride ion penetration was found to be 2.1 times more than that of the control test after 90 days of testing. However, both RPC combination compositions showed insignificant measurements at 28 and 90 days, demonstrating CaC and GP’s outstanding behavior. As a result, it may be inferred that the improved RPC may be used in constructions that must withstand harsh circumstances, such as those prevalent in coastal locations [69,79,80]. At different testing ages, all mixes function exceptionally well overall, with a discernible decrease in permeability to chloride ions with time.

3.3.3. Ultrasonic Pulse Velocity

A consistent and gradual rise in results is seen over the range of testing ages for ultrasonic pulse velocity analysis. As shown in Figure 11, the optimized RPC mixes follow the control mixture in terms of reaction amplitude. The increased particle packing density inside the concrete matrix, which leads to a higher level of stiffness, can be blamed for this observed tendency. Therefore, the shorter time needed for the ultrasonic wave to pass through the specimen is an indication of the efficient transfer of energy. Notably, for all age stages, the doses of the materials, when ranked according to their respective ultrasonic pulse values, nearly match the dosages ordered by their VPD orders. These results are in line with those found by Nassif et al. [81], who showed the relationship between age progression and an increase in velocity while emphasizing the important roles played by the hydration process and the pozzolanic activity of the cementitious components across the range of UHPC dosages.

3.3.4. Drying Shrinkage

According to Figure 12, both the control and optimized RPC combinations showed increased shrinkage rates from days 1 to 15. The shrinkage rate did, however, dramatically decline from day 16 to day 25, which is consistent with findings comparable to those published by other investigators [82,83,84].
Overall, compared to the control test, the improved RPC mixture showed a decreased descent in its shrinkage curve for various measurement ages. This behavior could be attributed to a number of factors, such as slower volumetric changes at young ages, partial replacement of OPC and SF with mineral additives [85], decreased heat of hydration due to lower cement concentration, and reduced water loss during curing as a result of the optimized mixture’s lower water content. As these two components are strongly related in this kind of special concrete, it is important to note that decreasing the amount of SF in the optimum mixture enables a reduction in the amount of water [16,46,65,73,77,78].
Based on the above, it could be inferred that the partial replacement of OPC and SF with mineral additives effectively reduces drying shrinkage, hence lowering the risk of fracture and micro fissure development in the RPC mass.

3.3.5. Cost Savings in the Proposed Optimized RPC

Table 14 provides a detailed financial comparison between the optimized and the traditional reference mixtures. This cost evaluation utilized local market pricing, with the assumption that the expense associated with mixing water is negligible due to its minimal impact on the overall cost. Notably, the traditional control mixture’s expense stood at approximately 435.1 $/m3. In contrast, the optimized mixture manifested a cost of just 314.2 $/m3, showcasing an appreciable decrease. When quantified, this difference translates to a substantial cost reduction of roughly 27.8% or 120.9 $/m3. The data underscores not only the economic advantages inherent in adopting an optimized mixture but also hints at potential enhancements in both its performance and eco-friendliness. The financial ramifications of such a reduction become even more profound when applied to large-scale construction endeavors. This observation, in essence, underscores the pivotal role of continual research and innovation in paving the way for more economically viable and efficient construction materials.

4. Conclusions, Implications, and Outlook

A multi-objective simultaneous optimization methodology was adopted in this study to create a financially viable and environmentally sustainable reactive powder concrete (RPC). The strategy included the use of byproducts, such as ground glass powder (GP) as an SCM, with the goal of producing a cost-effective and environmentally friendly concrete that meets many objectives at the same time. The produced material had desirable workability and mechanical properties. The optimized RPC combination from the response surface method was subjected to extensive testing, which included measurements of compressive strength in cylinders, chloride ion penetration, ultrasonic pulse velocity, and drying shrinkage.
The results from this study emphasize the need for overseeing components such as cement dosage, water-to-binder ratio, and superplasticizer content in order to improve RPC’s early and long-term compressive strength while also taking workability and other crucial variables into consideration. The optimized reactive powder concrete (RPC) mixture had a slightly lower compressive strength at 90 days than the control mixture, but both showed normal strength growth over time, with the optimized mixture demonstrating an acceptable performance when mineral admixtures such as cement replacements and silica fume were used. Using powdered granulated blast furnace slag (GP) in ultra-high-performance concrete (UHPC) mixtures can cause an alkali–silica reaction, which has a direct effect on the mixture’s capacity for compressive strength. In influencing the slump flow of reactive powder concrete (RPC) at its fresh stage, the water-to-binder ratio (w/b) is a critical factor. It displays a distinct linear relationship with the slump flow, demonstrating its major impact on workability.
The use of superplasticizers based on polycarboxylates stimulates the formation of calcium-silicate-hydrate (C-S-H), which improves the microstructure of the cementitious matrix. It also has an effect on silicate hydration and ettringite production. However, too much of this chemical addition might cause stickiness in fresh RPC.
When compared to the control mixture, the optimized reactive powder concrete (RPC) dosage has a lower water-to-binder ratio and superplasticizer concentration, which is influenced by factors such as silica fume-specific surface area, the reduced presence of free water, the lubricating effect of calcium carbonate (CaC), and the water-reducing and dispersing properties of glass powder, resulting in improved rheological performance.
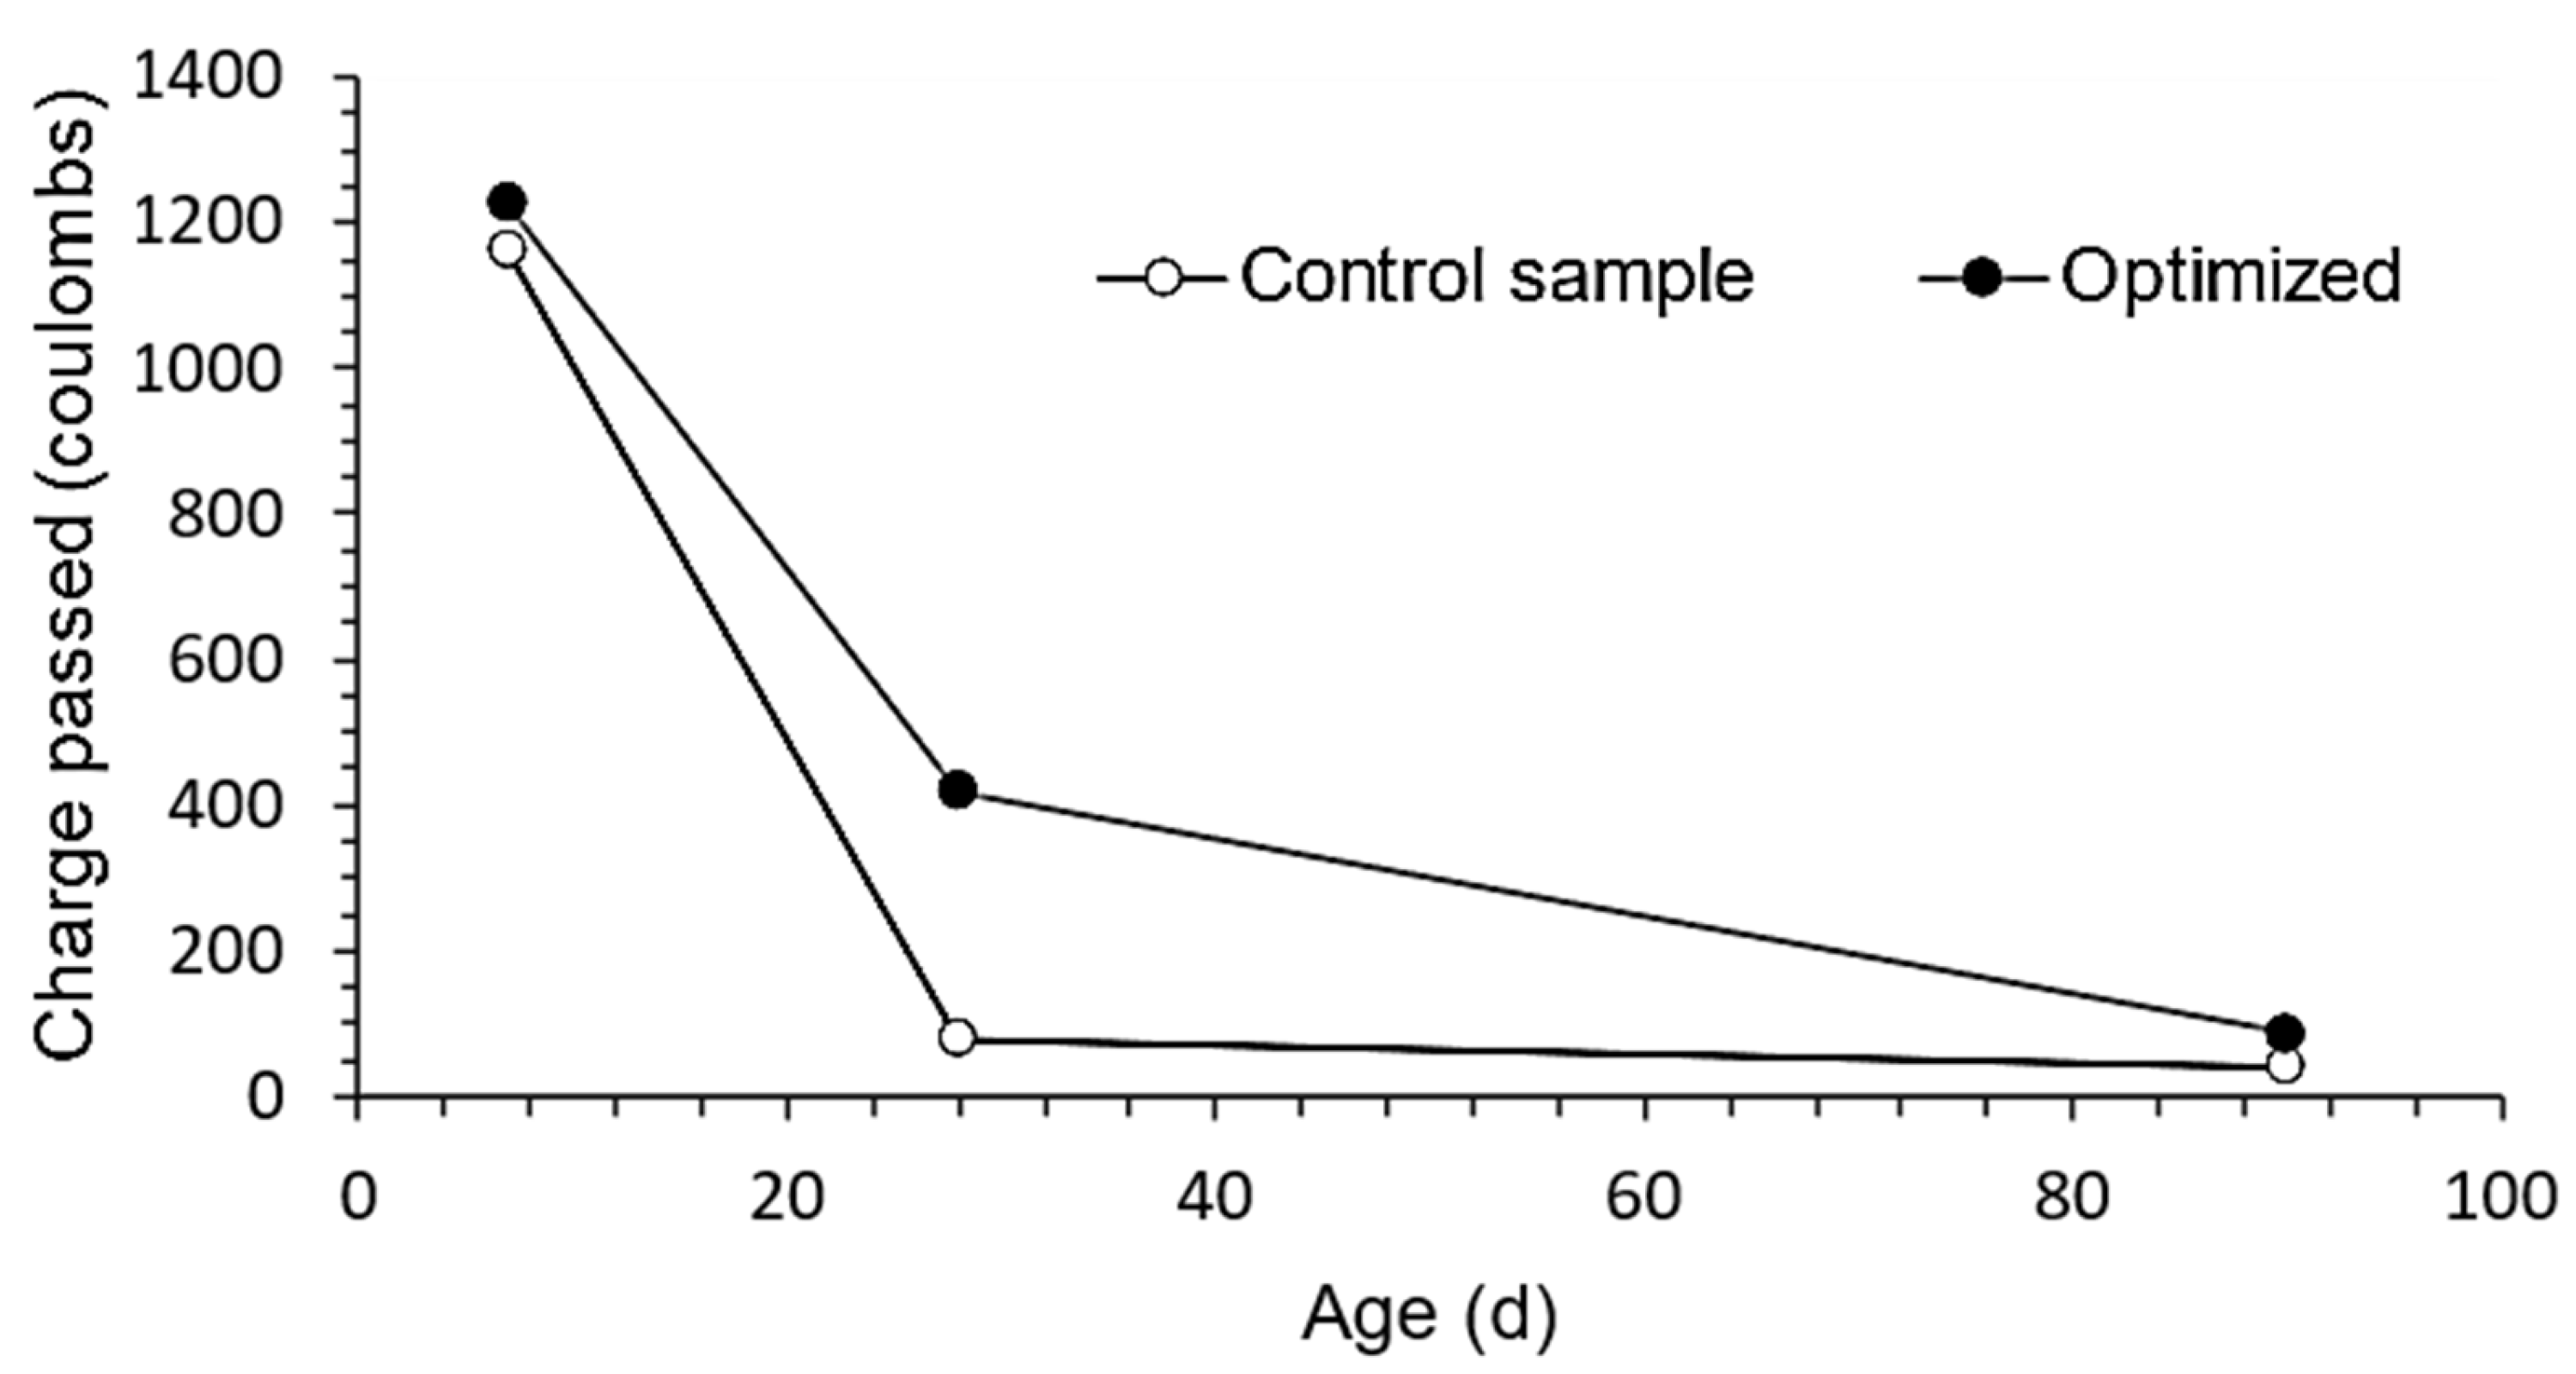
The pozzolanic activity of silica fume and waste glass resulted in noticeable differences between the optimized reactive powder concrete (RPC) mixture and the control mixture at the 28-day mark; however, both mixtures demonstrated satisfactory performance over time, with improved chloride ion penetration resistance and reduced permeability to chloride ions, making it suitable for construction in harsh environments such as coastal areas.
The optimized reactive powder concrete (RPC) with partial substitution of OPC and SF by mineral admixtures showed less drying shrinkage than the control RPC dosage, resulting in slower volumetric change at early ages and a lower likelihood of the formation of cracks and microcracks, highlighting the effectiveness of mineral admixtures in minimizing essential drying shrinkage and improving RPC’s mass integrity.
To summarize, as the inclusion of SCMs in the RPC mixture can influence the hydration kinetics and microstructure of the material, future research should strive to understand the underlying chemical mechanisms, hydration products, and pore structure evolution of blended RPC in order to improve its overall performance and potential considering the previously identified limitations and constraints. This analysis would play a role in ensuring a balanced strategy that meets both workability and financial goals.
In the current phase of our investigation, we have focused on an RPC formulation that uniquely incorporates waste glass and micro calcium carbonate. While our assessments have been confined to laboratory settings, the initial findings, including notable workability and compressive strength, hint at its viability for real-world engineering scenarios. This RPC not only offers an eco-friendly construction alternative by repurposing waste, but also presents potential economic efficiencies by substituting pricier traditional elements. Furthermore, its robust performance metrics, such as resistance to chloride infiltration, suggest broad applicability in diverse construction contexts, marking a significant stride in sustainable infrastructure development.
Future research could further explore alternative materials and methodologies to enhance the properties of RPC beyond those of traditional concrete. Exploring the incorporation of nanomaterials, diverse fiber types, or supplementary cementitious materials offers promising avenues. Furthermore, refining mixing protocols, curing processes, and particle packing strategies may lead to significant advancements.

Author Contributions

Conceptualization, J.A.-G.; Methodology, N.D. and M.M.; Validation, N.D., M.M. and M.I.K.; Formal analysis, J.A.-G. and Y.M.A.; Investigation, J.A.-G. and Y.M.A.; Resources, M.I.K.; Writing—original draft, J.A.-G.; Writing—review & editing, N.D., M.M., Y.M.A. and M.I.K.; Funding acquisition, M.I.K. All authors have read and agreed to the published version of the manuscript.

Funding

This research was funded by King Saud University, Riyadh, Kingdom of Saudi Arabia, Researcher Supporting Project number (RSPD2023R692).

Institutional Review Board Statement

Not applicable.

Informed Consent Statement

Not applicable.

Data Availability Statement

Not applicable.

Acknowledgments

The authors extend their appreciation to Researcher Supporting Project number (RSPD2023R692), King Saud University, Riyadh, Kingdom of Saudi Arabia. The second and third authors are also grateful to MinCiencias for promoting and enhancing Colombia’s high level of education (MinCiencias Call 809).

Conflicts of Interest

The authors declare no conflict of interest.

References

  1. Ge, W.; Zhang, Z.; Ashour, A.; Li, W.; Jiang, H.; Hu, Y.; Shuai, H.; Sun, C.; Li, S.; Liu, Y.; et al. Hydration Characteristics, Hydration Products and Microstructure of Reactive Powder Concrete. J. Build. Eng. 2023, 69, 106306. [Google Scholar] [CrossRef]
  2. Liu, M.; Dai, W.; Zhong, C.; Yang, X. Study on Mechanical Properties and Microstructure of Manufactured Sand Reactive Powder Concrete with Different Curing Methods. Mater. Lett. 2023, 335, 133818. [Google Scholar] [CrossRef]
  3. Alharbi, Y.R.; Abadel, A.A.; Salah, A.A.; Mayhoub, O.A.; Kohail, M. Engineering Properties of Alkali Activated Materials Reactive Powder Concrete. Constr. Build. Mater. 2021, 271, 121550. [Google Scholar] [CrossRef]
  4. Yazıcı, H.; Yardımcı, M.Y.; Aydın, S.; Karabulut, A.Ş. Mechanical Properties of Reactive Powder Concrete Containing Mineral Admixtures under Different Curing Regimes. Constr. Build. Mater. 2009, 23, 1223–1231. [Google Scholar] [CrossRef]
  5. Peng, Y.; Zhang, J.; Liu, J.; Ke, J.; Wang, F. Properties and Microstructure of Reactive Powder Concrete Having a High Content of Phosphorous Slag Powder and Silica Fume. Constr. Build. Mater. 2015, 101, 482–487. [Google Scholar] [CrossRef]
  6. Mayhoub, O.A.; Nasr, E.-S.A.R.; Ali, Y.A.; Kohail, M. The Influence of Ingredients on the Properties of Reactive Powder Concrete: A Review. Ain Shams Eng. J. 2021, 12, 145–158. [Google Scholar] [CrossRef]
  7. Alkhaly, Y.R.; Abdullah; Husaini; Hasan, M. Characteristics of Reactive Powder Concrete Comprising Synthesized Rice Husk Ash and Quartzite Powder. J. Clean. Prod. 2022, 375, 134154. [Google Scholar] [CrossRef]
  8. Kathirvel, P.; Murali, G. Effect of Using Available GGBFS, Silica Fume, Quartz Powder and Steel Fibres on the Fracture Behavior of Sustainable Reactive Powder Concrete. Constr. Build. Mater. 2023, 375, 130997. [Google Scholar] [CrossRef]
  9. Nasr, M.S.; Hasan, Z.A.; Abed, M.K.; Dhahir, M.K.; Najim, W.N.; Shubbar, A.A.; Habeeb, Z.D. Utilization of High Volume Fraction of Binary Combinations of Supplementary Cementitious Materials in the Production of Reactive Powder Concrete. Period. Polytech. Civ. Eng. 2021, 65, 335–343. [Google Scholar] [CrossRef]
  10. Sultan, H.K.; Zinkaah, O.H.; Rasheed, A.A.; Alridha, Z.; Alhawat, M. Producing Sustainable Modified Reactive Powder Concrete Using Locally Available Materials. Innov. Infrastruct. Solut. 2022, 7, 342. [Google Scholar] [CrossRef]
  11. Abed, M.; Nasr, M.; Hasan, Z. Effect of Silica Fume/Binder Ratio on Compressive Strength Development of Reactive Powder Concrete under Two Curing Systems. MATEC Web Conf. 2018, 162, 02022. [Google Scholar] [CrossRef]
  12. Shi, R.J.; Xiang, Z.; Liu, S.G.; Wang, D.H.; Ju, Y.Z. Mechanical Properties of Reactive Powder Concrete: A Review. IOP Conf. Ser. Mater. Sci. Eng. 2019, 629, 012009. [Google Scholar] [CrossRef]
  13. Pavan Kumar, G.; Ravitheja, A.; Madhu Anjaneyulu, C. Mechanical and Durability Properties of Hybrid Fiber Reactive Powder Concrete. Mater. Today Proc. 2021, 46, 16–20. [Google Scholar] [CrossRef]
  14. Chan, Y.-W.; Chu, S.-H. Effect of Silica Fume on Steel Fiber Bond Characteristics in Reactive Powder Concrete. Cem. Concr. Res. 2004, 34, 1167–1172. [Google Scholar] [CrossRef]
  15. Al-Hassani, H.M.; Khalil, W.I.; Danha, L.S. Mechanical Properties of Reactive Powder Concrete with Various Steel Fiber and Silica Fume Contents. Acta Teh. Corvinensis–Bull. Eng. 2014, VII, 47–58. [Google Scholar]
  16. Abellán García, J. Optimización de Dosificaciones de Hormigones de Ultra Altas Prestaciones Reforzados Con Fibras (UHPFRC) y Aplicaciones Como Material de Refuerzo Sísmico = Dosage Optimization and Seismic Retrofitting Applications of Ultra-High-Performance Fiber Reinforced Concrete (UHPFRC); Universidad Politécnica de Madrid: Madrid, Spain, 2021. [Google Scholar]
  17. Abellán-García, J.; Fernández-Gómez, J.A.; Torres-Castellanos, N.; Núñez-López, A.M. Tensile Behavior of Normal-Strength Steel-Fiber Green Ultra-High-Performance Fiber-Reinforced Concrete. ACI Mater. J. 2021, 118, 127–138. [Google Scholar] [CrossRef]
  18. Rashad, A.M. Recycled Waste Glass as Fine Aggregate Replacement in Cementitious Materials Based on Portland Cement. Constr. Build. Mater. 2014, 72, 340–357. [Google Scholar] [CrossRef]
  19. Hamada, H.; Alattar, A.; Tayeh, B.; Yahaya, F.; Thomas, B. Effect of Recycled Waste Glass on the Properties of High-Performance Concrete: A Critical Review. Case Stud. Constr. Mater. 2022, 17, e01149. [Google Scholar] [CrossRef]
  20. Redondo-Mosquera, J.D.; Sánchez-Angarita, D.; Redondo-Pérez, M.; Gómez-Espitia, J.C.; Abellán-García, J. Development of High-Volume Recycled Glass Ultra-High-Performance Concrete with High C3A Cement. Case Stud. Constr. Mater. 2023, 18, e01906. [Google Scholar] [CrossRef]
  21. Esmaeili, J.; AL-Mwanes, A.O. Performance Evaluation of Eco-Friendly Ultra-High-Performance Concrete Incorporated with Waste Glass-A Review. IOP Conf. Ser. Mater. Sci. Eng. 2021, 1094, 012030. [Google Scholar] [CrossRef]
  22. Kou, S.C.; Xing, F. The Effect of Recycled Glass Powder and Reject Fly Ash on the Mechanical Properties of Fibre-Reinforced Ultrahigh Performance Concrete. Adv. Mater. Sci. Eng. 2012, 2012, 263234. [Google Scholar] [CrossRef]
  23. Islam, G.M.S.; Rahman, M.H.; Kazi, N. Waste Glass Powder as Partial Replacement of Cement for Sustainable Concrete Practice. Int. J. Sustain. Built Environ. 2017, 6, 37–44. [Google Scholar] [CrossRef]
  24. Kaminsky, M.; Krstic, P.; Rangaraju, A.; Tagnit-Hamou, M.D.A. Thomas Ground-Glass Pozzolan for Use in Concrete. Concr. Int. 2020, 42, 24–32. [Google Scholar]
  25. Du, H.; Tan, K.H. Properties of High Volume Glass Powder Concrete. Cem. Concr. Compos. 2017, 75, 22–29. [Google Scholar] [CrossRef]
  26. Vaitkevičius, V.; Šerelis, E.; Hilbig, H. The Effect of Glass Powder on the Microstructure of Ultra High Performance Concrete. Constr. Build. Mater. 2014, 68, 102–109. [Google Scholar] [CrossRef]
  27. Jain, K.L.; Sancheti, G.; Gupta, L.K. Durability Performance of Waste Granite and Glass Powder Added Concrete. Constr. Build. Mater. 2020, 252, 119075. [Google Scholar] [CrossRef]
  28. Al-Awabdeh, F.W.; Al-Kheetan, M.J.; Jweihan, Y.S.; Al-Hamaiedeh, H.; Ghaffar, S.H. Comprehensive Investigation of Recycled Waste Glass in Concrete Using Silane Treatment for Performance Improvement. Results Eng. 2022, 16, 100790. [Google Scholar] [CrossRef]
  29. de Castro, S.; de Brito, J. Evaluation of the Durability of Concrete Made with Crushed Glass Aggregates. J. Clean. Prod. 2013, 41, 7–14. [Google Scholar] [CrossRef]
  30. Wang, H.-Y. A Study of the Effects of LCD Glass Sand on the Properties of Concrete. Waste Manag. 2009, 29, 335–341. [Google Scholar] [CrossRef]
  31. Malik, M.I.; Bashir, M.; Ahmad, S.; Tariq, T.; Chowdhary, U. Study of Concrete Involving Use of Waste Glass as Partial Replacement of Fine Aggregates. IOSR J. Eng. 2013, 3, 8–13. [Google Scholar] [CrossRef]
  32. Du, H.; Tan, K.H. Waste Glass Powder as Cement Replacement in Concrete. J. Adv. Concr. Technol. 2014, 12, 468–477. [Google Scholar] [CrossRef]
  33. Bueno, E.T.; Paris, J.M.; Clavier, K.A.; Spreadbury, C.; Ferraro, C.C.; Townsend, T.G. A Review of Ground Waste Glass as a Supplementary Cementitious Material: A Focus on Alkali-Silica Reaction. J. Clean. Prod. 2020, 257, 120180. [Google Scholar] [CrossRef]
  34. Guo, S.; Dai, Q.; Sun, X.; Xiao, X.; Si, R.; Wang, J. Reduced Alkali-Silica Reaction Damage in Recycled Glass Mortar Samples with Supplementary Cementitious Materials. J. Clean. Prod. 2018, 172, 3621–3633. [Google Scholar] [CrossRef]
  35. Dhir, R.K.; Dyer, T.D.; Tang, M.C. Alkali-Silica Reaction in Concrete Containing Glass. Mater. Struct. 2009, 42, 1451–1462. [Google Scholar] [CrossRef]
  36. Rajabipour, F.; Maraghechi, H.; Fischer, G. Investigating the Alkali-Silica Reaction of Recycled Glass Aggregates in Concrete Materials. J. Mater. Civ. Eng. 2010, 22, 1201–1208. [Google Scholar] [CrossRef]
  37. Ali Hussain, Z.; Aljalawi, N. Effect of Sustainable Glass Powder on the Properties of Reactive Powder Concrete with Polypropylene Fibers. Eng. Technol. Appl. Sci. Res. 2022, 12, 8388–8392. [Google Scholar] [CrossRef]
  38. Demiss, B.A.; Oyawa, W.O.; Shitote, S.M. Mechanical and Microstructural Properties of Recycled Reactive Powder Concrete Containing Waste Glass Powder and Fly Ash at Standard Curing. Cogent Eng. 2018, 5, 1464877. [Google Scholar] [CrossRef]
  39. Hasan, S.; Nayyef, D. Investigation of Using Waste Glass Powder as a Supplementary Cementitious Material in Reactive powder concrete. Proc. Int. Struct. Eng. Constr. 2020, 7, SUS-07-1–SUS-07-6. [Google Scholar] [CrossRef]
  40. Abellán García, J.; Núñez López, A.M.; Torres Castellanos, N.; Fernández Gómez, J.A. Factorial Design of Reactive Concrete Powder Containing Electric Arc Slag Furnace and Recycled Glass Powder. Dyna 2020, 87, 42–51. [Google Scholar] [CrossRef]
  41. Asteray, B.; Oyawa, W.; Shitote, S. Experimental Investigation on Compressive Strength of Recycled Reactive Powder Concrete Containing Glass Powder and Rice Husk Ash. J. Civ. Eng. Res. 2017, 7, 124–129. [Google Scholar]
  42. Neira Medina, A.L.; Abellán García, J.; Torres Castellanos, N. Flexural Behavior of Environmentally Friendly Ultra-High-Performance Concrete with Locally Available Low-Cost Synthetic Fibers. Eur. J. Environ. Civ. Eng. 2022, 26, 6281–6304. [Google Scholar] [CrossRef]
  43. Abellán-García, J. Tensile Behavior of Recycled-Glass-UHPC under Direct Tensile Loading. Case Stud. Constr. Mater. 2022, 17, e01308. [Google Scholar] [CrossRef]
  44. ASTM C1240-20; Standard Specification for Silica Fume Used in Cementitious Mixtures. ASTM International: West Conshohocken, PA, USA, 2020.
  45. Korpa, T.; Kowald, R. Trettin Principles of Development, Phase Composition and Nanostructural Features of Multiscale Ultra High Performance Concrete Modified with Pyrogenic Nanoparticles—A Review Article. Am. J. Mater. Sci. Appl. 2014, 2, 17–30. [Google Scholar]
  46. Shi, C.; Wu, Z.; Xiao, J.; Wang, D.; Huang, Z.; Fang, Z. A Review on Ultra High Performance Concrete: Part I. Raw Materials and Mixture Design. Constr. Build. Mater. 2015, 101, 741–751. [Google Scholar] [CrossRef]
  47. Abellán-García, J.; DSánchez-Díaz, J.A.; Ospina-Becerra, V.E. Neural Network-Based Optimization of Fibres for Seismic Retrofitting Applications of UHPFRC. Eur. J. Environ. Civ. Eng. 2022, 26, 6305–6333. [Google Scholar] [CrossRef]
  48. Funk, J.E.; Dinger, D.R. Predictive Process Control of Crowded Particulate Suspensions; Springer: Boston, MA, USA, 1994; ISBN 978-0-7923-9409-9. [Google Scholar]
  49. Abellán-García, J.; García-Castaño, E. Development and Research on Ultra-High-Performance Concrete Dosages in Colombia: A Review. ACI Mater. J. 2022, 119, 209–221. [Google Scholar] [CrossRef]
  50. Ragalwar, K.A.; Nguyen, H.; Ranade, R.; Heard, W.F.; Williams, B.A. Influence of Distribution Modulus of Particle Size Distribution on Rheological and Mechanical Properties of Ultra-High-Strength SHCC Matrix; Springer: Dordrecht, The Netherlands, 2018; pp. 221–229. [Google Scholar]
  51. Mrudul, P.M.; Upender, T.; Balachandran, M.; Mini, K.M. Study on Silica Infused Recycled Aggregate Concrete Using Design of Experiments. J. Eng. Sci. Technol. 2017, 12, 958–971. [Google Scholar]
  52. Chong, B.W.; Othman, R.; Putra Jaya, R.; Mohd Hasan, M.R.; Sandu, A.V.; Nabiałek, M.; Jeż, B.; Pietrusiewicz, P.; Kwiatkowski, D.; Postawa, P.; et al. Design of Experiment on Concrete Mechanical Properties Prediction: A Critical Review. Materials 2021, 14, 1866. [Google Scholar] [CrossRef]
  53. Rakić, T.; Kasagić-Vujanović, I.; Jovanović, M.; Jančić-Stojanović, B.; Ivanović, D. Comparison of Full Factorial Design, Central Composite Design, and Box-Behnken Design in Chromatographic Method Development for the Determination of Fluconazole and Its Impurities. Anal. Lett. 2014, 47, 1334–1347. [Google Scholar] [CrossRef]
  54. Burruss, G.W.; Bray, T.M. Confidence Intervals. In Encyclopedia of Social Measurement; Elsevier: Amsterdam, The Netherlands, 2005; pp. 455–462. [Google Scholar]
  55. Abellan-Garcia, J.; Iqbal Khan, M.; Abbas, Y.M.; Castro-Cabeza, A.; Carrillo, J. Multi-Criterion Optimization of Low-Cost, Self-Compacted and Eco-Friendly Micro-Calcium-Carbonate- and Waste-Glass-Flour-Based Ultrahigh-Performance Concrete. Constr. Build. Mater. 2023, 371, 130793. [Google Scholar] [CrossRef]
  56. Derringer, G.; Suich, R. Simultaneous Optimization of Several Response Variables. J. Qual. Technol. 1980, 12, 214–219. [Google Scholar] [CrossRef]
  57. ASTM C1437; Standard Test Method for Flow of Hydraulic Cement Mortar. American Society for Testing and Materials: Conshohocken, PA, USA, 2016.
  58. ASTM C109/C109M; Standard Test Method for Compressive Strength of Hydraulic Cement Mortars (Using 2-in or [50-Mm] Cube Specimens). American Society for Testing and Materials: West Conshohocken, PA, USA, 2010.
  59. ASTM C39/C39M-21; Standard Test Method for Compressive Strength of Cylindrical Concrete Specimens. ASTM International: West Conshohocken, PA, USA, 2021.
  60. ASTM C511-21; Standard Specification for Mixing Rooms, Moist Cabinets, Moist Rooms, and Water Storage Tanks Used in the Testing of Hydraulic Cements and Concretes. ASTM International: West Conshohocken, PA, USA, 2021.
  61. ASTM C1202-22e1; Standard Test Method for Electrical Indication of Concrete’s Ability to Resist Chloride Ion Penetration. ASTM International: West Conshohocken, PA, USA, 2022.
  62. ASTM C490/C490M-17; Use of Apparatus for the Determination of Lenght Change Hardened Cement Paste, Mortar, and Concrete. ASTM International: West Conshohocken, PA, USA, 2017.
  63. ASTM C597-16; Standard Test Method for Pulse Velocity Through Concrete. ASTM International: West Conshohocken, PA, USA, 2016.
  64. The European Project Group. The European Guidelines for Self-Compacting Concrete; The European Precast Concrete Organisation: Brussels, Belgium, 2005. [Google Scholar]
  65. Abellán, J.; Fernández, J.; Torres, N.; Núñez, A. Statistical Optimization of Ultra-High-Performance Glass Concrete. ACI Mater. J. 2020, 117, 243–254. [Google Scholar] [CrossRef]
  66. Lootens, D.; Bentz, D.P. On the Relation of Setting and Early-Age Strength Development to Porosity and Hydration in Cement-Based Materials. Cem. Concr. Compos. 2016, 68, 9–14. [Google Scholar] [CrossRef]
  67. Wang, J.; Zhang, Y.; Lu, L.; Luo, Q.; Ma, L.; Zhang, R.; Li, B.; Li, H.; Liu, F. Understanding the Role of Nano-C-S-H-Polycarboxylate Composites on Compressive Strength and Frost Resistance of Portland-Sulfoaluminate Cement Blended Concretes. Mater. Today Commun. 2023, 35, 106079. [Google Scholar] [CrossRef]
  68. Puertas, F.; Santos, H.; Palacios, M.; Martnez-Ramrez, S. Polycarboxylate Superplasticiser Admixtures: Effect on Hydration, Microstructure and Rheological Behaviour in Cement Pastes. Adv. Cem. Res. 2005, 17, 77–89. [Google Scholar] [CrossRef]
  69. Ahmad, S. Use of Alternative Waste Materials in Producing Ultra-High Performance Concrete. MATEC Web Conf. 2017, 120, 03014. [Google Scholar] [CrossRef]
  70. Abellán-García, J. Artificial Neural Network Model for Strength Prediction of Ultra-High-Performance Concrete. ACI Mater. J. 2021, 118, 3–14. [Google Scholar] [CrossRef]
  71. Soliman, N.A.; Tagnit-Hamou, A. Using Particle Packing and Statistical Approach to Optimize Eco-Efficient Ultra-High-Performance Concrete. ACI Mater. J. 2017, 114, 847–858. [Google Scholar] [CrossRef]
  72. Pedrajas, C.; Rahhal, V.; Talero, R. Determination of Characteristic Rheological Parameters in Portland Cement Pastes. Constr. Build. Mater. 2014, 51, 484–491. [Google Scholar] [CrossRef]
  73. Abellán, J.; Fernández, J.; Torres, N.; Núñez, A. Development of Cost-Efficient UHPC with Local Materials in Colombia. In Proceedings of the 5th International Symposium Ultra-High Performance Concrete and High Performance Construction Materials, Kassel, Germany, 11–13 March 2020; Kassel University: Kassel, Germany, 2020. [Google Scholar]
  74. Turk, K.; Demirhan, S. Effect of Limestone Powder on the Rheological, Mechanical and Durability Properties of ECC. Eur. J. Environ. Civ. Eng. 2017, 21, 1151–1170. [Google Scholar] [CrossRef]
  75. Ahmad, S.; Hakeem, I.; Maslehuddin, M. Development of UHPC Mixtures Utilizing Natural and Industrial Waste Materials as Partial Replacements of Silica Fume and Sand. Sci. World J. 2014, 2014, 713531. [Google Scholar] [CrossRef]
  76. Ghezal, A.; Khayat, K.H. Optimization of Cost-Effective Self-Consolidating Concrete Optimizing Self-Consolidating Concrete with Limestone Filler by Using Statistical Factorial Design Methods. ACI Mater. J. 2002, 99, 264–272. [Google Scholar]
  77. Soliman, N.A.; Tagnit-Hamou, A. Partial Substitution of Silica Fume with Fine Glass Powder in UHPC: Filling the Micro Gap. Constr. Build. Mater. 2017, 139, 374–383. [Google Scholar] [CrossRef]
  78. Abellán-García, J.; Guzmán-Guzmán, J.S. Random Forest-Based Optimization of UHPFRC under Ductility Requirements for Seismic Retrofitting Applications. Constr. Build. Mater. 2021, 285, 122869. [Google Scholar] [CrossRef]
  79. Haber, Z.B.; la Varga, I.D.; Graybeal, B.A.; Nakashoji, B.; El-Helou, R. Properties and Behavior of UHPC-Class Materials; United States Federal Highway Administration, Office of Infrastructure Research and Development: Washington, DC, USA, 2018.
  80. Abbas, S.; Nehdi, M.L.; Saleem, M.A. Ultra-High Performance Concrete: Mechanical Performance, Durability, Sustainability and Implementation Challenges. Int. J. Concr. Struct. Mater. 2016, 10, 271–295. [Google Scholar] [CrossRef]
  81. Nassif, H.H.; Najm, H.; Suksawang, N. Effect of Pozzolanic Materials and Curing Methods on the Elastic Modulus of HPC. Cem. Concr. Compos. 2005, 27, 661–670. [Google Scholar] [CrossRef]
  82. Wu, Z.; Shi, C.; He, W.; Wu, L. Effects of Steel Fiber Content and Shape on Mechanical Properties of Ultra High Performance Concrete. Constr. Build. Mater. 2016, 103, 8–14. [Google Scholar] [CrossRef]
  83. Lee, H.-J.; Kim, S.-K.; Lee, H.-S.; Kim, W. A Study on the Drying Shrinkage and Mechanical Properties of Fiber Reinforced Cement Composites Using Cellulose Nanocrystals. Int. J. Concr. Struct. Mater. 2019, 13, 39. [Google Scholar] [CrossRef]
  84. Abellan-Garcia, J.; Iqbal Khan, M.; Abbas, Y.M.; Martínez-Lirón, V.; Carvajal-Muñoz, J.S. The Drying Shrinkage Response of Recycled-Waste-Glass-Powder-and Calcium-Carbonate-Based Ultrahigh-Performance Concrete. Constr. Build. Mater. 2023, 379, 131163. [Google Scholar] [CrossRef]
  85. Tam, C.M.; Tam, V.W.Y.; Ng, K.M. Assessing Drying Shrinkage and Water Permeability of Reactive Powder Concrete Produced in Hong Kong. Constr. Build. Mater. 2012, 26, 79–89. [Google Scholar] [CrossRef]
Figure 1. Experimental framework methodology.
Materials 16 06434 g001
Figure 2. Particle size distribution of granular RPC-making ingredients.
Materials 16 06434 g002
Figure 3. XRD findings on (a) waste glass, (b) CaC, (c) SF, and (d) cement.
Materials 16 06434 g003
Figure 4. SEM findings of the fine powders employed in this study: (a) OPC, (b) SF, (c) CaC, (d) GP 7, and (e) GP 28.
Materials 16 06434 g004aMaterials 16 06434 g004b
Figure 5. Diagram of a central composite design.
Materials 16 06434 g005
Figure 6. Analysis of factor impact and interactions on RPC slump flow using RSM and contour plots.
Materials 16 06434 g006
Figure 7. Responses surfaces for impact analysis of factors on RPC’s CS at (a) 1 d, (b) 7 d, and (c) 28 d.
Materials 16 06434 g007
Figure 8. Contour plots for impact analysis of factors on RPC’s CS using at (a) 1 d, (b) 7 d, and (c) 28 d.
Materials 16 06434 g008
Figure 9. Particle packing density comparison between (a) control and (b) optimized RPC mixtures.
Materials 16 06434 g009
Figure 10. Chloride ion penetration test value mixtures at 7, 28, and 90 days.
Materials 16 06434 g010
Figure 11. Ultrasonic pulse velocity of mixtures at ages.
Materials 16 06434 g011
Figure 12. Drying shrinkage of the control sample and optimized RPC mixtures.
Materials 16 06434 g012
Table 1. Chemical characterization of granular RPC-making raw materials.
Oxides (%)CementSFCaCGP 28
SiO220.0194.010.9172.48
CaO63.413.7155.739.51
Na2O0.140.210.0111.61
Al2O35.620.620.21.43
SO32.590.050.140.02
Fe2O33.020.220.060.62
Others1.920.590.792.38
Table 2. Physical characterization of granular RPC-making raw materials.
PropertiesCementSFCaCGP 28
L.O.I (%)3.290.5942.122.22
Specific gravity3.142.212.742.61
d50 (μm)90.15228
Table 3. The RPC mixing proportions for the design points (DP) of the CCD.
MixCoordinates (A, B, C)Cement SFWGPCalcium CarbonateSandWater Superplasticizerw/b
1(−1, −1, −1)590100328231884200220.16
2(1, −1, −1)650100296202895200220.16
3(−1, 1, −1)590100328231851212220.17
4(1, 1, −1)650100296202861212220.17
5(−1, −1, 1)590100328231881200260.16
6(1, −1, 1)650100296202892200260.16
7(−1, 1, 1)590100328231849212260.17
8(1, 1, 1)650100296202859212260.17
9(0, 0, 0)620100320223851208240.165
10(0, 0, 0)620100320223851208240.165
11(−α, 0, 0)566100341244859206240.165
12(α, 0, 0)674100282190885206240.165
13(0, −α, 0)620100320223881197240.156
14(0, α, 0)620100320223821220240.174
15(0, 0, −α)620100320223854208200.165
16(0, 0, α)620100320223849208280.165
17(0, 0, 0)620100320223851208240.165
18(0, 0, 0)620100320223851208240.165
Table 4. Factor values for each of the coordinates in the CCD.
FactorUnitsFactor’s Coordinates in the CCD
−α−101α
Akg/m3566.33590620650673.67
B-0.1560.160.1650.170.174
C(%, vol.)1.8422.22.42.56
Table 5. Values of factor’s coordinates in the CCD.
NameGoalLU
A: Cement dosageMinimize--
B: W/bRange0.140.18
C: HRWR concentrationMinimize--
CS28Maximize--
WRRange240260
Table 6. Workability for mixes.
MixWorkability (mm)
M1223.50 ± 4.12
M2206.50 ± 2.52
M3265.50 ± 0.58
M4263.00 ± 1.83
M5272.50 ± 2.89
M6239.50 ± 0.58
M7291.00 ± 0.00
M8258.50 ± 1.00
M9264.50 ± 2.08
M10267.00 ± 3.46
M11263.50 ± 1.29
M12241.50 ± 2.89
M13211.50 ± 0.58
M14276.50 ± 0.58
M15245.50 ± 0.58
M16263.50 ± 0.58
M17273.00 ± 0.00
M18272.25 ± 1.89
Table 7. Regression coefficients and p-values for the workability response model.
TimeInterceptABCAB (*)AC (**)BCA2B2C2
WR269.286−8.63617.5199.3891.875−5.750−7.625−5.055−7.712−4.430
p-value-0.0028<1 × 10−40.00180.4900.06060.02100.03070.00450.0499
(*) One factor or interactions p-value > 0.1. The coefficient is not included in the regression model. (**) One factor or interactions 0.1 ≤ p-value ≥ 0.05. The coefficient is included in the regression model.
Table 8. Development of CS of UHPC with different proportions.
MixCompressive Strength (MPa)
1 d7 d28 d
M144.33 ± 8.46103.48 ± 5.90147.40 ± 8.21
M254.49 ± 3.81114.84 ± 6.15156.06 ± 11.90
M343.11 ± 8.2388.73 ± 7.22142.24 ± 7.65
M453.86 ± 1.08100.09 ± 4.36142.39 ± 8.89
M549.55 ± 9.08104.02 ± 17.77152.06 ± 4.53
M647.40 ± 2.6496.62 ± 4.53160.24 ± 8.32
M745.62 ± 4.18101.58 ± 10.61139.50 ± 2.79
M843.46 ± 7.8396.36 ± 6.68139.90 ± 9.44
M960.14 ± 4.2199.42 ± 6.98147.19 ± 2.33
M1056.52 ± 5.9899.42 ± 9.09152.00 ± 10.60
M1148.89 ± 5.4494.30 ± 10.50157.28 ± 2.58
M1257.24 ± 6.01100.94 ± 15.54164.74 ± 1.66
M1348.55 ± 7.81109.95 ± 16.42144.10 ± 5.00
M1444.83 ± 3.2394.58 ± 10.23119.41 ± 3.88
M1549.82 ± 6.53103.89 ± 7.49148.51 ± 4.48
M1646.44 ± 2.5999.09 ± 12.02148.57 ± 6.45
M1754.57 ± 10.0098.03 ± 6.15142.88 ± 3.78
M1856.35 ± 6.4098.57 ± 5.35146.09 ± 7.66
Table 9. Regression coefficients and p-values for the compression strength response model at 1, 7, and 28 days.
InterceptABCABACBCA2B2C2
CS-156.8332.189−1.137−1.097 (**)0.071 (*)−3.152−0.752 (**)−1.527−3.517−3.069
p-value 0.00430.06810.07620.92270.00300.32350.02102 × 10−46 × 10−4
CS-798.8491.527−4.146−1.1910.271 (*)−4.4183.350−0.330 (**)1.1230.880
p-value <1 × 10⁻⁴<1 × 10−42 × 10−40.2756<1 × 10⁻⁴<1 × 10−40.08843 × 10−40.0011
CS-28146.9812.134−6.6590.256 (**)−2.036 (**)−0.031 (*)−1.759 (**)4.426−4.7160.529 (*)
p-value 0.0087<1 × 10−40.67810.03750.96960.06251 × 10−4<1 × 10−40.3904
(*) One factor or interactions p-value > 0.1. The coefficient is not included in the regression model. (**) One factor or interactions 0.1 ≤ p-value ≥ 0.05. The coefficient is included in the regression model.
Table 10. Optimized RPC mixture: factors and responses.
Optimized RPC CoordinatesFactor’s ValuesModel’s Responses
ABCA (Cement in kg/m3)B (w/b)C (%sp)Slump (mm)R28 (MPa)
−0.8940−0.7456030.1652250155
Table 11. RPC mixture proportions in kg/m3.
MaterialCementSFWaste GlassCalcium CarbonateSandSuperplasticizerWater
Control8522720083426.5245
Optimized59010033525777821.5211
Table 12. Variation of CS of control and optimized RPC mixtures at 1, 7, 18, and 90 days.
Mixtures1 d7 d28 d90 d
Control sample74.33 ± 2.11123.48 ± 2.95167.06 ± 2.85168.09 ± 4.41
Optimized48.55 ± 2.88103.25 ± 3.65156.27 ± 4.14161.45 ± 3.38
Table 13. CS growth rate of mixtures.
Mixtures1 to 7 d7 to 28 d28 to 90 d
Control sample66.1%35.3%0.61%
Optimized112.7%51.3%3.31%
Table 14. Cost analysis for the optimized and reference mixtures.
MaterialCementSFWaste GlassCalcium CarbonateSandSuperplasticizerTotal ($/m3)
Cost ($/kg)0.1140.5660.0260.0500.0543.553–––
Control97.53157895153.89473680044.9921052694.14473684435.1
Optimizad67.5394736856.578947378.81578947412.8541.9710526376.38157895314.2
Disclaimer/Publisher’s Note: The statements, opinions and data contained in all publications are solely those of the individual author(s) and contributor(s) and not of MDPI and/or the editor(s). MDPI and/or the editor(s) disclaim responsibility for any injury to people or property resulting from any ideas, methods, instructions or products referred to in the content.

