Article

Low-CO2 Optimization Design of Quaternary Binder Containing Calcined Clay, Slag, and Limestone

1
Faculty of Civil Engineering and Mechanics, Kunming University of Science and Technology, Kunming 650500, China
2
Yunnan Key Laboratory of Disaster Reduction in Civil Engineering, Kunming 650500, China
3
International Joint Laboratory for Green Construction and Intelligent Maintenance of Yunnan Province, Kunming 650500, China
4
Department of Integrated Energy and Infra System, Kangwon National University, Chuncheon-si 24341, Republic of Korea
5
Department of Architectural Engineering, Kangwon National University, Chuncheon-si 24341, Republic of Korea
6
Division of Smart Convergence Engineering, Hanyang University ERICA, 1271 Sa-3-dong, Sangnok-gu, Ansan 15588, Republic of Korea
*
Authors to whom correspondence should be addressed.
Materials 2023, 16(19), 6385; https://doi.org/10.3390/ma16196385
Submission received: 9 August 2023 / Revised: 16 September 2023 / Accepted: 22 September 2023 / Published: 24 September 2023

Abstract

:
Blended cement is commonly used for producing sustainable concretes. This paper presents an experimental study and an optimization design of a low-CO2 quaternary binder containing calcined clay, slag, and limestone using the response surface method. First, a Box–Behnken design with three influencing factors and three levels was used for the combination design of the quaternary composite cement. The lower limit of the mineral admixtures was 0%. The upper limits of slag, calcined clay, and limestone powder were 30%, 20%, and 10%, respectively. The water-to-binder ratio (water/binder) was 0.5. Experimental works to examine workability and strength (at 3 and 28 days) were performed for the composite cement. The CO2 emissions were calculated considering binder compositions. A second-order polynomial regression was used to evaluate the experimental results. In addition, a low-CO2 optimization design was conducted for the composite cement using a composite desirability function. The objectives of the optimization design were the target 28-day strength (30, 35, 40, and 45 MPa), target workability (160 mm flow), and low CO2 emissions. The trends of the properties of optimal combinations were consistent with those in the test results. In summary, the proposed optimization design can be used for designing composite cement considering strength, workability, and ecological aspects.

1. Introduction

Clay and limestone are minerals available in many countries worldwide, and granulated blast furnace slag is a byproduct of the steel-making industry. Calcined clay, slag, and limestone are being increasingly used as mineral admixtures in concrete production. Using these mineral admixtures, numerous advantageous properties can be achieved, such as good workability, low hydration heat, and low environmental impact. To rationally use calcined clay, slag, and limestone, both experimental studies and numerical optimization studies of the workability, mechanical, and ecological aspects are necessary [1,2].
Many experimental studies have been conducted on binary or ternary blended concretes containing calcined clay, slag, and limestone. First, regarding binary blended concretes, Kang et al. [3] found that cement hydration can be accelerated by the inclusion of limestone powder. Li et al. [4] reported that the threshold value of chloride ions decreases as the content of limestone increases. Tironi et al. [5] showed that calcination and grinding improve the reaction of raw clay. Lin et al. [6] found that calcined hwangtoh clay has nucleation, dilution, and chemical effects on the hydration reaction of ordinary Portland cement. Kocaba et al. [7] reported that calorimetry calibration and backscattered electron imaging are promising methods to measure the reaction degree of slag. Second, for ternary hybrid concrete, Arora et al. [8] found a synergistic effect between limestone and slag and determined the linear relationship between carbonate consumption and carboaluminate formation. Ramezanianpour and Hooton [9] found that a high content of alumina in slag or metakaolin increases the reaction rate of limestone and its optimum level. Dhandapani and Santhanam [10] showed that cement-based material with a limestone-calcined clay–cement (LC3) binder has much lower permeability than a fly ash hybrid binary concrete. Dhandapani et al. [11] presented results showing that LC3 concretes are suitable for structures in a chloride attack environment. Pillai et al. [12] reported that LC3 concrete has a much lower CO2 footprint than plain concrete while having similar strength. In summary, previous experimental studies have mainly focused on the properties of ternary or binary blended concretes; there have been few studies on quaternary blended concretes incorporating calcined clay, slag, and limestone filler [13,14]. In some countries, such as China, Korea, and India, many mineral admixtures are in use, such as slag, calcined clay, and limestone. Concrete producers and researchers are interested in whether slag, calcined clay, and limestone can be used together for producing quaternary blended cement. In addition, what about the performance of such quaternary-blended-cement-based materials? Are there possible synergistic effects among calcined clay, slag, and limestone?
Several numerical models for blended cement have been proposed to evaluate the properties of blended concretes. First, regarding binary blended concretes, Kolani et al. [15] modeled the kinetic process of hydration of slag–cement binary blends and evaluated the heat of hydration, combined water, and calcium hydroxide. Wang [16] proposed an integrated model for metakaolin–cement hybrid blends and evaluated the degree of reaction of metakaolin and cement, strength, and permeability properties of metakaolin hybrid concretes. Wang [17] evaluated the degree of hydration, strength development, and carbonation durability of limestone-blended concrete considering the nucleation effect and dilution effect of limestone filler. Second, regarding ternary blended concretes, Kunther et al. [18] conducted thermodynamic modeling and evaluated the compositions of reaction products of ternary blends of cement–metakaolin–limestone. Wang and Luan [19] proposed a kinetic hydration and strength model for ternary blends of cement–slag–limestone and determined the optimum combination ratio of slag and limestone for different ages. Carrasco et al. [20] proposed experimental design methods and produced market-oriented cement containing slag and limestone. Yang et al. [21] simulated chloride penetration through LC3 high-performance concretes considering the binder composition and the damage. Avet et al. [22] determined the reacted extent of metakaolin in calcined clay and evaluated the phase assemblage of an LC3 paste by thermodynamic modeling and mass balance. In summary, the current numerical processes are mainly valid for plain, binary, or ternary hybrid concretes, but models that are effective for quaternary blended concretes require further investigation.
Based on this literature study, we found that compared with fundamental studies on plain, binary, or ternary blended concretes, studies on quaternary concretes are limited. To fill this gap, this paper presents experimental studies and numerical modeling of quaternary cement containing slag, calcined clay, and limestone. Tests of the workability and strength were performed, and the CO2 emissions were calculated. Furthermore, based on the test results, a numerical model was used to determine the optimum combinations with target flow and strength and low CO2 emissions.
Compared with previous research, the scientific innovations of this article mainly include the following aspects: 1. The research object is four mixed cement-based materials. Previous studies were mostly on two and three mixed cement-based materials; 2. The response surface design method proposed in this paper systematically considers fluidity, strength, and CO2 emissions, while CO2 emissions were not considered in previous concrete mix design methods; 3. The design method proposed in this article has certain portability and is suitable for designing low-carbon concretes in different countries and regions.

2. Materials and Methods

2.1. Materials

Ordinary Portland cement of ASTM type I (ASTM C150) was obtained from Sung Shin Cement [23], Republic of Korea. Hwangtoh is a clay mineral widely distributed in Korea. It contains high levels of calcium potassium chloride and calcium. Clay was ground before calcination, and calcined clay was produced by calcining hwangtoh clay at 800 °C for 60 min [6]. Figure 1 shows the XRD analysis results of clay before and after calcination. We can see that the calcination eliminated the kaolinite peak (2θ = 12.37°) [6]. Limestone powder and granulated blast furnace slag were obtained from Daejung Chemical Co., Ltd. (Sinan, Republic of Korea) and Asia Cement Co., Ltd. (Seoul, Republic of Korea), respectively. Table 1 presents the chemical compositions of the cement, limestone, slag, and calcined clay. The standard deviation for the XRF analysis results in Table 1 is 0.01%. Calcined clay and slag have higher aluminum contents than cement, which can support a synergistic effect between the limestone and slag or calcined clay. Calcined clay presents a higher silicon content than cement, which can contribute to the production of secondary calcium silicate hydrate (CSH). The average particle sizes of the cement, slag, calcined clay, and limestone were 18.3 µm, 12.8 µm, 12.3 µm, and 7.4 µm, respectively.

2.2. Experimental Method

Mixture preparation: The cement paste was mixed using a mechanical mixer and immediately put into a steel mold. At the age of 1 day, the steel mold was removed, and after removal, the paste specimens were placed in a curing chamber for sealed curing until they reached test age. The temperature for sealed curing was 20 degrees Celsius.
Test: The flow properties of the slurries were measured based on the mini-slump test method. The dimensions of the mini-slump cone were a height of 50 mm, a top diameter of 70 mm, and a bottom diameter of 100 mm. In addition, at curing ages of 3 days and 28 days, the compressive strength of the paste samples was tested according to ASTM C349 [24]. The sample size for compressive strength testing was 50 × 50 × 50 mm. Samples for compressive strength testing were cured via sealed curing. For each mixture, three specimens were prepared. The average of the measured values for the three specimens was taken as the strength value for each group of specimens. However, when the difference between the maximum or minimum value among the three measured values and the middle value exceeded 15% of the middle value, the maximum and minimum values were eliminated, and the middle value was taken as the compressive strength of the group of specimens.

2.3. Experimental Design

A Box–Behnken design (BBD) was employed to design the quaternary hybrid cement combinations [25,26]. As can be seen from Table 2, the BBD consisted of three independent factors (limestone, calcined clay, and slag). For each factor, there were three values corresponding to codes +1, 0, and −1. The maximum replacement ratios (high-coded +1) of limestone, calcined clay, and slag were 10%, 20%, and 30%, respectively. The maximum replacement ratio by the mineral admixture was 60% (10% + 20% + 30% = 60%). Cases of control, binary blends, ternary blends, and quaternary blends were considered. The minimum ratio (low-coded −1) for limestone, calcined clay, and slag was 0%. The water-to-binder ratio of the specimens was 0.5. The combinations of components of the binders are shown in Figure 2 and listed in Table 3. A total of 21 specimens were prepared, consisting of 17 BBD specimens and 4 additional specimens. The additional specimens were added to consider the lower limit combination (M1), the upper limit combination (M21), and the synergetic effect between limestone and calcined clay (M5 and M14).
CO2 emissions are an important indicator of sustainable concrete. Herein, quaternary cement was designed with CO2 emissions as the optimization target. According to the sample mixtures and the specific CO2 emissions of each binder (listed in Table 4) [27], the CO2 emissions per unit volume of each sample can be determined.
The CO2 emissions of 1 m3 of composite paste can be determined as follows. First, we determine the individual masses of the paste components:
i = 1 5 m i ρ i = 1
where m i and ρ i are the mass and density (shown in Table 1), respectively, of component i of the composite binder. Because the composite binder consists of five constituents, i.e., cement, calcined clay, slag, limestone powder, and water, the value of subscript i ranges from 1 to 5. Second, from the individual masses and individual CO2 emissions of the components of paste (shown in Table 4), we can calculate the CO2 emissions of 1 m3 of paste.
C O 2 = i = 1 5 m i × C O 2 i
Here, C O 2 i is the individual CO2 emissions (shown in Table 4) of component i of the paste, and C O 2 is the total CO2 emissions of 1 m3 of paste.
A second-order polynomial model was employed to perform a regression of the results (flow, strength, and CO2 emissions) and examine the effect of the type and content of the mineral admixture [26]. The general equation of the second-order polynomial regression model is as follows:
y = β 0 + i = 1 3 β i x i + i = 1 3 β i i x i 2 + i = 1 2 j > i 3 β i j x i x j
where y is an experimental result (such as flow, strength, or CO2 emissions), x i is an independent factor (three independent factors were employed, i.e., the contents of limestone, calcined clay, and slag), β 0 is the intercept coefficient, β i is the linear term coefficient, β i i is the quadratic term coefficient, and β i j is the coefficient of the interaction term. For different experimental tests, the coefficients ( β 0 , β i , β i i , and β i j ) may differ.

3. Experimental Results

The experimental results (strength, flow) and CO2 emission calculation results are summarized in Table 5. Table 6 shows the regression coefficients of all the results. As shown in Table 6, the parameters of the equations consist of an intercept, linear term, quadratic terms, and interaction terms. Based on the results for flow, strength, and CO2 emissions, the coefficients of the equations were calibrated. The proposed equations can be validated by examining the p-value, lack of fit, and R2 of the regression. The coefficients of determination between the experimental and predicted values were higher than 0.95, which means that the proposed equations for regression of the results are reasonable. The p values of the regression equations were less than 0.0001, which suggests that these regression models are significant. In addition, the lack of fit for each result was not significant relative to the pure error.

3.1. Flow of Paste

As shown in Table 5, the overall trend of flow is that after adding SCM, the flow of the paste was reduced. The flow of M21 was the lowest, at 160 mm, mainly because M21 contains a high content of clay and slag. These two substances have high aluminum contents, which can reduce the flow. From the experimental results (shown in Figure 3a), the flow of a paste was regressed as follows:
f l o w = 213.82 + 1.75 * x 1 - 31 . 50 * x 2 - 10 . 28 * x 3 - 5 . 39 * ( x 1 ) 2 - 4 . 39 * ( x 2 ) 2 + 3 . 47 * ( x 3 ) 2 - 5 . 18 * x 1 * x 2 - 3 . 13 * x 1 * x 3 - 0 . 63 * x 2 * x 3
where x 1 , x 2 , and x 3 denote the contents of limestone, calcined clay, and slag, respectively. The predictions of flow agreed with the experimental results. Figure 3b shows the impact of each component on flow. Limestone has a negligible effect on flow. With increasing slag content, the flow rate decreases slightly. This is because of the higher surface area of slag than cement. However, as the content of calcined clay increases, the flow decreases significantly. This is because of the higher aluminum content in calcined clay than in cement. A higher aluminum content makes the mixture prone to forming ettringite, which can lower the flow [28]. In addition, the high surface area and specific structure of calcined clays also contribute to a lower slump. Likewise, Lin et al. [6] found that the addition of calcined hwangtoh clay can significantly reduce the slump of concrete.

3.2. Compressive Strength

Table 5 shows the overall trend of the 3-day strength (shown in Figure 4a): after adding SCM, the strength of the paste was reduced. This is mainly because of the dilution effect of SCM. M21 had the lowest 3-day strength, which is due to the higher SCM content in M21. In addition, M2 showed slightly higher strength than the control specimen M1, which is due to the limestone powder’s nucleation effect, which accelerates the early-age hydration rate of Portland cement and improves its strength. From the experimental results, the 3-day strength of a paste was regressed as follows:
3 days strength = 20.55 0.80 * x 1 - 2 . 51 * x 2 - 2 . 98 * x 3 - 0 . 63 * ( x 1 ) 2 - 1 . 45 * ( x 2 ) 2 + 0 . 34 * ( x 3 ) 2 + 0 . 65 * x 1 * x 2 + 0 . 17 * x 1 * x 3 + 1 . 08 * x 2 * x 3
As shown in Table 5, the overall trend of the 28-day strength was that after adding SCM, the strength of the paste was reduced. This is mainly because of the dilution effect of SCM. M21 had the lowest 28-day strength, which is due to the higher SCM content in M21. In addition, the strength of M2 was slightly lower than that of the standard specimen M1, which differs from the trend for the 3-day strength. This is because the dilution effect of limestone is the dominant factor in the later stage (28 days), while the nucleation effect is the dominant factor in the early stage (3 days). The 28-day strength of a paste (shown in Figure 4b) was determined as follows:
28 days strength = 44.05 2.62 * x 1 - 2 . 64 * x 2 - 4 . 91 * x 3 - 0 . 66 * ( x 1 ) 2 - 0 . 96 * ( x 2 ) 2 - 0 . 20 * ( x 3 ) 2 + 0 . 40 * x 1 * x 2 - 2 . 37 * x 1 * x 3 - 1 . 45 * x 2 * x 3
As shown in Figure 4c, at the curing age of 3 days, when the limestone content ranges from 0% to 5% (code changes from −1 to 0), the decrease in the strength is not significant. This is because limestone has a nucleation effect on cement hydration, can improve the hydration extent of cement, and can enhance the early-age strength of concrete. However, when the content of limestone powder further increases from 5% to 10% (code 0 to code +1), owing to the limestone’s dilution effect, the reduction in the strength becomes remarkable. In addition, as displayed in Figure 4d, at the age of 28 days, the strength decreases with increasing mineral admixture. This is due to the dilution effect and the lower reactivity of the mineral admixture compared with that of the cement. It should be noticed that in Figure 4d, the code +1 for limestone and calcined clay represents 10% and 20%, respectively. In other words, for limestone and calcined clay, when the x-axis represents the replacement ratio, the regression curves will be different. Figure 4e,f show the normalized strengths at the ages of 3 and 28 days, respectively. The paste’s normalized strength was calculated as the compressive strength ratio between hybrid paste and plain paste. The proportional reduction line corresponds to the dilution effect. At a curing age of 3 days, the normalized strength values are close to the dilution effect line, whereas, at the age of 28 days, they are much higher than the dilution effect line. This indicates the increasing reaction extent of the mineral admixtures from curing ages of 3 days to 28 days.

3.3. CO2 Emissions

Table 5 shows the overall trend of CO2 emissions: after adding SCM, CO2 emissions were reduced. This is mainly because of the dilution effect of SCM reducing the amount of cement used. M21 has the lowest CO2 emissions due to its higher SCM substitution. From the CO2 emission calculation results (shown in Figure 5a), the CO2 emissions of a paste were regressed based on a second-order polynomial as follows:
CO 2 = 771.62 54.26 * x 1 - 78 . 48 * x 2 - 142 . 45 * x 3 + 0 . 22 * ( x 1 ) 2 + 0 . 78 * ( x 2 ) 2 + 0 . 70 * ( x 3 ) 2 + 0 . 86 * x 1 * x 2 + 0 . 84 * x 1 * x 3 + 1 . 80 * x 2 * x 3
Figure 5b presents the effect of the components on CO2 emissions. As the individual replacement ratios of the binder components increase, the CO2 emissions linearly decrease. It should be noticed in Figure 5b that the code +1 for limestone and calcined clay represents 10% and 20%, respectively. In other words, for limestone and calcined clay, when the x-axis represents the replacement ratio, the regression curves will be different. Figure 5c shows the normalized CO2 emissions of the blended slurry. The normalized CO2 emissions are the ratios of the CO2 emissions of blended paste to those of control paste. Figure 5c shows that, for various mixtures, normalized CO2 emissions decrease linearly with increasing total substitution rate. Therefore, adding SCMs is an effective way to make low-CO2 concrete.

4. Optimal Design Results and Discussion

4.1. Multi-Objective Optimal Design

The optimized design had multiple goals: target strength and flow values and low CO2 emissions. Desirability functions were used for the optimization. Equation (8) shows that the expected value is dependent on the response value [29], with the value of the desirability function ranging from zero to one.
0 d i ( Y i ) 1
Here, Y i and d i are the response value and the desirability function, respectively. Unity and zero correspond to fully achieved and not achieved optimization objectives, respectively.
For multi-objective optimization, based on the individual desirability functions, the composite desirability function can be determined using the following equation [25,29]:
D = ( d 1 r 1 * d 2 r 2 * .... d n r n ) 1 / i = 1 i = n r i = ( i = 1 n d i r i ) 1 / i = 1 i = n r i
where D , n, and r are the composite desirability function, the total number of optimization objections, and the relative importance of each response, respectively.
Ecological aspects, such as low CO2 emissions, are an important aim of optimal design. When the minimum value is set as the aim of optimization, the desirability can be determined using the following equation [25]:
d i ( Y i ) = { 1 Y i L i ( U i Y i U i L i ) s L i Y i U i 0 Y i U i
where L and U denote the lower limit and upper limit of the response value, respectively, and S denotes the weight factor. When the value of S is equal to 1, Equation (10) is a linear equation. We choose S > 1 when closeness to the target value is more important; we choose 0 < S < 1 when it is less important. Equation (10) shows that desirability equals 1 when the value of the response is below the lower bound. Desirability equals 0 when the value of the response is above the upper limit.
As shown in Table 5, through the combination of the four binder components, different responses, such as flow and 28-day strength, can be achieved. This can be achieved by optimizing the design. When a range is set as the aim of optimization, the desirability can be determined using the following equation:
d i ( Y i ) = { 0 Y i < L i 1 L i Y i U i 0 Y i > U i
This equation shows that the desirability function is equal to 1 when the response is between the lower bound and upper bound, and it is 0 when the response is outside these bounds.
The optimization goals are listed in Table 7. The independent variable—the content of limestone, calcined clay, and slag—should be within the lower and upper limits. The variables of the response are as follows: (1) The 28-day strength should not be less than the target strength. In this study, the 28-day target strength values were set to 30, 35, 40, and 45 MPa. (2) The flow should be not less than the target flow (160 mm). (3) The CO2 emissions should be as low as possible for purposes of ecofriendliness. In this study, Design Expert software (version 12) was used for the optimization design [29]. The relative importance r and weighting factor S of all responses were set to 1 [26].
In summary, we consider four optimal design cases with different design strengths. Each design case considers basic requirements (strength and workability) and an ecological factor (CO2 emissions). Multi-objective optimization was implemented based on a composite desirability function, which was calculated using the responses and individual desirability.

4.2. Results of Optimal Design

The results of the design case combinations are identified and summarized in Table 8. Mix-30, Mix-35, Mix-40, and Mix-45 have 28-day strengths of 30, 35, 40, and 45 MPa, respectively. Table 9 shows that the values of strength and flow for Mix-30, Mix-35, Mix-40, and Mix-45 meet the design requirements.
Figure 6, Figure 7, Figure 8 and Figure 9 show the independent variables (limestone, calcined clay, and slag) and responses (strength, flow, and CO2 emissions) of Mix-30 to Mix-45, respectively. In Figure 6a, Figure 7a, Figure 8a, and Figure 9a, the first row represents limestone, clay, and slag contents, and the second row represents the results of multi-objective optimization (such as flow, strength, and CO2 emissions). The optimized flow and strength meet the constraints of the target range, and the optimized CO2 emissions are the minimum value. From the minimum value of 501.59 to the maximum value of 1052.04, the CO2 optimization decreases with the falling line. This means that the closer the CO2 emissions are to the minimum value of 501.59, the higher the satisfaction degree of the optimization; on the contrary, a lower optimization satisfaction degree occurs when the CO2 emissions are closer to the maximum value of 1052.04. Figure 6a shows that the limestone, calcined clay, and slag contents of Mix-30 are 8.81%, 20%, and 30%, respectively. Solid red circles in the first row of Figure 6a show the component values of limestone, clay, and slag. The content of the mineral admixtures is close to the upper limit. Solid blue circles in the second row of Figure 6a show the response values for strength, flow, and CO2 emissions. The strength and flow rate both meet the design requirements. The CO2 emissions are close to a minimum. Figure 6b shows the desirability of the flow, 28-day strength, and CO2 emissions, as well as the composite desirability. The desirability is 1 for both the 28-day strength and flow. The composite desirability value for Mix-30 is 0.977.
Figure 7 shows the desirability of Mix-35. The limestone, calcined clay, and slag contents of Mix-35 are 3.75%, 19.98%, and 30.00%, respectively (see the first row in Figure 7a). Since the replacement rate of mineral admixture in Mix-35 is smaller than that in Mix-30, Mix-35 has higher CO2 emissions than Mix-30. The desirability is 1 for both the strength and flow, but the CO2 emissions are less desirable than those for Mix-30. This is because as the strength of the concrete increases, its carbon dioxide emissions also increase, resulting in a decrease in the desirability function corresponding to CO2 emissions. In addition, Mix-35 has a lower composite desirability than Mix-30 (as shown in Figure 6b and Figure 7b).
The desirability values of Mix-40 and Mix-45 are shown in Figure 8 and Figure 9, respectively. Compared to Mix-30, Mix-35, and Mix-40, the total substitution rate of mineral admixture in Mix-45 is much lower. Therefore, Mix-45 has lower CO2 emissions than the other cases (as shown in Figure 8b). Consequently, the composite desirability of CO2 emissions for Mix-45 is also lower than those for the other cases.

4.3. Optimized Design of CO2 Emissions Based on 1 kg Binder

In the optimal design method shown in Section 4.2, the CO2 emission is based on each cubic meter of cement paste. In actual engineering, CO2 is often calculated based on each kilogram of binder. Based on the mix ratio and the CO2 emissions of binder components in Table 4, the CO2 emissions per kilogram of binder can be calculated (shown in Table 10). Moreover, the CO2 emission of 1 kg binder can be determined using a linear equation as follows:
CO 2   of   binder = 0.86 0.00852 x 1 - 0 . 0059 * x 2 - 0 . 0077 * x 3
Following a similar method in Section 4.2, we conducted optimized designs for different strength levels, and the calculation results are shown in Figure 10. The combination of the mix ratio and performance of optimized designs are shown in Table 11 and Table 12, respectively. According to these calculation results, we can find: First, as shown in Table 11, as the design strength increases, the cement content increases. As shown in Table 12, as the design strength increases, the CO2 emissions also increase. These trends are consistent with that in Section 4.2. Second, for Mix-30, Mix-35, Mix-40, and Mix-45, the overall satisfaction degree is 0.977, 0.877, 0.757, and 0.610, respectively. Comparing the overall satisfaction degree results in Section 4.2 and the satisfaction degree in this section, we can find that the satisfaction degree values are similar for CO2 emissions per cubic meter of paste and CO2 emissions per kilogram of binder. Overall, the design method proposed in this article has certain versatility and can be suitable for different optimization objectives.

4.4. Discussion of the Optimal Design

In traditional design processes, concrete mix proportional design considers only strength and workability [17,30,31]. However, with the development of concrete techniques, customers demand not only strength and workability but also better ecological performance, such as with regard to CO2 emissions [32,33]. The model presented in this study considers more objectives than the conventional mix design approaches, which is important for performance-based design.
In traditional response surface optimization design, all optimization goals should be measured based on experimental results. However, there have been some new developments, and some researchers have adopted the response surface method to optimize concrete materials. In prior studies, the mechanical properties of the materials were measured experimentally, and the cost and CO2 emissions of concrete materials were calculated based on the mix ratio [33,34]. Iman and Camoes [34] measured the strength and workability of ultra-high-performance concrete (UHPC), calculated the cost and CO2 emissions of UHPC using concrete components, and produced cost-efficient or CO2-efficient optimal designs using the response surface method. Similarly, Mohammad and Ozgur [33] measured the strength of UHPC, calculated the cost of UHPC, and determined optimal designs with a low cost. The rationality of these studies was verified by experiments. Inspired by these studies, we adopted a similar method. The strength and flow were measured experimentally, and the CO2 emissions were calculated using a formula.
In addition, in the experimental design of this paper, the water used was distilled water. More recently, wastewater has also begun to be used in concrete materials. It is necessary to pay attention to the compositional differences between wastewater and distilled water and the resulting impact on the physical and chemical properties of concrete. The response surface design method proposed in this paper is suitable not only for distilled water concrete but also for wastewater concrete.

5. Conclusions

This study presents experimental works and multi-objective optimization design regarding a quaternary hybrid cement containing calcined clay, slag, and limestone. A total of 21 mixtures were prepared, of which 17 were BBD samples and 4 were additional samples. The flow, compressive strength (at 3 and 28 days), and CO2 emissions of the various mixtures were determined. The following conclusions were obtained based on the test results:
(1)
Flow, strength, and CO2 emissions decrease with increasing mineral admixture content. The flow decreases significantly with increasing calcined clay content. At 3 days of age, the normalized strength value is close to the dilution effect line, but at 28 days of age, the normalized strength value is much higher than the dilution effect line. Normalized CO2 emissions decrease linearly as the substitution rate increases.
(2)
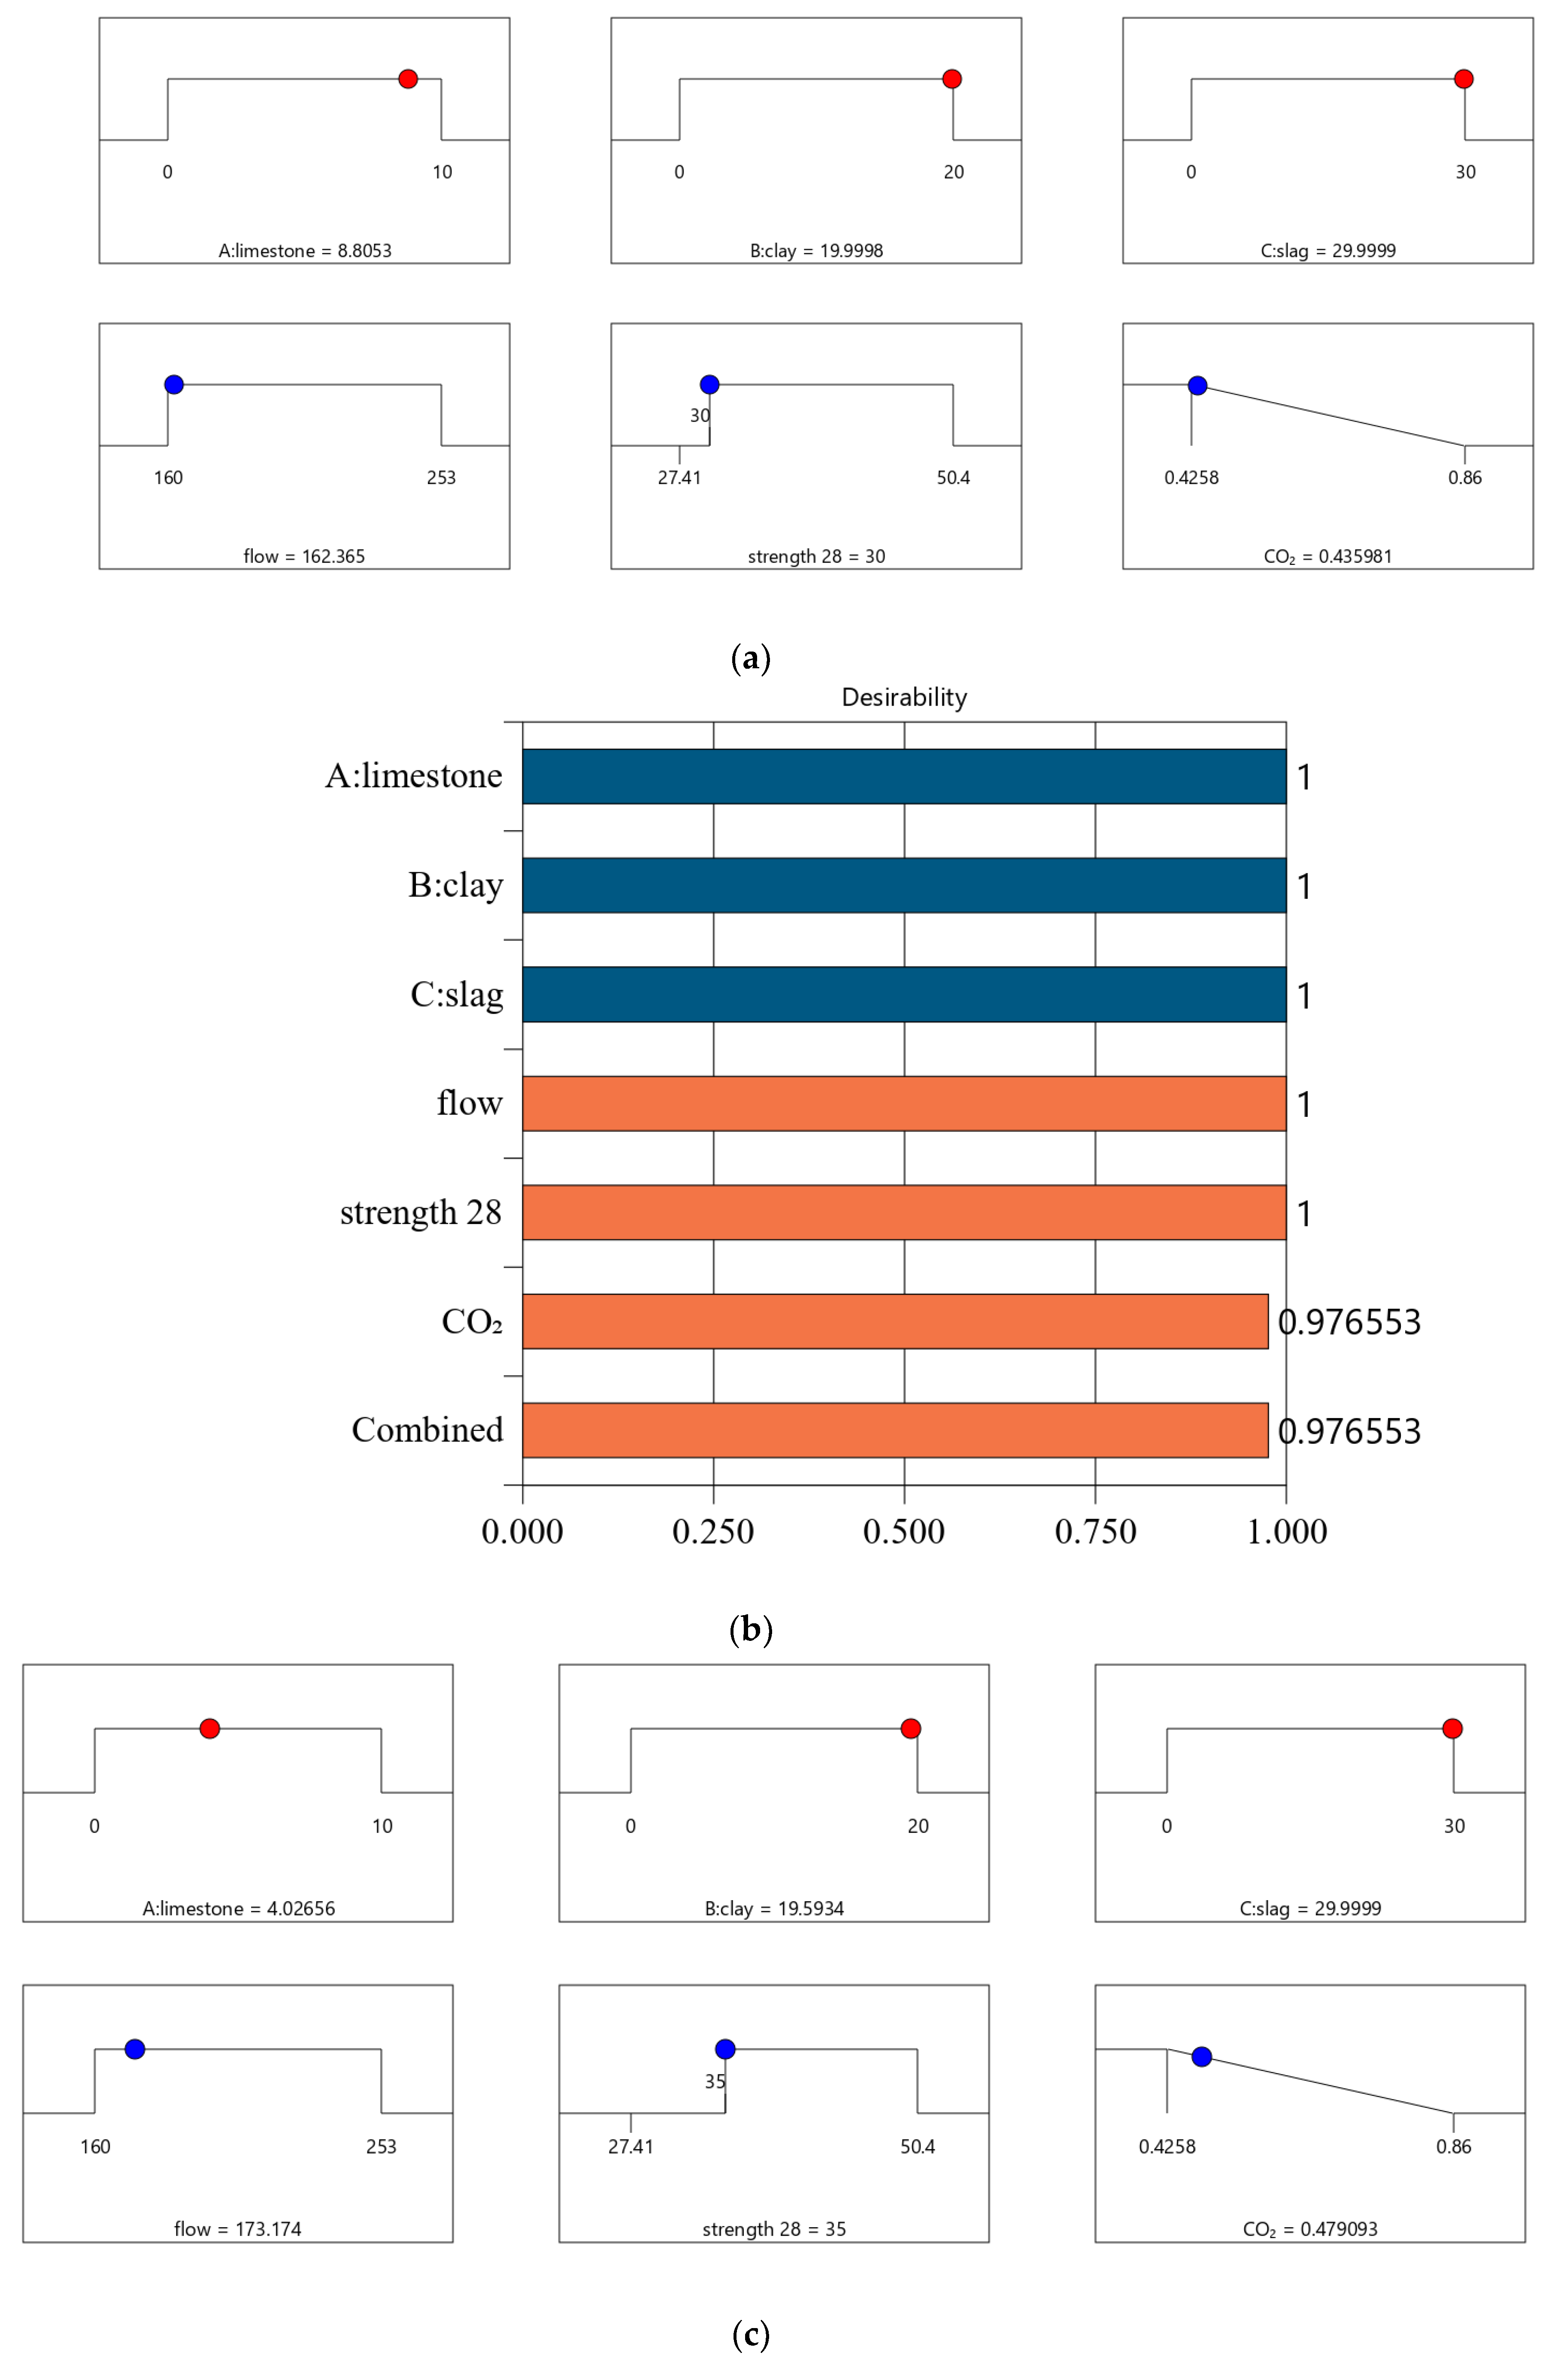
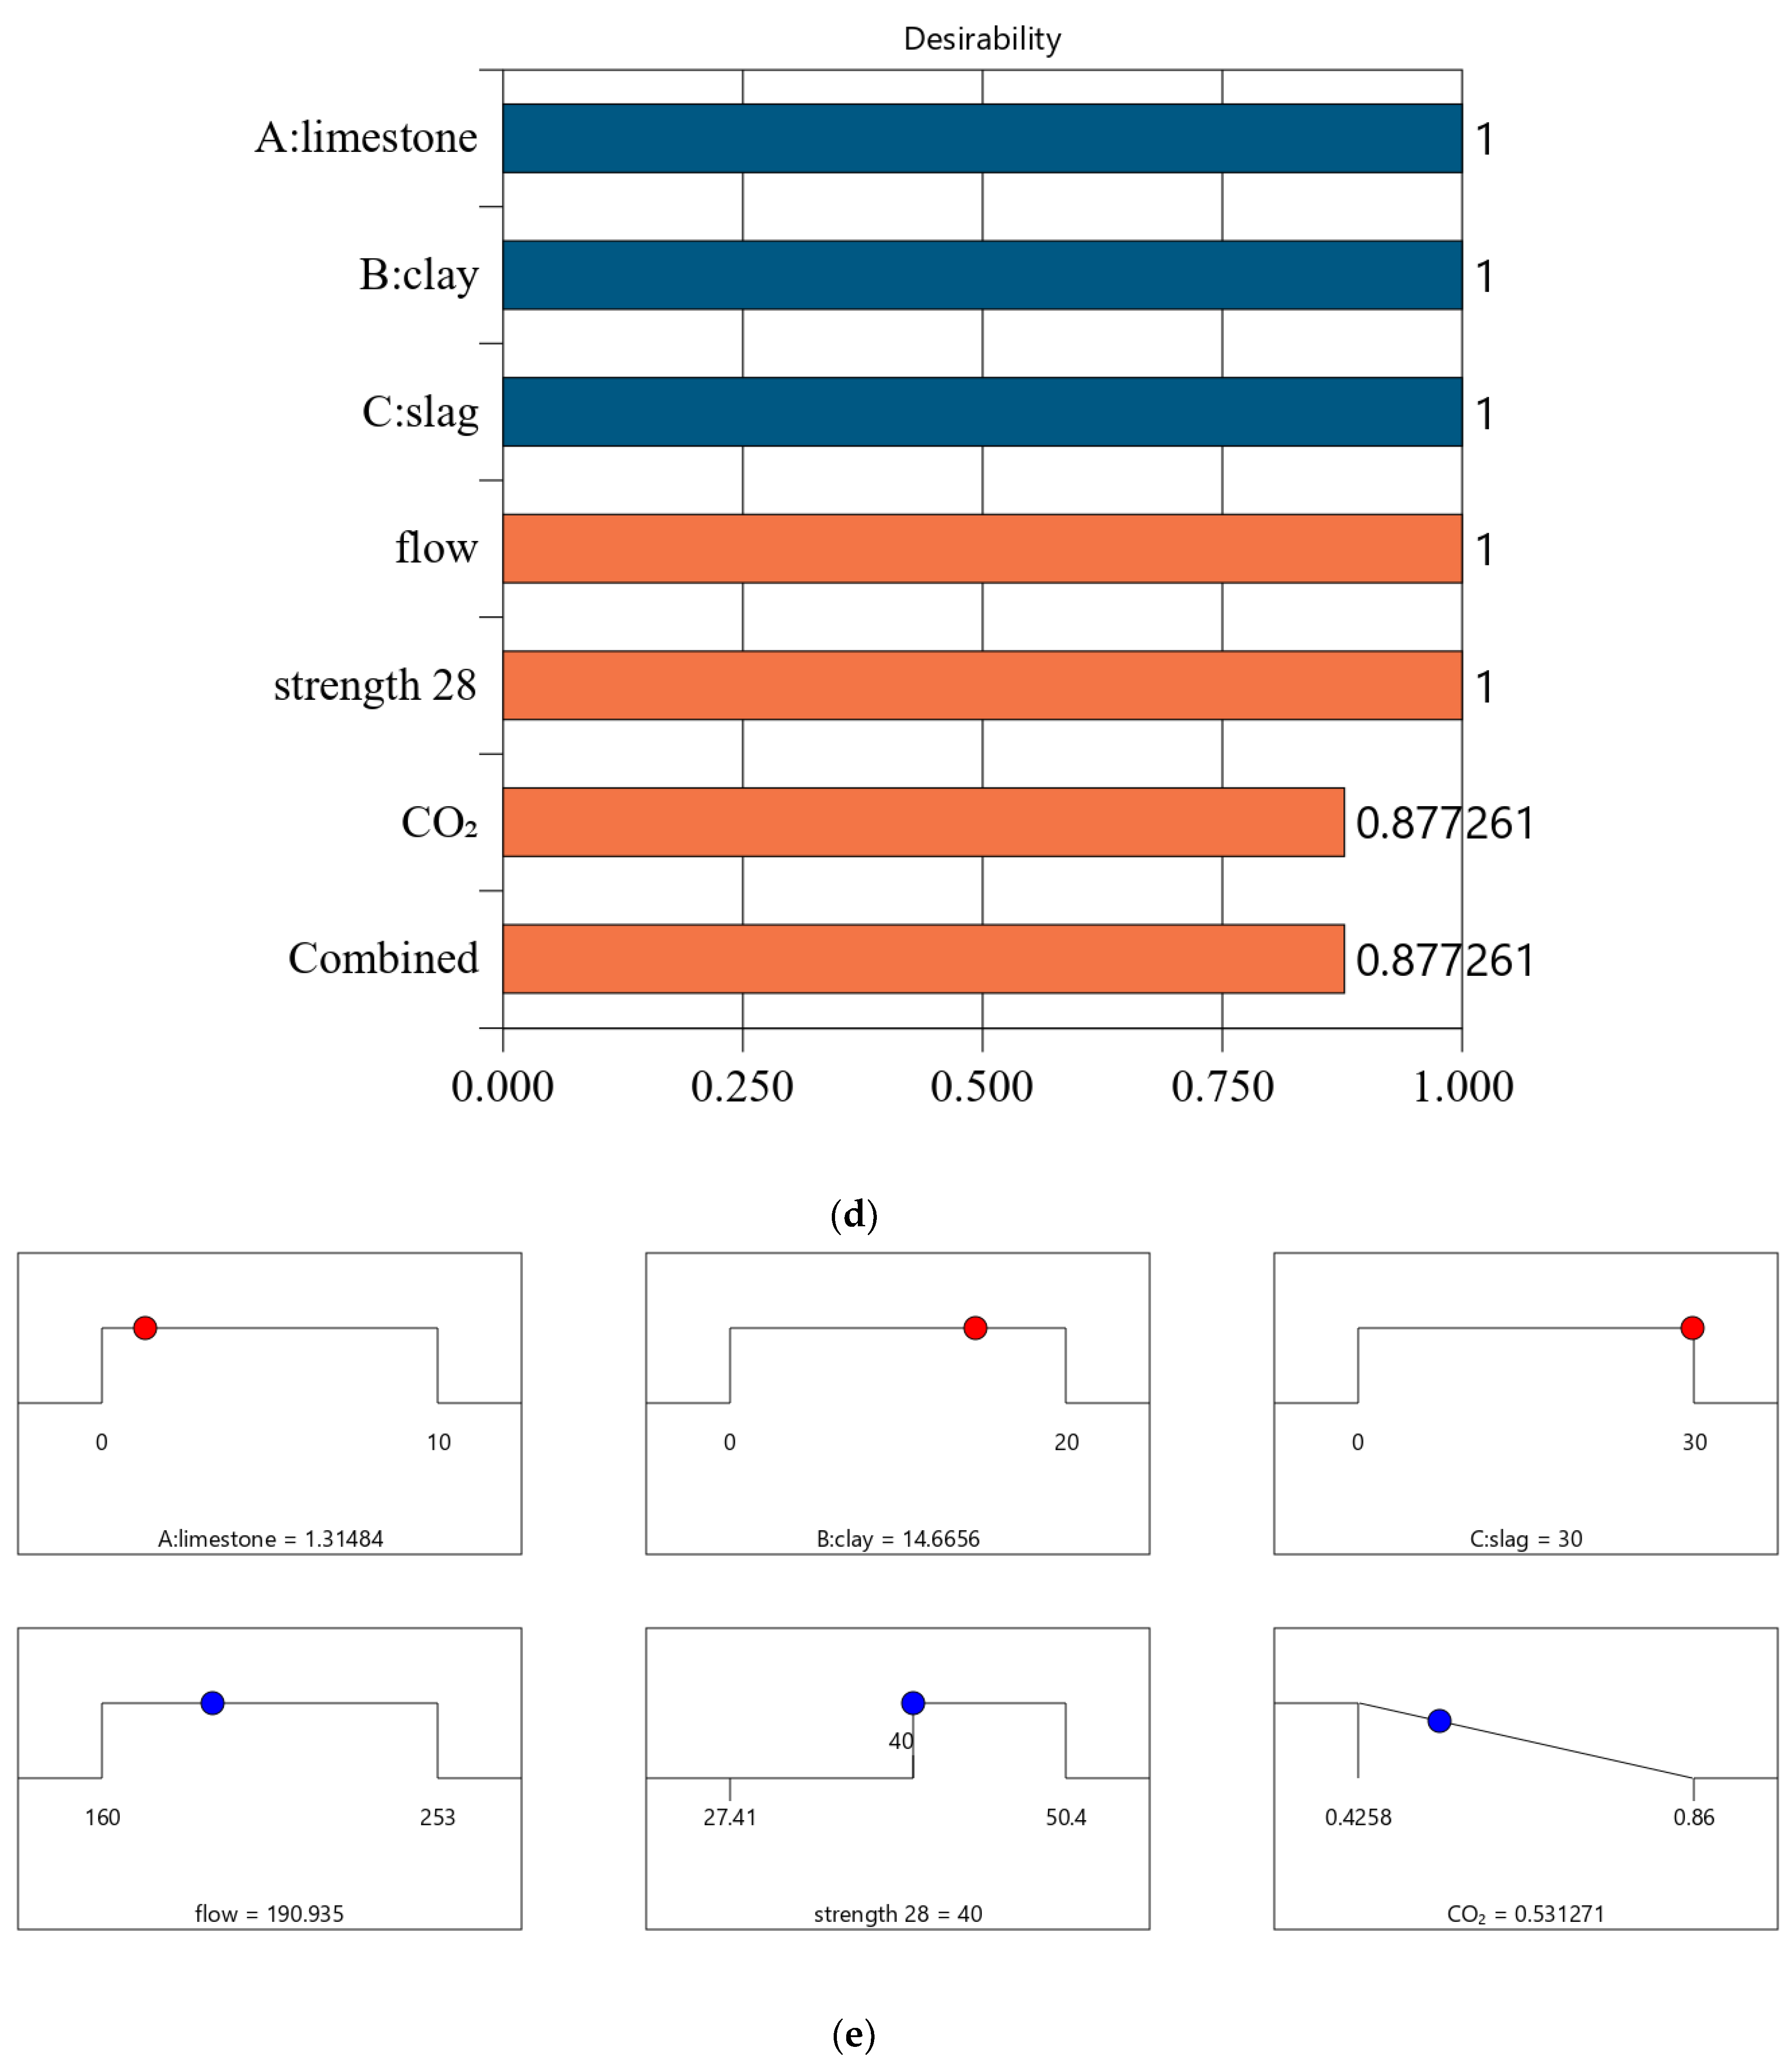
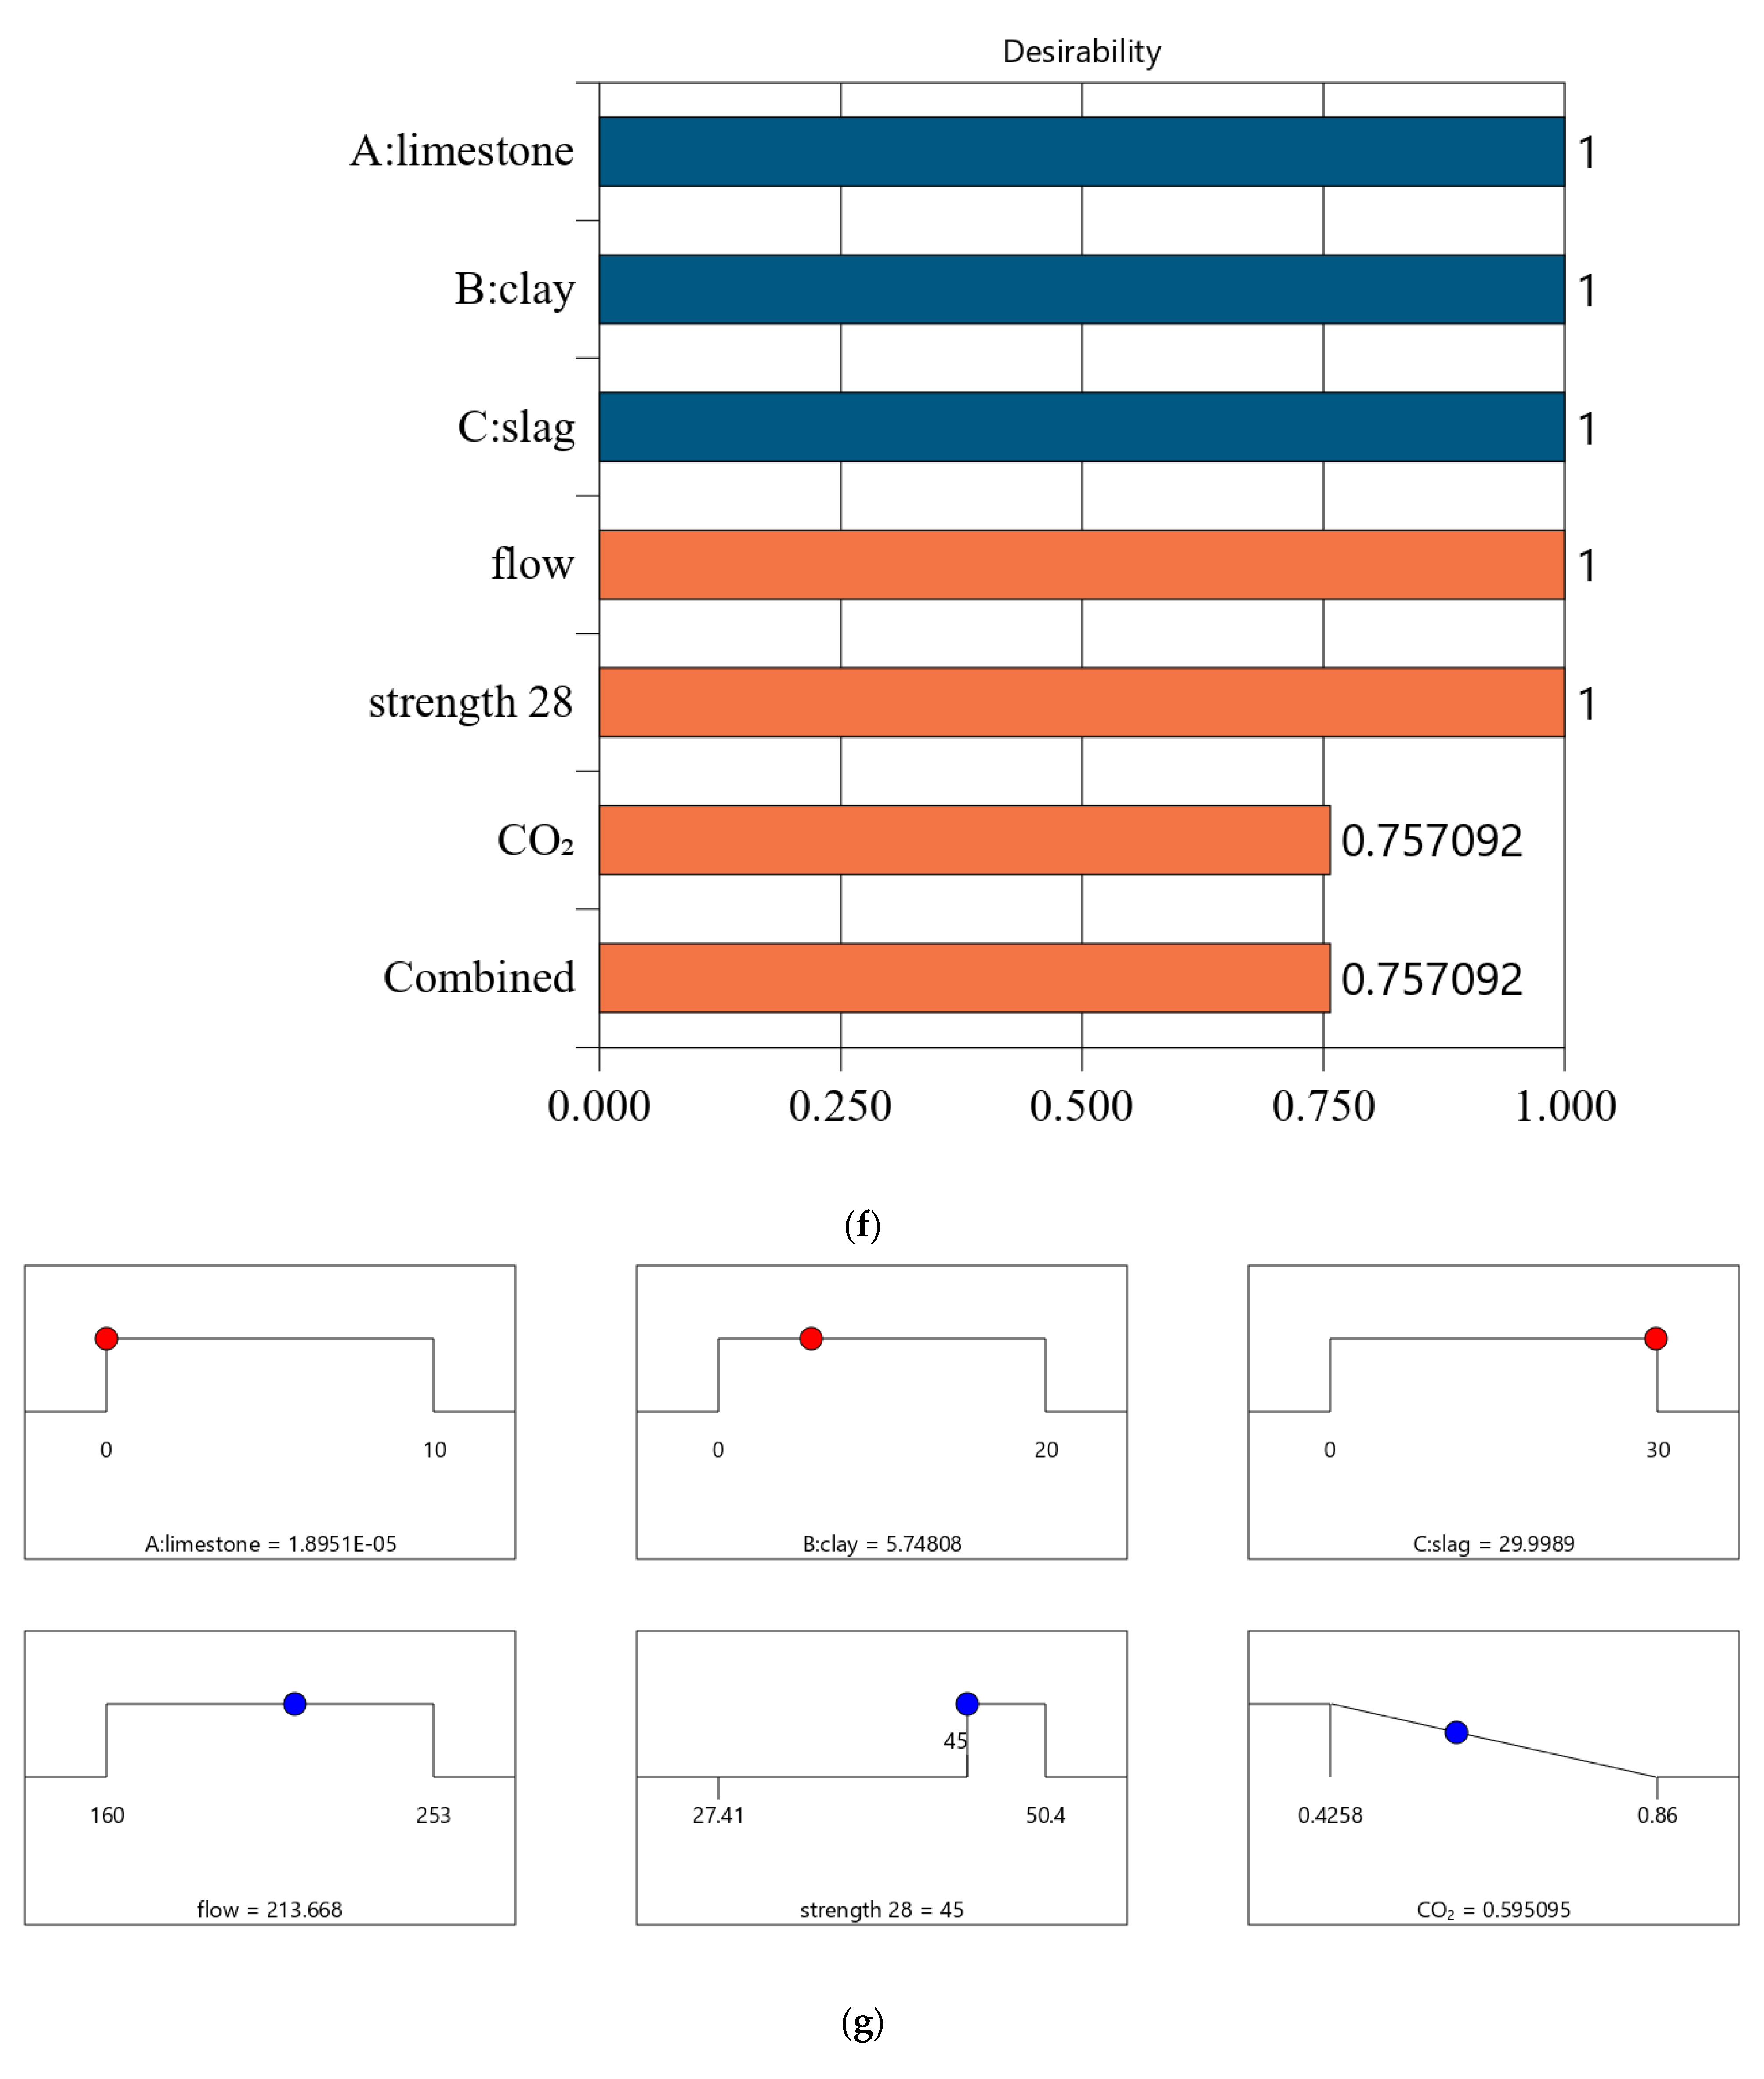
Four design cases (Mix-30, Mix-35, Mix-40, and Mix-45) with different 28-day design strengths (30, 35, 40, and 45 MPa) were considered. Each design case considered various aspects, namely basic requirements (strength and workability) and ecological aspects (CO2 emissions). Multi-objective optimization was implemented based on a composite desirability function that was calculated using the individual responses and desirability for each objective.
(3)
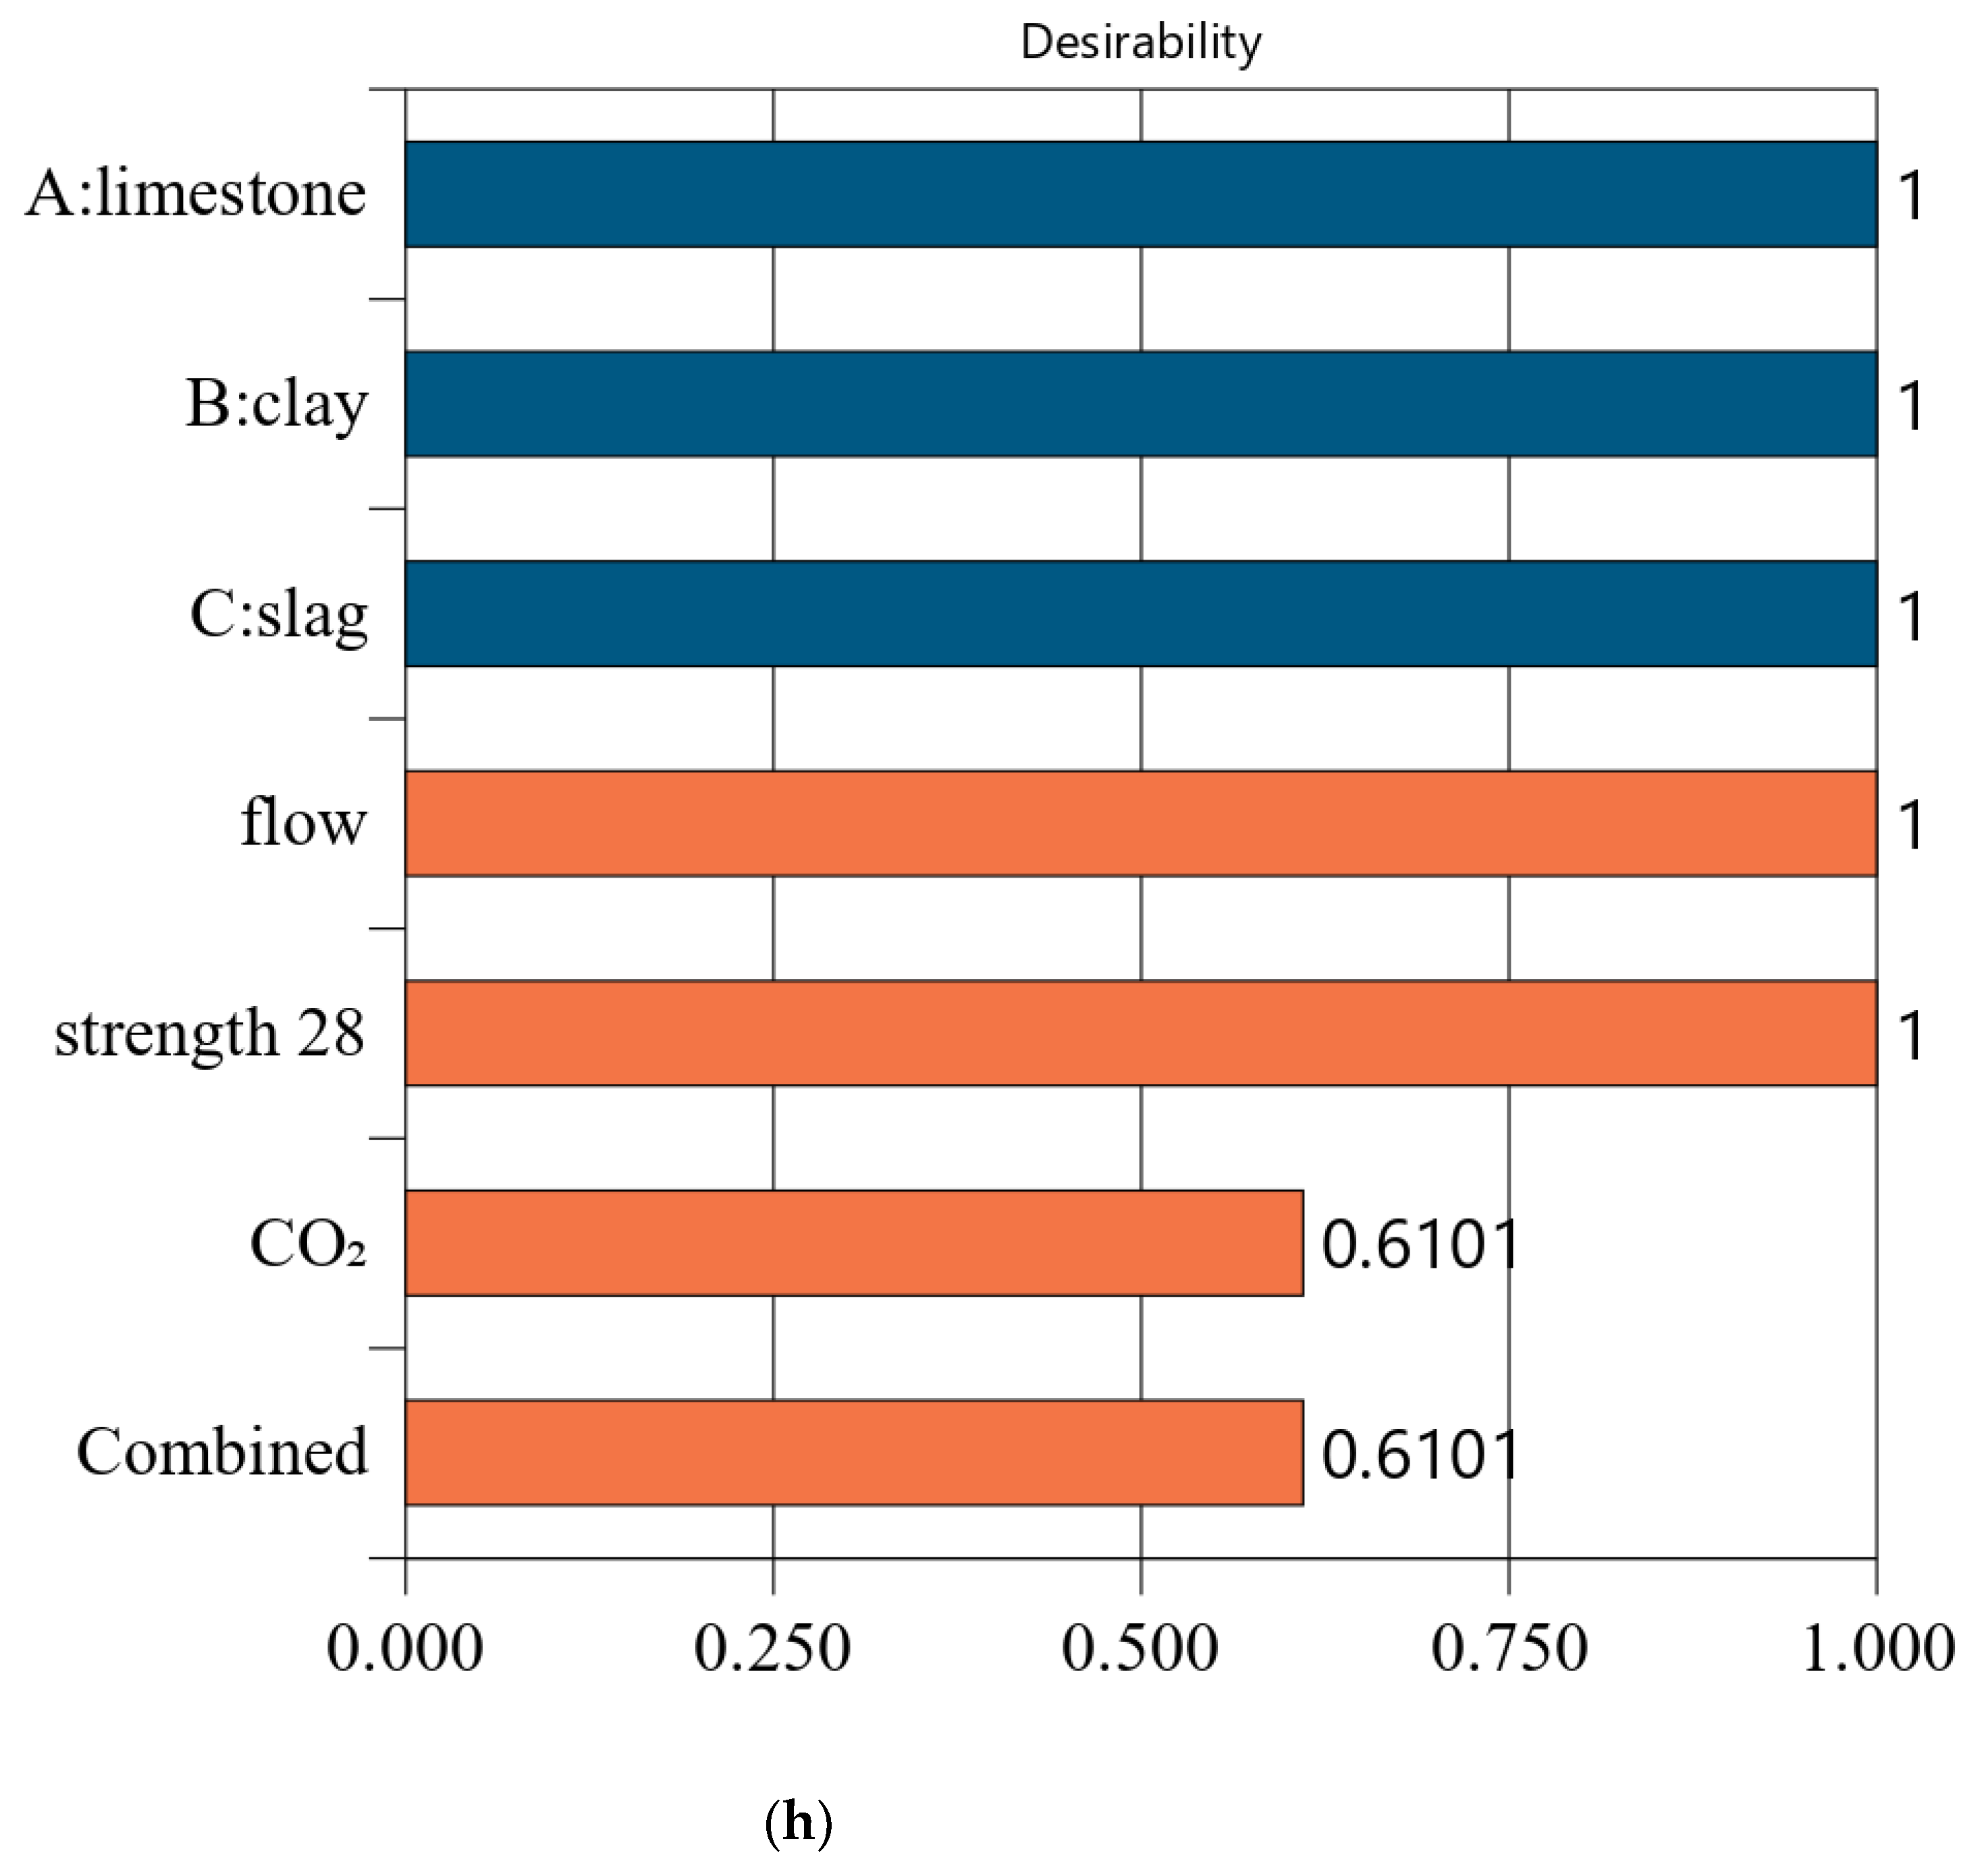
From Mix-30 to Mix-45, as the content of supplementary cementing materials decreased, CO2 emissions increased. Because the aim of CO2 emissions optimization is to reach low CO2 emissions, increasing CO2 emissions lowered the individual desirability of the cases. In addition, the individual desirability values of strength and flow were 1 for each case. Consequently, the composite desirability decreased from 0.977 to 0.609 as the design strength increased from 30 to 45 MPa. The performance trend of the best combination was consistent with the experimental results.
(4)
The results presented in this paper can be used to guide a general method for designing low-carbon concrete. Adopting this method requires two steps. The first step is to produce an experimental design using the response surface method, conduct experimental research on the strength and fluidity, and calculate the CO2 emissions. The second step is to optimize the design according to the required strength and flow level and choose the right combination of low-CO2 cementitious materials.

Author Contributions

Data curation, Y.H. and S.O.; Investigation, S.O., K.-B.P. and L.-Y.M.; Project administration, R.-S.L., K.-B.P. and L.-Y.M.; Resources, X.-Y.W., Y.L., Y.H. and H.-M.Y.; Supervision, X.-Y.W. and H.-M.Y.; Writing—original draft, R.-S.L., Y.L., Y.H. and B.Y.; Writing—review and editing, X.-Y.W. and B.Y. All authors have read and agreed to the published version of the manuscript.

Funding

This research was supported by the Yunnan Fundamental Research Projects (grant No. 202201BE070001-010 and 202301AU070182) and by the National Research Foundation of Korea (NRF) grant funded by the Korean government (MSIT) (No. RS-2023-00208720 and No. 2022R1F1A1073440). This work was also supported by the Nuclear Safety Research Program through the Korea Foundation Of Nuclear Safety (KoFONS) using the financial resources granted by the Nuclear Safety and Security Commission (NSSC) of the Republic of Korea (No. 1075001384).

Institutional Review Board Statement

Not applicable.

Informed Consent Statement

Not applicable.

Data Availability Statement

The data presented in this study are available in the respective references.

Conflicts of Interest

The authors declare no conflict of interest.

References

  1. Chen, T.; Li, L.; Gao, X.; Guo, M.; Qin, L. New insights into the role of early accelerated carbonation on the calcium leaching behavior of cement paste. Cem. Concr. Compos. 2023, 140, 105103. [Google Scholar] [CrossRef]
  2. Li, L.; Chen, T.; Gao, X. Effects of superimposed carbonation synergy on BOFS cement-based materials. Cem. Concr. Compos. 2023, 138, 105008. [Google Scholar] [CrossRef]
  3. Kang, S.-H.; Jeong, Y.; Tan, K.H.; Moon, J. High-volume use of limestone in ultra-high performance fiber-reinforced concrete for reducing cement content and autogenous shrinkage. Constr. Build. Mater. 2019, 213, 292–305. [Google Scholar] [CrossRef]
  4. Li, C.; Jiang, L.; Li, S. Effect of limestone powder addition on threshold chloride concentration for steel corrosion in reinforced concrete. Cem. Concr. Res. 2020, 131, 106018. [Google Scholar] [CrossRef]
  5. Tironi, A.; Castellano, C.C.; Bonavetti, V.L.; Trezza, M.A.; Scian, A.N.; Irassar, E.F. Kaolinitic calcined clays—Portland cement system: Hydration and properties. Constr. Build. Mater. 2014, 64, 215–221. [Google Scholar] [CrossRef]
  6. Lin, R.S.; Wang, X.Y.; Lee, H.S.; Cho, H.K. Hydration and Microstructure of Cement Pastes with Calcined Hwangtoh Clay. Materials 2019, 12, 458. [Google Scholar] [CrossRef]
  7. Kocaba, V.; Gallucci, E.; Scrivener, K.L. Methods for determination of degree of reaction of slag in blended cement pastes. Cem. Concr. Res. 2012, 42, 511–525. [Google Scholar] [CrossRef]
  8. Arora, A.; Sant, G.; Neithalath, N. Ternary blends containing slag and interground/blended limestone: Hydration, strength, and pore structure. Constr. Build. Mater. 2016, 102, 113–124. [Google Scholar] [CrossRef]
  9. Ramezanianpour, A.M.; Hooton, R.D. A study on hydration, compressive strength, and porosity of Portland-limestone cement mixes containing SCMs. Cem. Concr. Compos. 2014, 51, 1–13. [Google Scholar] [CrossRef]
  10. Dhandapani, Y.; Santhanam, M. Assessment of pore structure evolution in the limestone calcined clay cementitious system and its implications for performance. Cem. Concr. Compos. 2017, 84, 36–47. [Google Scholar] [CrossRef]
  11. Dhandapani, Y.; Sakthivel, T.; Santhanam, M.; Gettu, R.; Pillai, R.G. Mechanical properties and durability performance of concretes with Limestone Calcined Clay Cement (LC3). Cem. Concr. Res. 2018, 107, 136–151. [Google Scholar] [CrossRef]
  12. Pillai, R.G.; Gettu, R.; Santhanam, M.; Rengaraju, S.; Dhandapani, Y.; Rathnarajan, S.; Basavaraj, A.S. Service life and life cycle assessment of reinforced concrete systems with limestone calcined clay cement (LC3). Cem. Concr. Res. 2019, 118, 111–119. [Google Scholar] [CrossRef]
  13. Mo, Z.; Gao, X.; Su, A. Mechanical performances and microstructures of metakaolin contained UHPC matrix under steam curing conditions. Constr. Build. Mater. 2021, 268, 121112. [Google Scholar] [CrossRef]
  14. Qin, L.; Gao, X.; Su, A.; Li, Q. Effect of carbonation curing on sulfate resistance of cement-coal gangue paste. J. Clean. Prod. 2021, 278, 123897. [Google Scholar] [CrossRef]
  15. Kolani, B.; Buffo-Lacarrière, L.; Sellier, A.; Escadeillas, G.; Boutillon, L.; Linger, L. Hydration of slag-blended cements. Cem. Concr. Compos. 2012, 34, 1009–1018. [Google Scholar] [CrossRef]
  16. Wang, X.-Y. Analysis of Hydration-Mechanical-Durability Properties of Metakaolin Blended Concrete. Appl. Sci. 2017, 7, 1087. [Google Scholar] [CrossRef]
  17. Wang, X.Y. Modeling of Hydration, Compressive Strength, and Carbonation of Portland-Limestone Cement (PLC) Concrete. Materials 2017, 10, 115. [Google Scholar] [CrossRef]
  18. Kunther, W.; Dai, Z.; Skibsted, J. Thermodynamic modeling of hydrated white Portland cement–metakaolin–limestone blends utilizing hydration kinetics from 29Si MAS NMR spectroscopy. Cem. Concr. Res. 2016, 86, 29–41. [Google Scholar] [CrossRef]
  19. Wang, X.-Y.; Luan, Y. Modeling of Hydration, Strength Development, and Optimum Combinations of Cement-Slag-Limestone Ternary Concrete. Int. J. Concr. Struct. Mater. 2018, 12, 12. [Google Scholar] [CrossRef]
  20. Carrasco, M.F.; Menéndez, G.; Bonavetti, V.; Irassar, E.F. Strength optimization of “tailor-made cement” with limestone filler and blast furnace slag. Cem. Concr. Res. 2005, 35, 1324–1331. [Google Scholar] [CrossRef]
  21. Yang, P.; Dhandapani, Y.; Santhanam, M.; Neithalath, N. Simulation of chloride diffusion in fly ash and limestone-calcined clay cement (LC3) concretes and the influence of damage on service-life. Cem. Concr. Res. 2020, 130, 106010. [Google Scholar] [CrossRef]
  22. Avet, F.; Li, X.; Scrivener, K. Determination of the amount of reacted metakaolin in calcined clay blends. Cem. Concr. Res. 2018, 106, 40–48. [Google Scholar] [CrossRef]
  23. ASTM C150; Standard Specification for Portland Cement. ASTM International: West Conshohocken, PA, USA, 2007.
  24. ASTM. Standard Test Method for Compressive Strength of Hydraulic-Cement Mortars (Using Portions of Prisms Broken in Flexure); ASTM International: West Conshohocken, PA, USA, 2018. [Google Scholar]
  25. Myers, R.H.; Montgomery, D.C.; Anderson-Cook, C.M. Response Surface Methodology: Process and Product Optimization Using Designed Experiments; John Wiley & Sons: Hoboken, NJ, USA, 2016. [Google Scholar]
  26. Li, Z.; Lu, D.; Gao, X. Multi-objective optimization of gap-graded cement paste blended with supplementary cementitious materials using response surface methodology. Constr. Build. Mater. 2020, 248, 118552. [Google Scholar] [CrossRef]
  27. Miller, S.A.; John, V.M.; Pacca, S.A.; Horvath, A. Carbon dioxide reduction potential in the global cement industry by 2050. Cem. Concr. Res. 2018, 114, 115–124. [Google Scholar] [CrossRef]
  28. Jeong, Y.; Kang, S.-H.; Kim, M.O.; Moon, J. Acceleration of cement hydration from supplementary cementitious materials: Performance comparison between silica fume and hydrophobic silica. Cem. Concr. Compos. 2020, 112, 103688. [Google Scholar] [CrossRef]
  29. Vaughn, N. Design-Expert® Software, 55; C.J.S.-E. Polnaszek, Inc.: Minneapolis, MN, USA, 2007. [Google Scholar]
  30. Yeh, I.C. Computer-aided design for optimum concrete mixtures. Cem. Concr. Compos. 2007, 29, 193–202. [Google Scholar] [CrossRef]
  31. Kim, T.; Tae, S.; Roh, S. Assessment of the CO2 emission and cost reduction performance of a low-carbon-emission concrete mix design using an optimal mix design system. Renew. Sustain. Energy Rev. 2013, 25, 729–741. [Google Scholar] [CrossRef]
  32. Yang, K.-H.; Jung, Y.-B.; Cho, M.-S.; Tae, S.-H. Effect of supplementary cementitious materials on reduction of CO2 emissions from concrete. J. Clean. Prod. 2015, 103, 774–783. [Google Scholar] [CrossRef]
  33. Mosaberpanah, M.A.; Eren, O. CO2-full factorial optimization of an ultra-high performance concrete mix design. Eur. J. Environ. Civ. Eng. 2016, 22, 450–463. [Google Scholar] [CrossRef]
  34. Ferdosian, I.; Camoes, A. Eco-efficient ultra-high performance concrete development by means of response surface methodology. Cem. Concr. Compos. 2017, 84, 146–156. [Google Scholar] [CrossRef]
Figure 1. XRD analysis of calcined clay and raw clay.
Materials 16 06385 g001
Figure 2. Combination design of 21 specimens (17 specimens from BBD (red points) and 4 additional specimens (purple points)).
Materials 16 06385 g002
Figure 3. Results of flow analysis. (a) Experimental versus predicted results. (b) Perturbations of flow.
Materials 16 06385 g003
Figure 4. Results of compressive strength analysis. (a) Experimental versus predicted results of 3-day strength. (b) Experimental versus predicted results of 28-day strength. (c) Perturbations of variables of 3-day strength. (d) Perturbations of variables of 28-day strength. (e) Normalized 3-day strength. (f) Normalized 28-day strength.
Materials 16 06385 g004aMaterials 16 06385 g004b
Figure 5. Results of CO2 emissions analysis. (a) Calculated versus regressed results of CO2 emissions. (b) Perturbations of variables of CO2 emissions. (c) CO2 emissions versus replacement ratio.
Materials 16 06385 g005aMaterials 16 06385 g005b
Figure 6. Properties of Mix-30. (a) Independent variables and responses of Mix-30. (b) Desirability of Mix-30.
Materials 16 06385 g006aMaterials 16 06385 g006b
Figure 7. Properties of Mix-35. (a) Independent variables and responses of Mix-35. (b) Desirability of Mix-35.
Materials 16 06385 g007aMaterials 16 06385 g007b
Figure 8. Properties of Mix-40. (a) Independent variables and responses of Mix-40. (b) Desirability of Mix-40.
Materials 16 06385 g008aMaterials 16 06385 g008b
Figure 9. Properties of Mix-45. (a) Independent variables and responses of Mix-45. (b) Desirability of Mix-45.
Materials 16 06385 g009aMaterials 16 06385 g009b
Figure 10. Results of optimal design for CO2 emission of 1 kg binder. (a) Independent variables and responses of Mix-30 (CO2 emission of 1 kg binder). (b) Desirability of Mix-30 (CO2 emission of 1 kg binder). (c) Independent variables and responses of Mix-35 (CO2 emission of 1 kg binder). (d) Desirability of Mix-35 (CO2 emission of 1 kg binder). (e) Independent variables and responses of Mix-40 (CO2 emission of 1 kg binder). (f) Desirability of Mix-40(CO2 emission of 1 kg binder). (g) Independent variables and responses of Mix-45 (CO2 emission of 1 kg binder). (h) Desirability of Mix-45 (CO2 emission of 1 kg binder).
Materials 16 06385 g010aMaterials 16 06385 g010bMaterials 16 06385 g010cMaterials 16 06385 g010d
Table 1. Binders’ chemical compositions.
Cement (%)Limestone (%)Calcined Clay (%)Slag (%)
SiO222.11.863.2732.2
Al2O35.230.1925.3615.7
Fe2O33.09-7.550.65
CaO62.4154.140.4538.9
MgO2.621.410.667.08
Na2O0.09--0.30
TiO20.21-0.860.43
SO32.32-0.122.65
LOI a1.5641.520.941.25
Density (g/cm3)3.152.602.502.90
a Loss on ignition.
Table 2. Replacement ranges of mineral admixtures.
ComponentNameMinimumMaximum (%)Low-Coded High-Coded
ALimestone0.000010.00−1 ↔ 0.00+1 ↔ 10.00
BClay0.000020.00−1 ↔ 0.00+1 ↔ 20.00
CSlag0.000030.00−1 ↔ 0.00+1 ↔ 30.00
Table 3. BBD of hybrid binders.
RunsCoded ValuesMass (%)
ABCOPCLimestone (A)Clay (B)Slag (C)
M1−1−1−1100000
M20−1−195500
M3−10−1900100
M4−1−10850015
M500−1855100
M610−18010100
M71−107510015
M801−1755200
M90007051015
M100007051015
M110007051015
M120007051015
M130007051015
M1411−17010200
M150−11655030
M16−1106502015
M17−1016001030
M1811055102015
M1910150101030
M200114552030
M2111140102030
Table 4. CO2 emissions of individual components of binders (kg/kg) [27].
CementLimestone PowderCalcined ClaySlagWater
0.860.0080.270.090.0001
Table 5. Test results and CO2 emissions.
RunsStrength at 3 Days
(MPa)
Strength at 28 Days
(MPa)
Flow
(mm)
CO2 Emissions
(kg/m3)
Mean Standard Deviation Mean Standard Deviation Mean Standard Deviation Mean
M125.550.93 50.401.04 247.503.39 1052.04
M227.211.00 49.261.05 253.004.75 995.84
M325.821.02 47.830.82 210.004.89 970.07
M422.850.88 46.420.94 220.504.47 906.20
M522.870.74 48.220.92 225.004.60 914.76
M622.000.74 47.291.00 228.004.57 859.89
M719.160.78 41.561.02 241.003.99 795.99
M817.740.98 45.771.04 195.004.43 835.28
M921.150.78 44.990.86 213.003.62 771.63
M1021.530.97 44.141.01 210.104.51 771.63
M1119.840.78 44.741.00 218.123.39 771.63
M1220.251.01 43.040.82 217.253.80 771.63
M1320.380.81 44.090.80 216.303.41 771.63
M1418.960.76 46.870.94 185.003.50 781.27
M1518.130.78 42.521.12 236.504.71 707.33
M1616.170.90 42.590.88 179.004.49 747.55
M1717.310.85 43.430.98 206.503.86 683.52
M1815.300.81 38.340.84 170.004.92 640.75
M1916.530.98 33.961.04 200.003.39 576.70
M2015.320.89 33.790.85 164.004.07 553.97
M2114.630.88 27.410.95 160.003.97 501.59
Table 6. Coefficients of regression of the equations.
FactorFlow
(mm)
3-Day Strength
(MPa)
28-Day Strength
(MPa)
CO2 Emissions
(kg/m3)
Intercept213.8220.5544.05771.62
Linear terms
A—limestone1.75−0.8023−2.62−54.26
B—clay−31.50−2.51−2.64−78.48
C—slag−10.28−2.98−4.91−142.45
Quadratic terms
A2−5.39−0.6315−0.66790.2215
B2−4.39−1.45−0.96040.7804
C23.470.3462−0.19660.7006
Interaction terms
AB−5.180.65470.39930.8564
AC−3.130.1745−2.370.8391
BC−0.63031.08−1.451.80
Other terms
p-value<0.0001<0.0001<0.0001<0.0001
(significant)(significant)(significant)(significant)
Lack of fit0.10810.13990.1836-
(not significant)(not significant)(not significant)
R20.950.980.975-
Table 7. Objectives of optimization.
ItemsLower
Limit
Upper
Limit
Goal
Independent variables
Limestone powder010%In range
Calcined clay020%
Slag030%
Response variables
Strength at 28 days
(MPa)
27.4150.428-day strength ≥ 30, 35, 40, or 45
Flow
(mm)
160253Flow ≥ 160
CO2 emissions
(kg/m3)
501.591052.04Minimum
Table 8. Results of optimal mixtures.
Optimal CombinationsCement (%)Limestone
(%)
Calcined Clay
(%)
Slag
(%)
Mix-3041.198.8120.0030.00
Mix-3546.273.7519.9830.00
Mix-4053.91.0315.0730.00
Mix-4564.260.005.7430.00
Table 9. Performance of optimal mixtures.
Optimal CombinationsFlow
(mm)
28-Day Strength
(MPa)
CO2 Emissions
(kg/m3)
Composite
Desirability
Mix-30162.3630.00514.090.977
Mix-35171.8535.00567.620.881
Mix-40189.3640.00633.410.761
Mix-45213.6645.00716.630.609
Table 10. CO2 emissions based on 1 kg binder.
OPCLimestone (A)Clay (B)Slag (C)CO2 Emission for 1 kg Binder
(kg/kg)
M11000000.86
M2955000.8174
M39001000.801
M48500150.7445
M58551000.7584
M680101000.7158
M775100150.6593
M87552000.6994
M970510150.6429
M1070510150.6429
M1170510150.6429
M1270510150.6429
M1370510150.6429
M1470102000.6568
M156550300.5864
M1665020150.6265
M1760010300.57
M18551020150.5413
M19501010300.4848
M2045520300.4684
M21401020300.4258
Table 11. Optimization design results (CO2 emissions based on 1 kg binder).
Optimal CombinationsCement (%)Limestone
(%)
Calcined Clay
(%)
Slag
(%)
Mix-3041.198.8120.0030.00
Mix-3546.404.0619.5430.00
Mix-4054.021.2814.7030.00
Mix-4564.260.005.7430.00
Table 12. Performance of optimal mixtures (CO2 emissions based on 1 kg binder).
Optimal CombinationsFlow
(mm)
28-Day Strength
(MPa)
CO2 Emissions
(kg/kg)
Composite
Desirability
Mix-30162.3630.000.43590.977
Mix-35173.3335.000.4790.877
Mix-40190.7840.000.5310.757
Mix-45213.6645.000.5950.610
Disclaimer/Publisher’s Note: The statements, opinions and data contained in all publications are solely those of the individual author(s) and contributor(s) and not of MDPI and/or the editor(s). MDPI and/or the editor(s) disclaim responsibility for any injury to people or property resulting from any ideas, methods, instructions or products referred to in the content.

