
From Transparent to Opaque: A Route towards Multifunctional Parts Injected with a Single Material
 , ,
, ,  and
and
Abstract
:1. Introduction
2. Materials and Methods
2.1. Materials
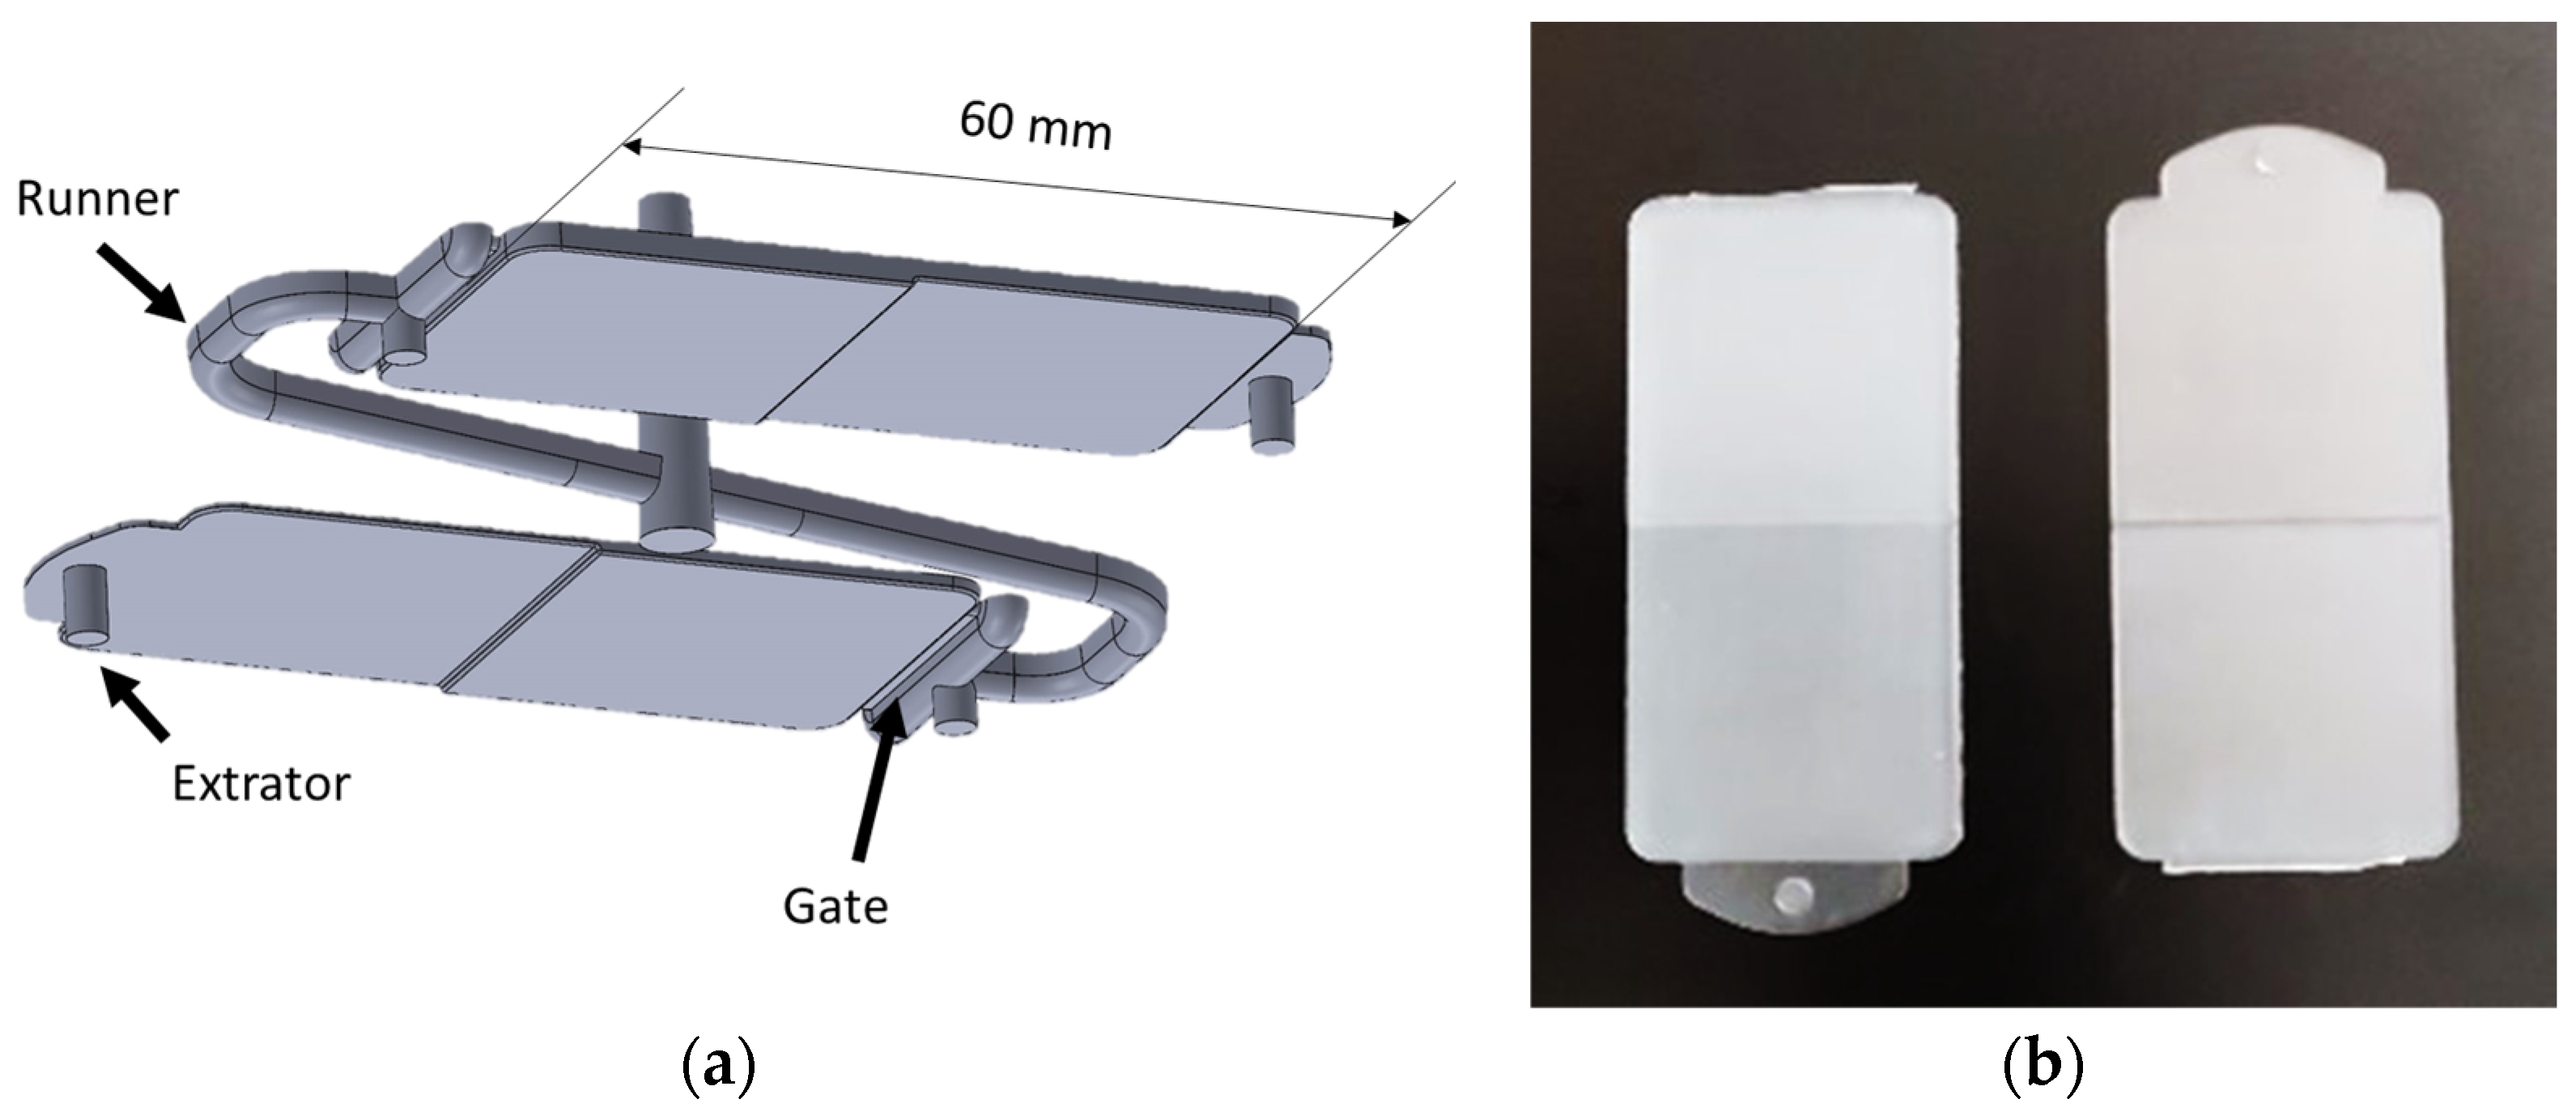
2.2. Part Geometry and Injection Molding
2.3. Samples Characterization
2.3.1. Optical Properties
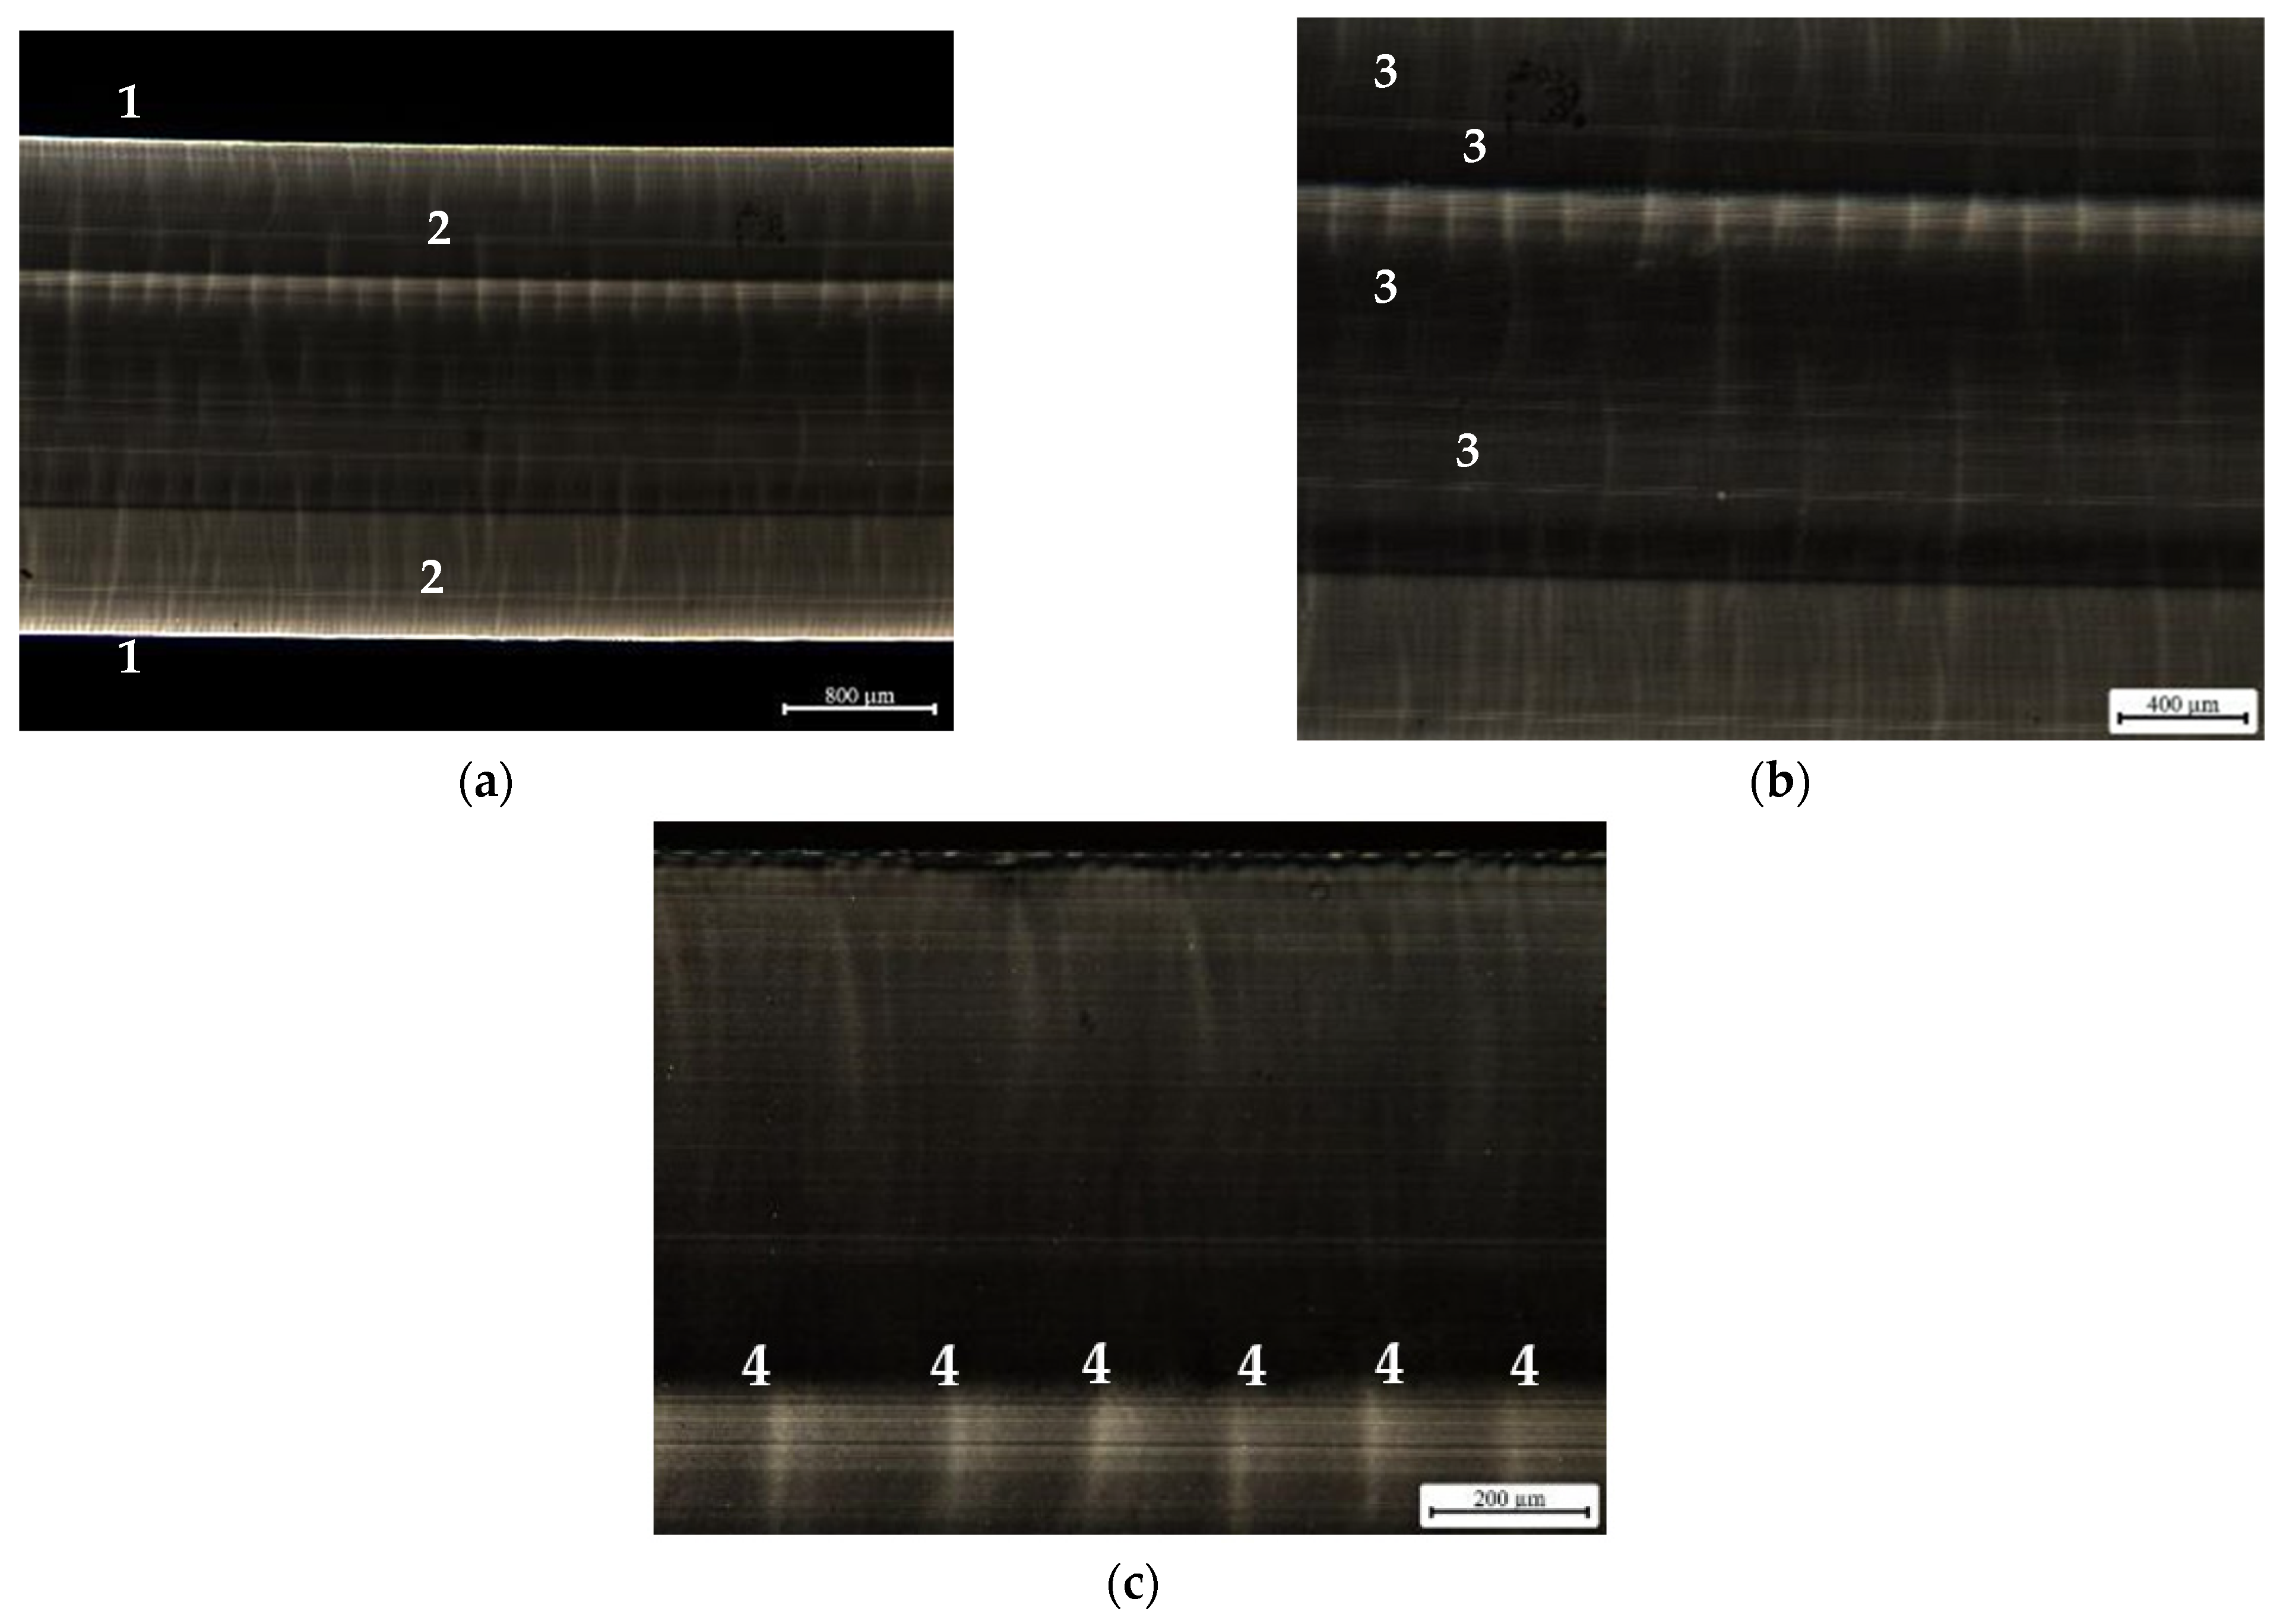
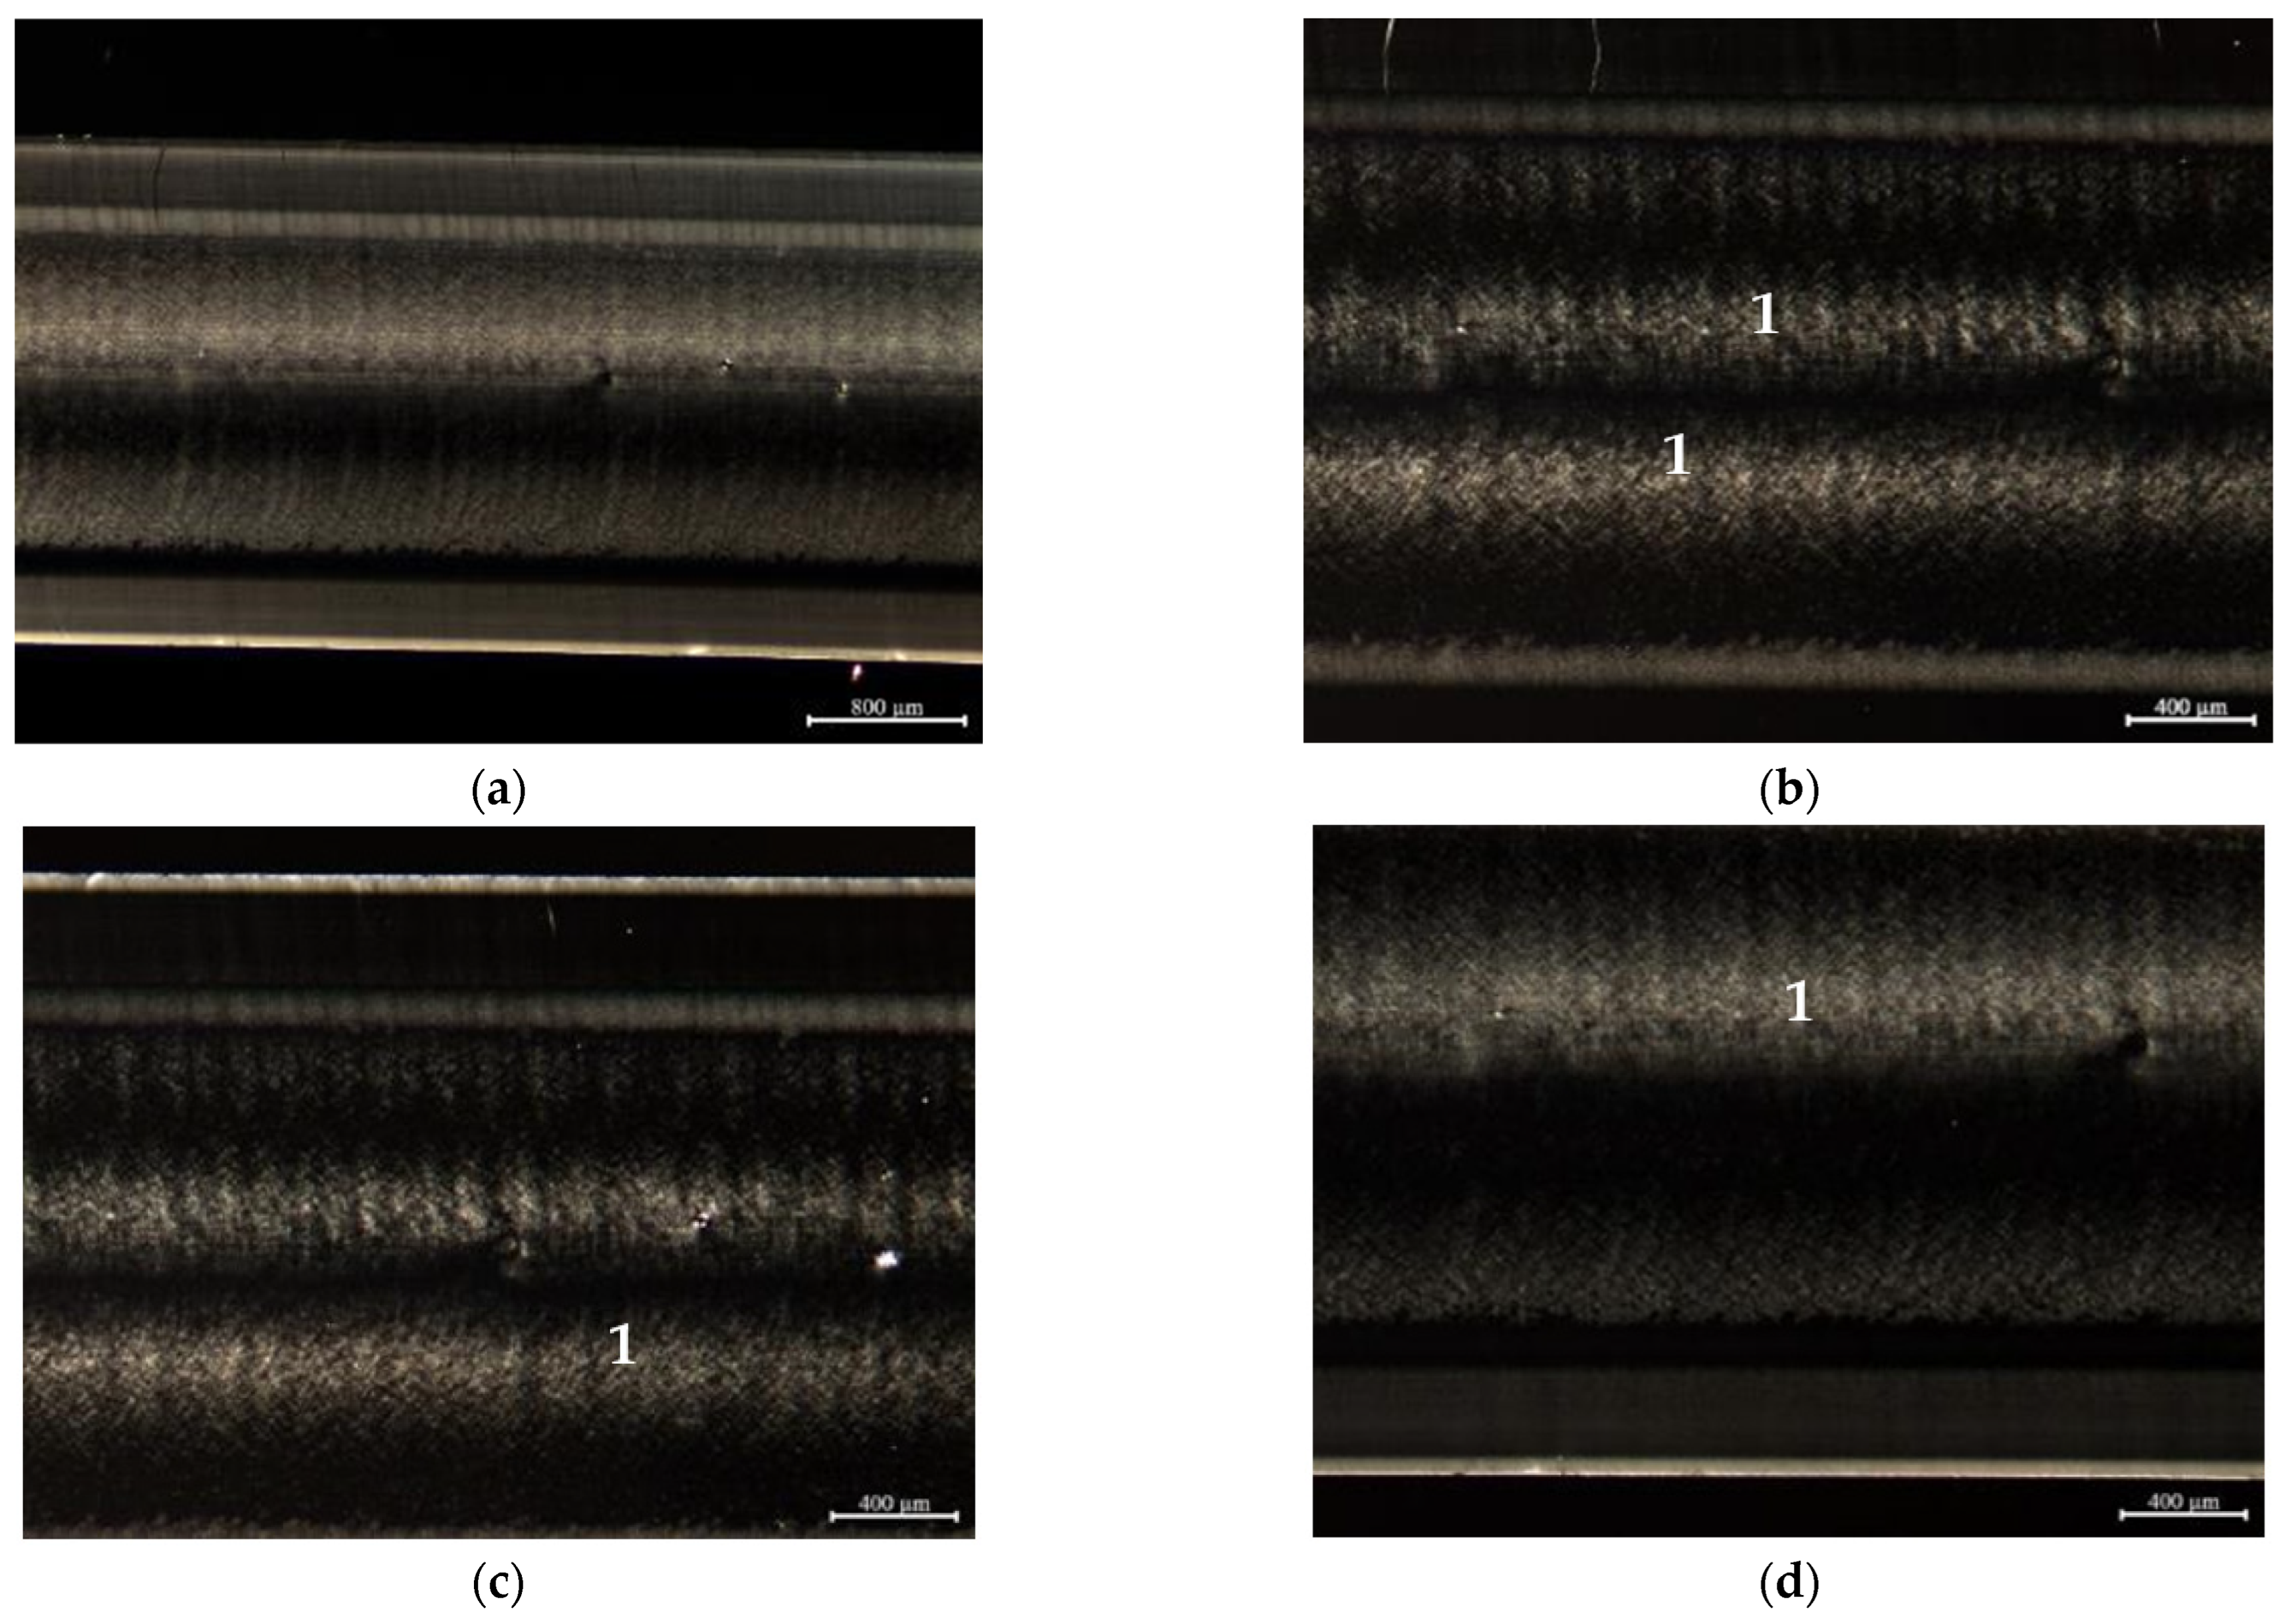
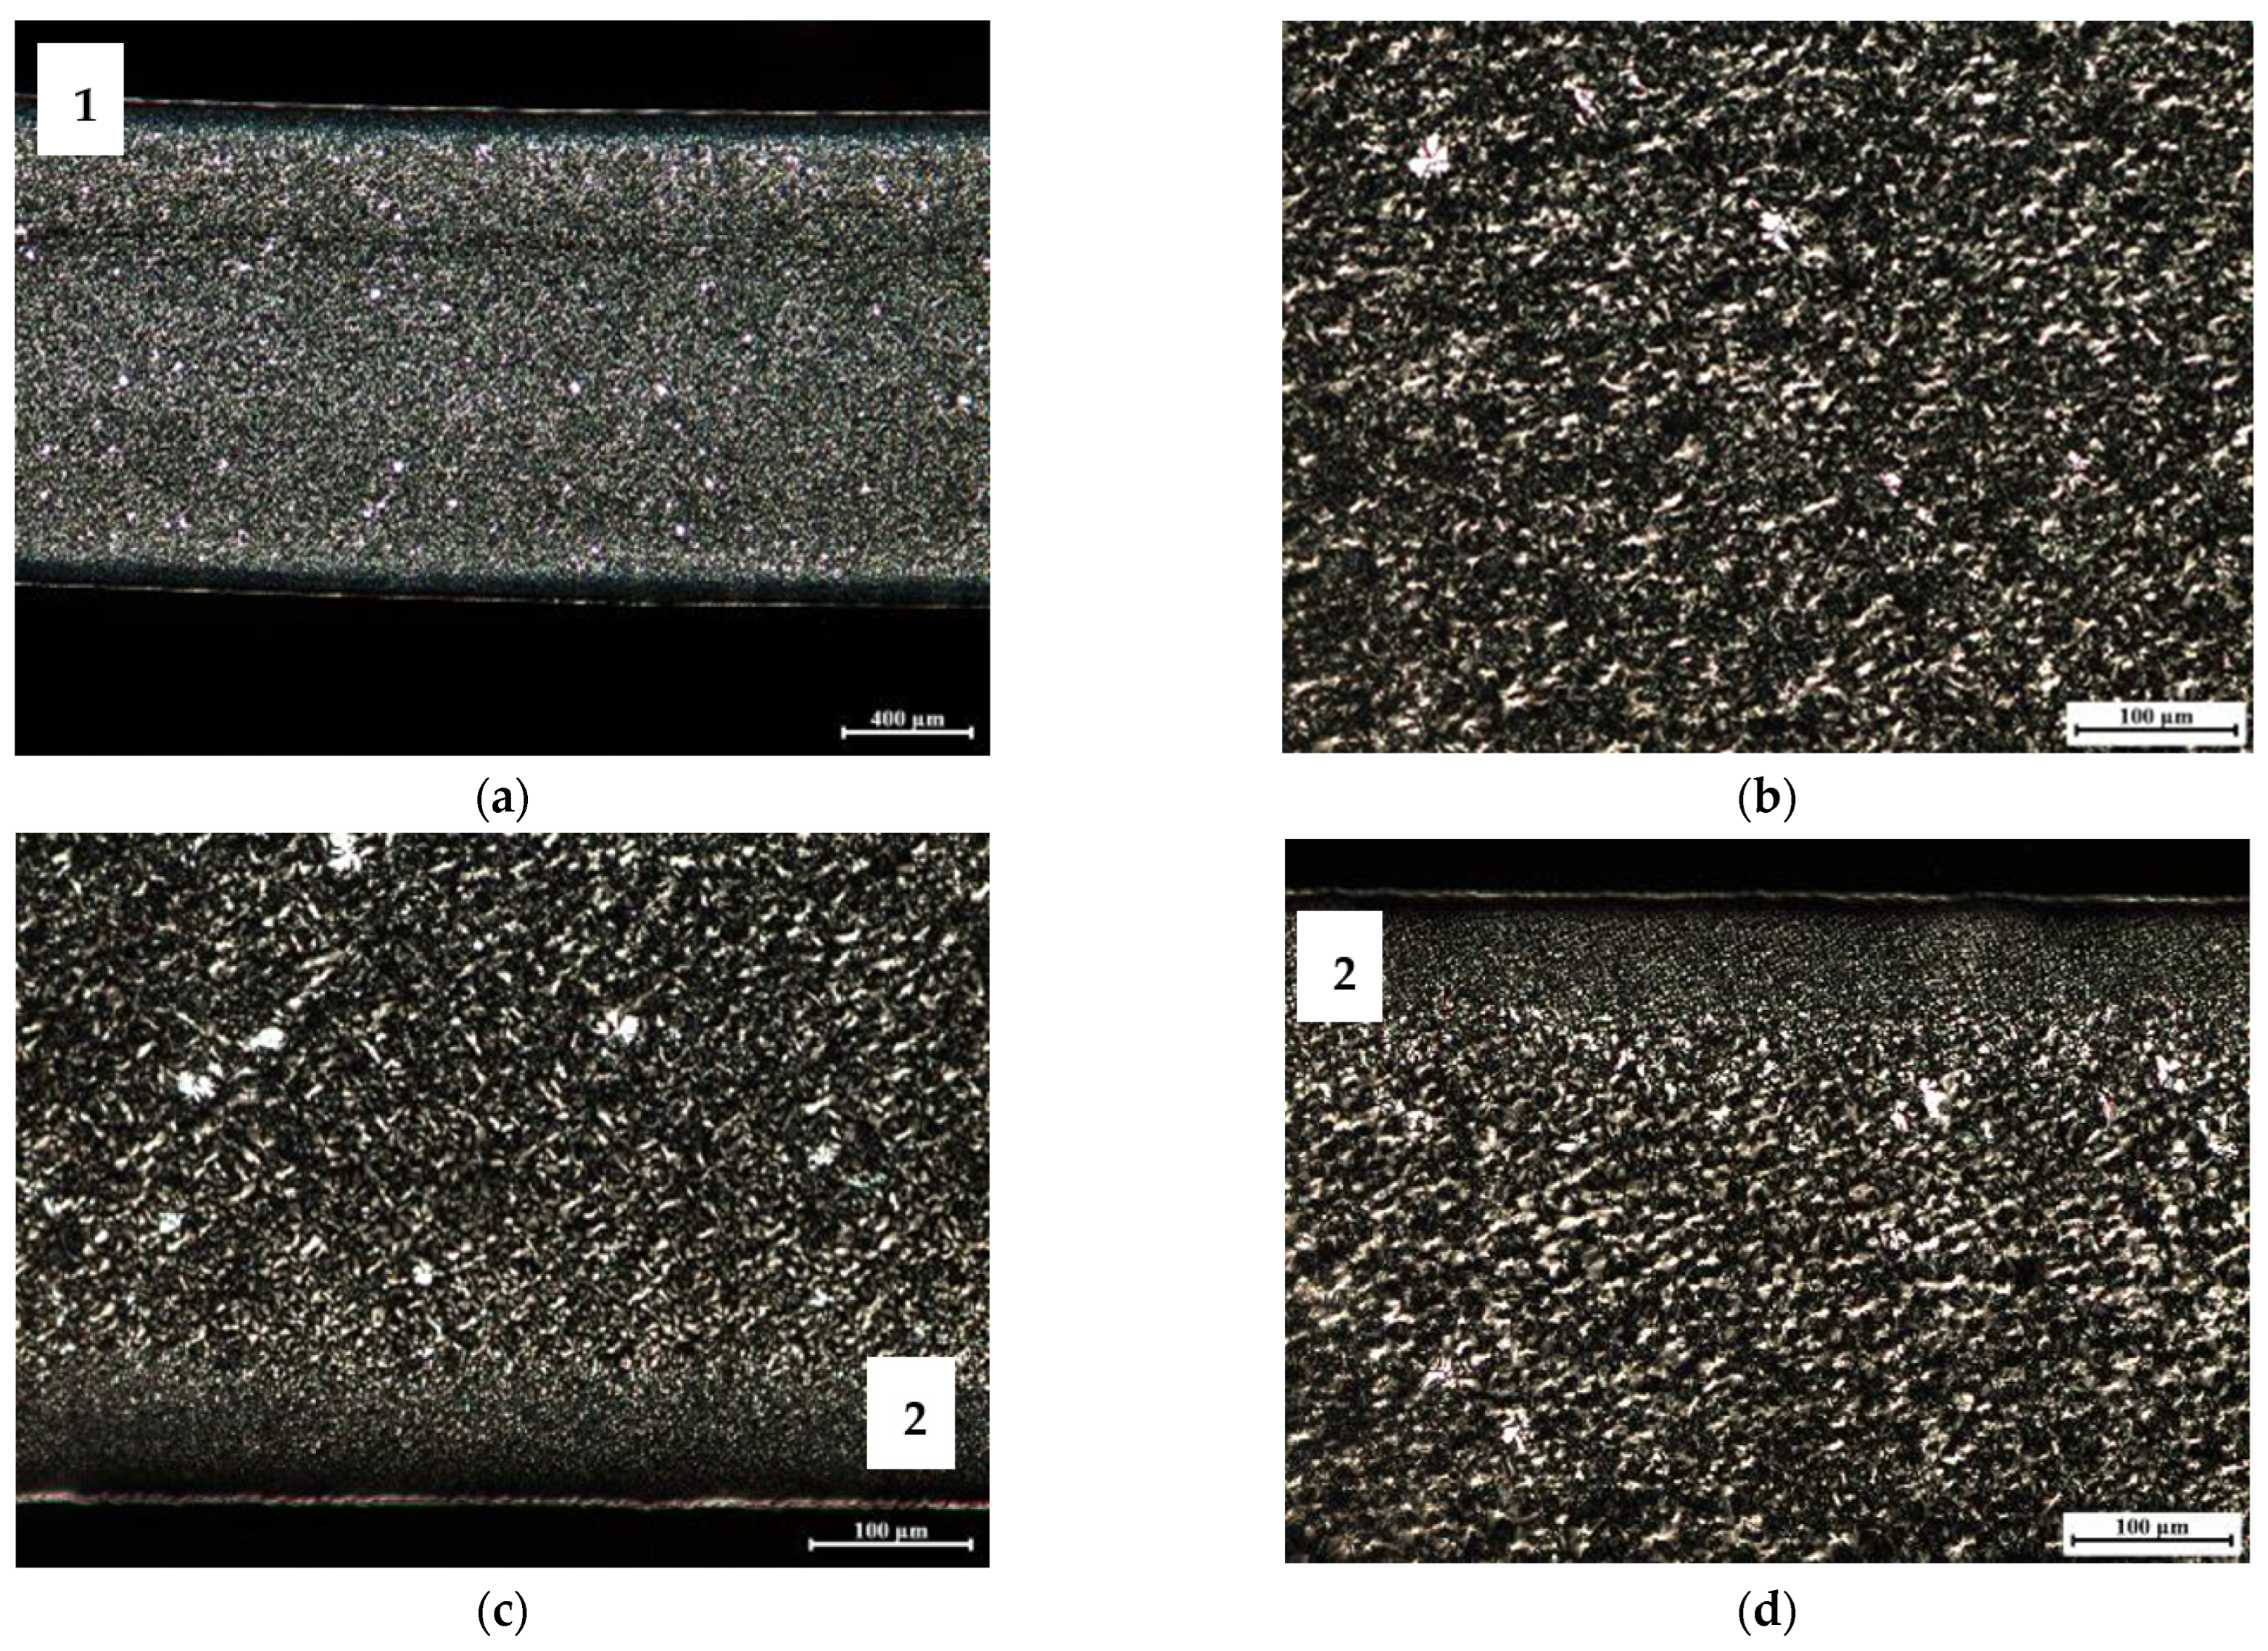
2.3.2. Morphology
3. Results and Discussion
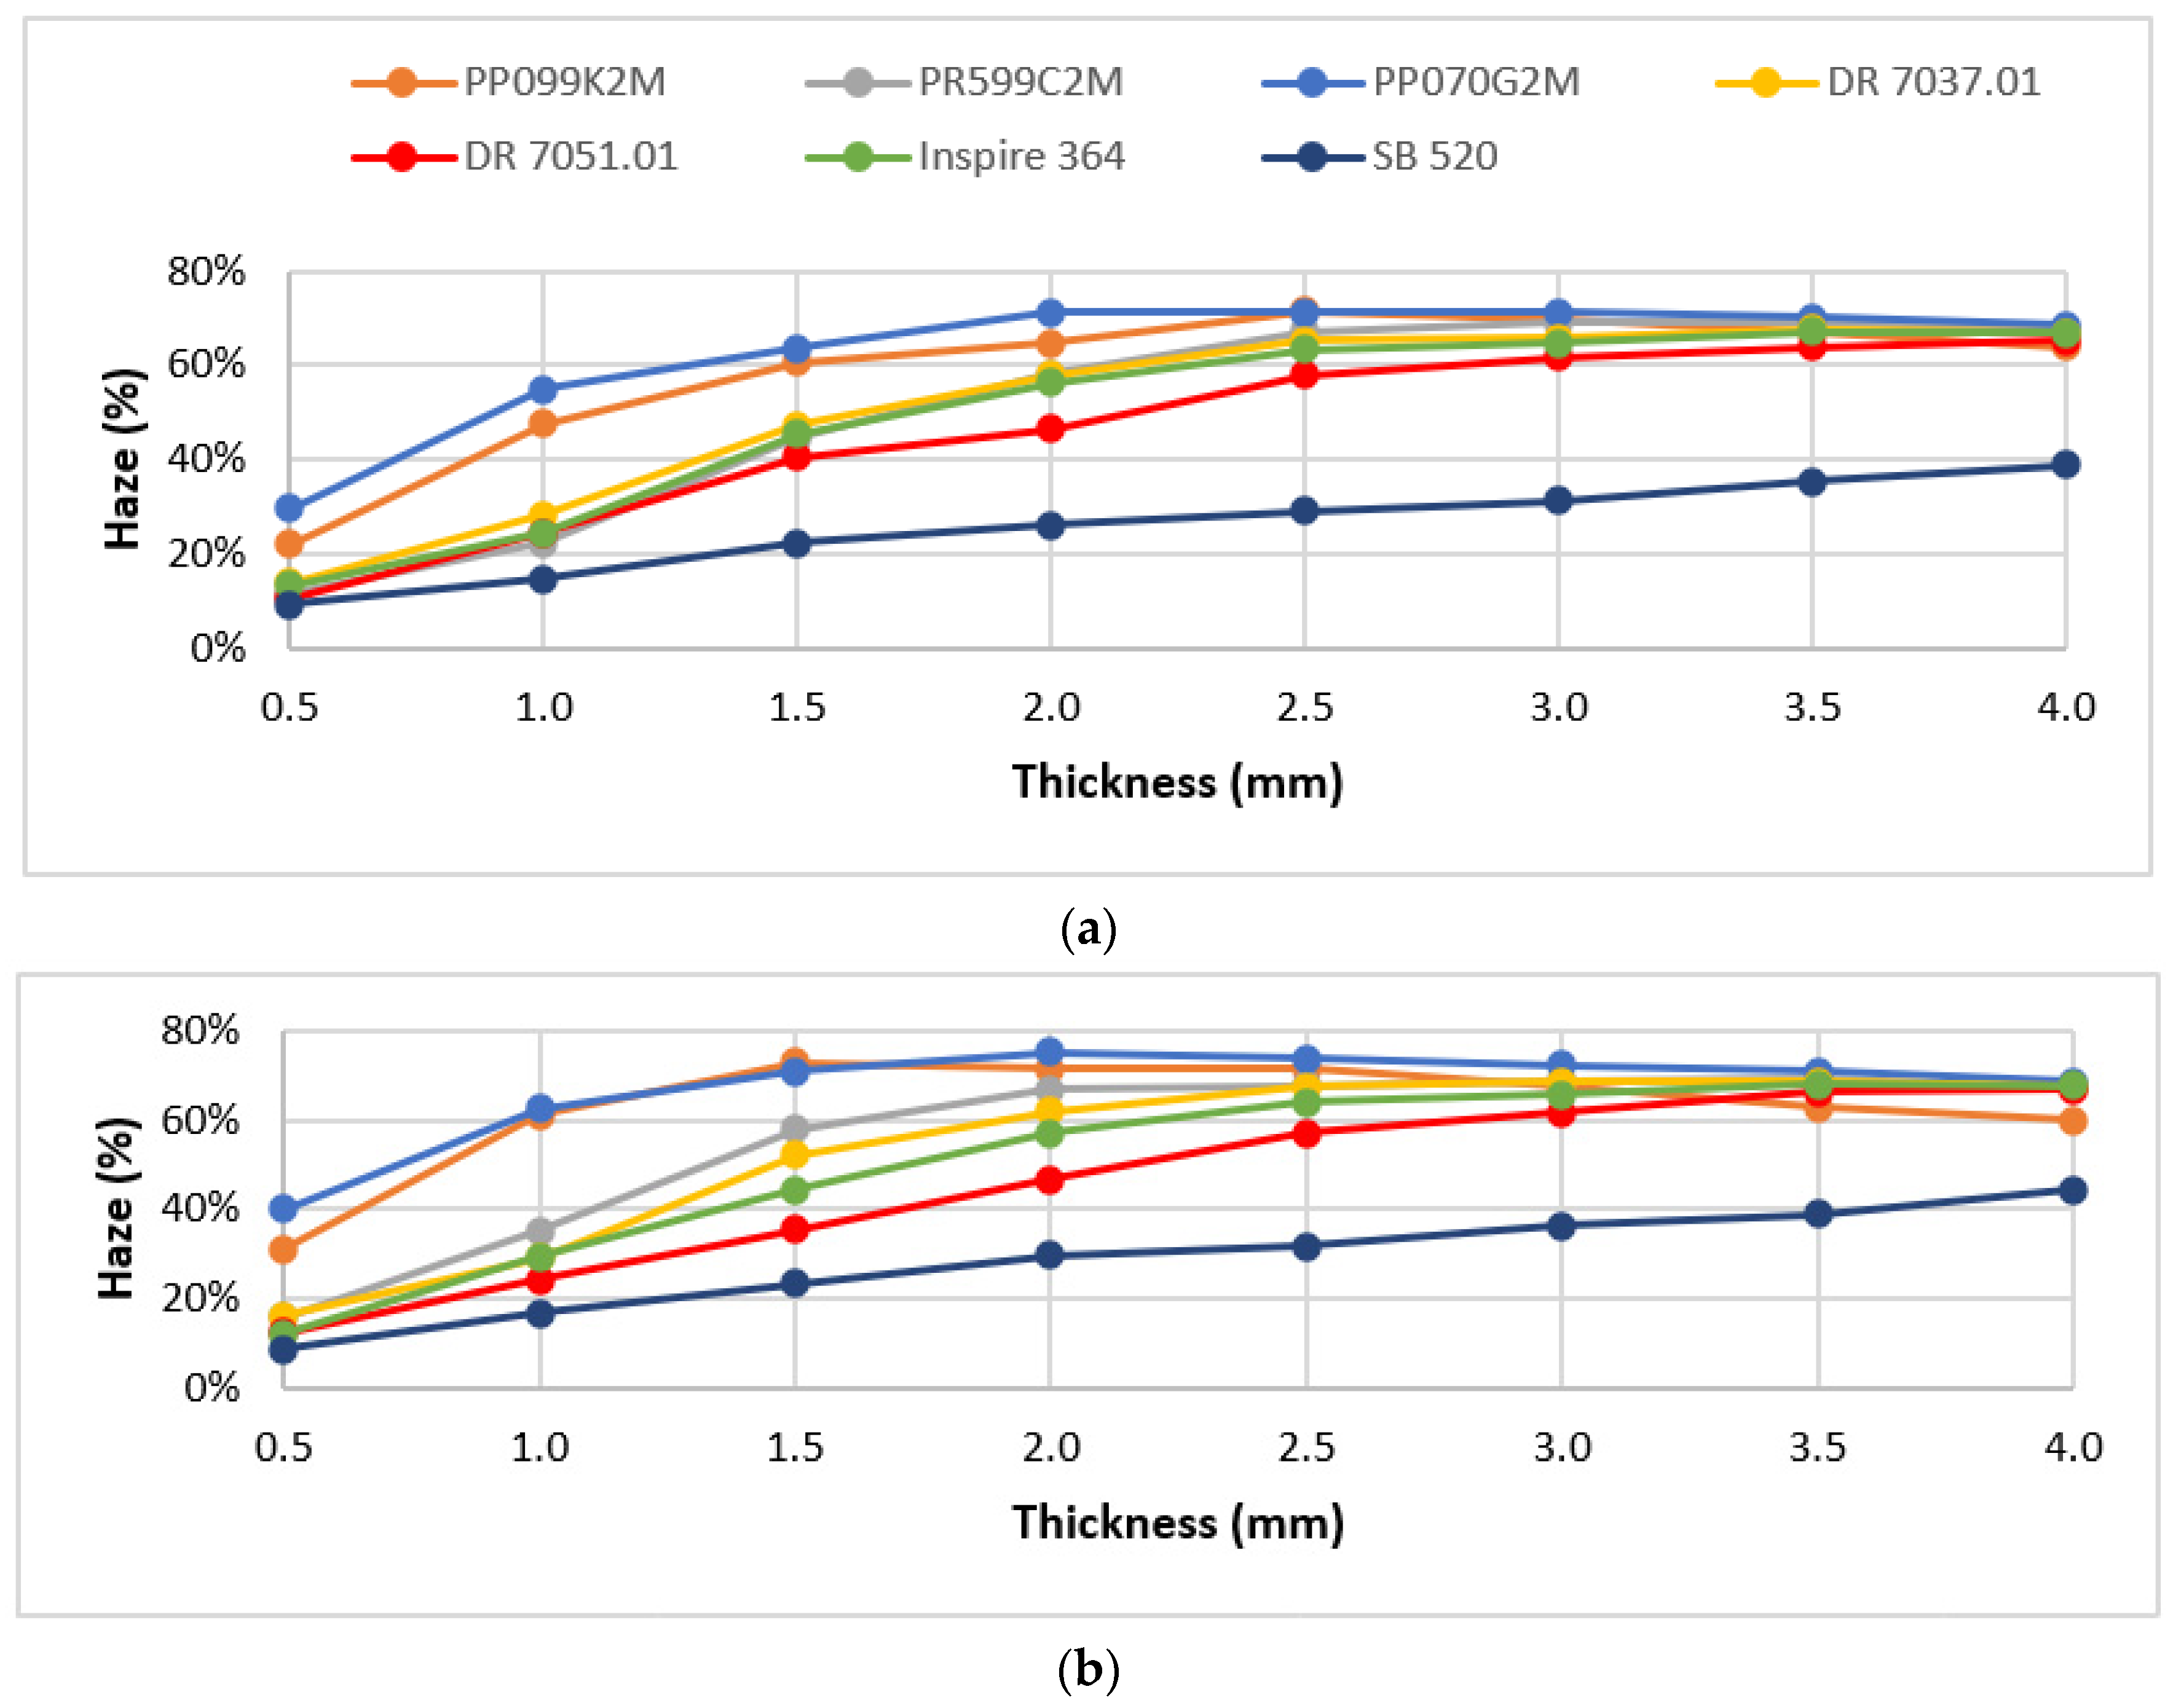
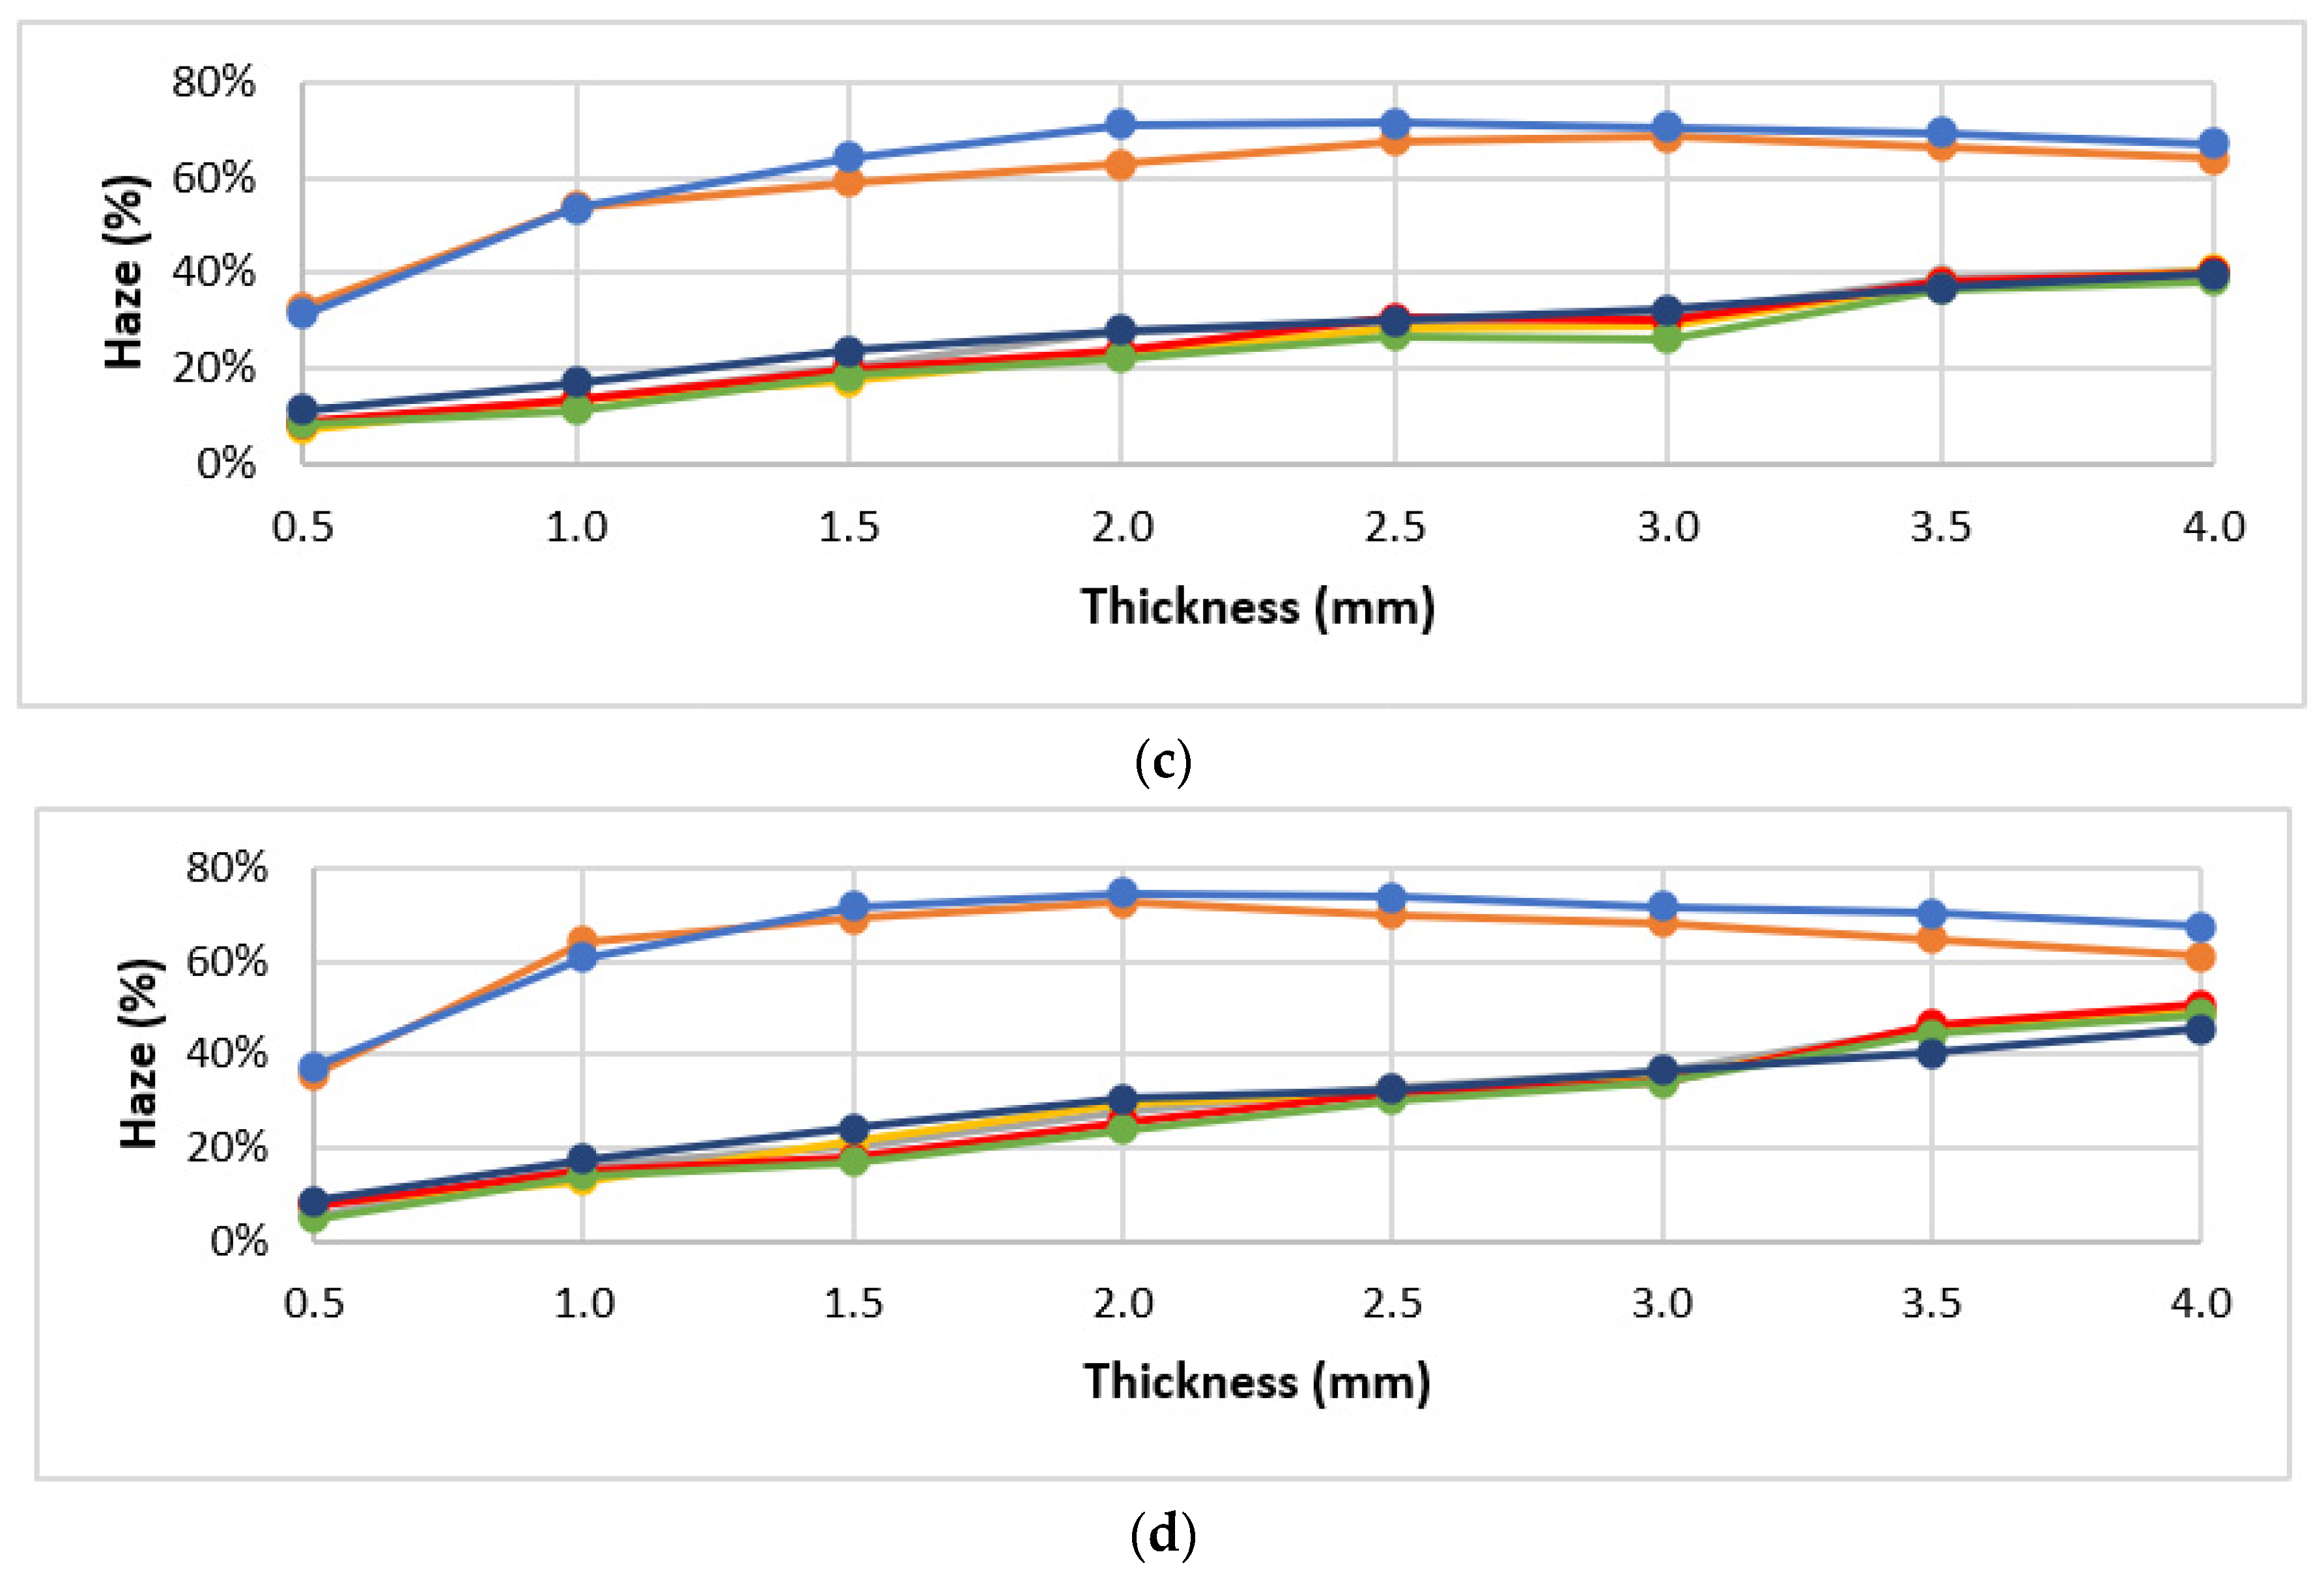
3.1. Materials Screening
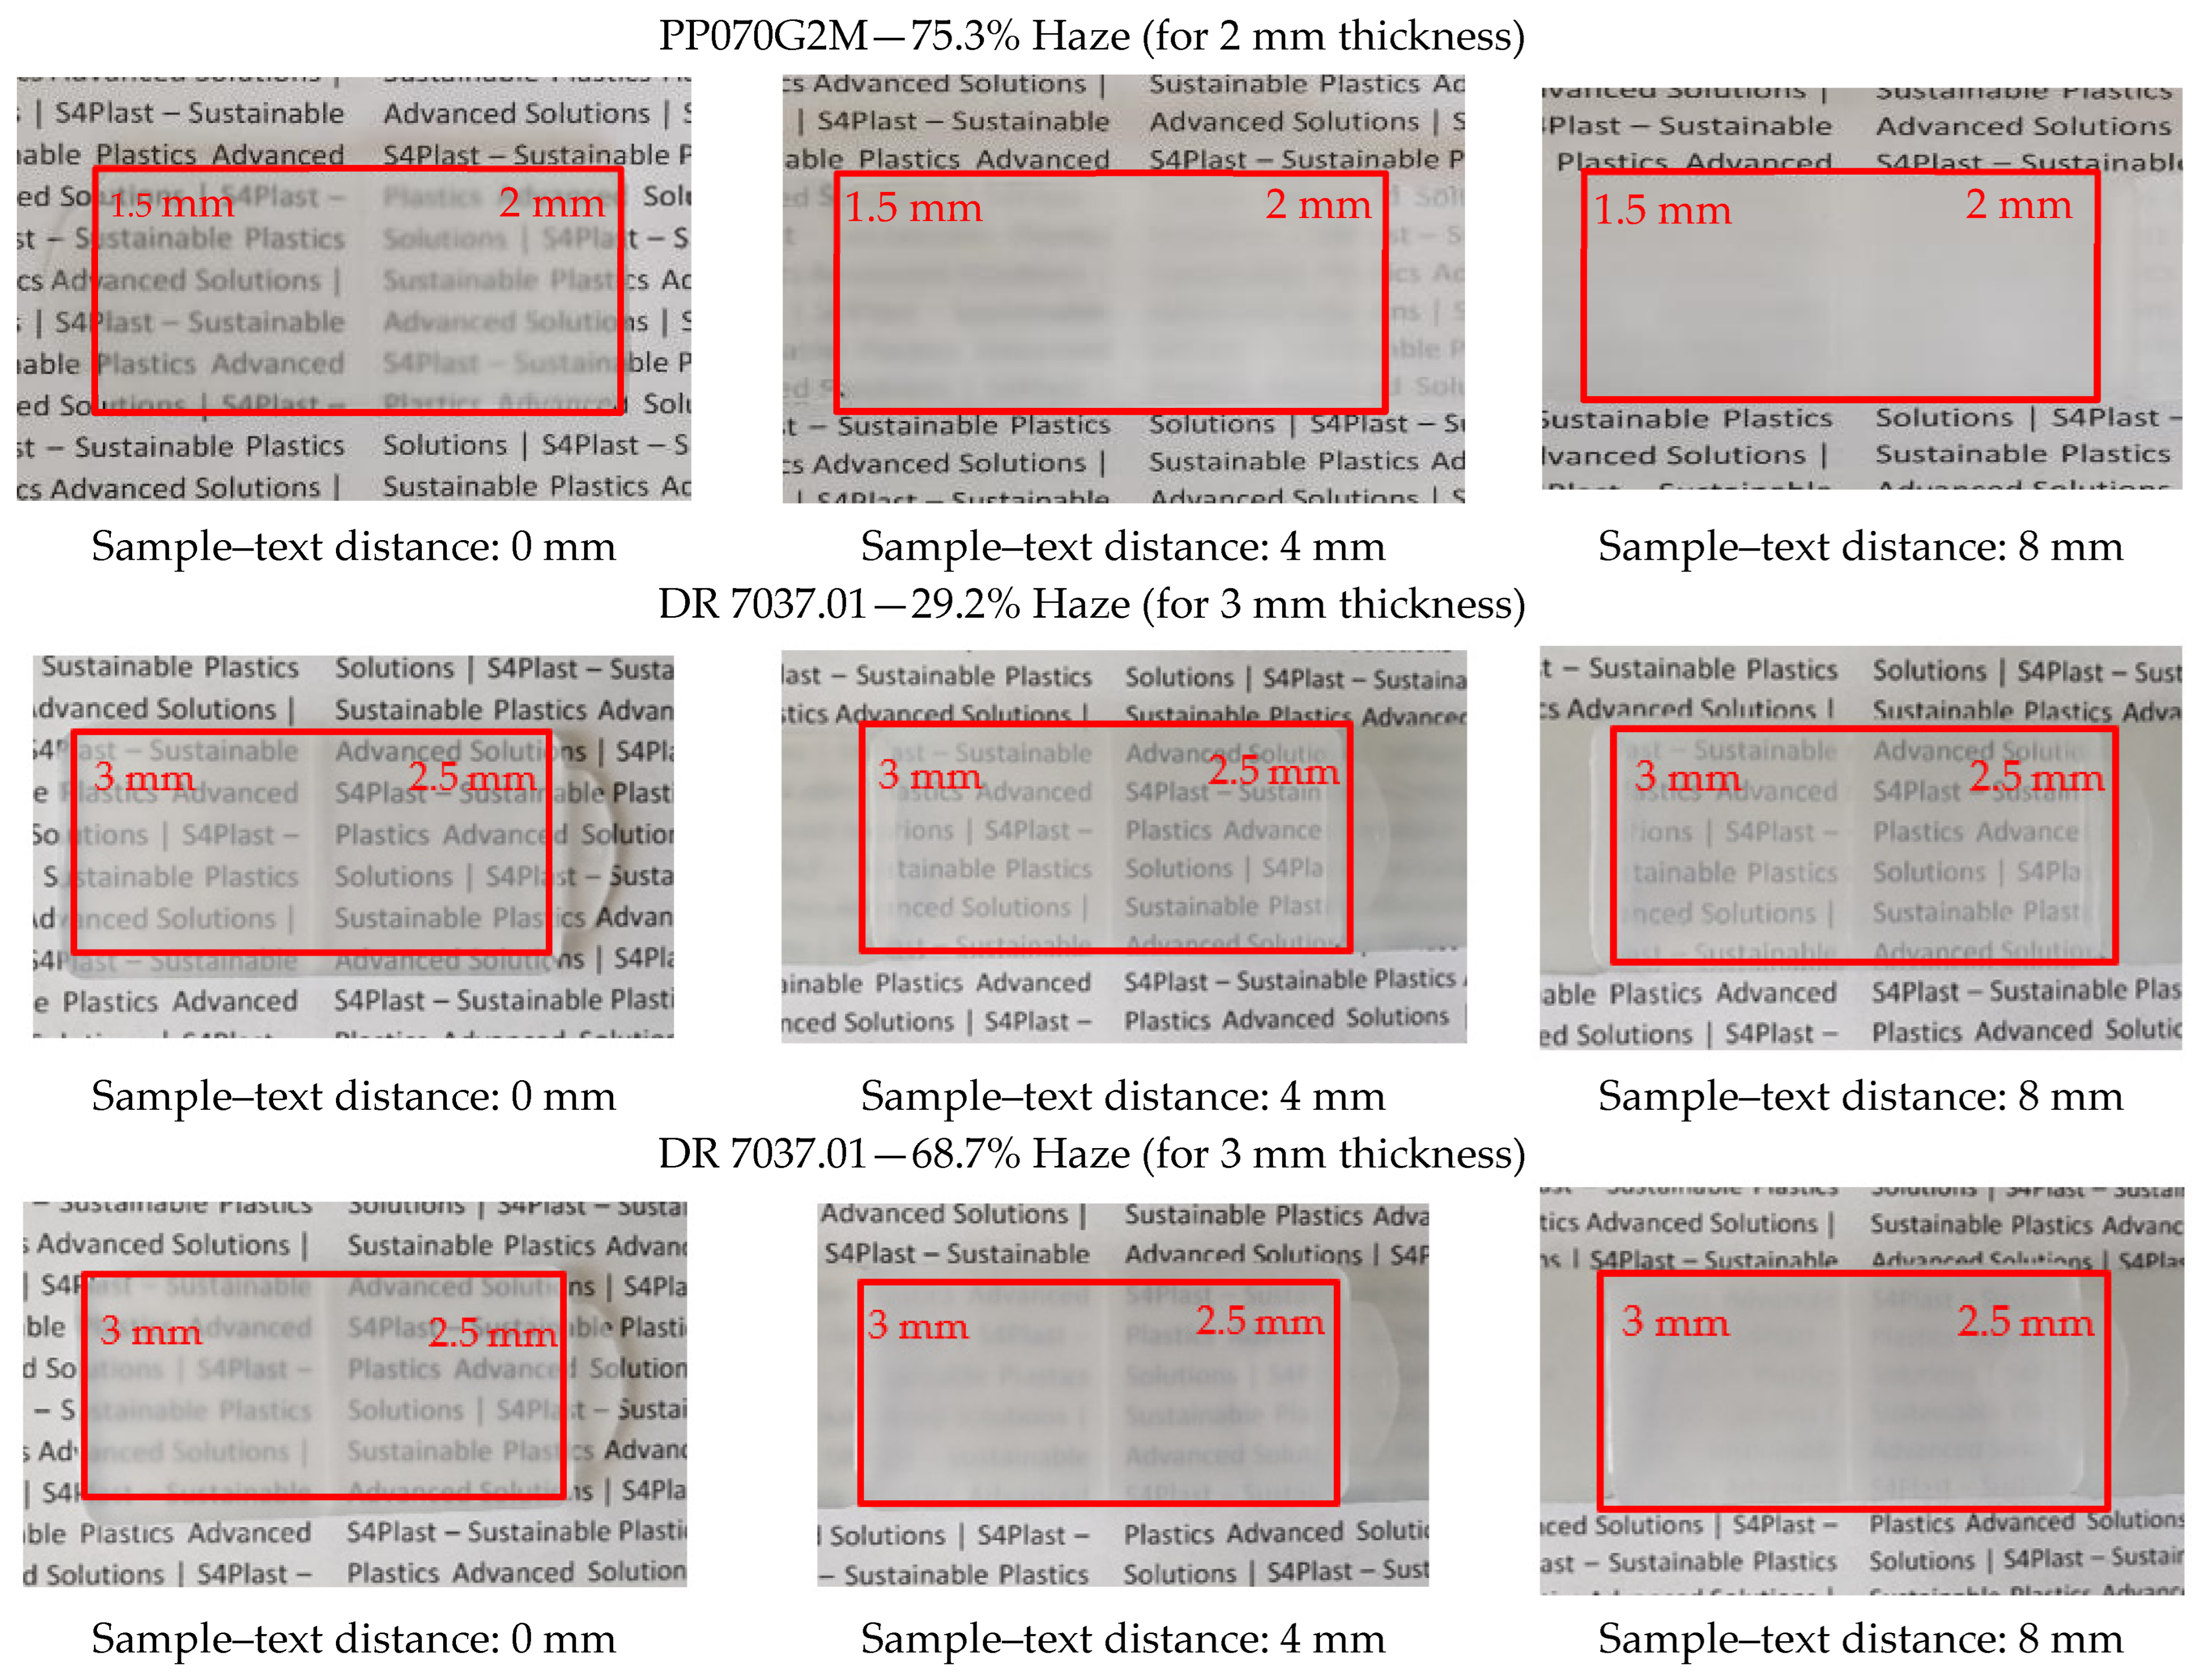
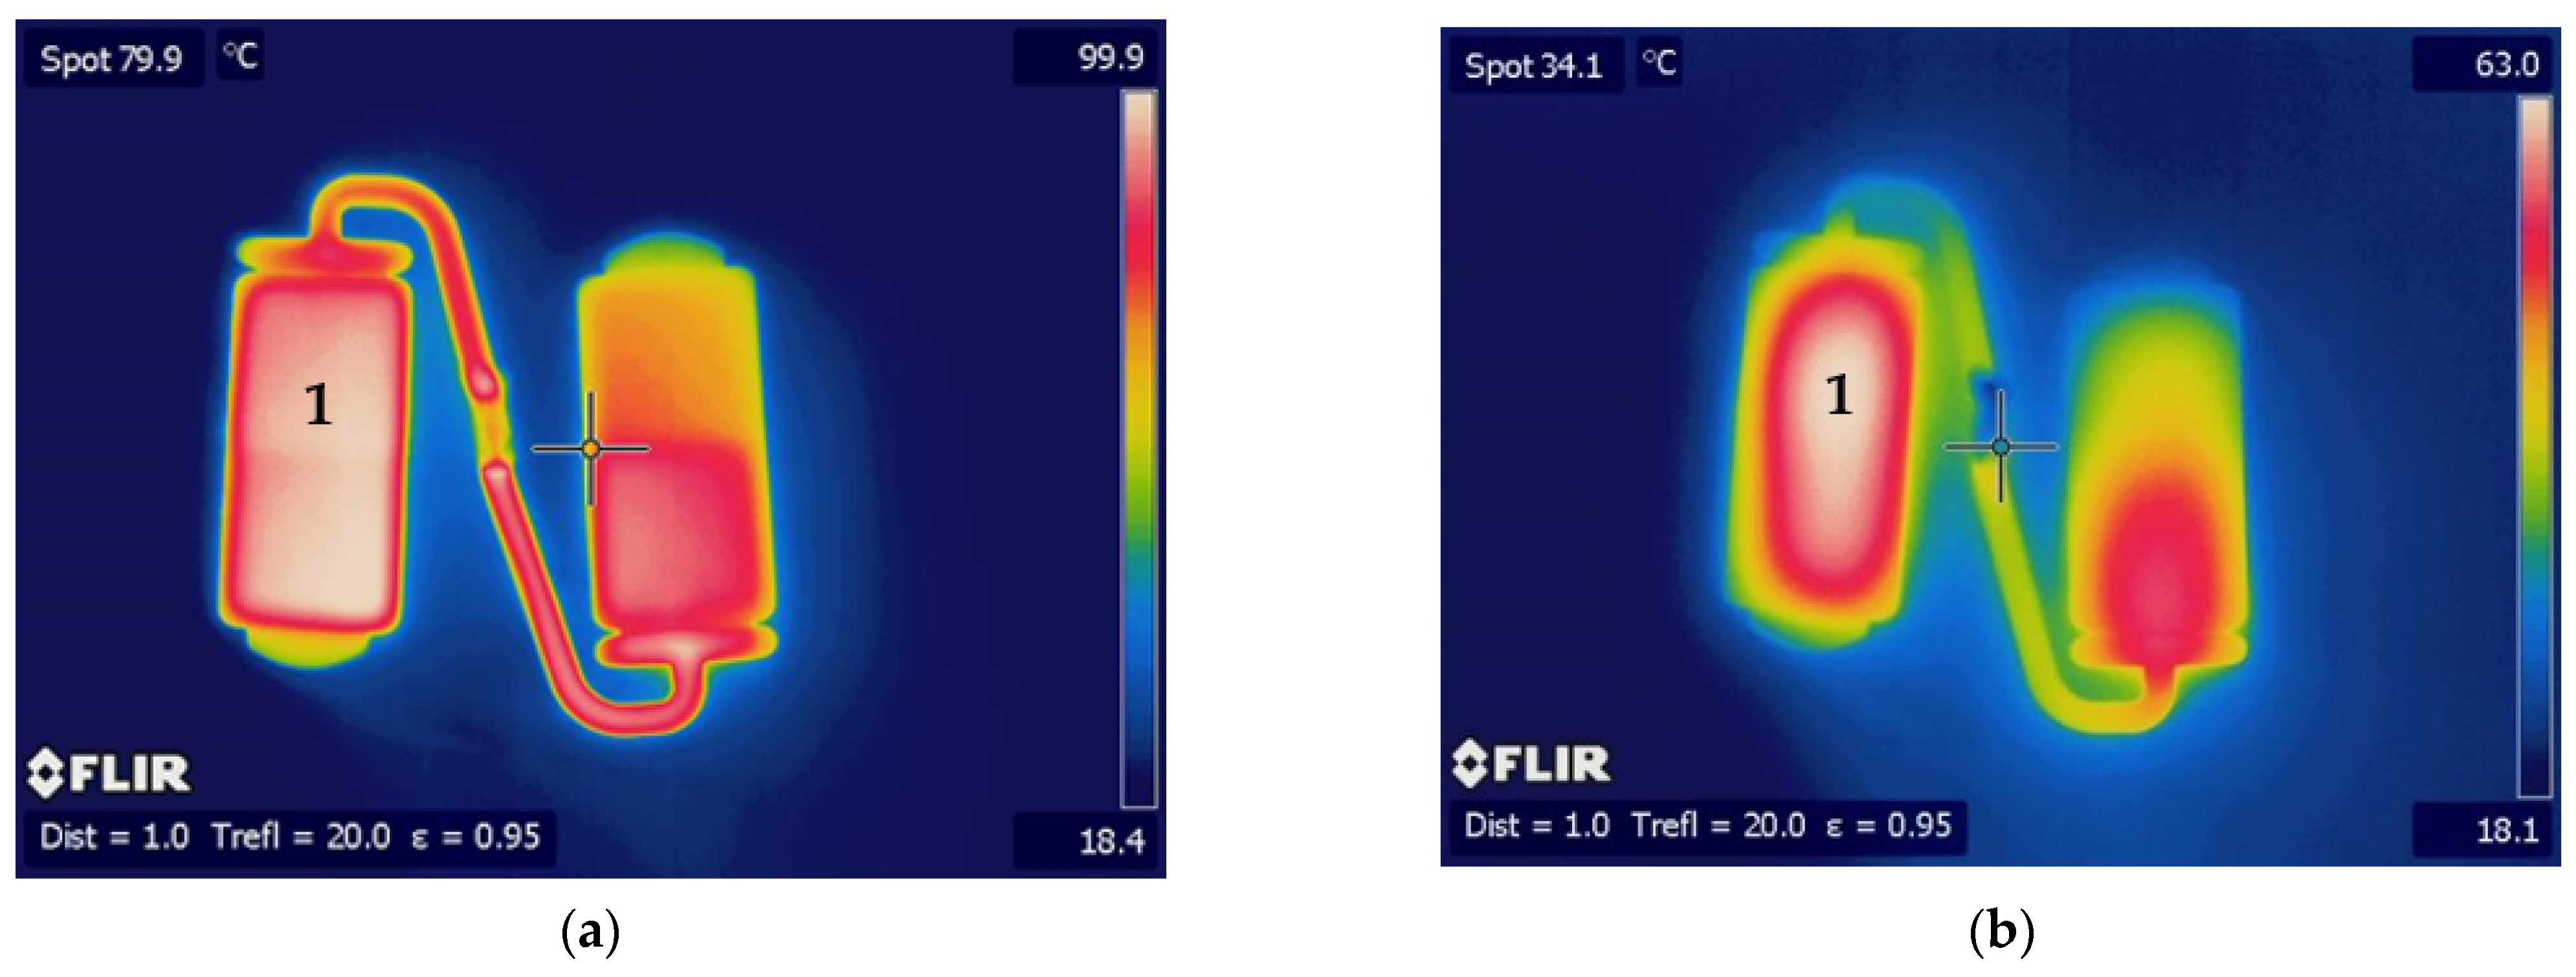
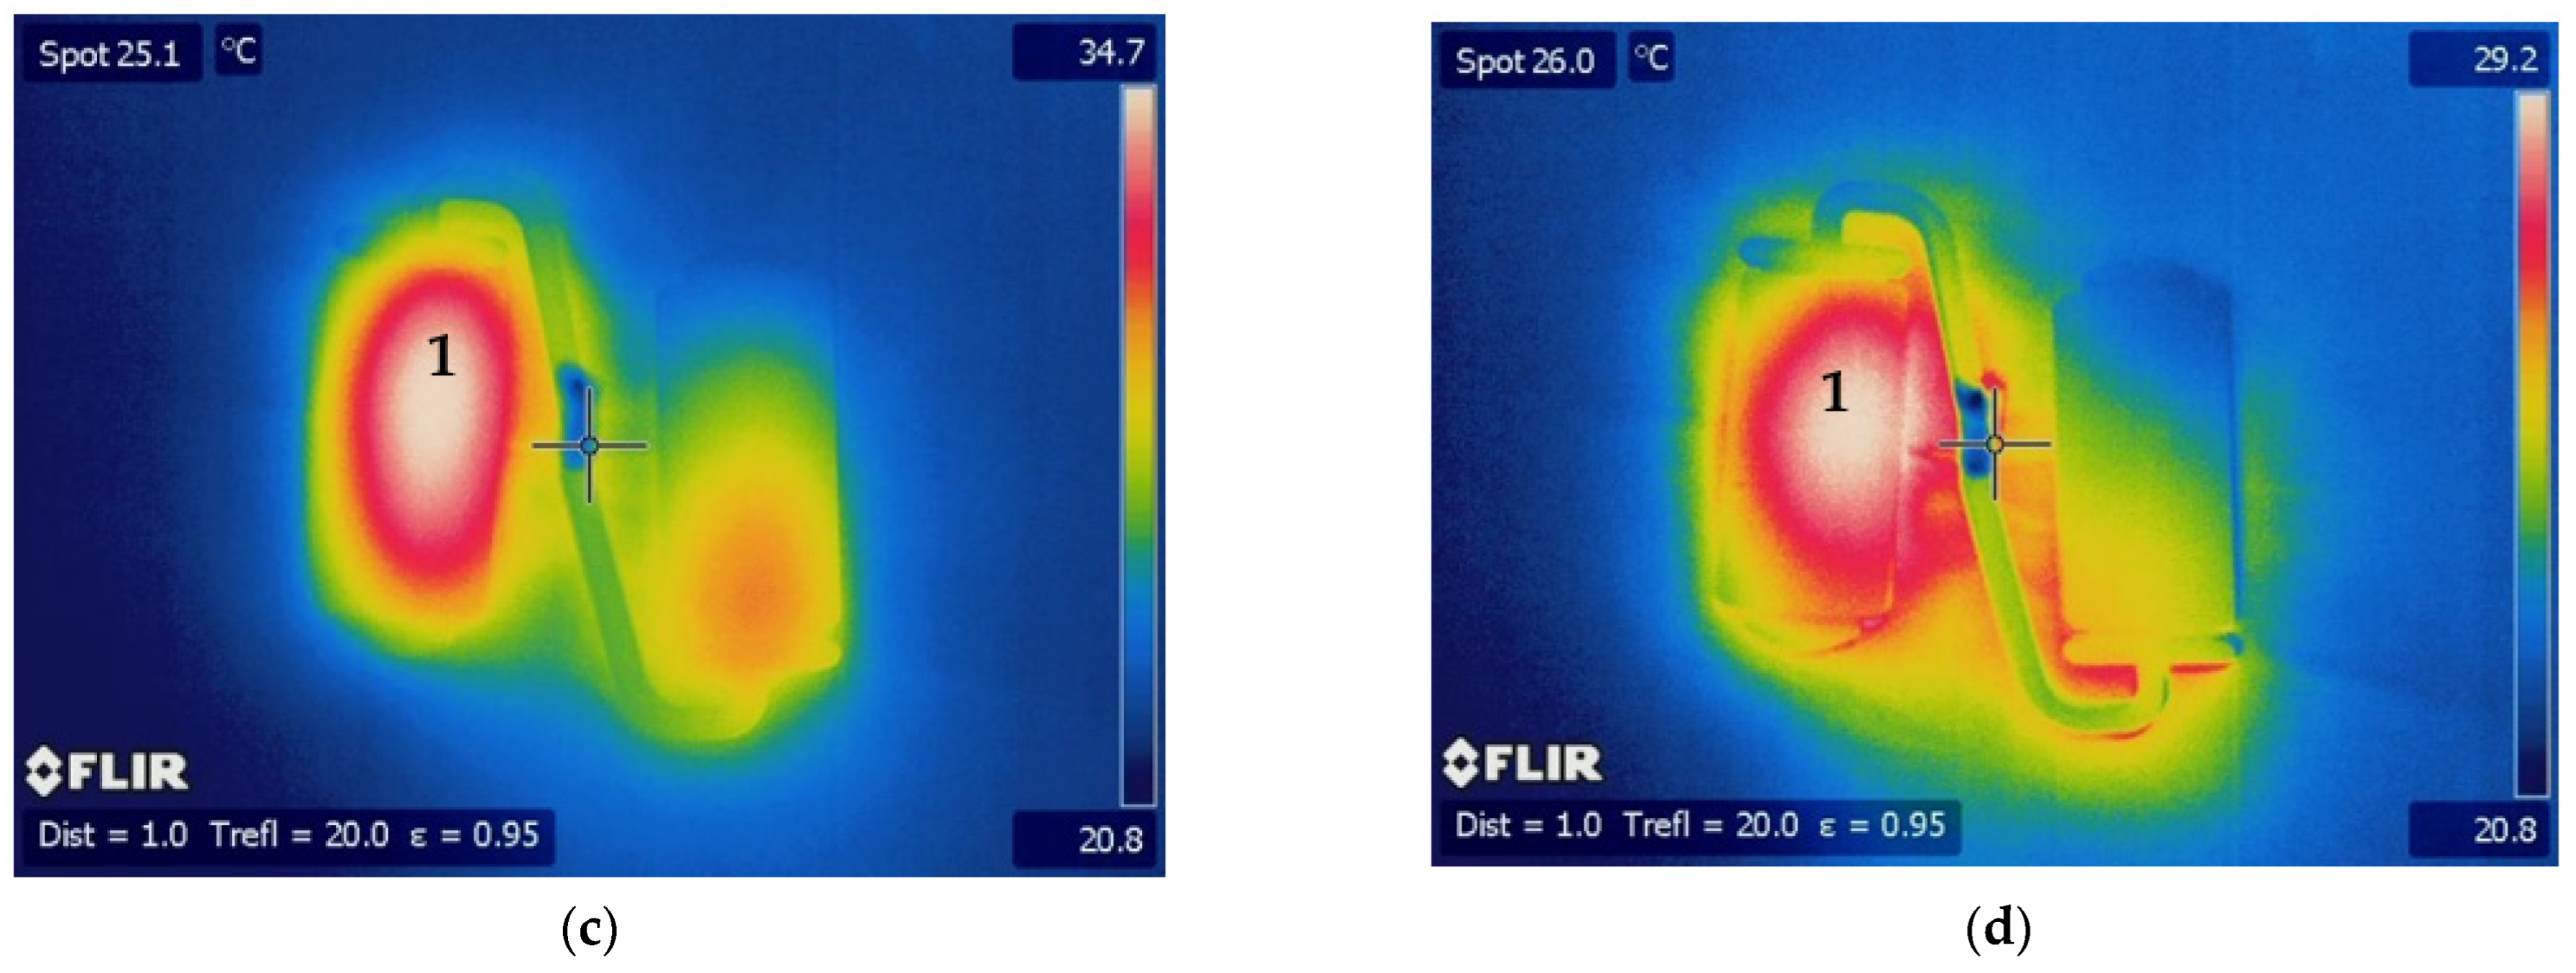
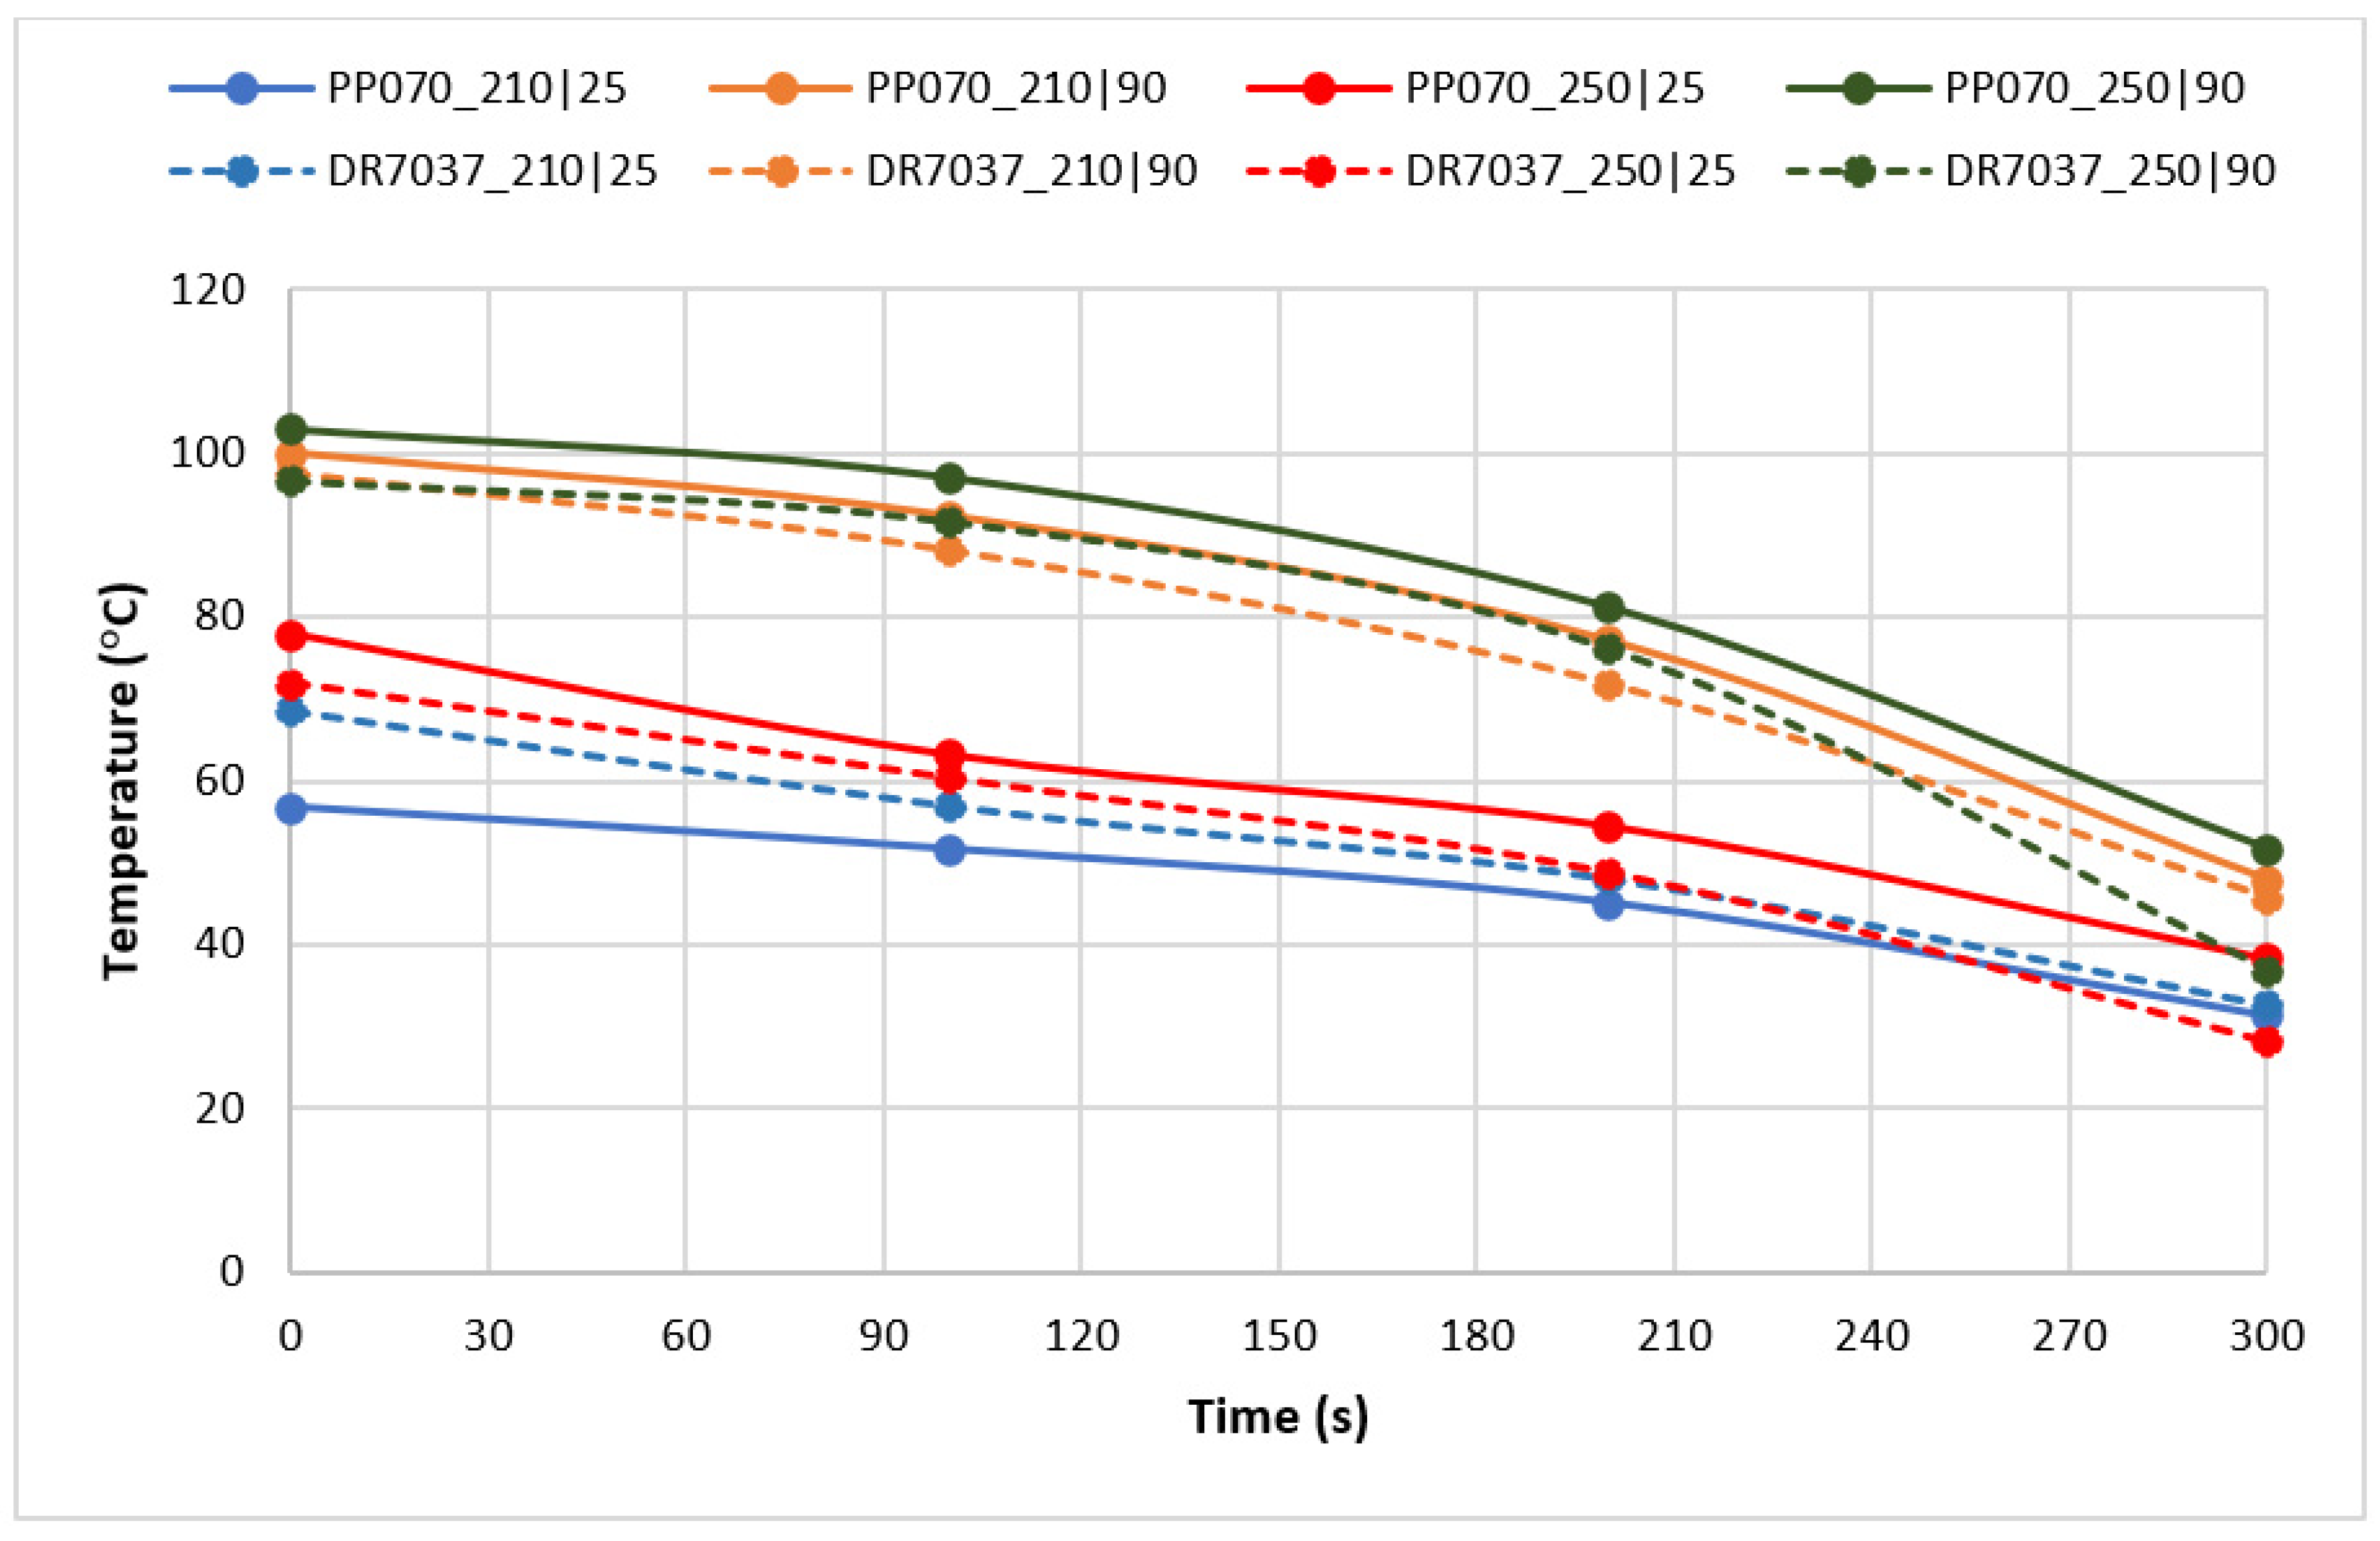
3.2. Optical Performance in Use
4. Conclusions
Author Contributions
Funding
Conflicts of Interest
References
- Böll, H. Plastic Atlas 2019: Facts and Figures about the World of Synthetic Polymers; Heinrich Böll Foundation: Cologne, Germany, 2019. [Google Scholar]
- Plasctics Europe. Plastics—The Facts 2021: An Analysis of European Plastics Production, Demand and Waste Data; Plasctics Europe: Brussels, Belgium, 2021. [Google Scholar]
- Carrington, D. After Bronze and Iron, Welcome to the Plastic Age, Say Scientists. The Guardian. 4 September 2019. Available online: https://www.theguardian.com/environment/2019/sep/04/plastic-pollution-fossil-record (accessed on 4 July 2022).
- Culter, J.D.; Selke, S.E.M. Plastics Packaging Book, 3rd ed.; Hanser Publishers: Munich, Germany, 2016. [Google Scholar]
- Thompson, R.C.; Swan, S.H.; Moore, C.J.; Vom Saal, F.S. Our plastic age. Philos. Trans. R. Soc. B Biol. Sci. 2009, 364, 1973–1976. [Google Scholar] [CrossRef] [PubMed]
- Wypych, G. Handbook of Polymers, 2nd ed.; ChemTec Publishing: Toronto, ON, Canada, 2016. [Google Scholar]
- Maier, C.; Calafut, T. Polypropylene The Defenitive User’s Guide and Databook, 1st ed.; Plastics Design Library: Cambridge, UK, 1998. [Google Scholar]
- Osswald, T.A.; Menges, G. Material Science of Polymers for Engineers, 3rd ed.; Hanser Publishers: Munich, Germany, 2012. [Google Scholar]
- Encyclopaedia Britannica. The Composition, Structure, and Properties of Plastics; Encyclopaedia Britannica, Inc.: Edinburgh, UK, 2020; pp. 1–20. Available online: https://www.britannica.com/print/article/4636841 (accessed on 2 May 2023).
- Harper, C.A. Handbook of Plastics, Elastomers, and Composites, 4th ed.; McGraw-Hill Education: Forest Hill, MD, USA, 2002. [Google Scholar]
- Bakas, I.; Ferna, R.; Reichel, A.; Trier, X.; Zeiger, B. Plastics, the Circular Economy and Europe’s Environment—A Priority for Action; European Environment Agency: Copenhagen, Denmark, 2021. [CrossRef]
- Pattanaik, S.S.; Sangavi, S. Marine habitat destruction: An anthropogenic way towards the end of life in the ocean. Vigyan Varta 2020, 1, 19–22. [Google Scholar]
- Sheavly, S.B.; Register, K.M. Marine debris & plastics: Environmental concerns, sources, impacts and solutions. J. Polym. Environ. 2007, 15, 301–305. [Google Scholar] [CrossRef]
- Korniejenko, K.; Kozub, B.; Bak, A.; Balamurugan, P.; Uthayakumar, M.; Furtos, G. Tackling the Circular Economy Challenges-Composites Recycling: Used Tires, Wind Turbine Blades, and Solar Panels. J. Compos. Sci. 2011, 5, 243. [Google Scholar] [CrossRef]
- De Santis, F.; Pantani, R. Optical properties of polypropylene upon recycling. Sci. World J. 2013, 2013, 354093. [Google Scholar] [CrossRef] [PubMed]
- Molnár, J.; Sepsi, Ö.; Erdei, G.; Lenk, S.; Ujhelyi, F.; Menyhárd, A. Modeling of light scattering and haze in semicrystalline polymers. J. Polym. Sci. 2020, 58, 1787–1795. [Google Scholar] [CrossRef]
- Lin, Y.; Bilotti, E.; Bastiaansen, C.W.M.; Peijs, T. Transparent semi-crystalline polymeric materials and their nanocomposites: A review. Polym. Eng. Sci. 2020, 60, 2351–2376. [Google Scholar] [CrossRef]
- Gahleitner, M.; Grein, C.; Kheirandish, S.; Wolfschwenger, J. Nucleation of Polypropylene Homo-and Copolymers. Int. Polym. Process. 2011, 26, 2–20. [Google Scholar] [CrossRef]
- Luo, S.; Wei, L.; Sun, J.; Huang, A.; Qin, S.; Luo, H.; Gao, C.; Zheng, Y.; Shen, J. Crystallization behavior and optical properties of isotactic polypropylene filled with α-nucleating agents of multilayered distribution. RSC Adv. 2019, 10, 387–393. [Google Scholar] [CrossRef] [PubMed]
- Zia, Q.; Androsch, R.; Radusch, H.J. Effect of the structure at the micrometer and nanometer scales on the light transmission of isotactic polypropylene. J. Appl. Polym. Sci. 2010, 117, 1013–1020. [Google Scholar] [CrossRef]
- Menyhárd, Z.H.A.; Doshev, P.; Gahleitner, M.; Vörös, G.; Varga, J.; Pukánszky, B. Effect of the molecular structure of the polymer and nucleation on the optical properties of polypropylene homo-and copolymers. ACS Appl. Mater. Interfaces 2014, 6, 7456–7463. [Google Scholar] [CrossRef]
- Tordjeman, P.; Robert, C.; Marin, G.; Gerard, P. The effect of alpha, beta crystalline structure on the mechanical properties of polypropylene. Eur. Phys. J. E 2001, 4, 459–465. [Google Scholar] [CrossRef]
- Gradys, A.; Sajkiewicz, P.; Minakov, A.; Adamovsky, S.; Schick, C.; Hashimoto, T.; Saijo, K. Crystallization of polypropylene at various cooling rates. Mater. Sci. Eng. A 2005, 413, 442–446. [Google Scholar] [CrossRef]
- Papagiorgiou, D.G.; Chrissafis, K.; Bikiaris, D. β-Nucleated Polypropylene: Processing, Properties and Nanocomposites. Polym. Rev. 2011, 55, 596–629. [Google Scholar] [CrossRef]
- Lamberti, G. Isotactic polypropylene crystallization: Analysis and modeling. Eur. Polym. J. 2011, 47, 1097–1112. [Google Scholar] [CrossRef]
- Nielsen, A.S.; Pyrz, R. The effect of cooling rate on thermal residual strains in carbon/polypropylene microcomposites. Sci. Eng. Compos. Mater. 1998, 7, 1–22. [Google Scholar] [CrossRef]
- Brucato, V.; Piccarolo, S.; La Carrubba, V. An experimental methodology to study polymer crystallization under processing conditions. The influence of high cooling rates. Chem. Eng. Sci. 2002, 57, 4129–4143. [Google Scholar] [CrossRef]
- Tripathi, D. Practical Guide to Polypropylene, 1st ed.; Rapra Technology Limited: Shawbury, UK, 2002. [Google Scholar]
- Maddah, H.A. Polypropylene as a Promising Plastic: A Review. Am. J. Polym. Sci. 2016, 6, 1–11. [Google Scholar] [CrossRef]
- Ahmed, A.K.; Atiqullah, M.; Pradhan, D.R.; Al-Harthi, M.A. Crystallization and melting behavior of i-PP: A perspective from Flory’s thermodynamic equilibrium theory and DSC experiment. RSC Adv. 2017, 7, 42491–42504. [Google Scholar] [CrossRef]
- ASTM D1003-21; Standard Test Method for Haze and Luminous Transmittance of Transparent Plastics. ASTM: West Conshohocken, PA, USA, 2021.
- van der Meer, D.W. Structure-Property Relationships in Isotactic Polypropylene. Ph.D. Thesis, University of Twente, Enschede, The Netherlands, 2003. [Google Scholar]
- Ehrenstein, G.W.; Theriault, R.P. Polymeric Materials: Structure, Properties, Applications; Hanser: Munich, Germany, 2001. [Google Scholar]
- Ruiz-Orta, C.; Fernandez-Blazquez, J.P.; Anderson-Wile, A.M.; Coates, G.W.; Alamo, R.G. Isotactic polypropylene with (3,1) chain-walking defects: Characterization, crystallization, and melting behaviors. Macromolecules 2011, 44, 3436–3451. [Google Scholar] [CrossRef]


| Material Reference | Producer | Type | MFI (g/10 min) @230 °C, 2.16 kg |
|---|---|---|---|
| Isplen PP070G2M | Repsol | Homopolymer | 12 |
| Isplen PP099K2M | Repsol | Homopolymer | 55 |
| Isplen PR599C2M | Repsol | Random Copolymer | 75 |
| DR 7037.01 | Braskem | Random Copolymer | 23 |
| DR 7051.01 | Braskem | Random Copolymer | 10 |
| Inspire 364 | Braskem | Random Copolymer | 42 |
| SB 520 | Lotte Chemical | Random Copolymer | 1.8 |
| Sample Thickness (mm) | Injection Speed (mm/s) | Packing Pressure (MPa) | Packing Time (s) | Cooling Time (s) |
|---|---|---|---|---|
| 0.5–2.0 | 80 | 25 | 6 | 22 |
| 2.5–4.0 | 65 | 20 | 6 | 22 |
| Processing Conditions | Minimum Haze (%) | Maximum Haze (%) | Haze Range (%) |
|---|---|---|---|
| Value | 29.2 | 68.7 | 39.5 |
| Tinj|Tmold (°C) | 250|25 | 210|90 |
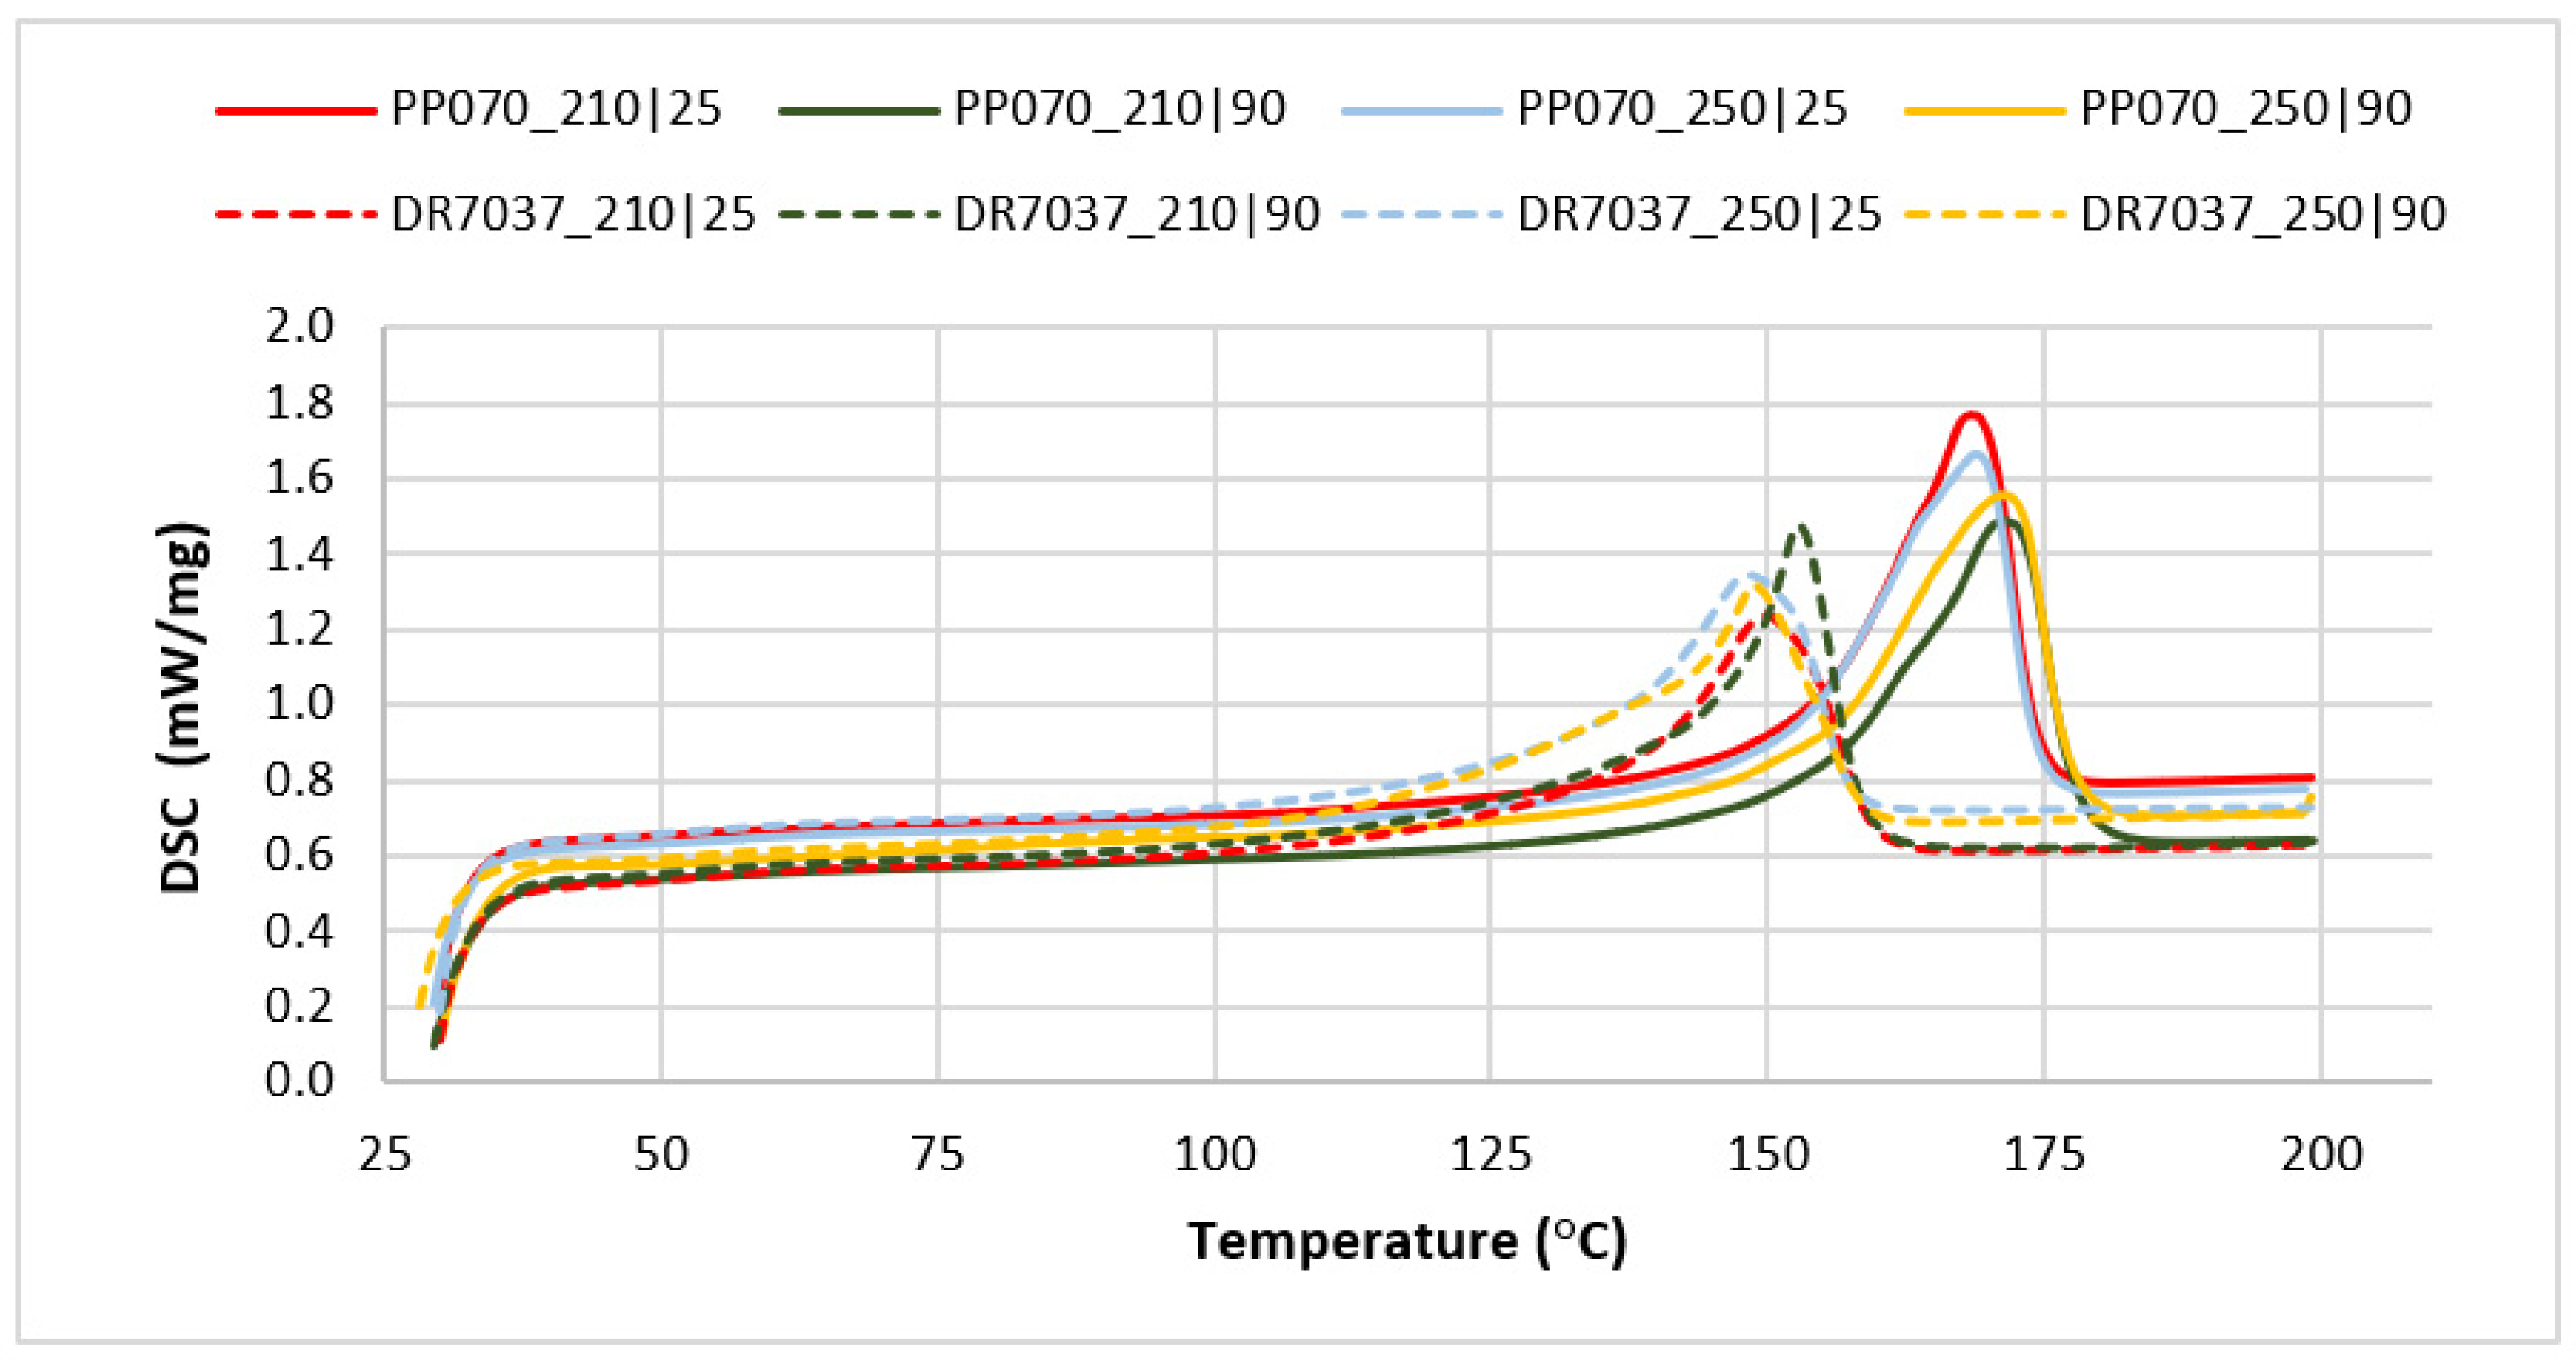
| Material | Thickness (mm) | Injection Temperature (°C) | Mold Temperature (°C) | Melting Enthalpy (J/g) | Melting Temperature (°C) | Degree of Crystallization (%) |
|---|---|---|---|---|---|---|
| PP070G2M | 2 | 210 | 25 | 90.01 ± 0.03 | 168.3 ± 0.09 | 43.48 ± 0.02 |
| PP070G2M | 2 | 210 | 90 | 94.82 ± 0.04 | 171.8 ± 0.15 | 45.80 ± 0.01 |
| PP070G2M | 2 | 250 | 25 | 87.77 ± 0.03 | 168.9 ± 0.02 | 42.40 ± 0.002 |
| PP070G2M | 2 | 250 | 90 | 102.25 ± 0.03 | 161.3 ± 0.34 | 49.40 ± 0.01 |
| DR 7037.01 | 3 | 210 | 25 | 81.25 ± 0.06 | 150.34 ± 0.21 | 39.25 ± 0.04 |
| DR 7037.01 | 3 | 210 | 90 | 90.78 ± 0.01 | 152.8 ± 0.08 | 43.86 ± 0.002 |
| DR 7037.01 | 3 | 250 | 25 | 83.66 ± 0.11 | 148.3 ± 0.10 | 40.41 ± 0.06 |
| DR 7037.02 | 3 | 250 | 90 | 85.51 ± 0.02 | 150.4 ± 1.73 | 41.31 ± 0.01 |
| Material | Heating Cycle | Melting Enthalpy (J/g) | Melting Temperature (°C) | Degree of Crystallization (%) |
|---|---|---|---|---|
| PP070G2M | 1st | 84.825 ± 0.01 | 168.9 ± 0.4 | 40.98 ± 0.02 |
| PP070G2M | 2nd | 95.17 ± 0.02 | 168 ± 0.004 | 45.98 ± 0.01 |
| PP070G2M | 3rd | 89.405 ± 0.02 | 168.4 ± 0.36 | 43.19 ± 0.01 |
| DR 7037.01 | 1st | 91.02 ± 0.01 | 152.8 ± 0.14 | 43.97 ± 0.04 |
| DR 7037.01 | 2nd | 87.015 ± 0.01 | 151.2 ± 0.02 | 42.04 ± 0.05 |
| DR 7037.01 | 3rd | 79.995 ± 0.01 | 149.8 ± 0.25 | 38.64 ± 0.05 |
Disclaimer/Publisher’s Note: The statements, opinions and data contained in all publications are solely those of the individual author(s) and contributor(s) and not of MDPI and/or the editor(s). MDPI and/or the editor(s) disclaim responsibility for any injury to people or property resulting from any ideas, methods, instructions or products referred to in the content. |
© 2023 by the authors. Licensee MDPI, Basel, Switzerland. This article is an open access article distributed under the terms and conditions of the Creative Commons Attribution (CC BY) license (https://creativecommons.org/licenses/by/4.0/).
Share and Cite
Pedroso, L.D.; Pontes, A.J.; Alves, A.; Duarte, F.M.; Carneiro, O.S. From Transparent to Opaque: A Route towards Multifunctional Parts Injected with a Single Material. Materials 2023, 16, 6219. https://doi.org/10.3390/ma16186219
Pedroso LD, Pontes AJ, Alves A, Duarte FM, Carneiro OS. From Transparent to Opaque: A Route towards Multifunctional Parts Injected with a Single Material. Materials. 2023; 16(18):6219. https://doi.org/10.3390/ma16186219
Chicago/Turabian StylePedroso, Luís D., António J. Pontes, António Alves, Fernando M. Duarte, and Olga S. Carneiro. 2023. "From Transparent to Opaque: A Route towards Multifunctional Parts Injected with a Single Material" Materials 16, no. 18: 6219. https://doi.org/10.3390/ma16186219