
Hot Deformation Behavior of Hastelloy C276 Alloy: Microstructural Variation and Constitutive Models


Abstract
:1. Introduction
2. Materials and Methodology
3. Results and Discussion
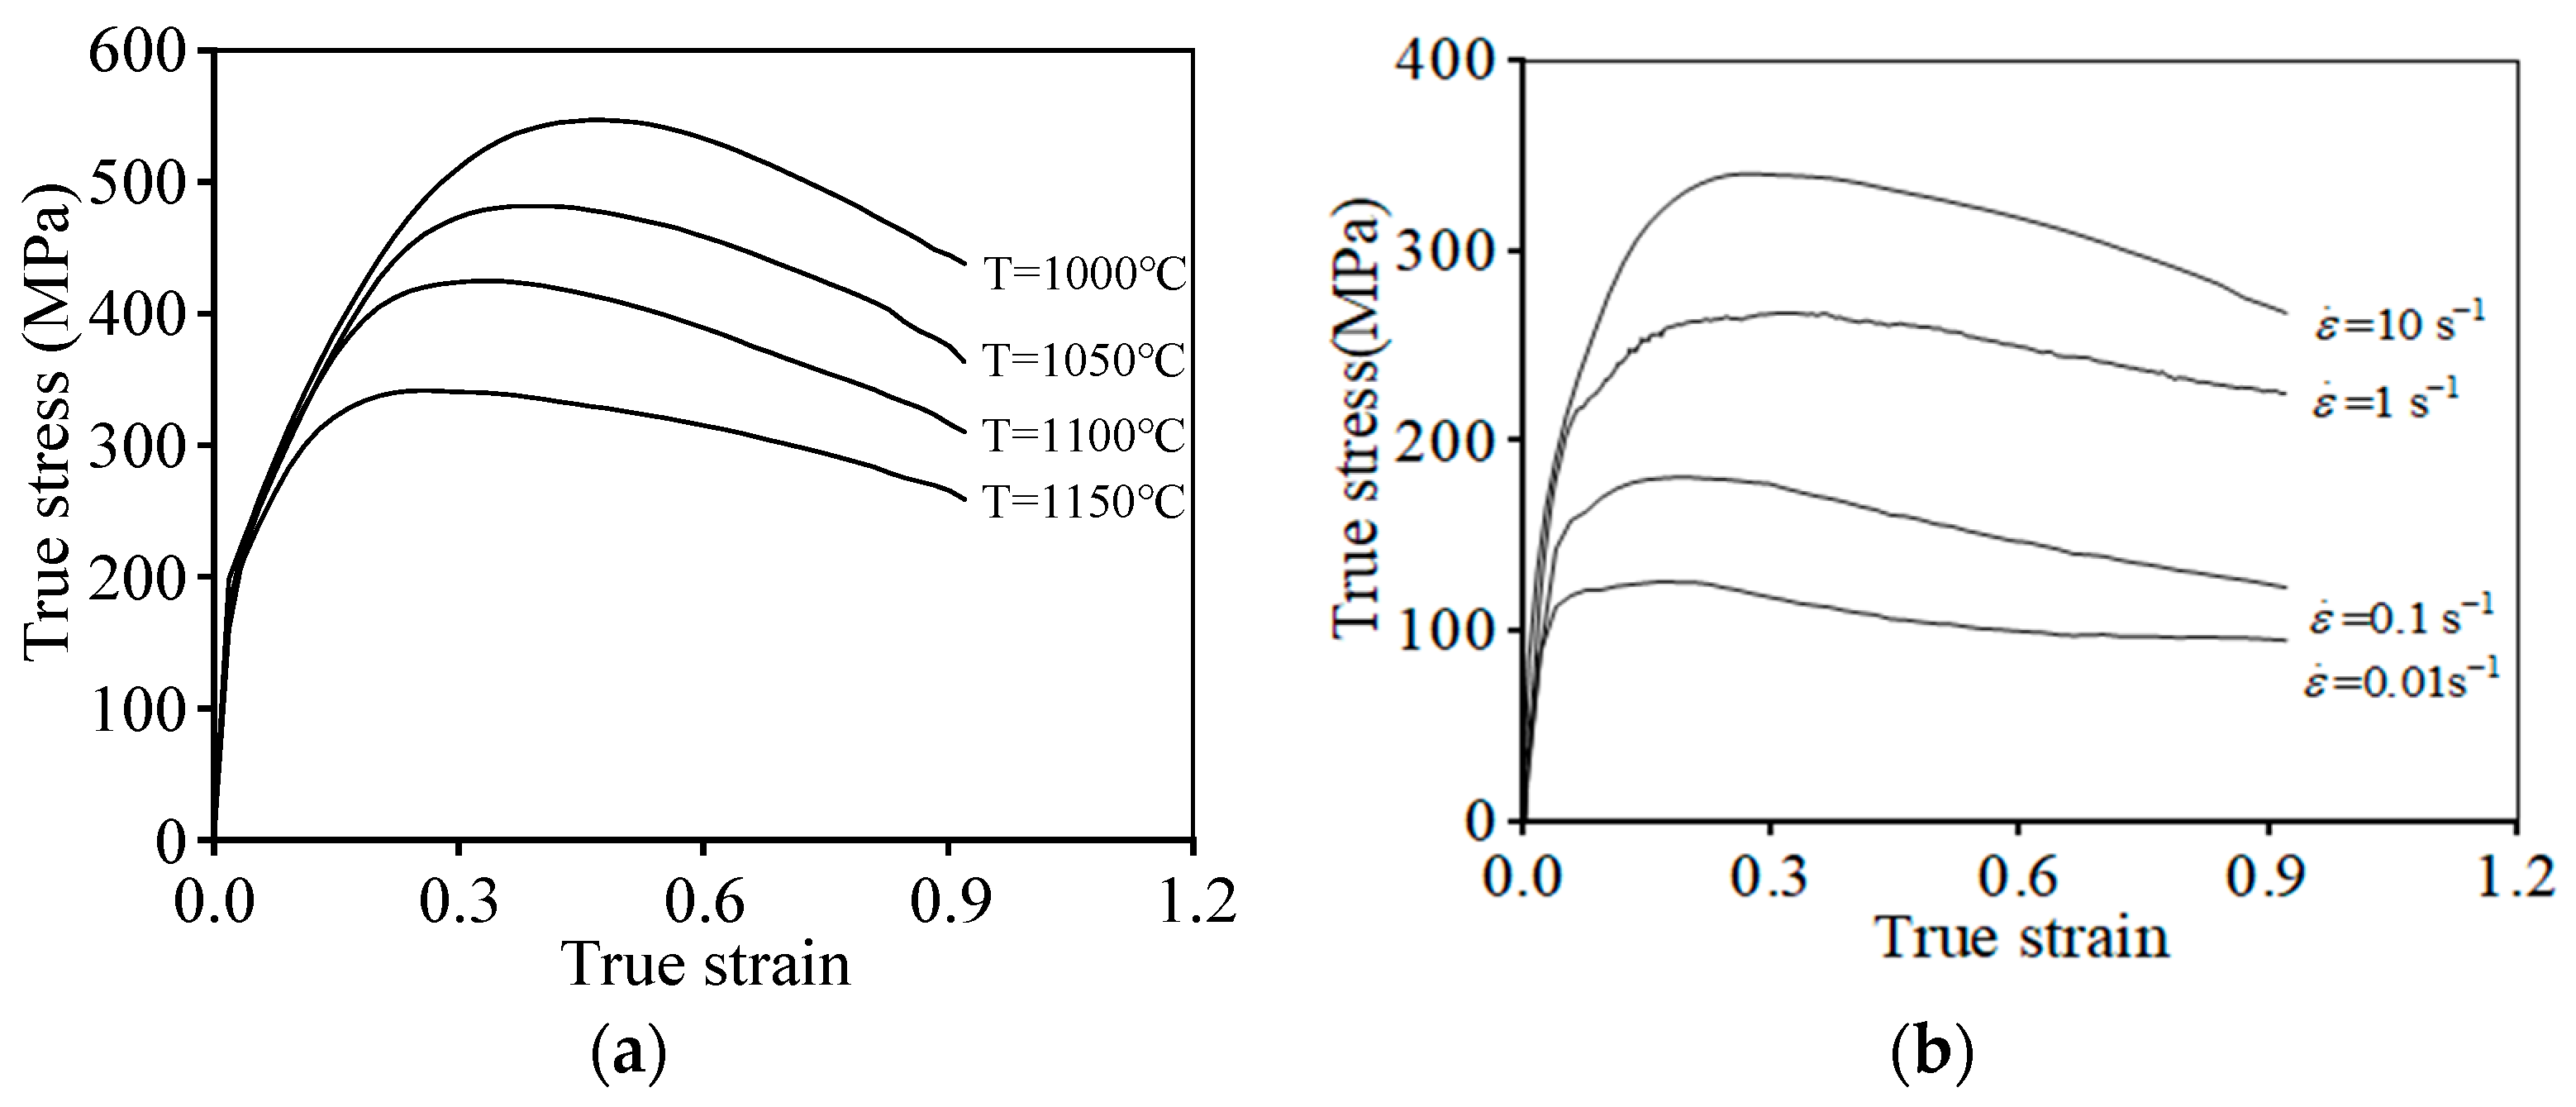
3.1. High-Temperature Flow Behaviors of the Hastelloy C276 Alloy
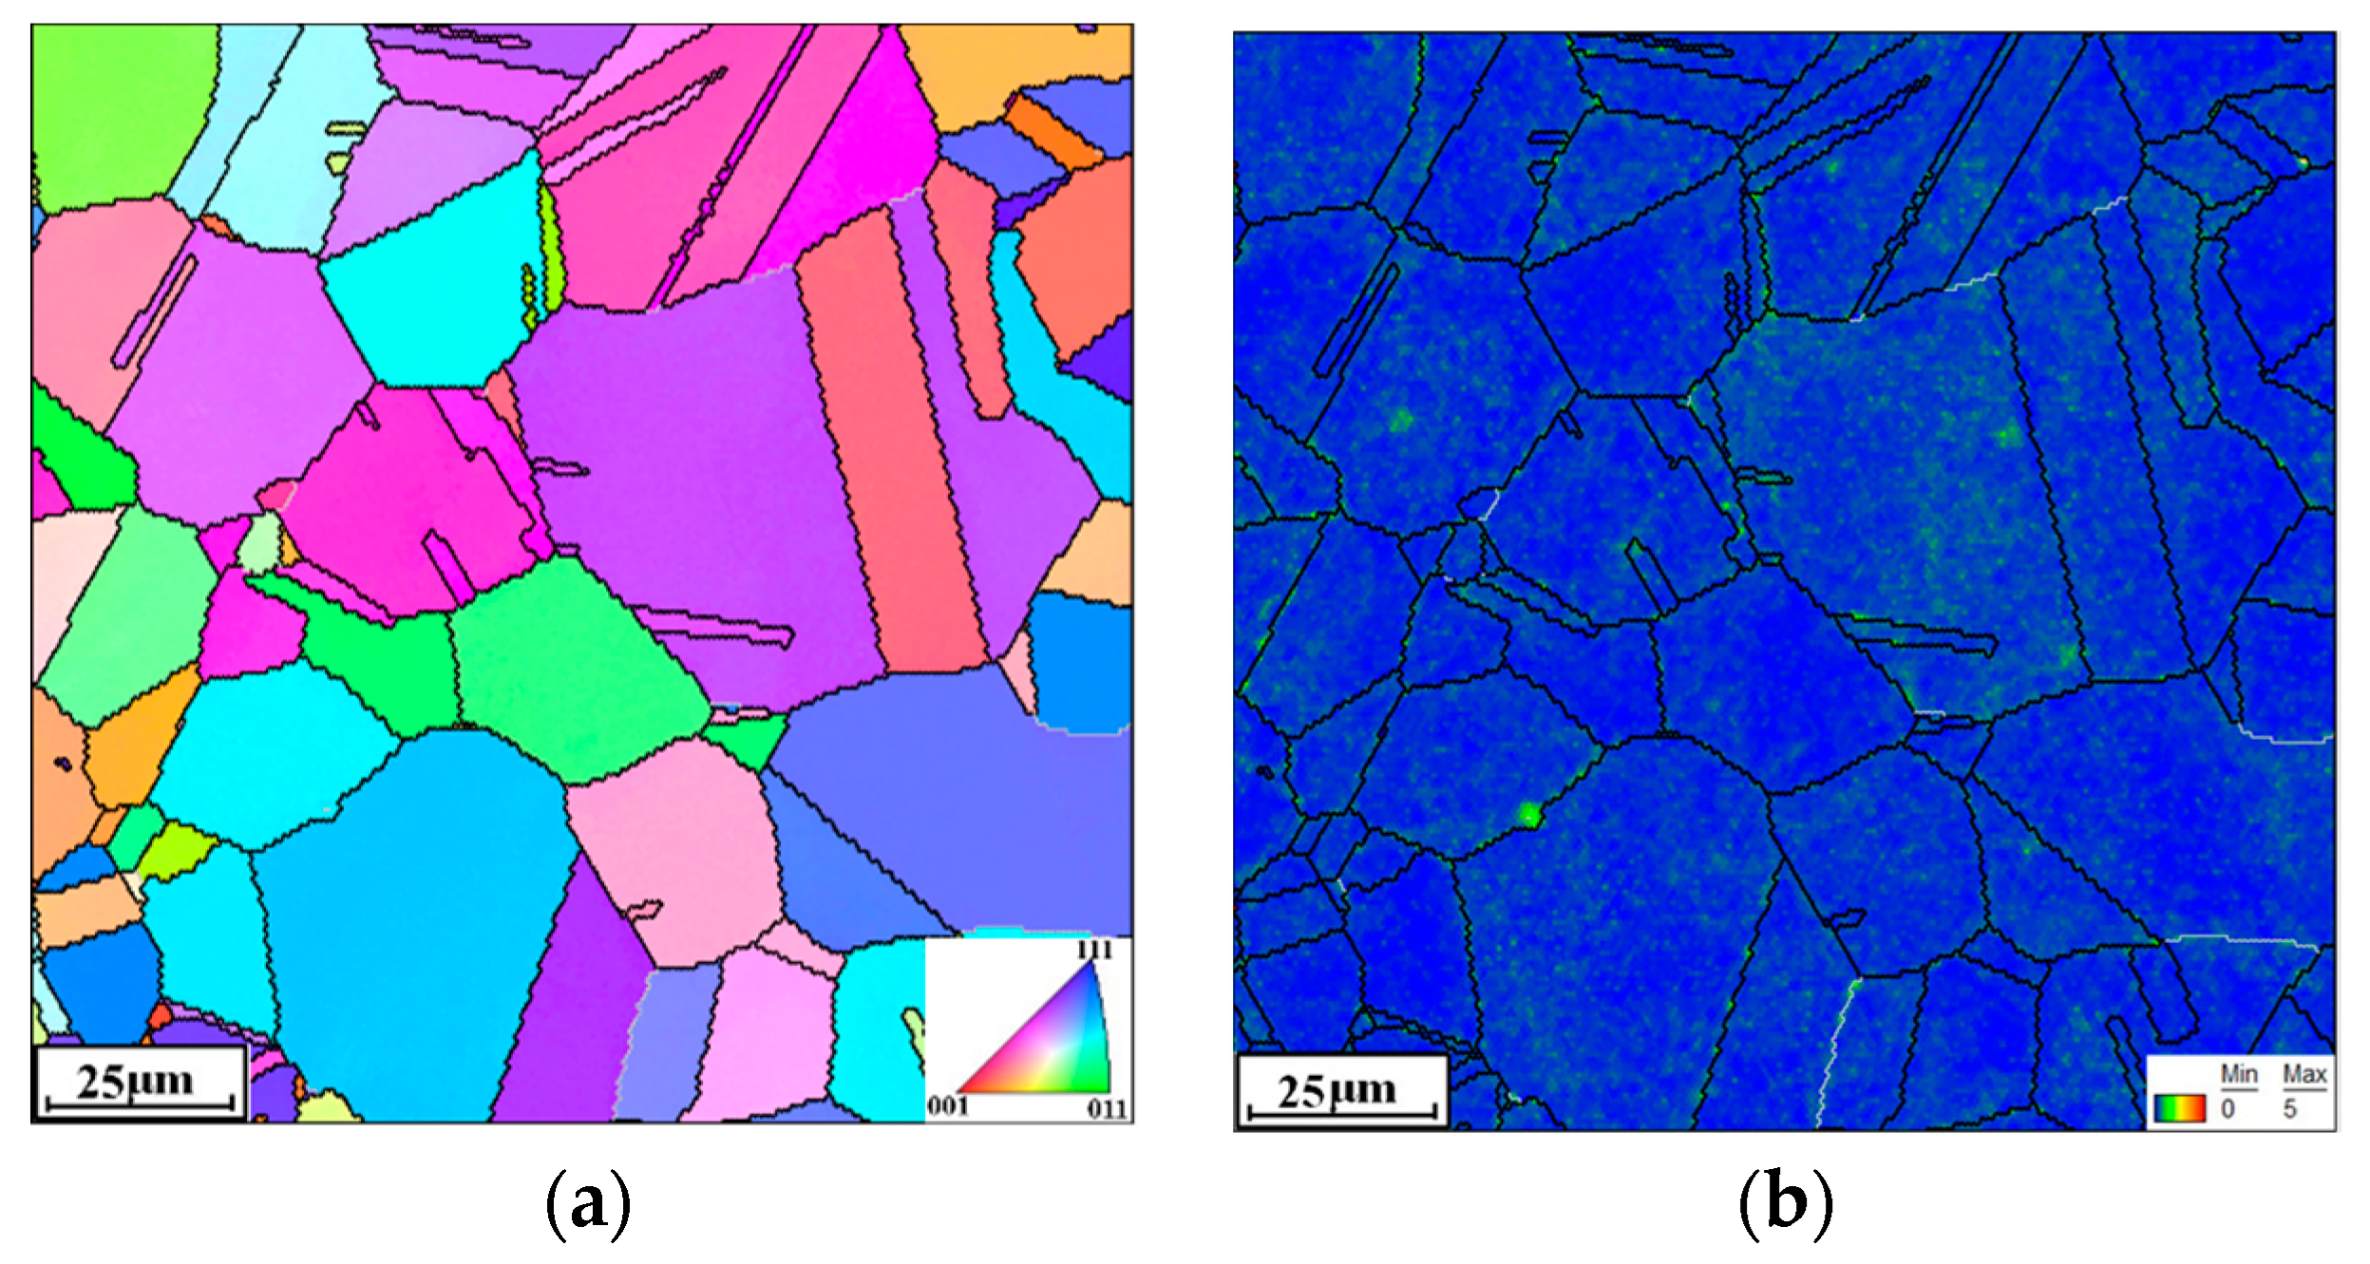
3.2. Microstructure Evolution
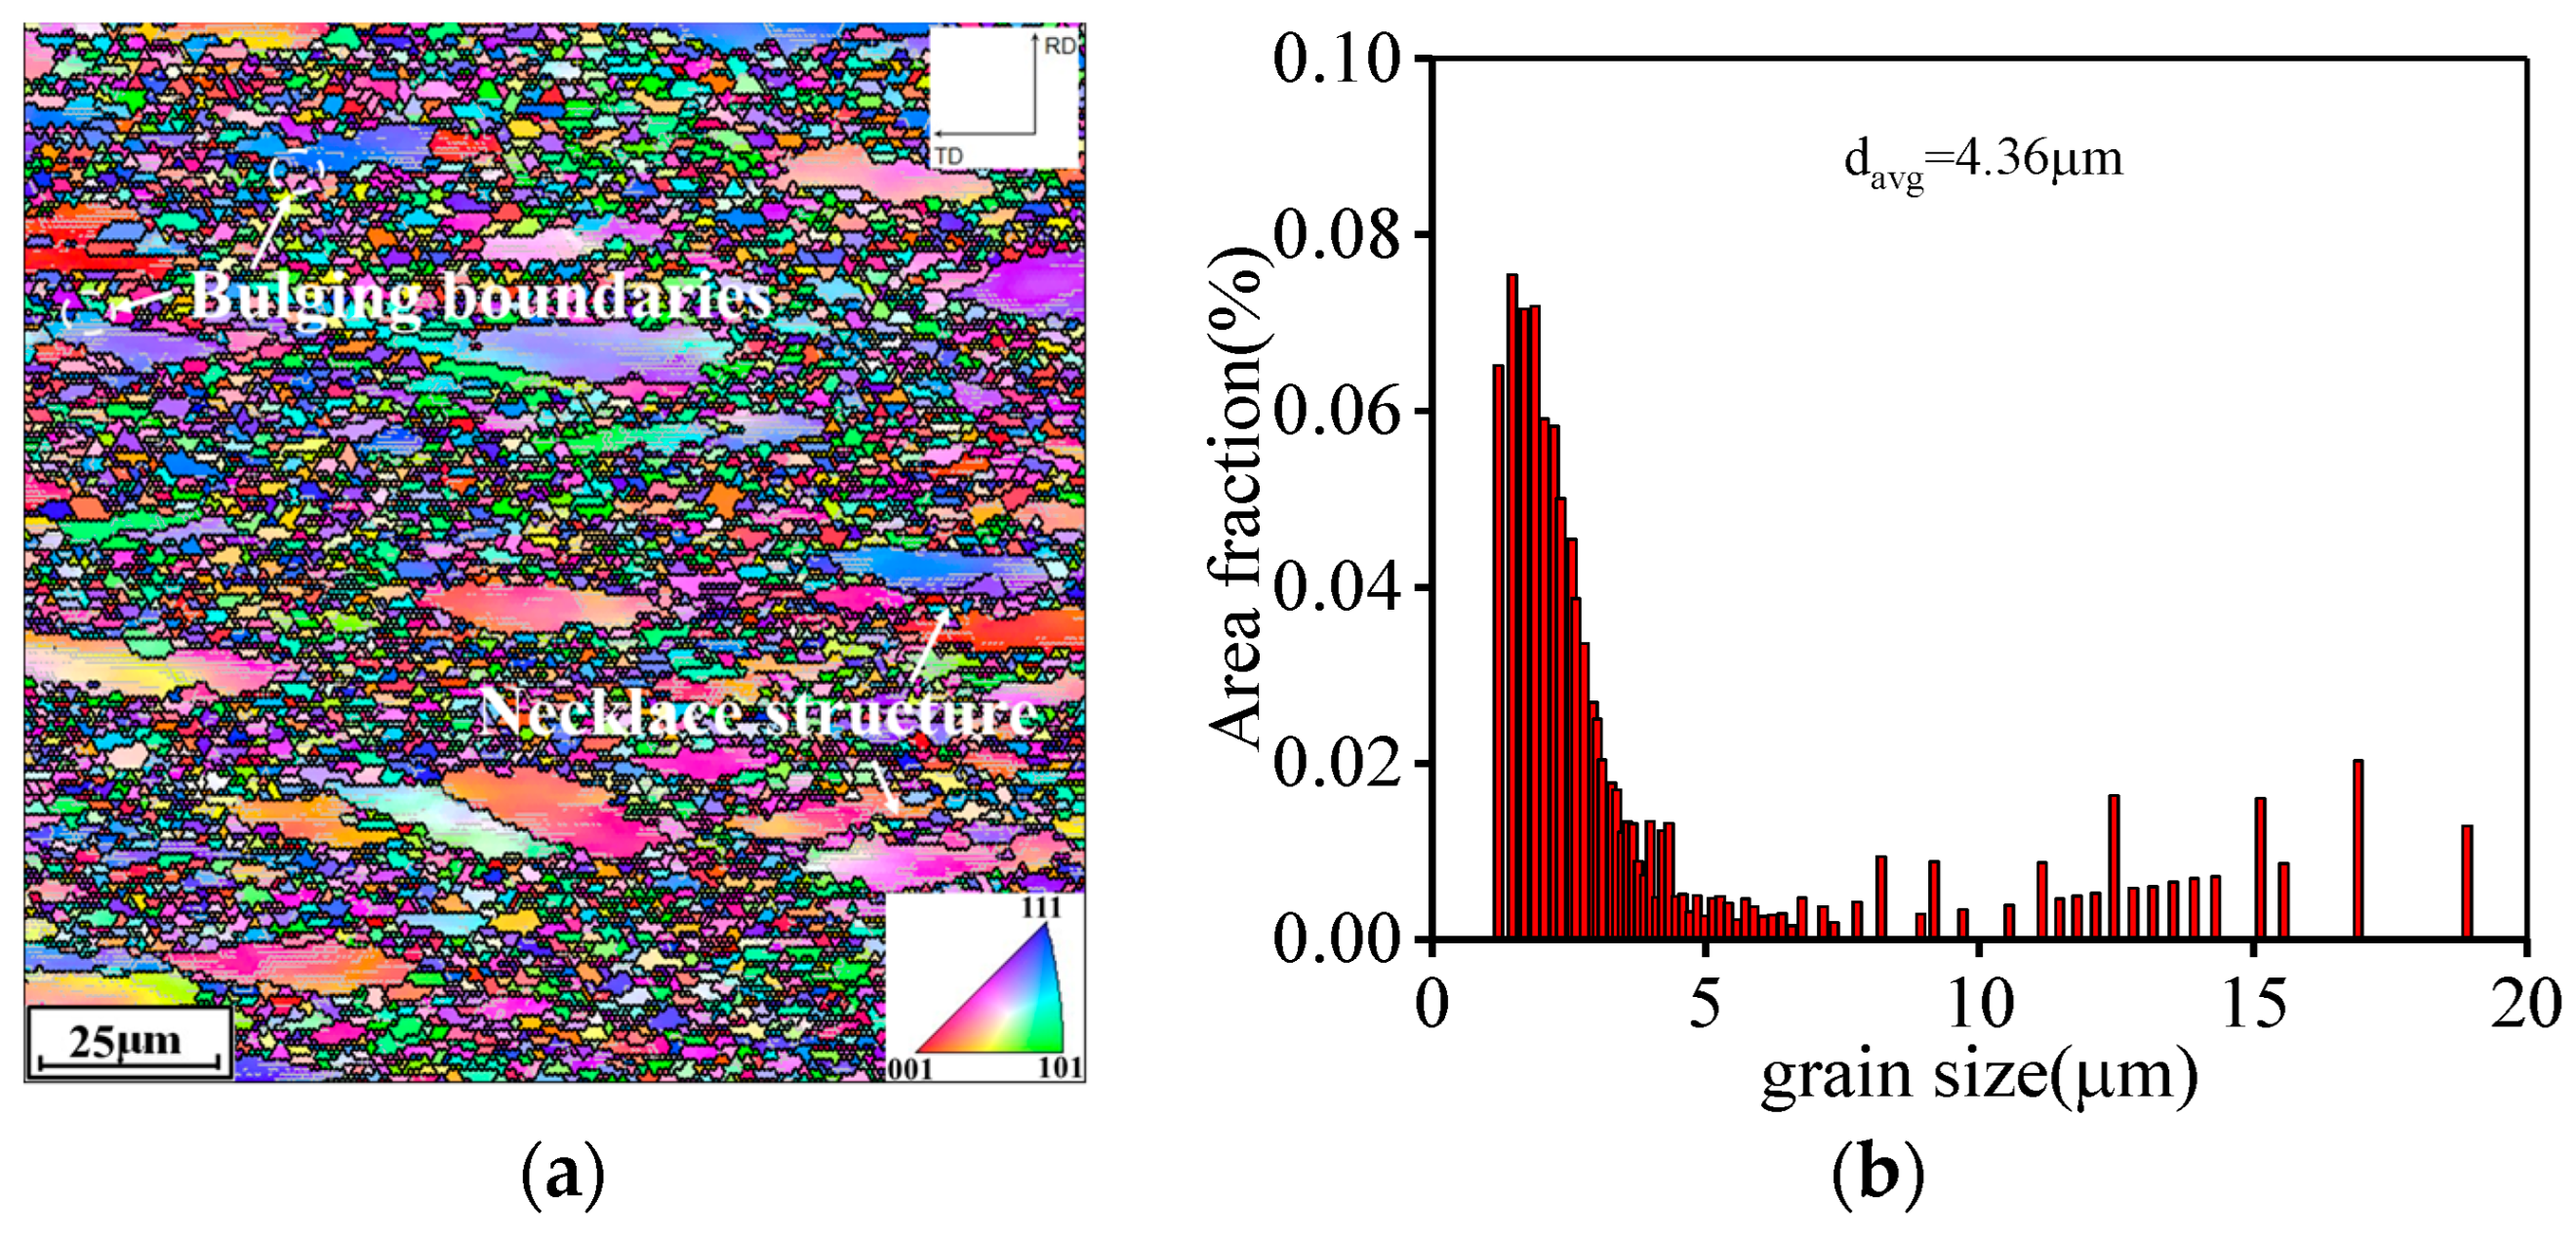
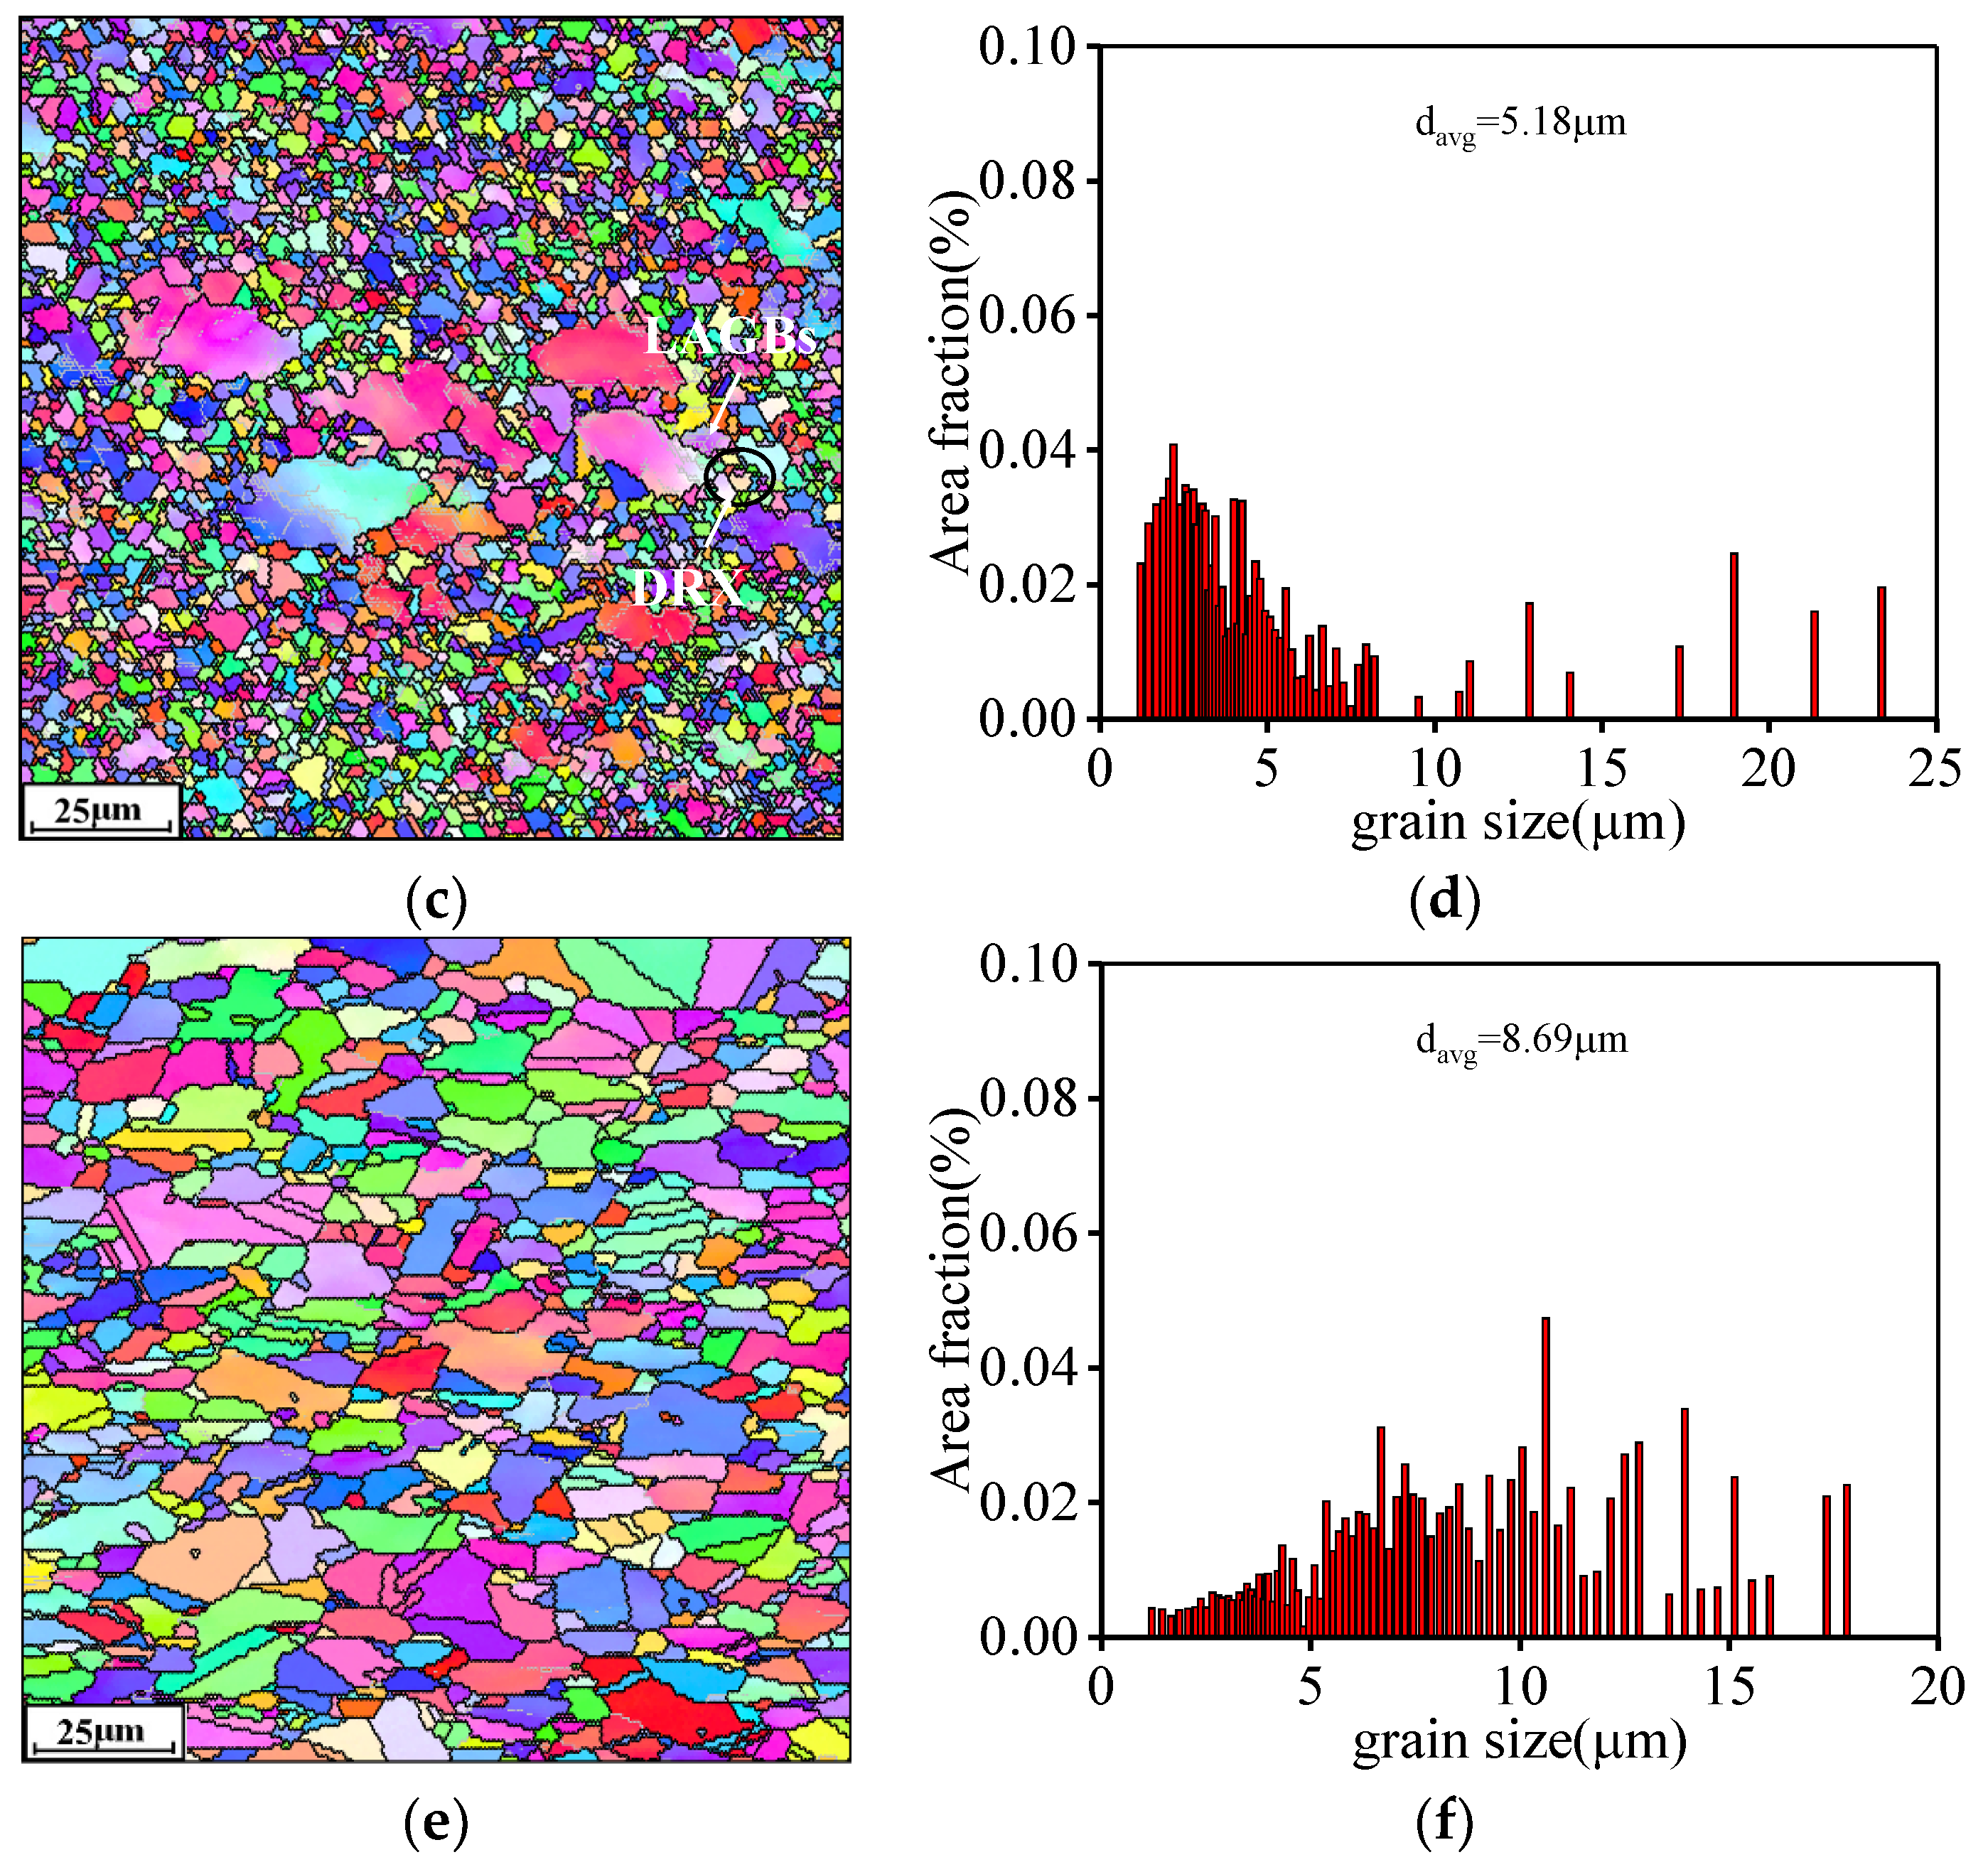
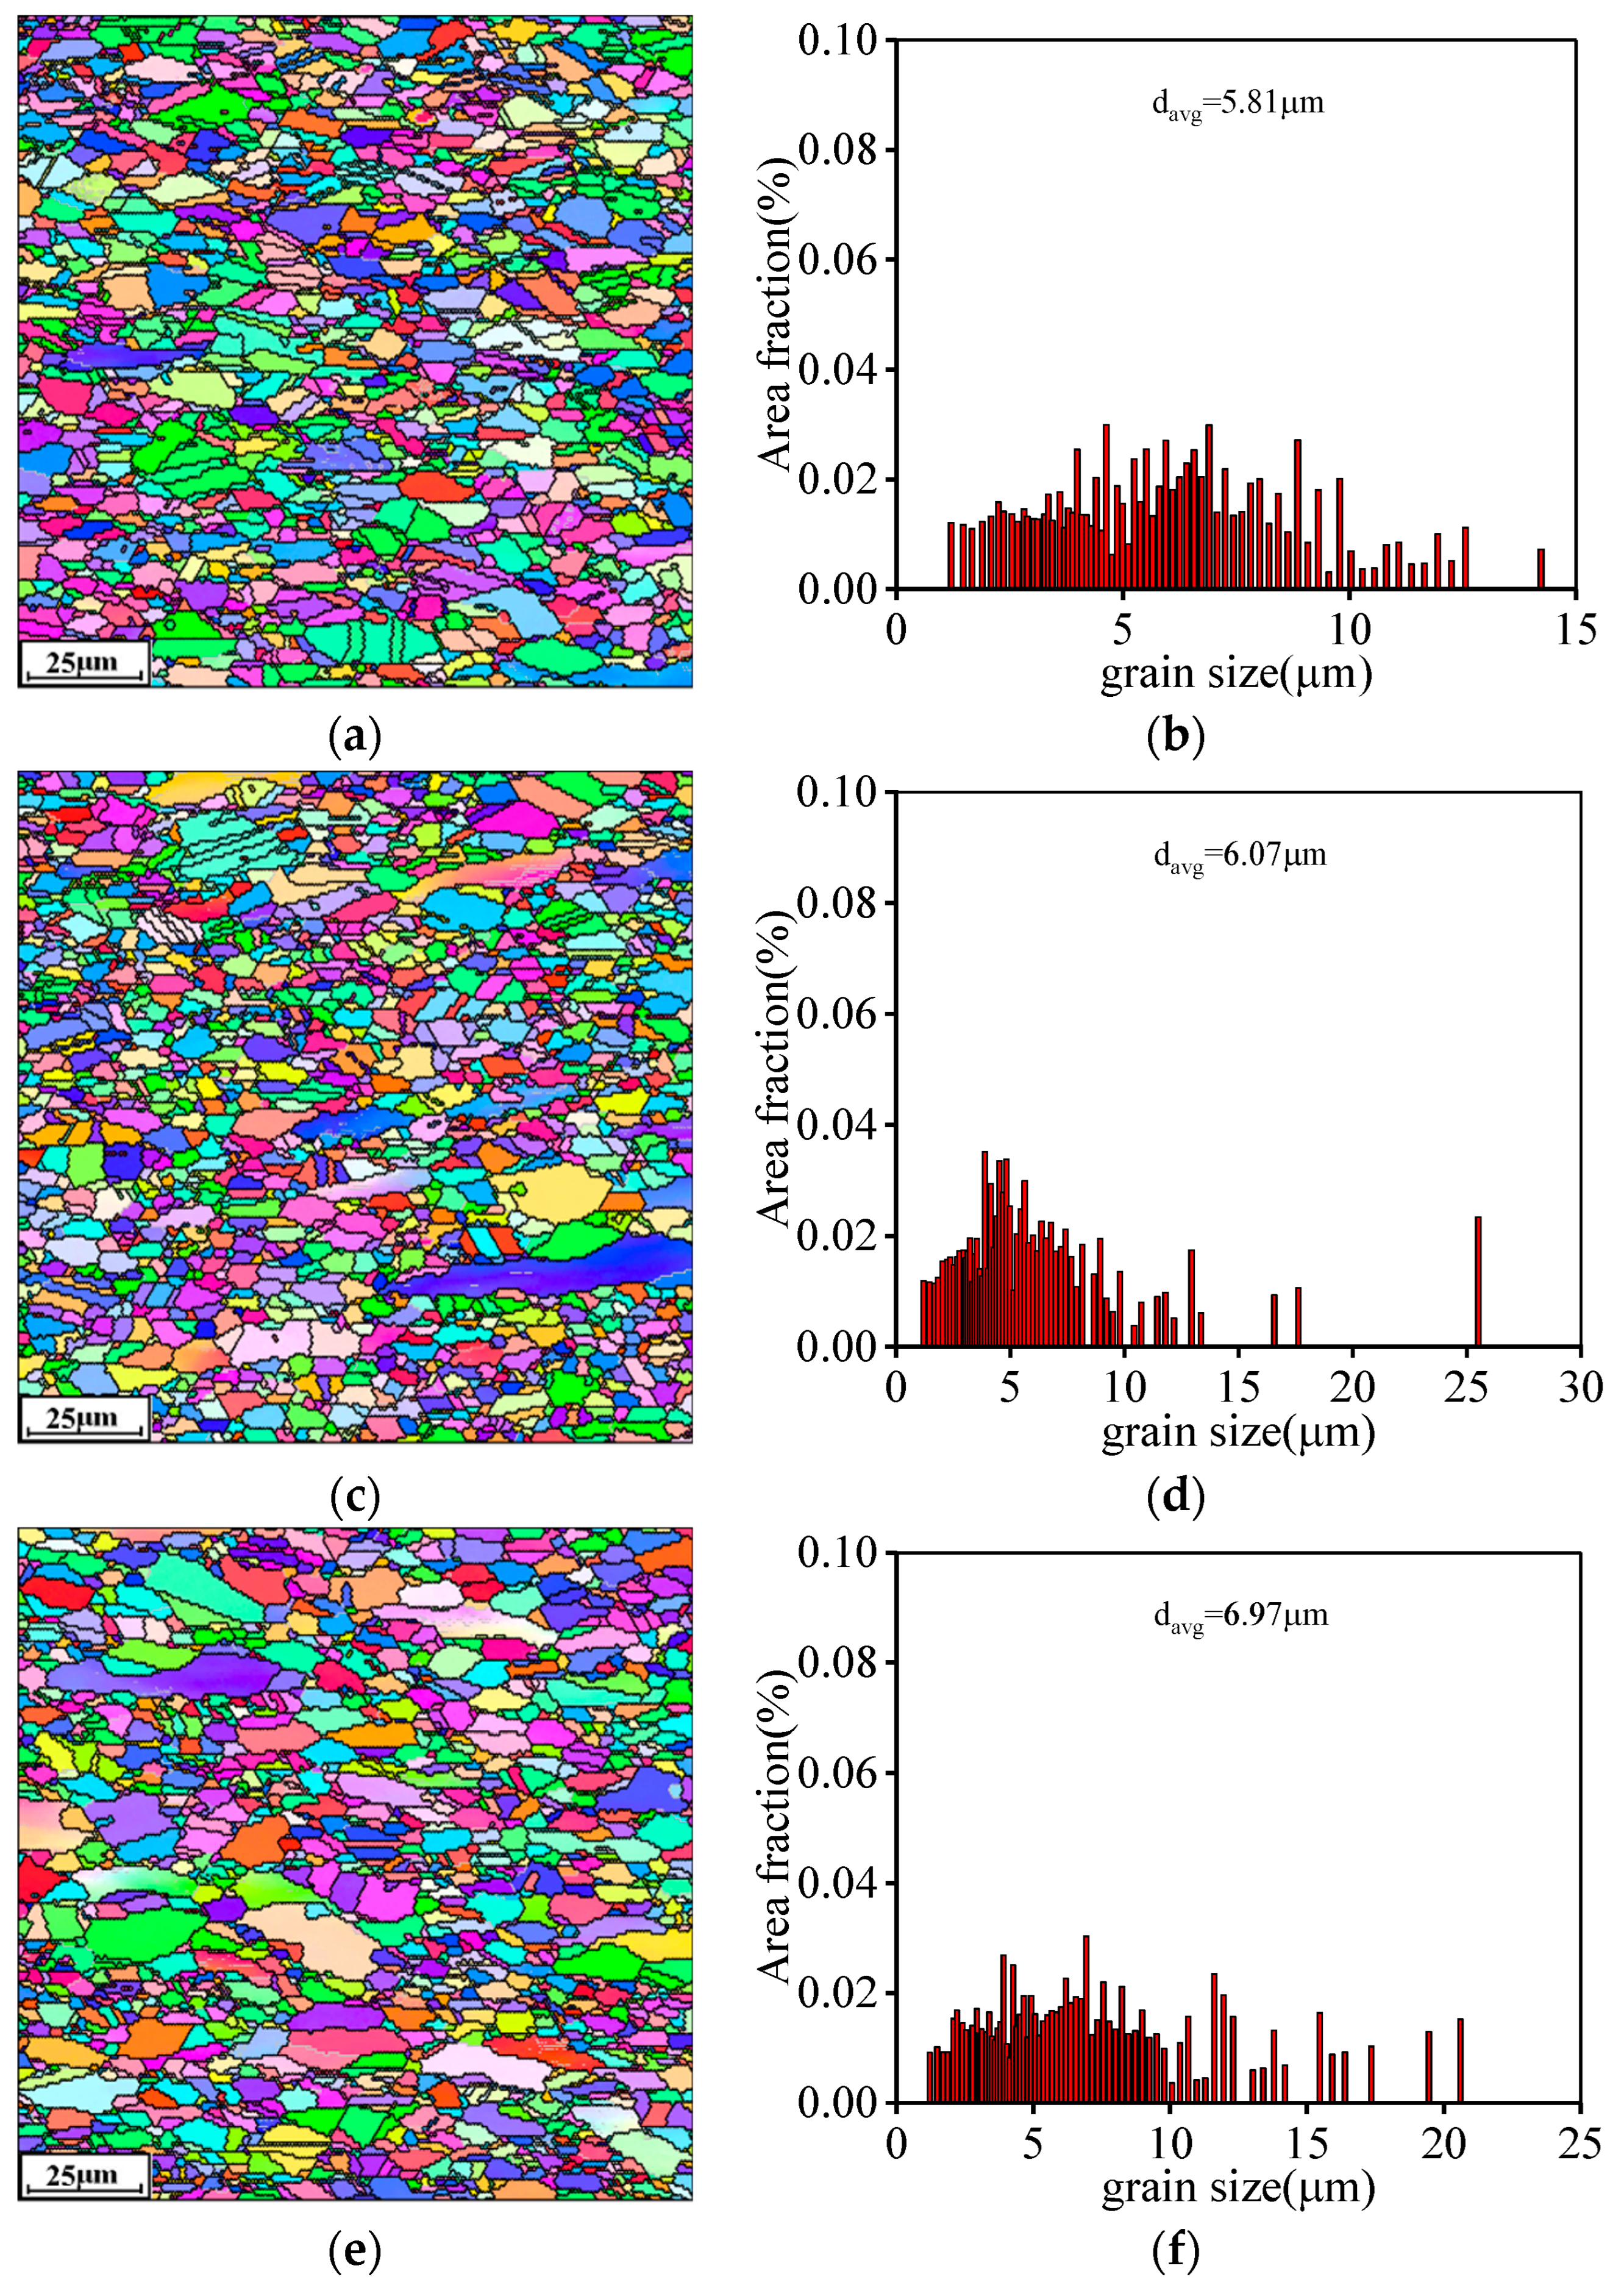
3.2.1. Effects of Compressed Temperature
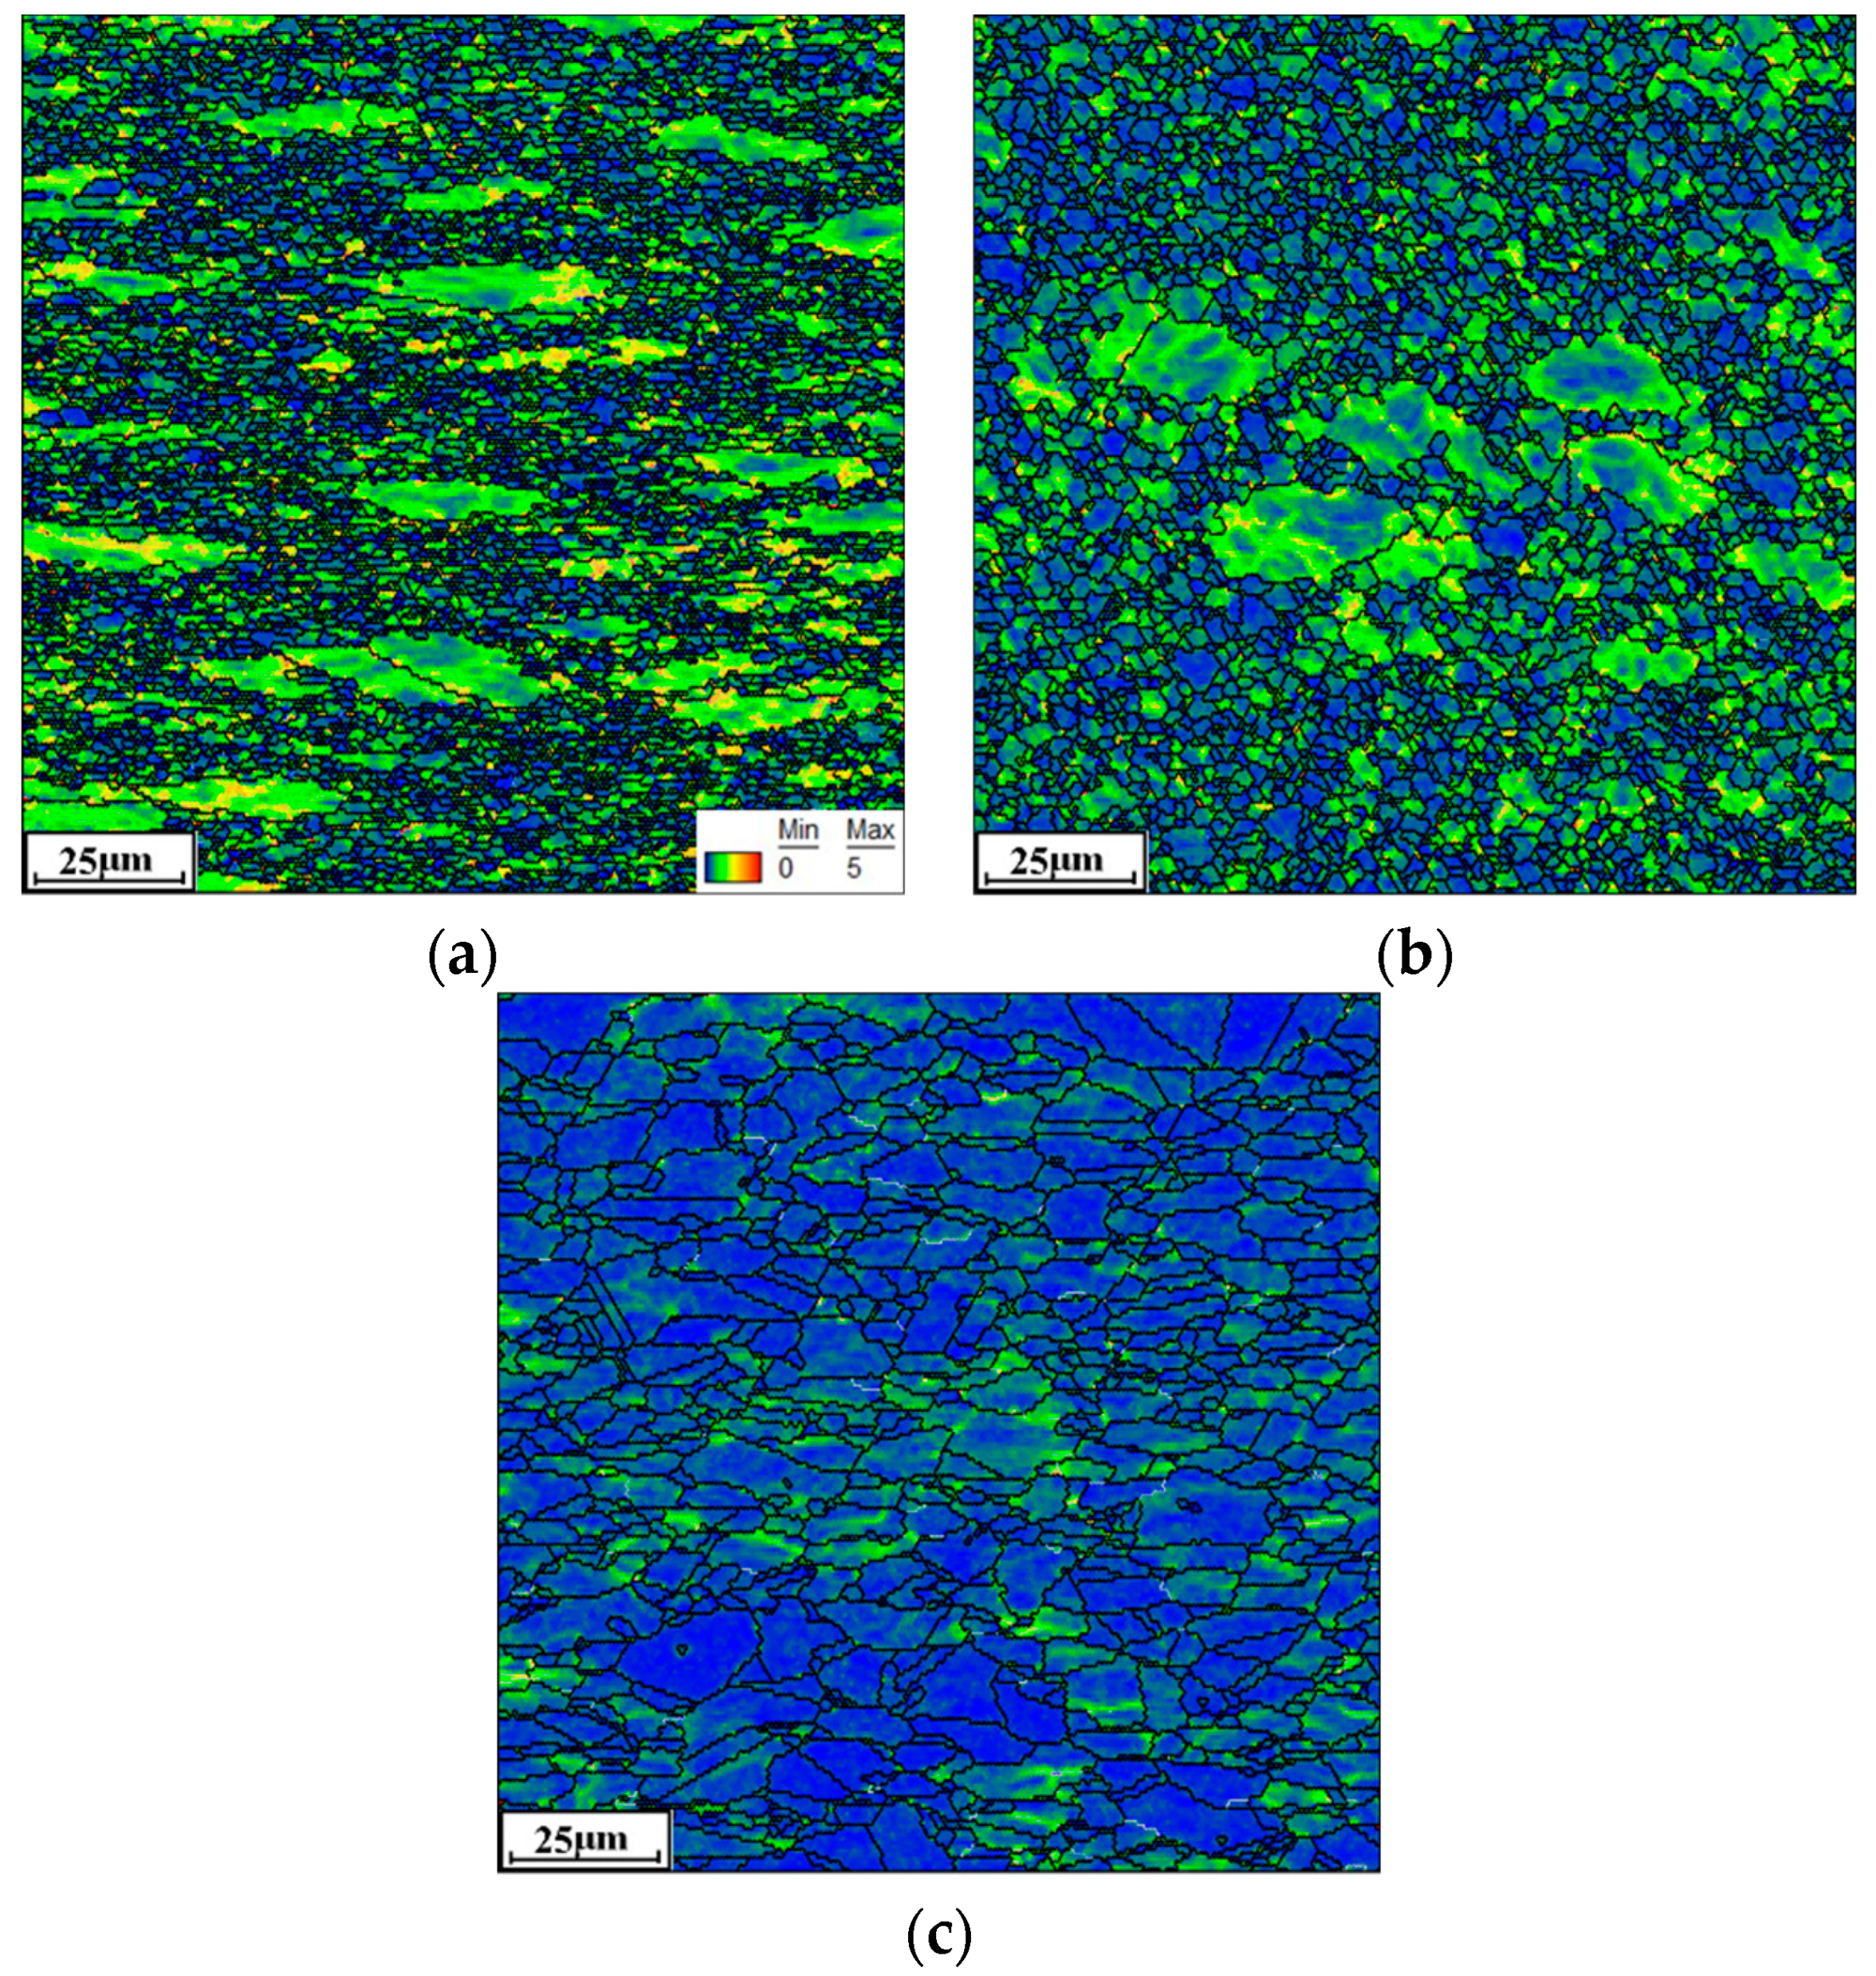
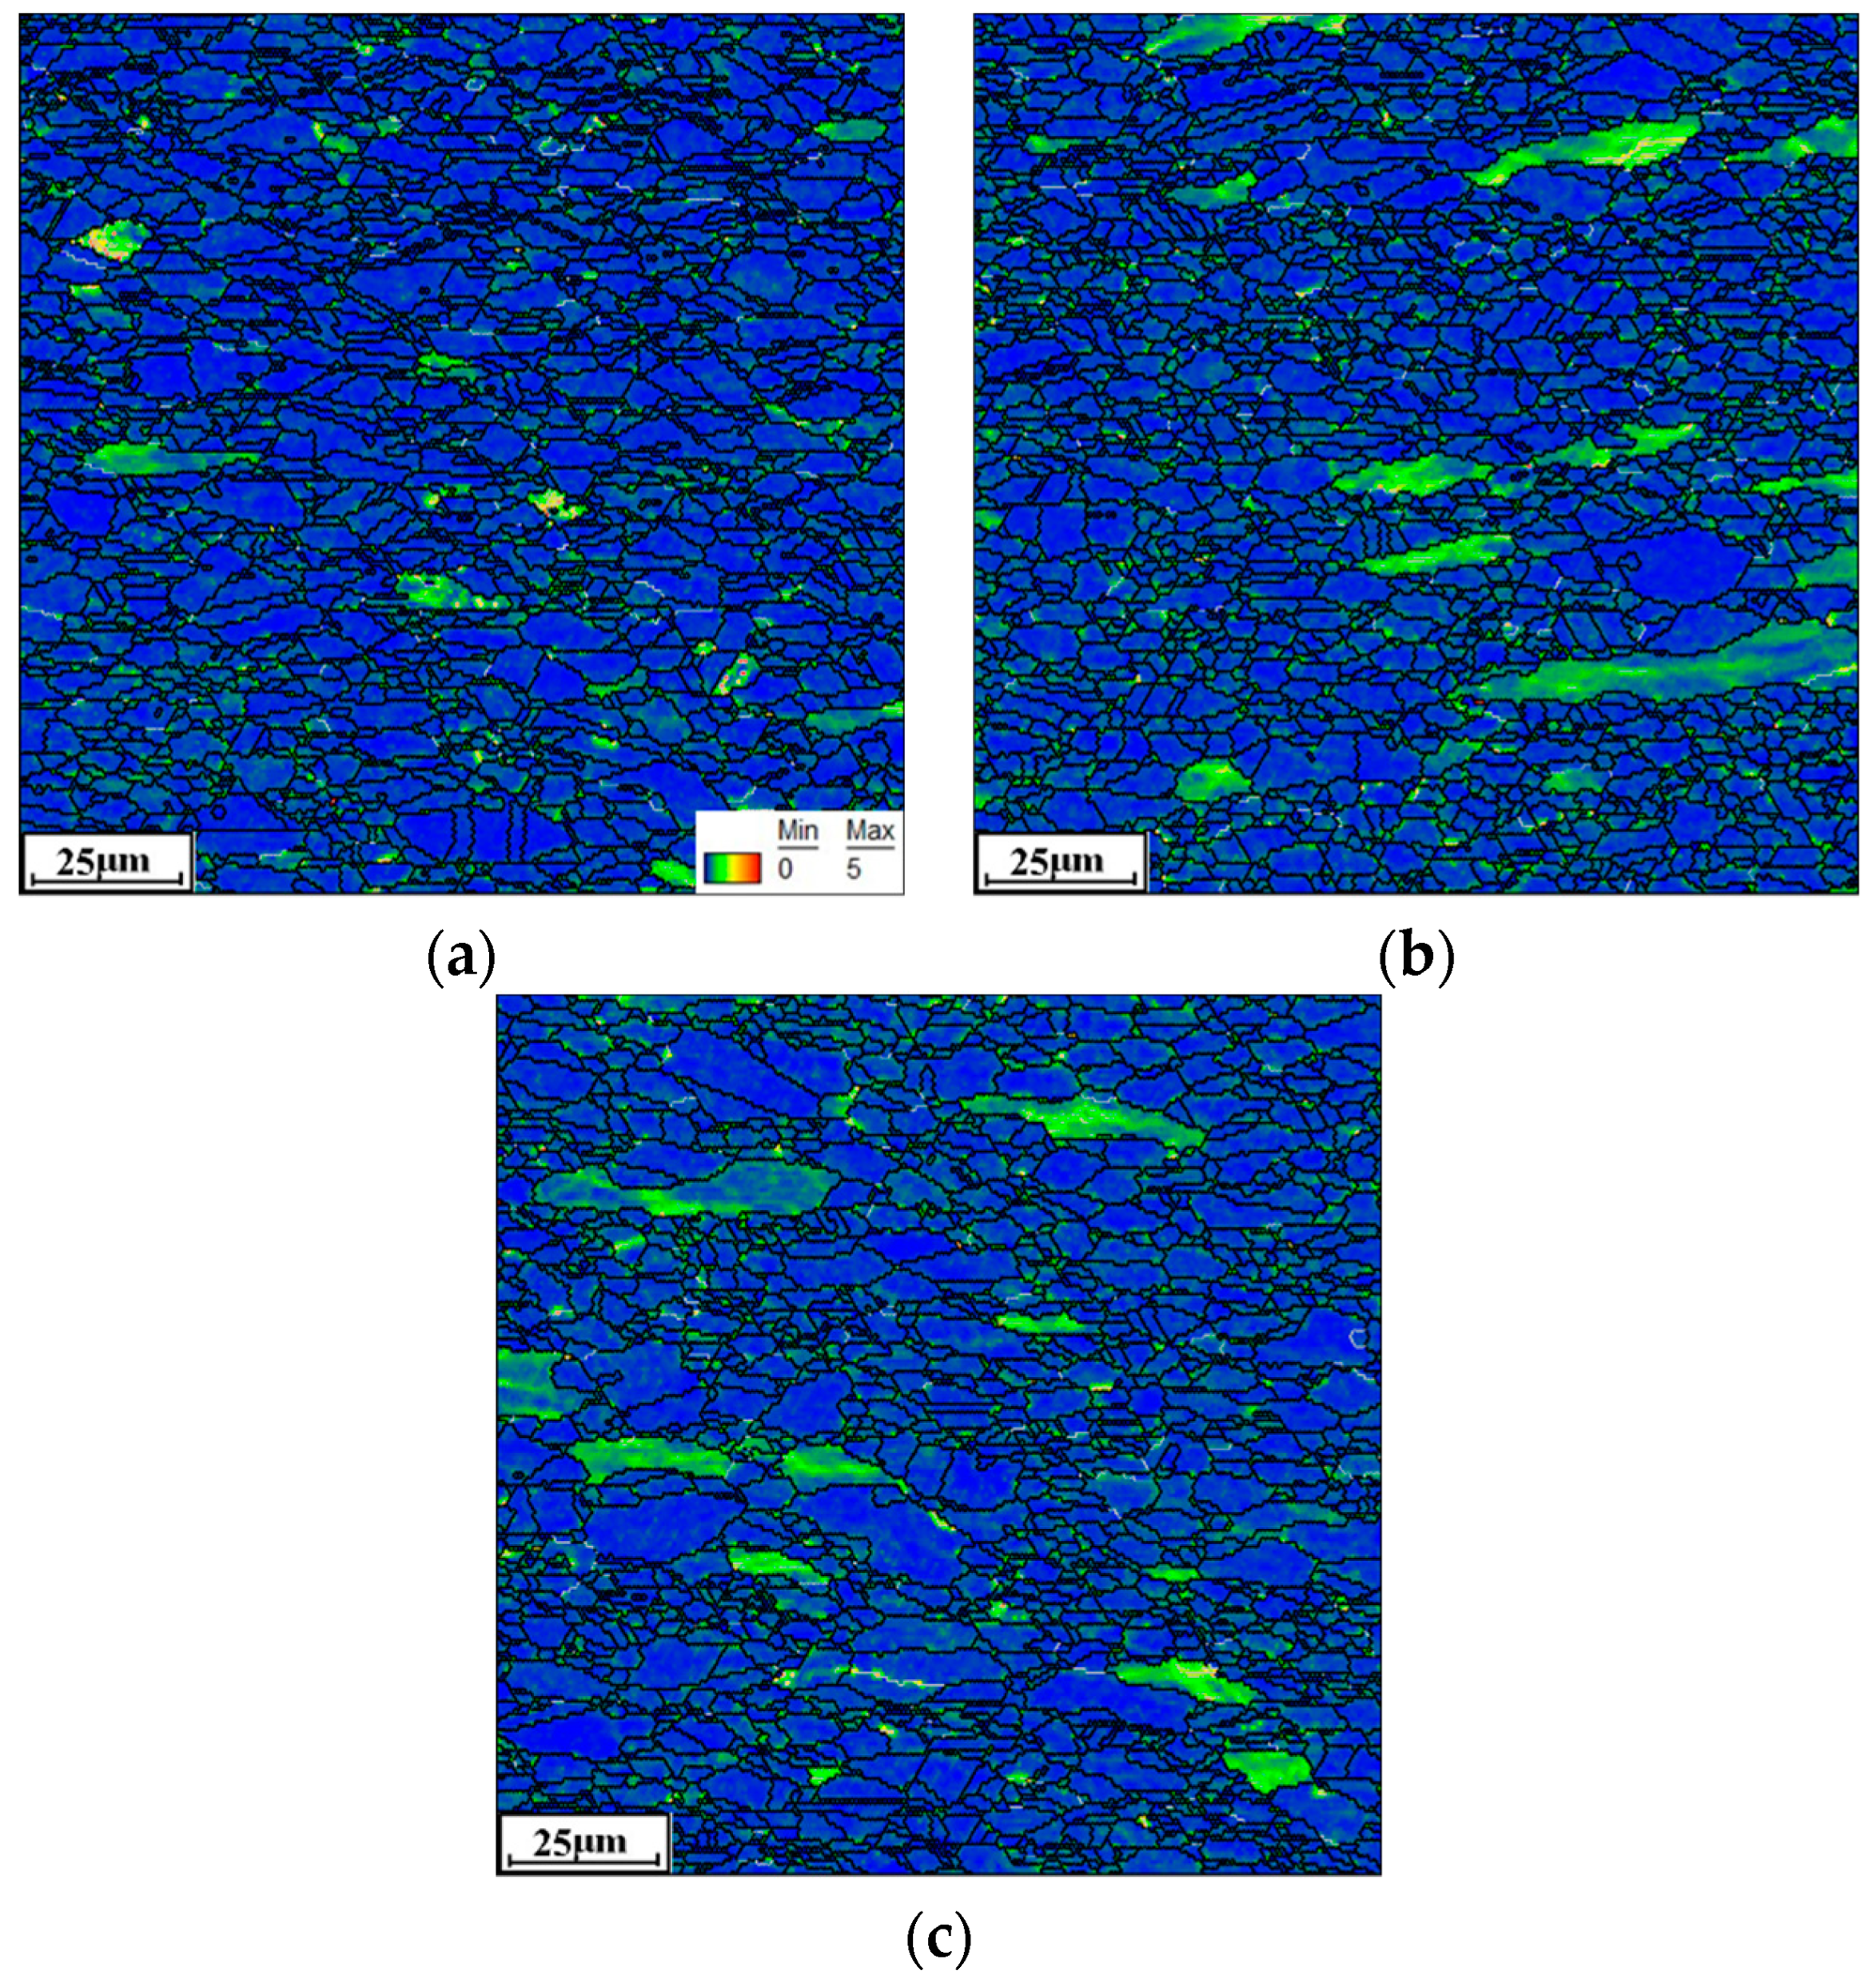
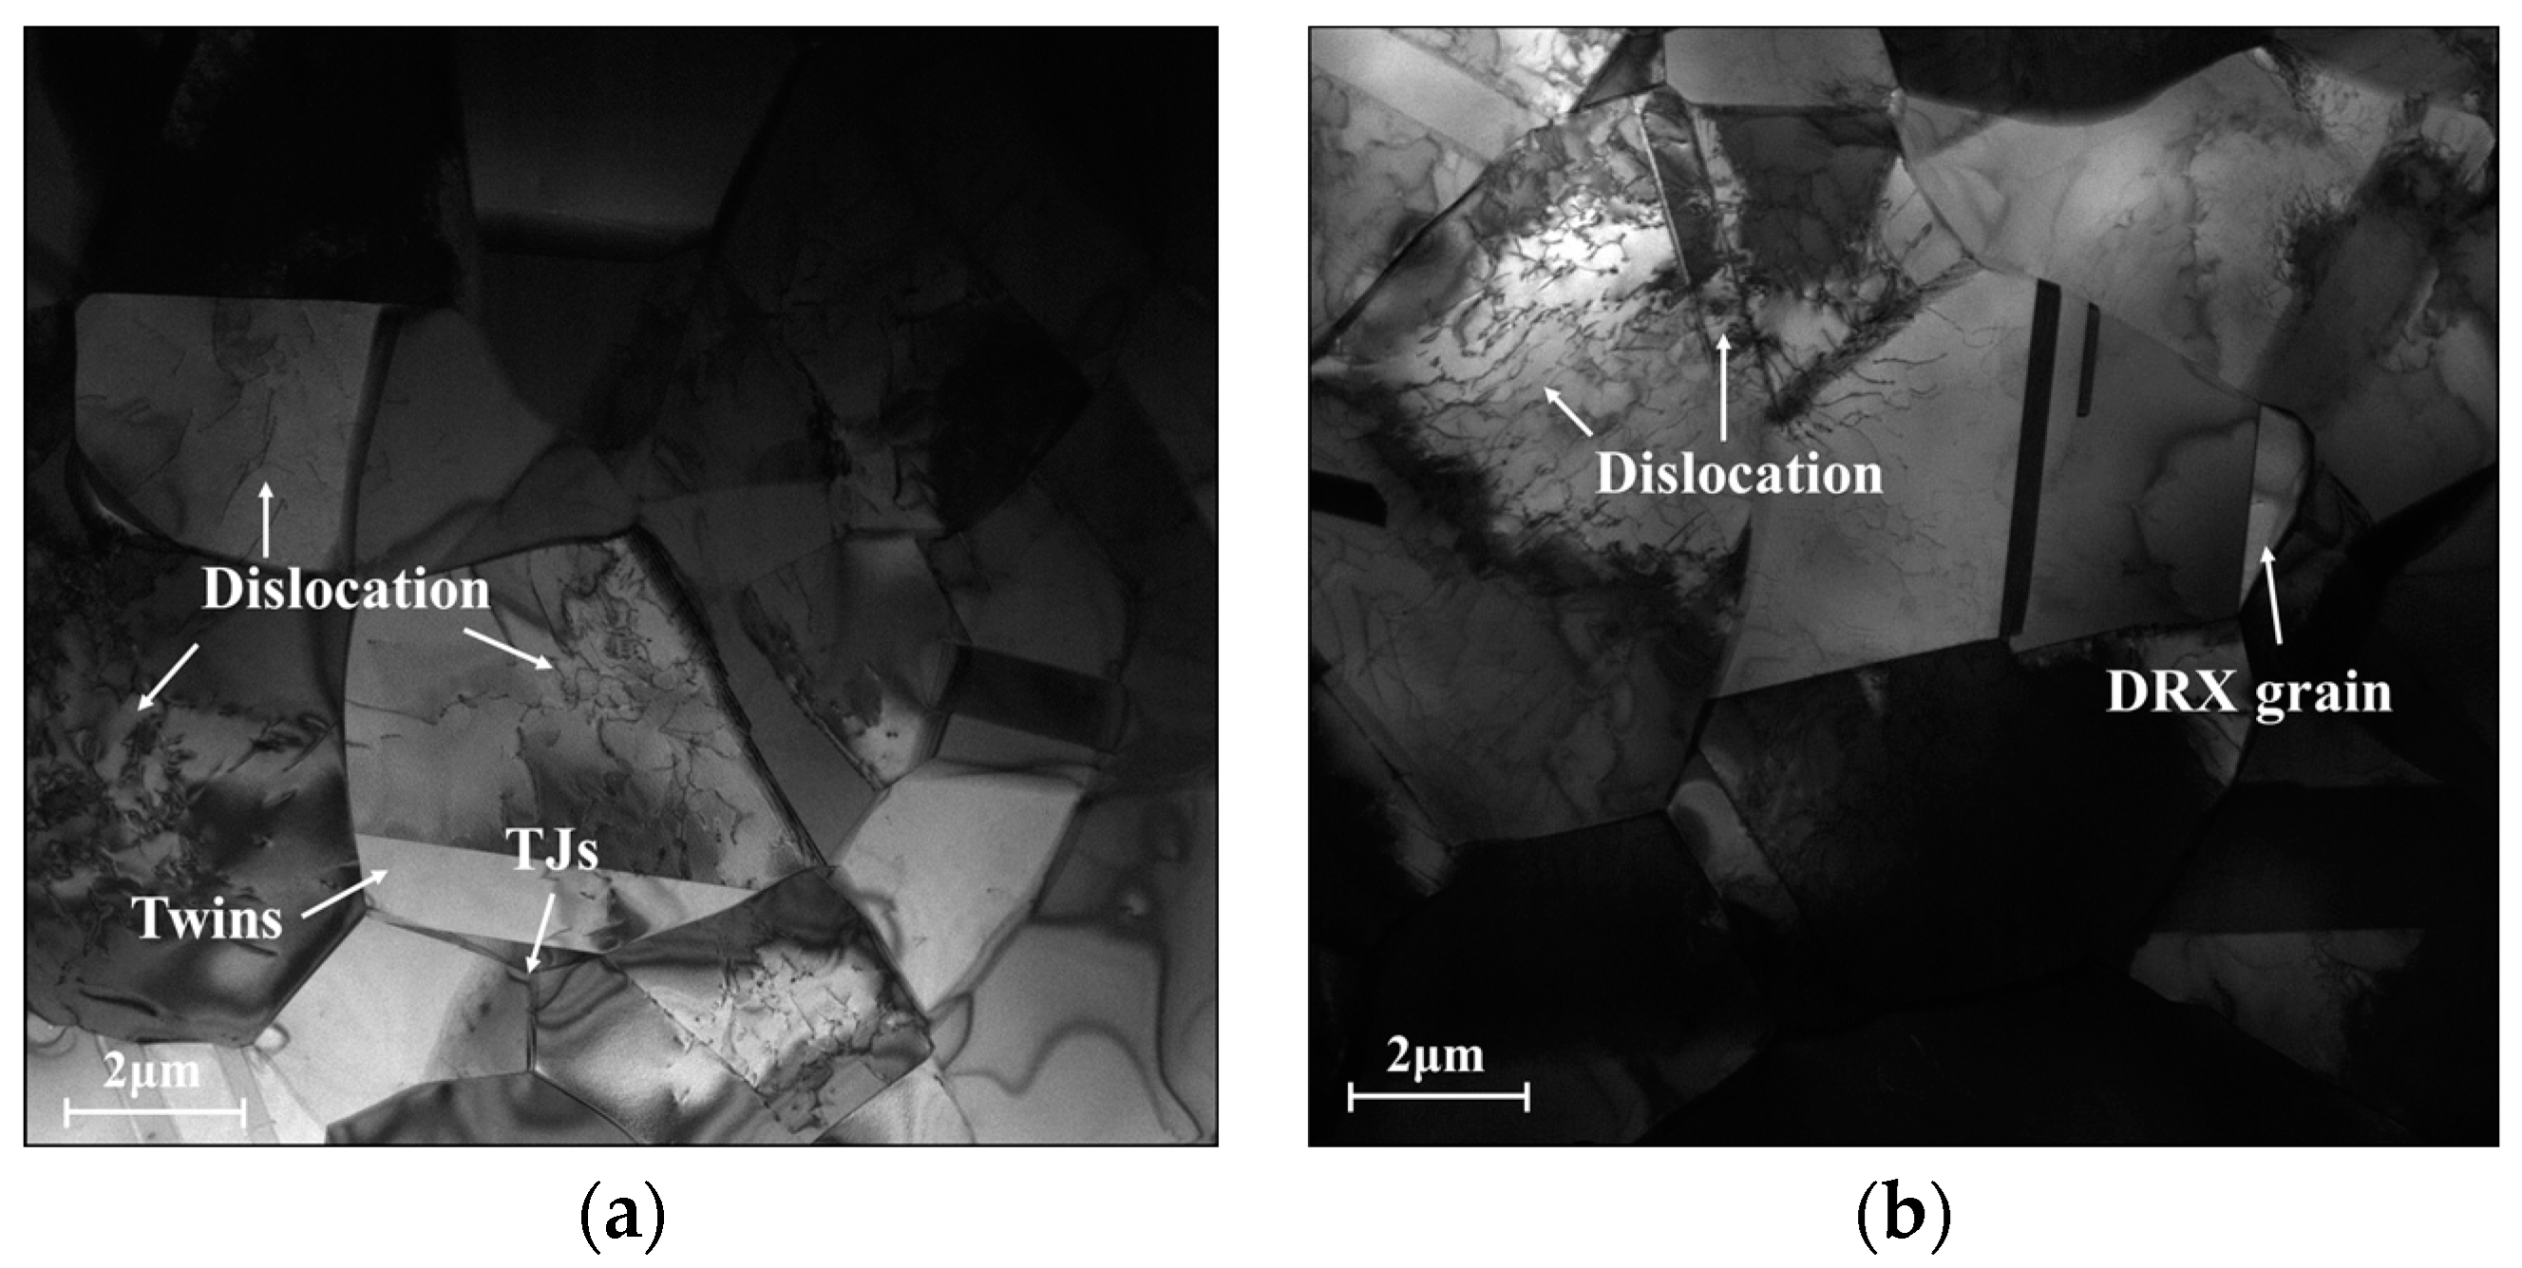
3.2.2. Effects of Strain Rate
3.3. Physically Based Constitutive Model
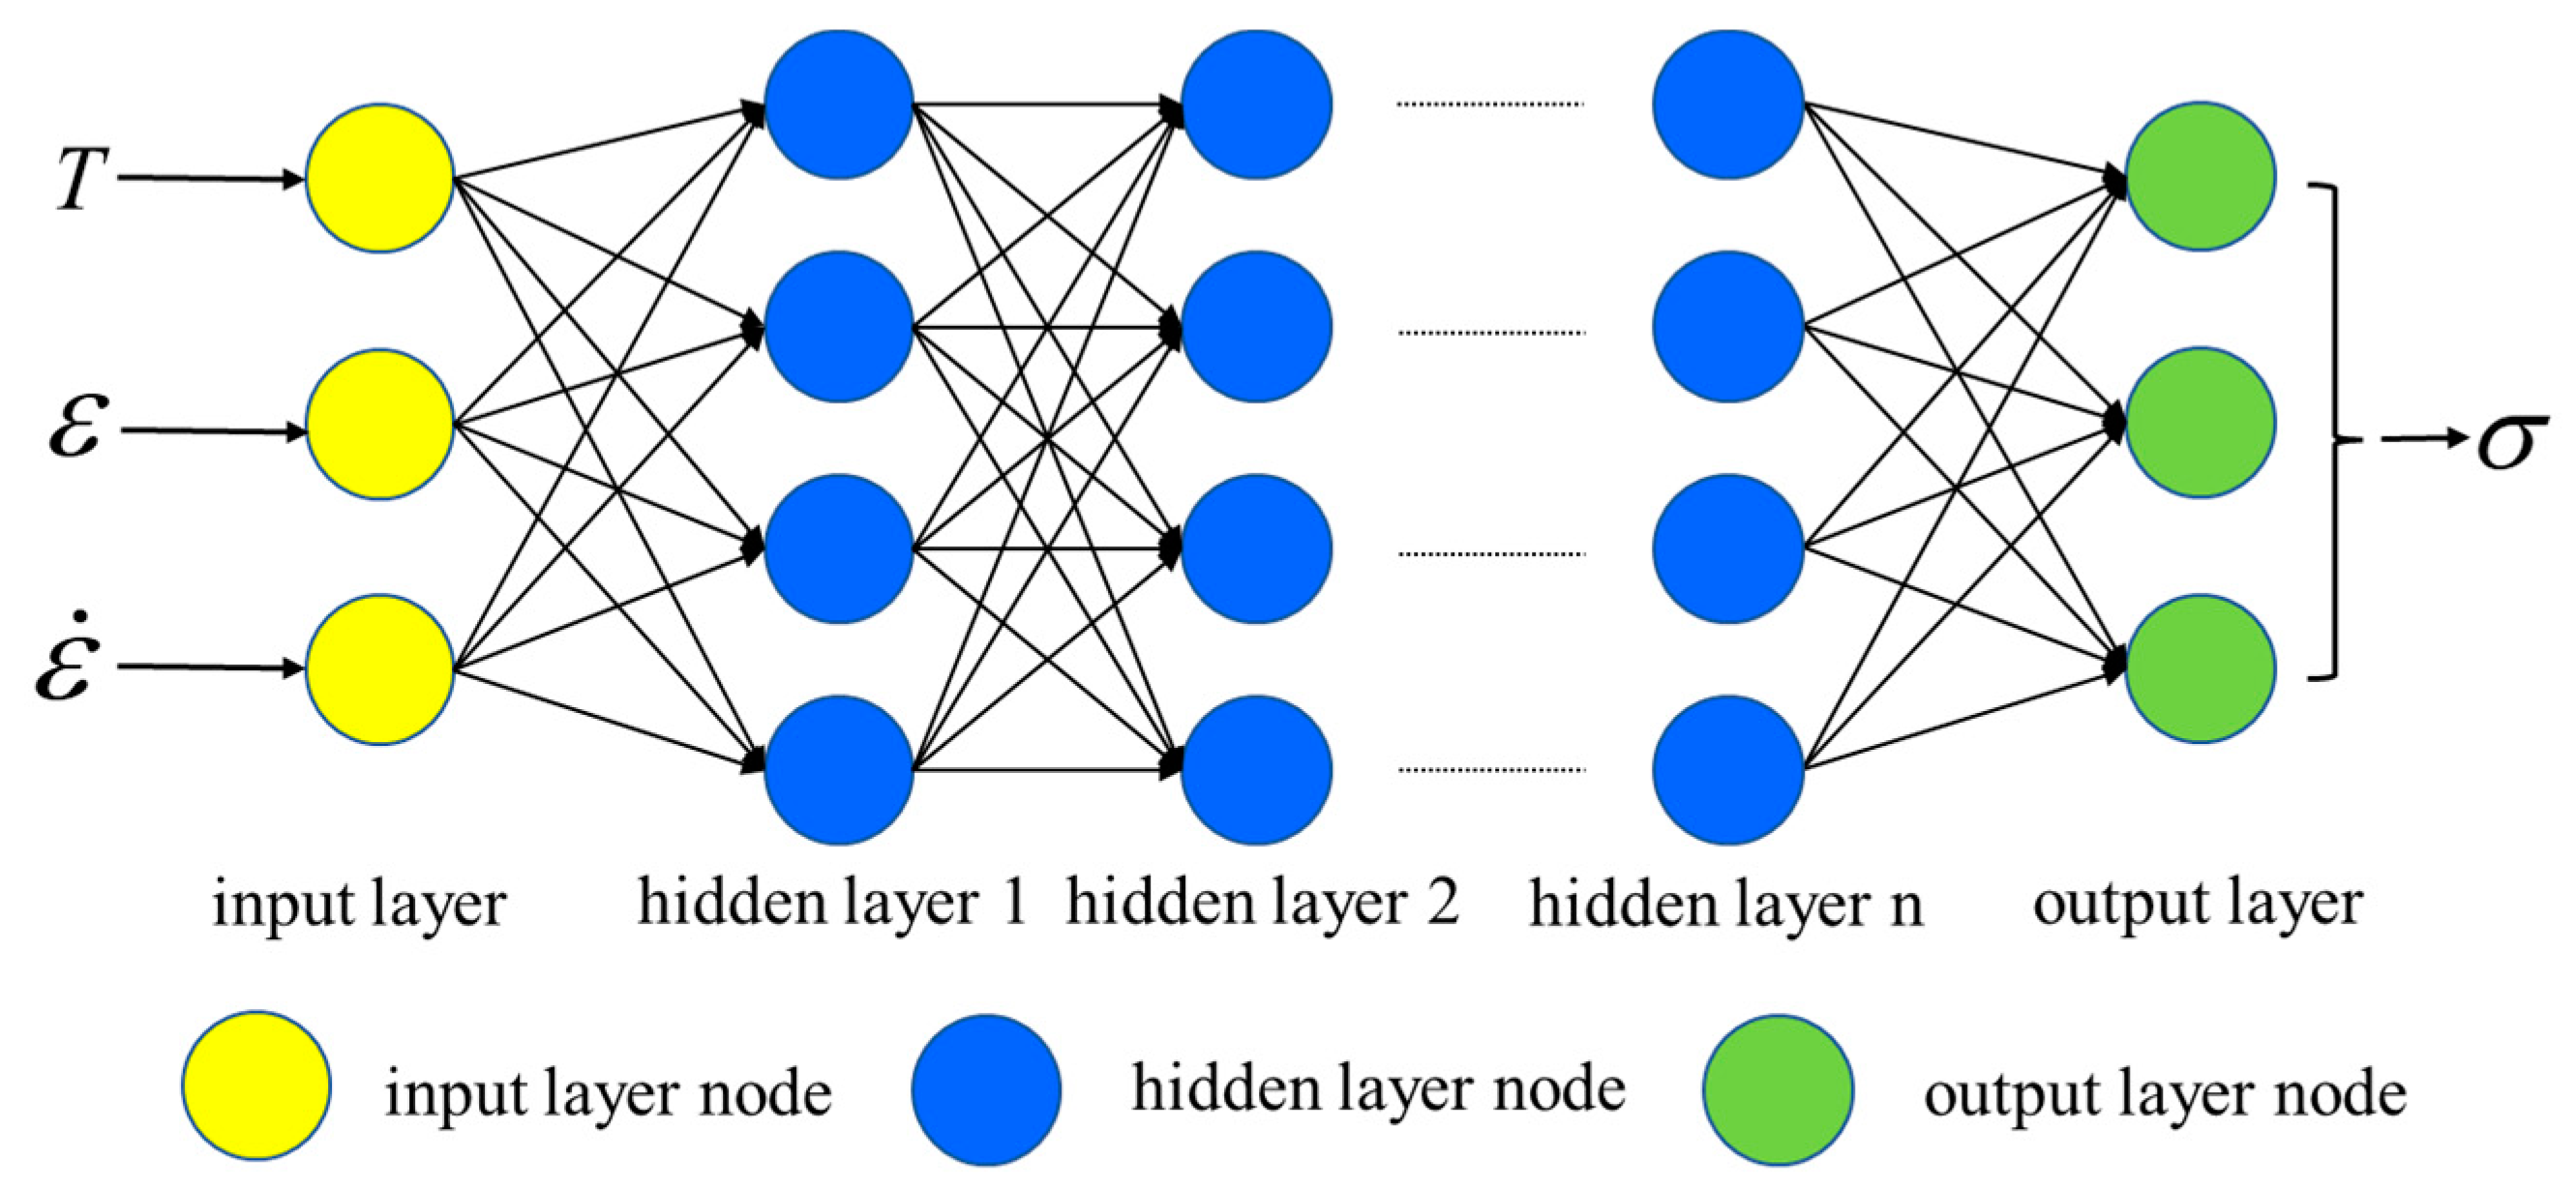
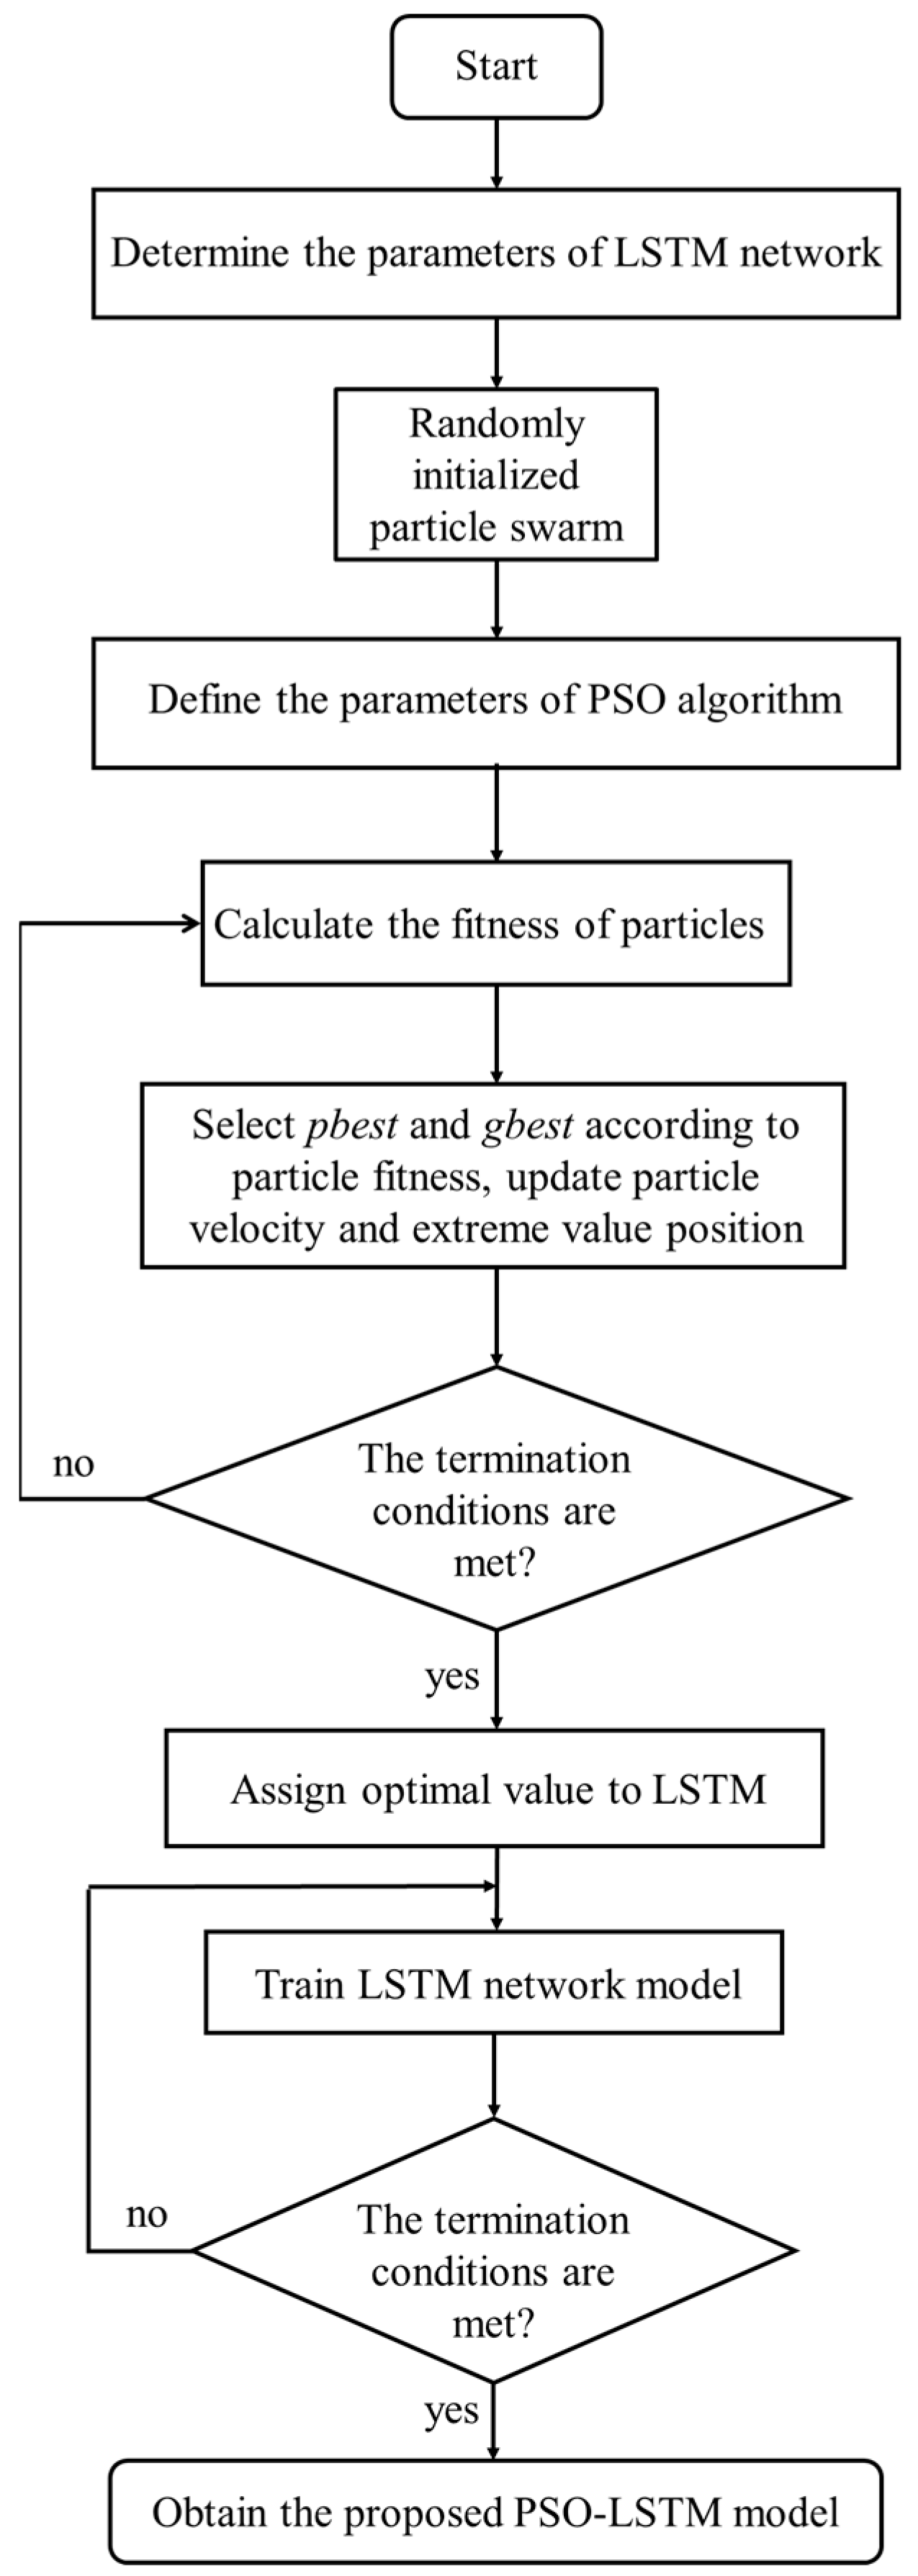
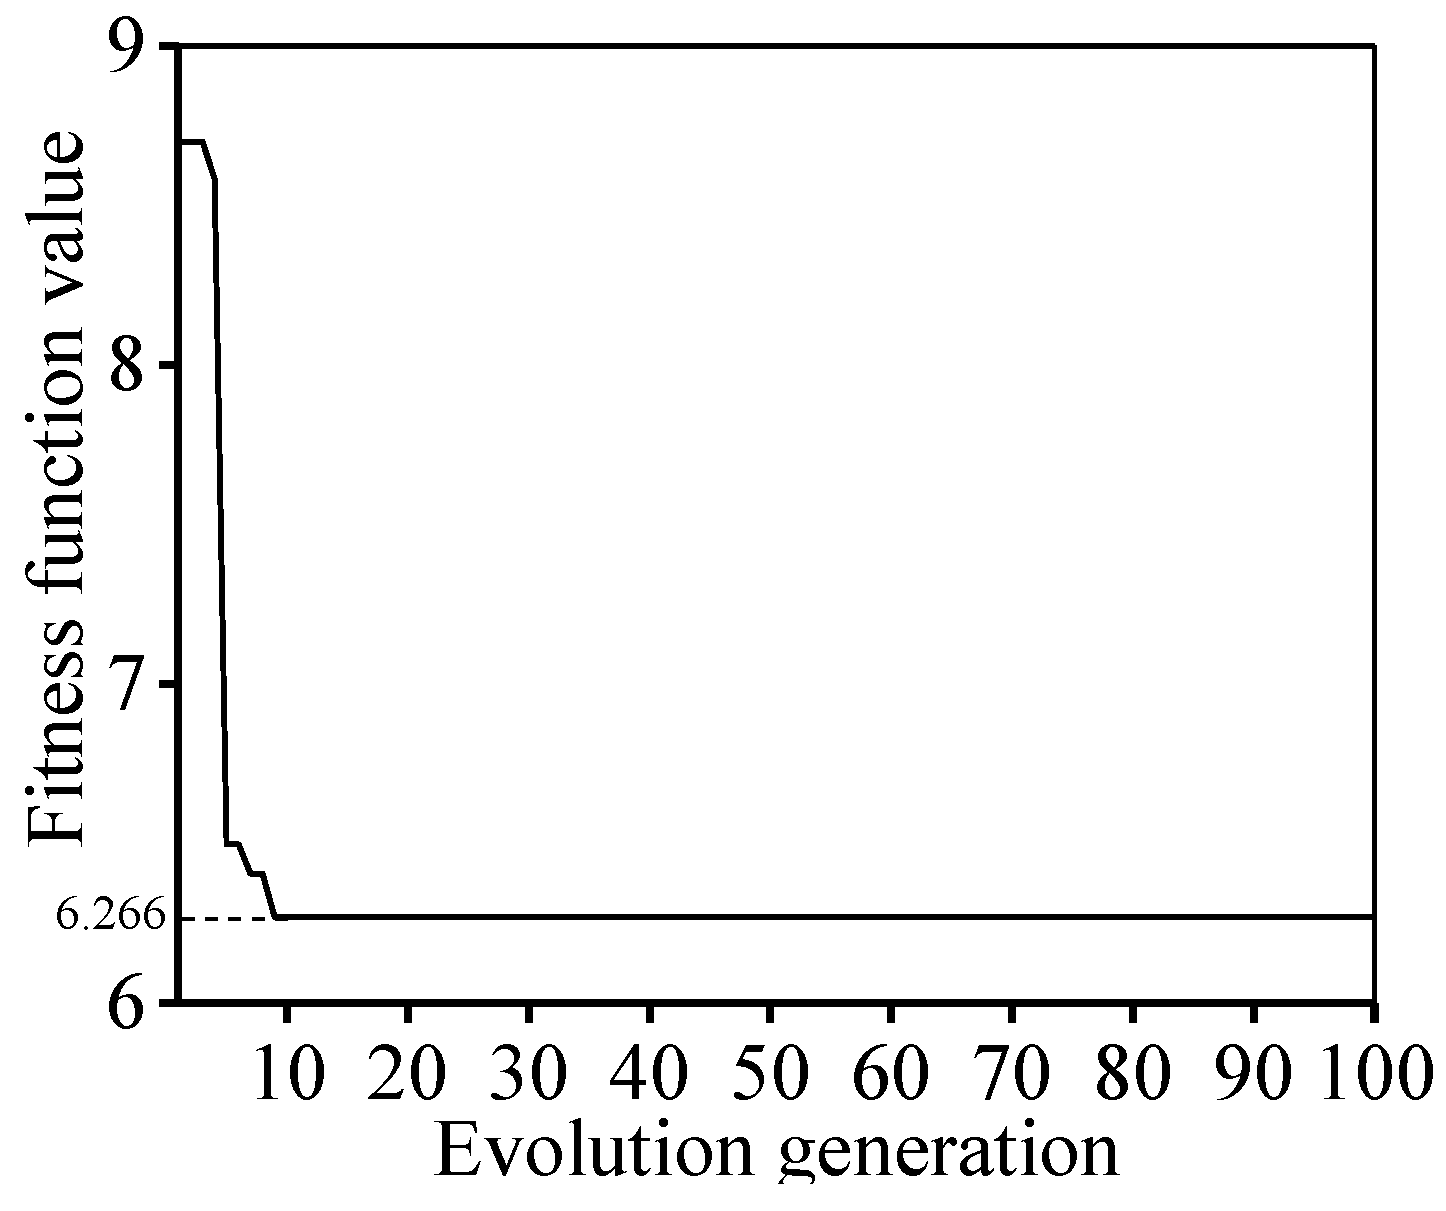
3.4. PSO-LSTM Model
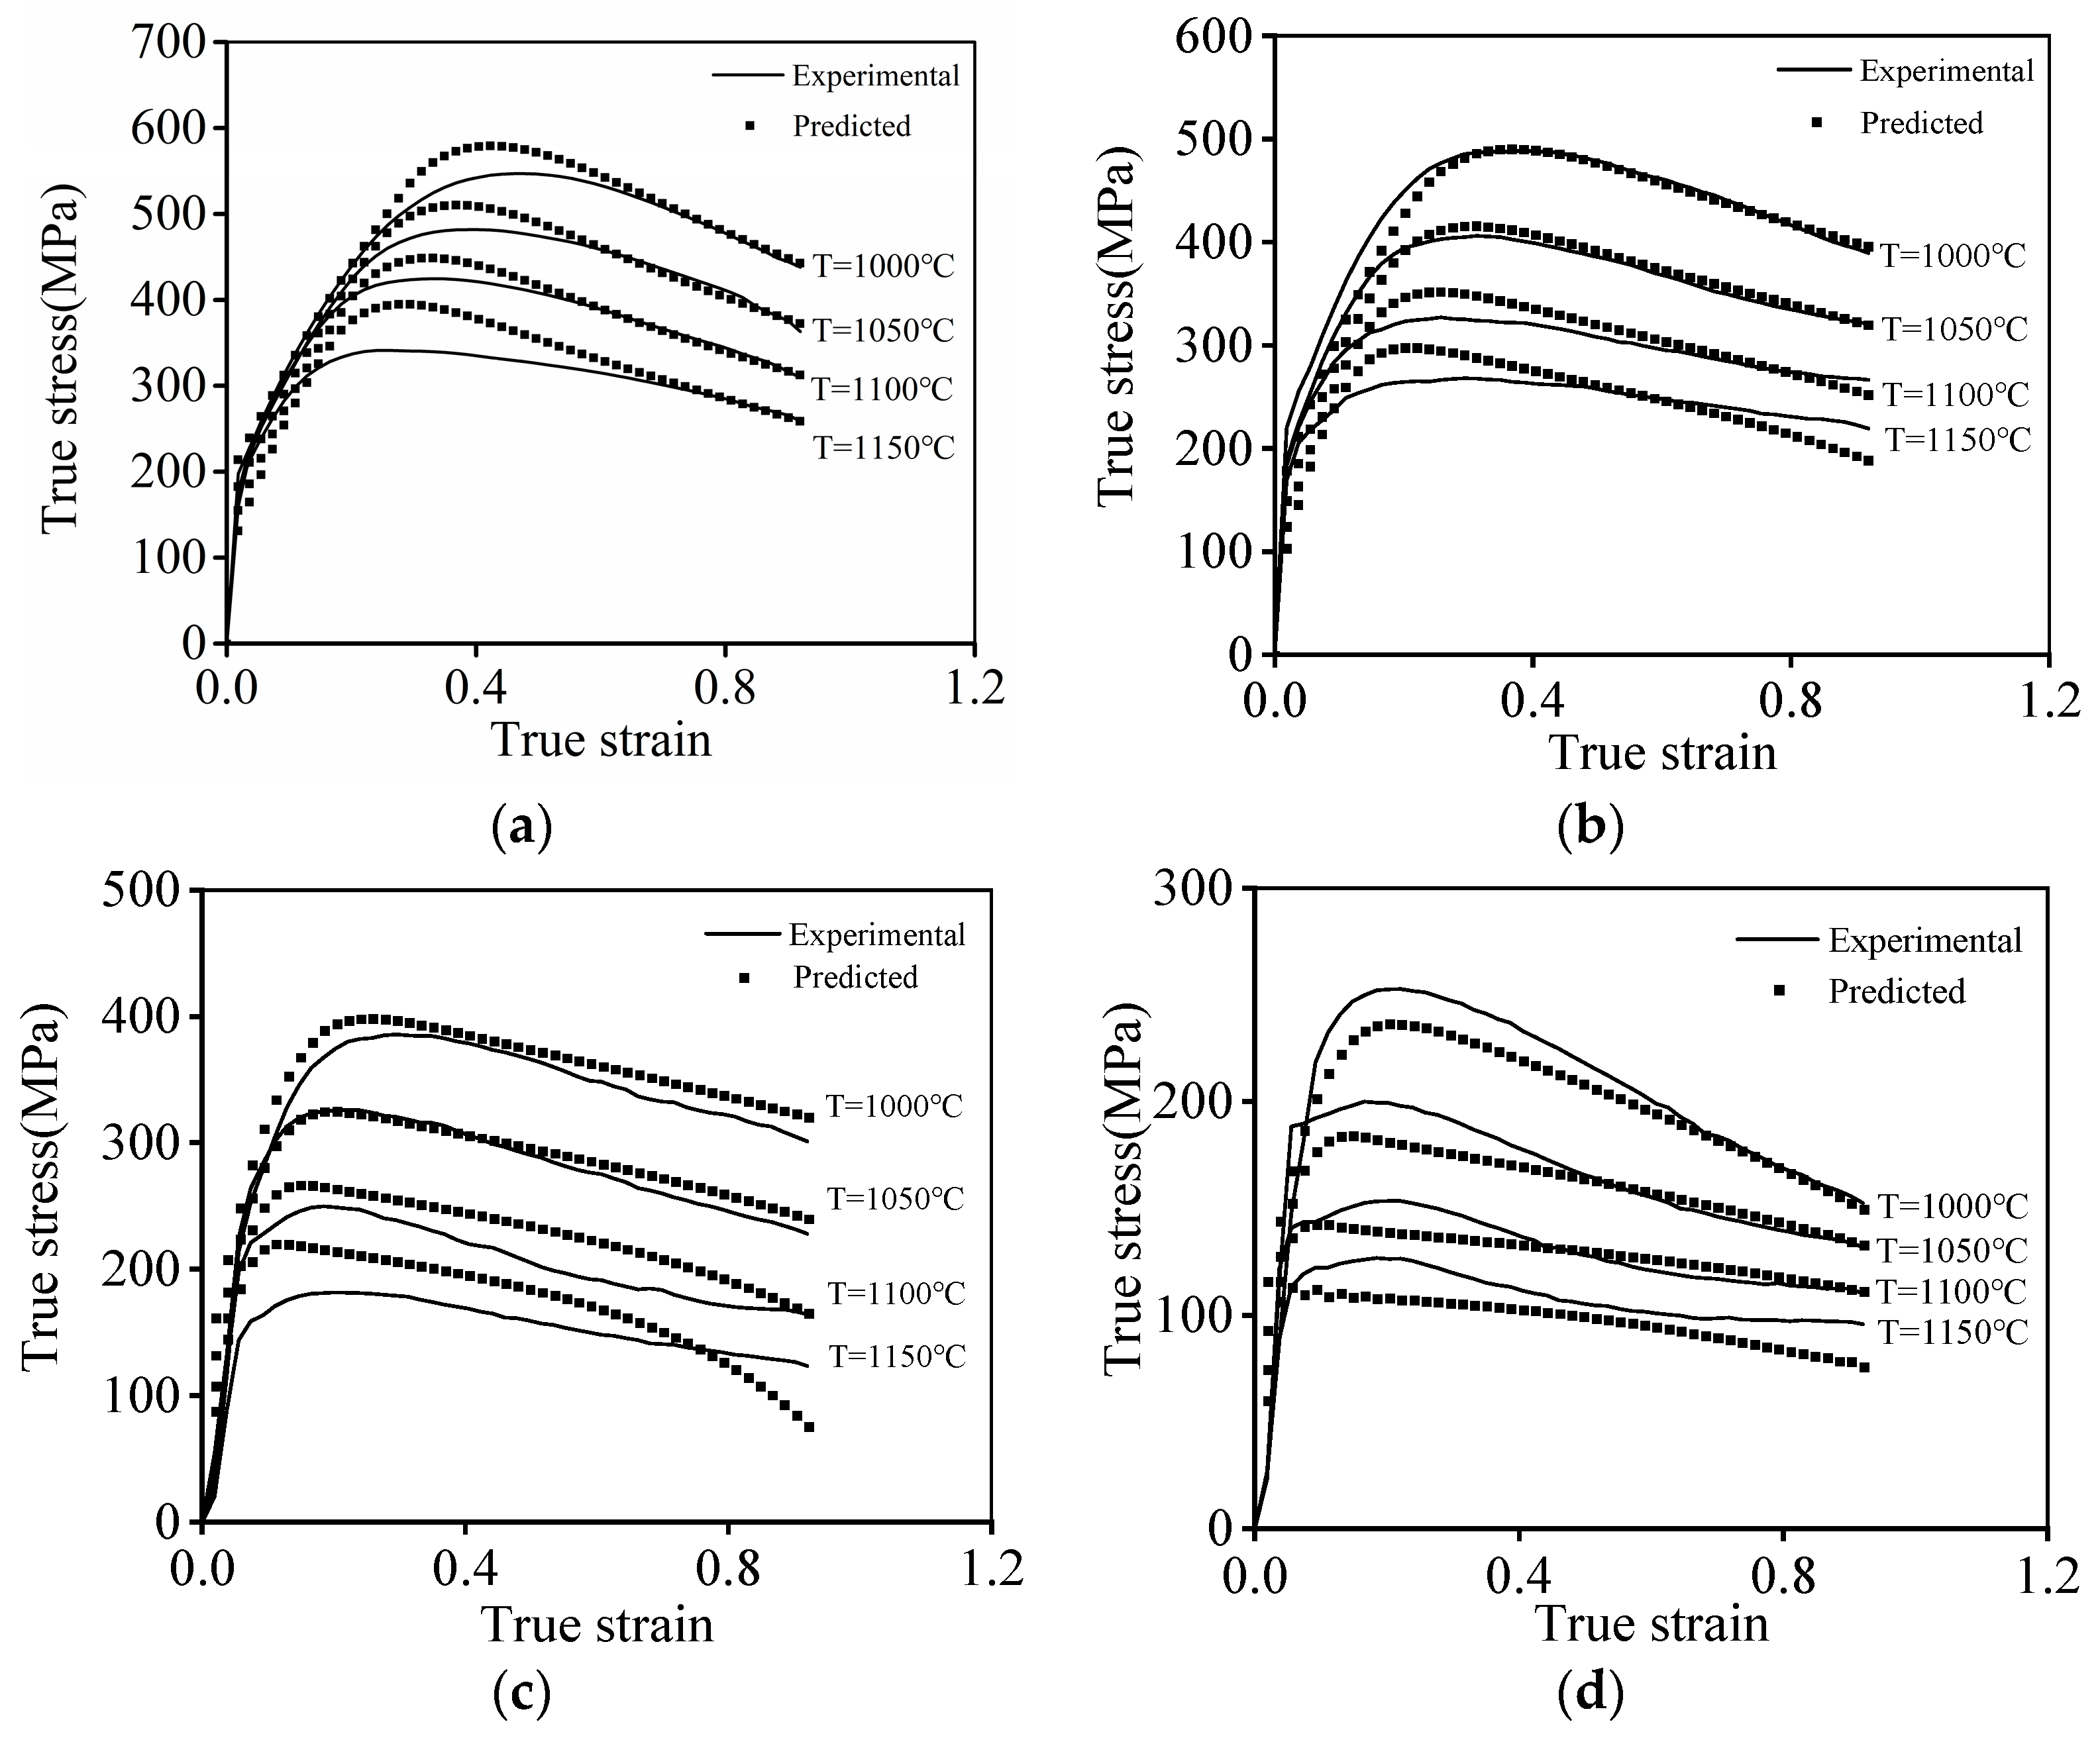
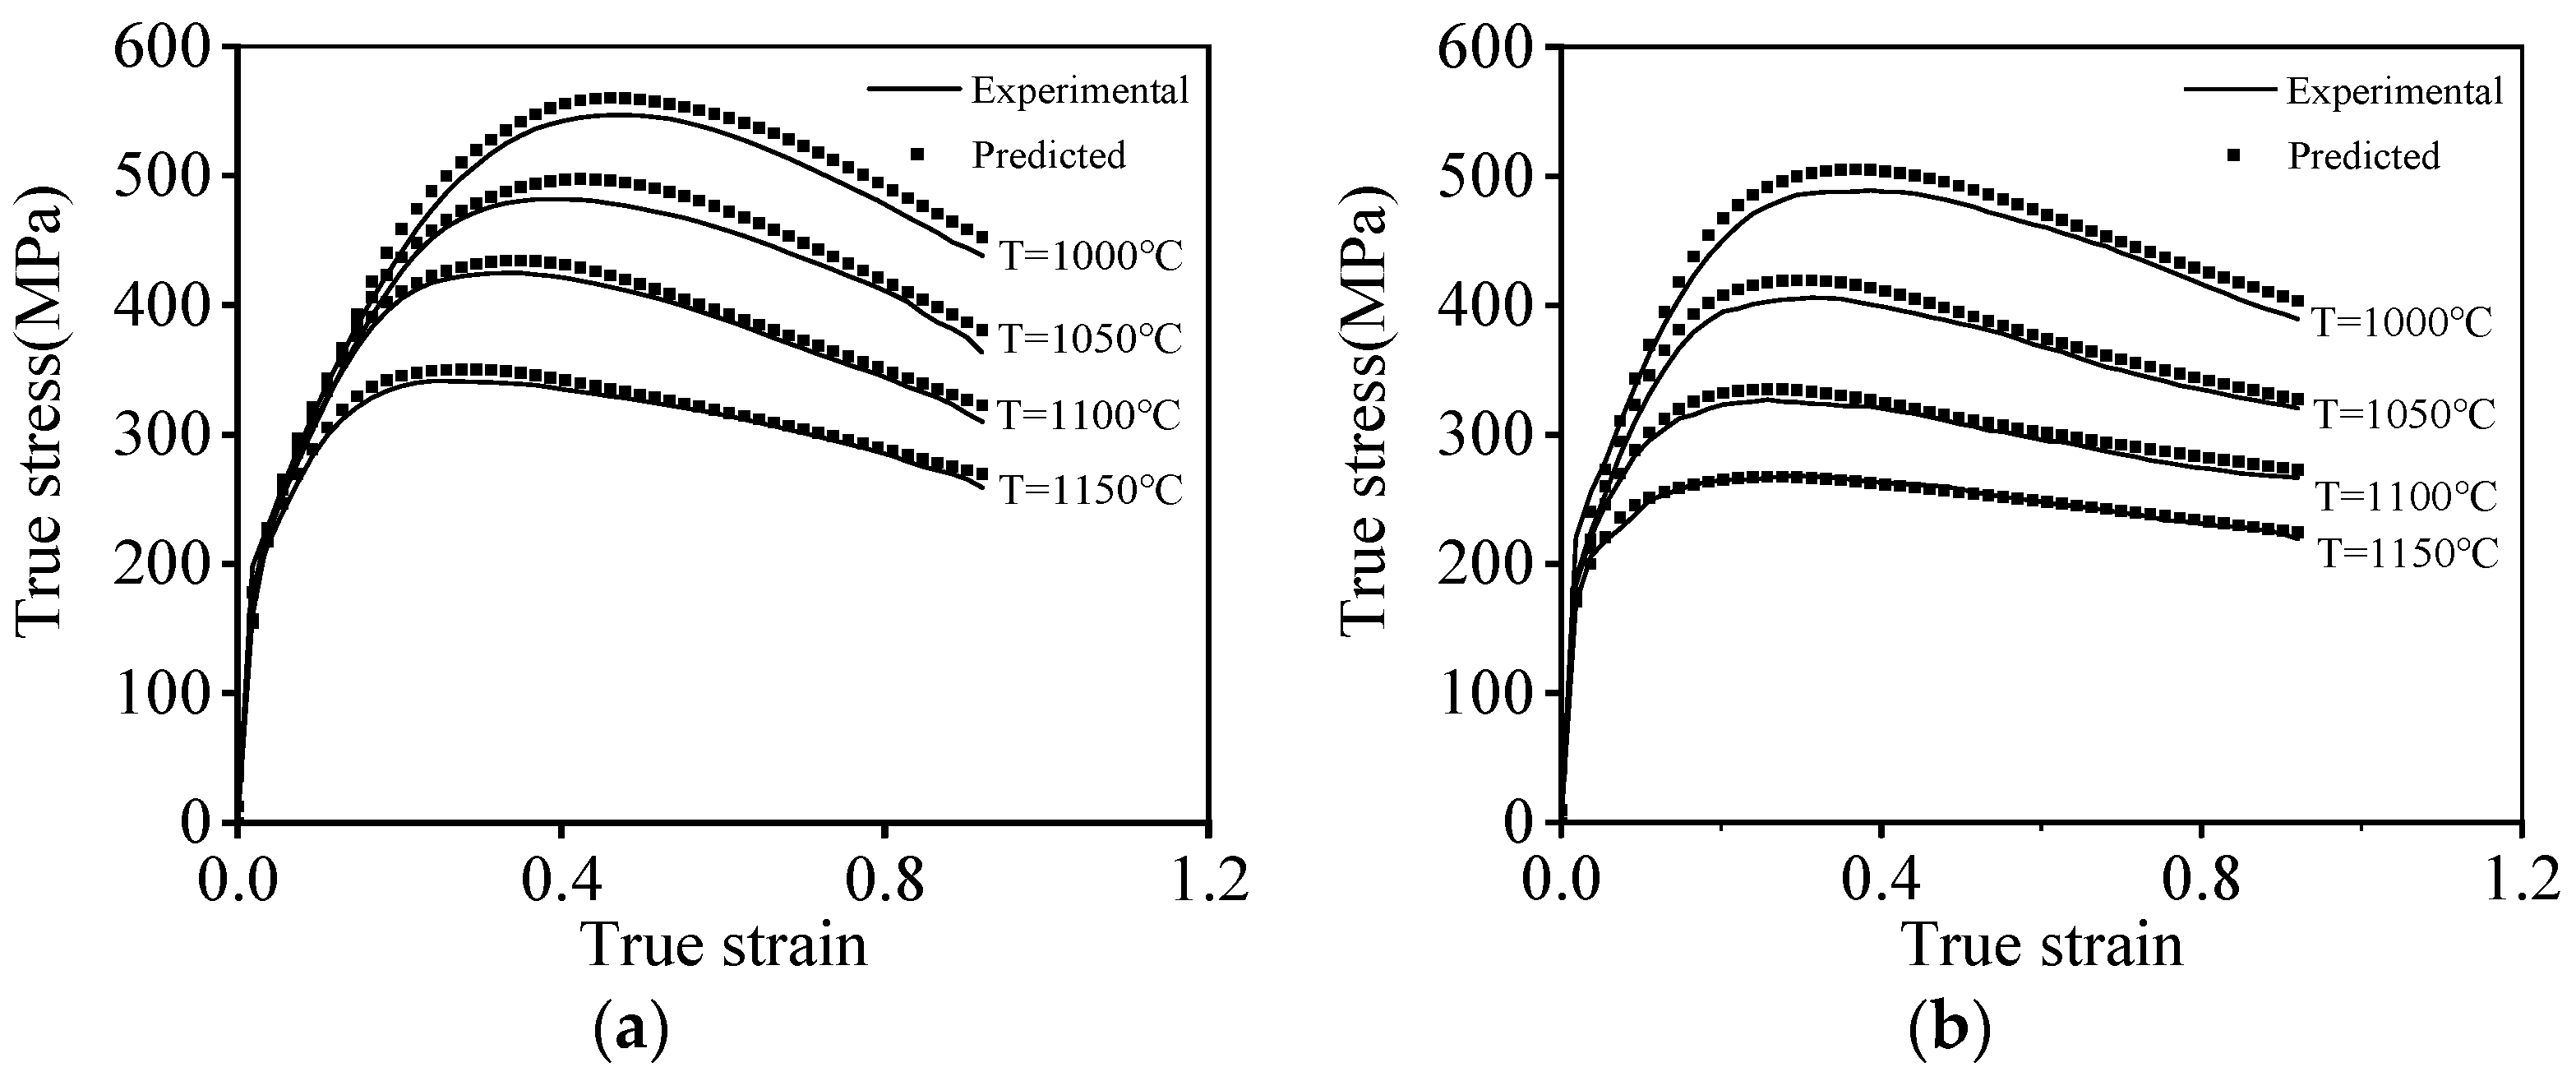
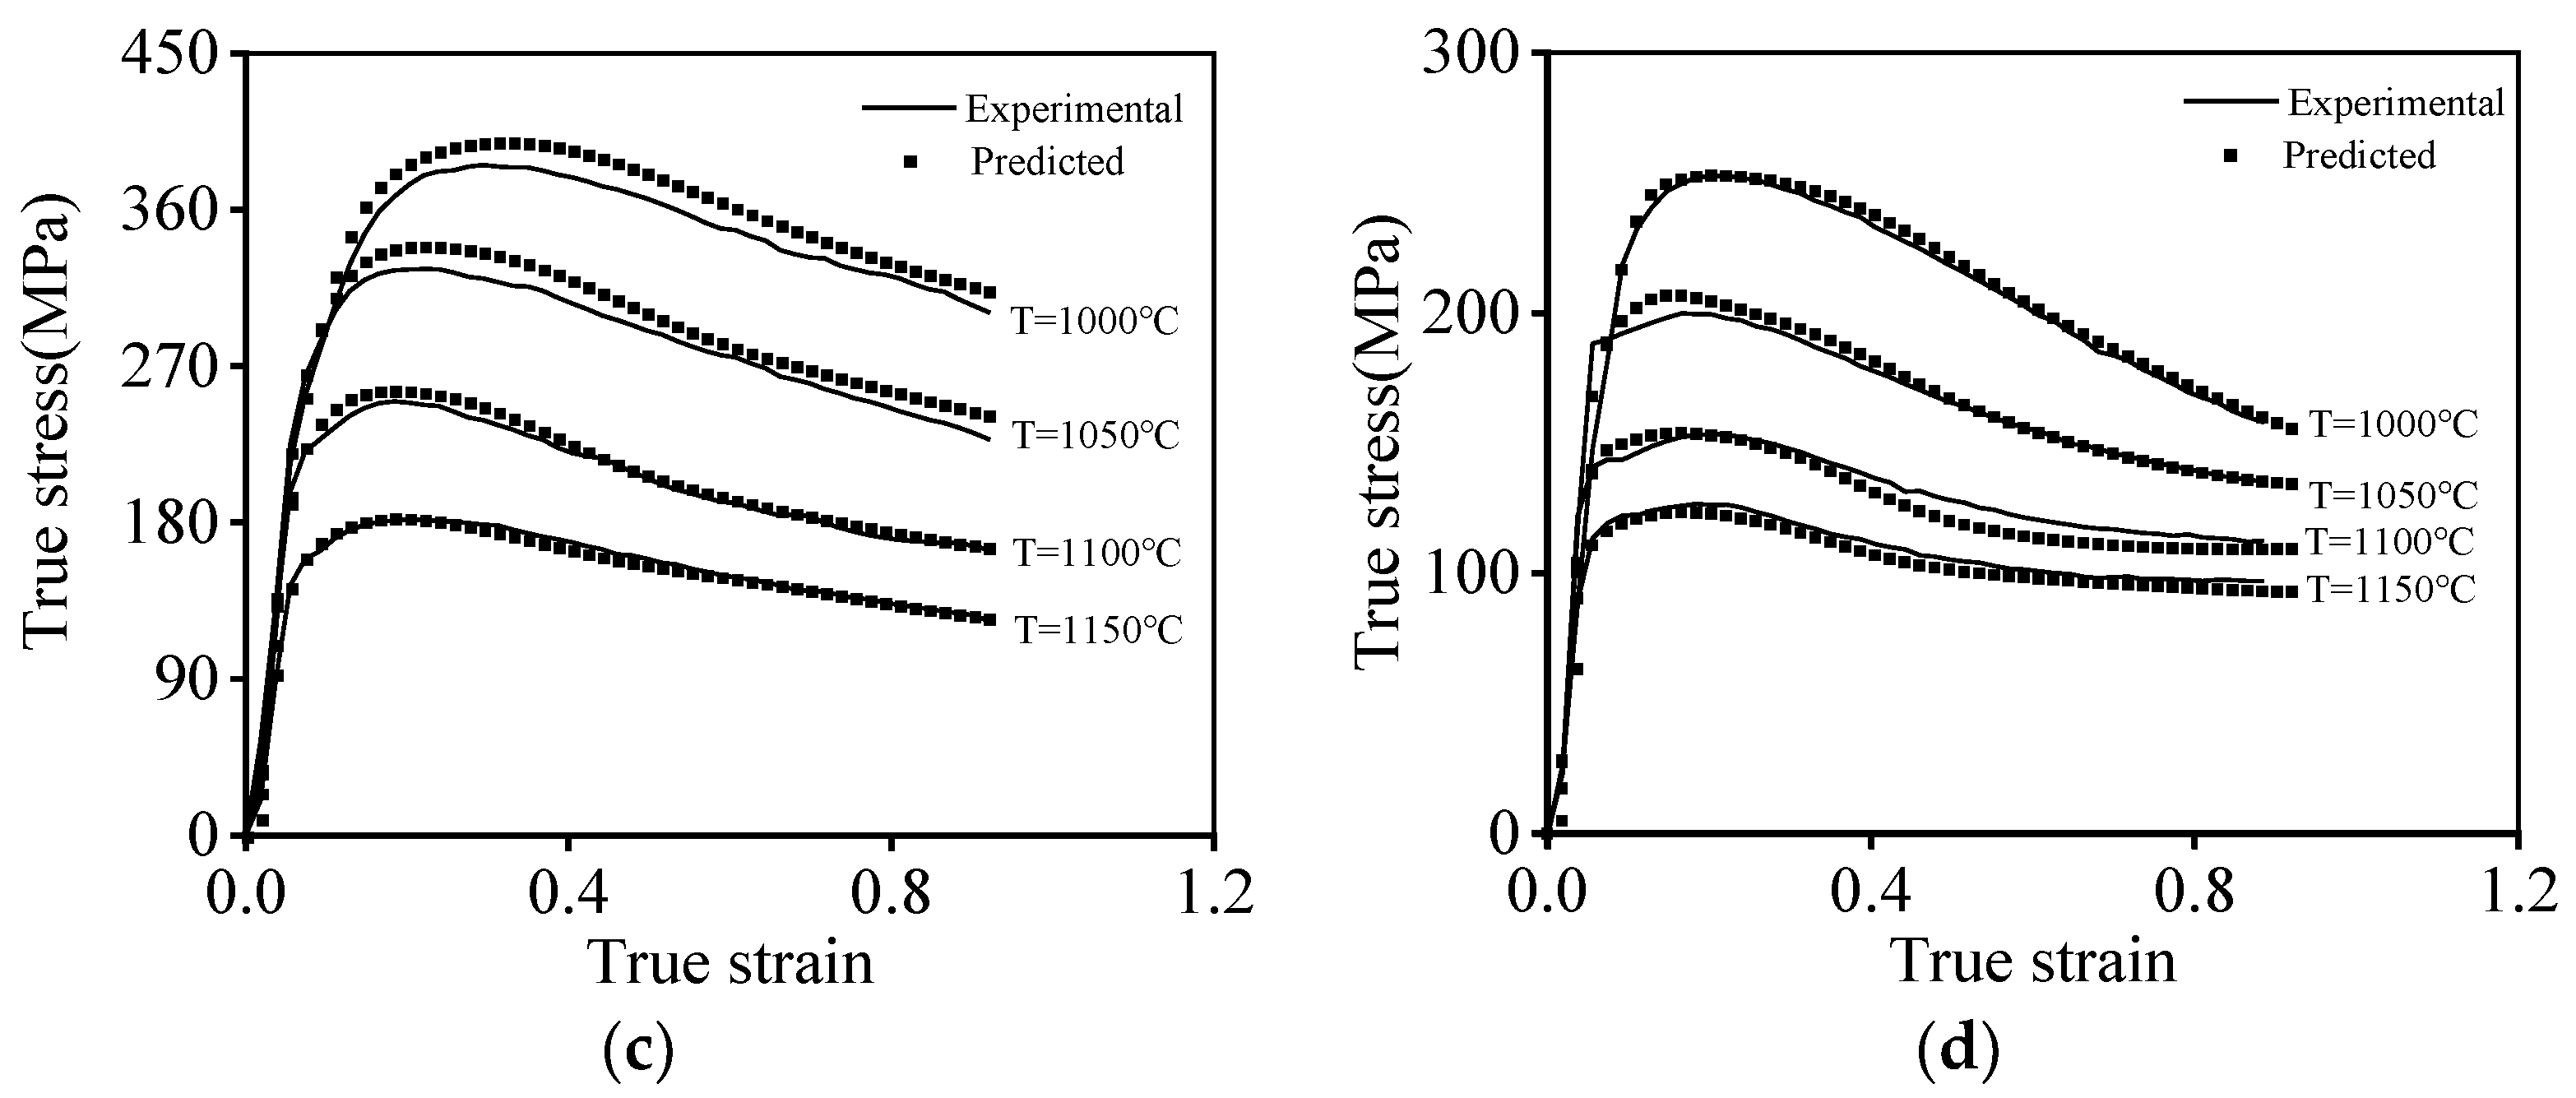
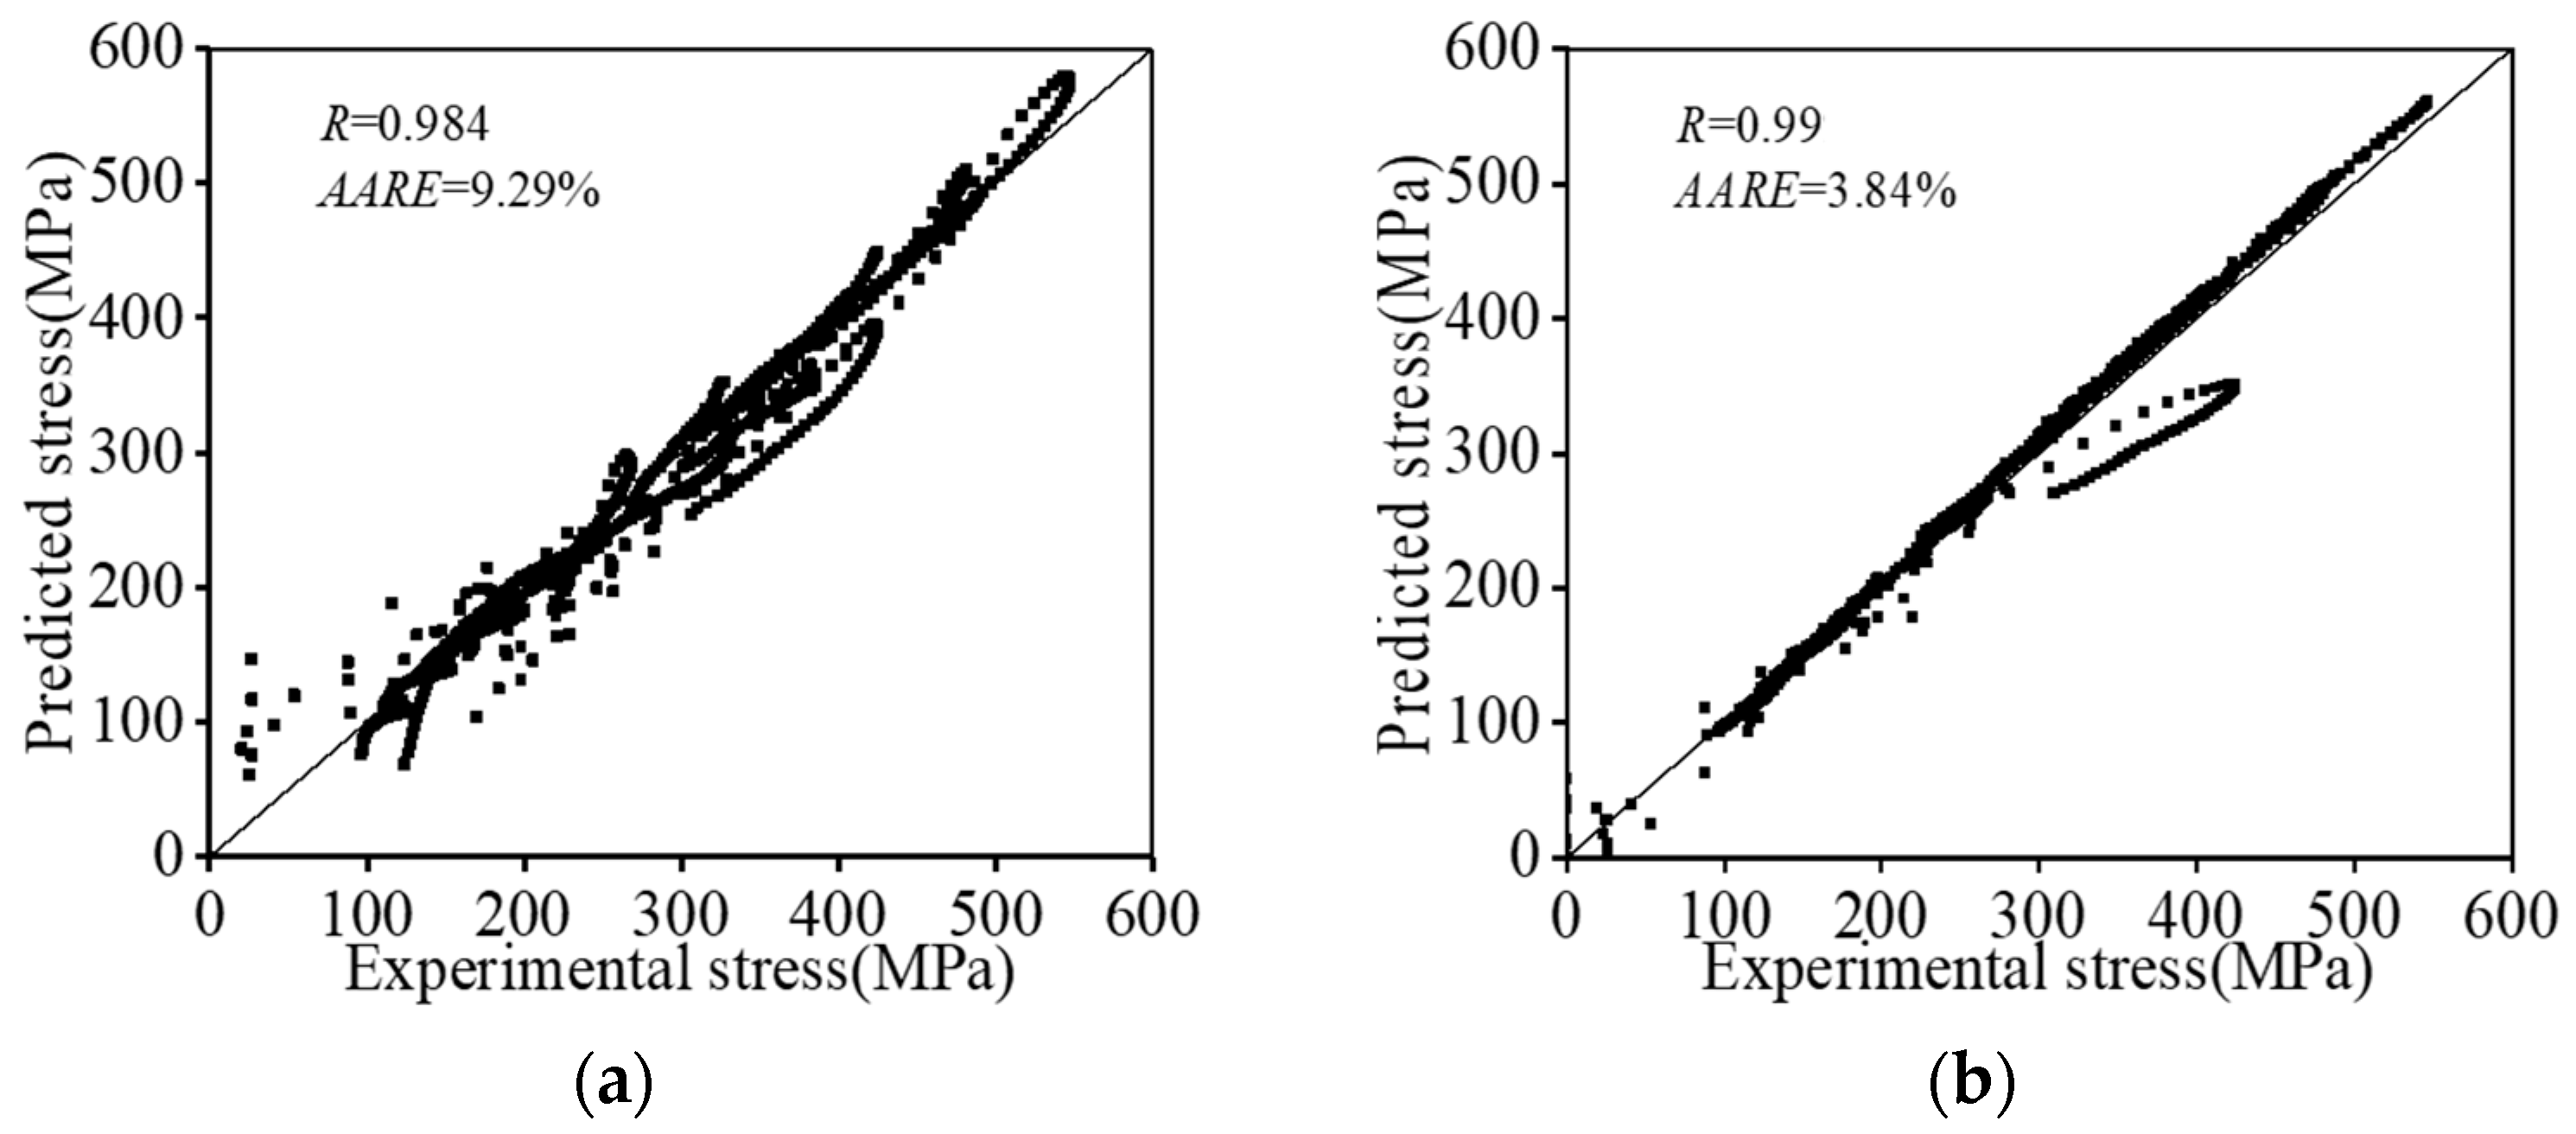
3.5. Verification
4. Conclusions
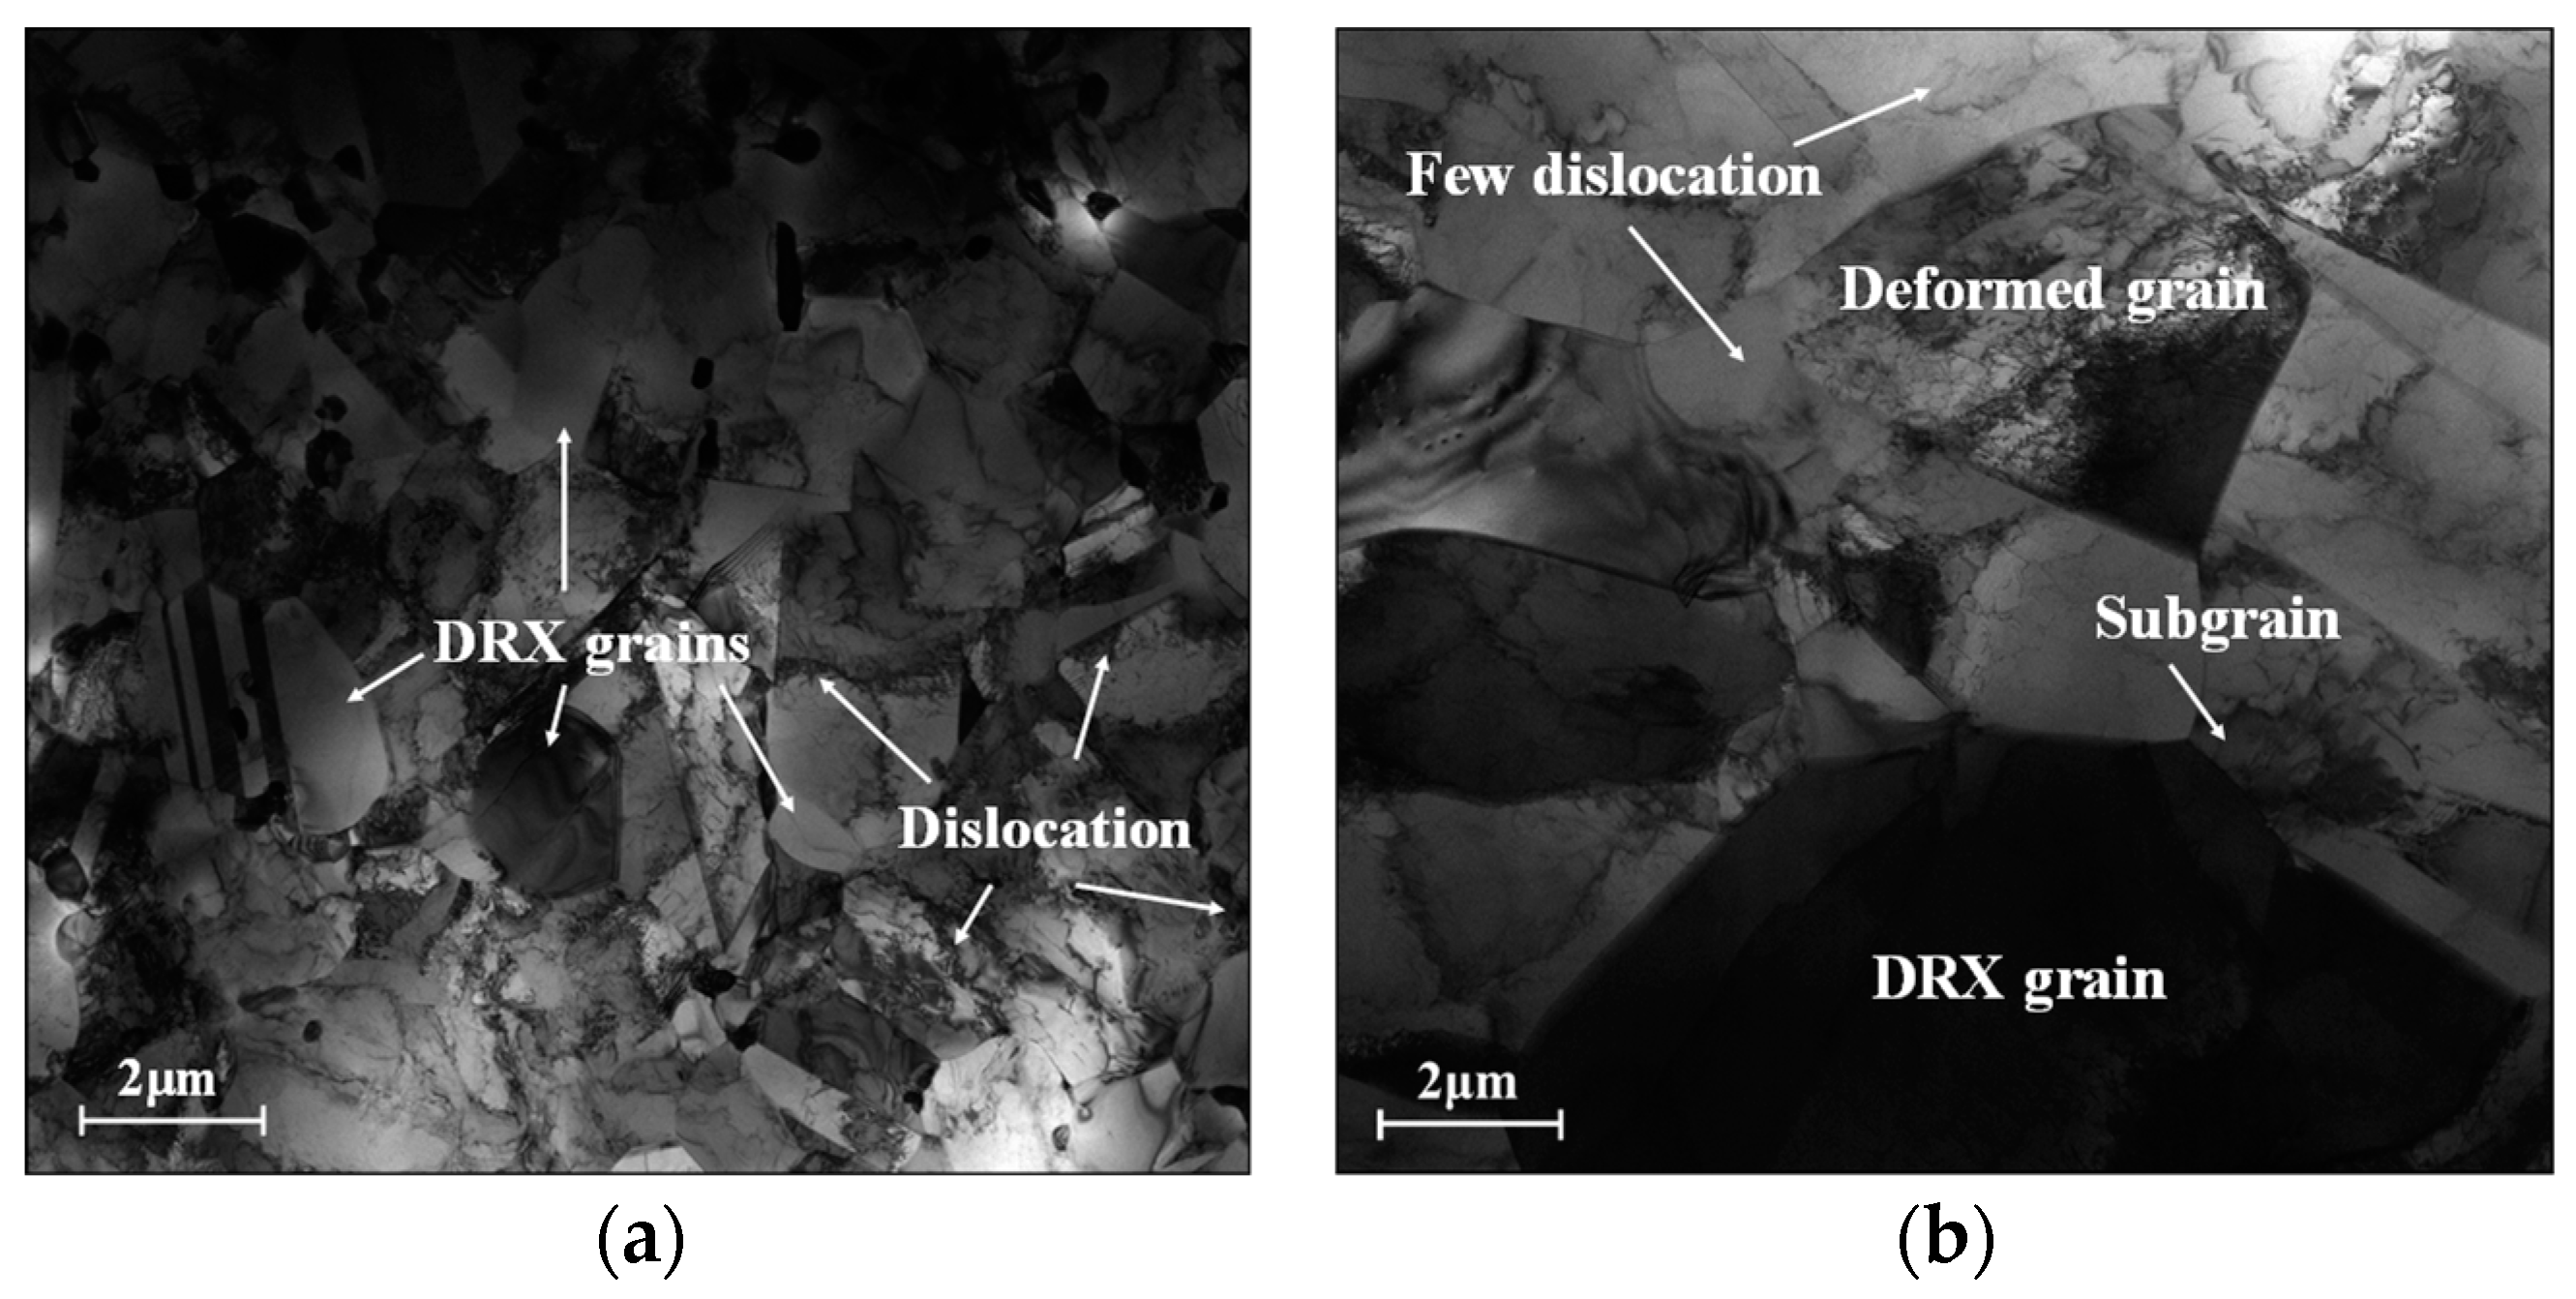
- Wehn the strain rate is increased, the WH effect induced by the formation of high-density dislocation clusters/arrays and subgrains is enhanced, and consequently, the true stress increases. Nevertheless, the dislocation rearrangement, caused by the promising DRV effect and the nucleation/coarsening of DRX grains, are enhanced at higher compression temperatures, thereby inducing a prominent decrease in true stress.
- Both the PB model and the PSO-LSTM model are proposed for reconstituting the hot compression behaviors of the tested Hastelloy C276 alloy. A reasonably larger and a smaller of the PSO-LSTM model can be acquired, which suggest its higher forecasting accuracy than the PB model.
Author Contributions
Funding
Institutional Review Board Statement
Informed Consent Statement
Data Availability Statement
Conflicts of Interest
References
- He, D.G.; Yan, X.T.; Lin, Y.C.; Xia, Y.C. Microstructural evolution and kinetic characteristics during metadynamic recrystallization in a Ni-Cr-Mo alloy. J. Alloys Compd. 2022, 926, 166830. [Google Scholar] [CrossRef]
- Xiao, J.F.; Cui, H.T.; Zhang, H.J.; Wen, W.D.; Zhou, J. A physical-based constitutive model considering the motion of dislocation for Ni3Al-base superalloy. Mater. Sci. Eng. A 2020, 772, 138631. [Google Scholar] [CrossRef]
- Ning, Y.Q.; Wang, T.; Fu, M.W.; Li, M.Z.; Wang, L.; Zhao, C.D. Competition between work-hardening effect and dynamic-softening behavior for processing as-cast GH4720Li superalloys with original dendrite microstructure during moderate-speed hot compression. Mater. Sci. Eng. A 2015, 642, 187–193. [Google Scholar] [CrossRef]
- Wang, G.Q.; Chen, M.S.; Li, H.B.; Lin, Y.C.; Zeng, W.D.; Ma, Y.Y. Methods and mechanisms for uniformly refining deformed mixed and coarse grains inside a solution-treated Ni-based superalloy by two-stage heat treatment. J. Mater. Sci. Technol. 2021, 77, 47–57. [Google Scholar] [CrossRef]
- Long, J.C.; Zhu, N.Y.; Xia, Q.X.; Cheng, X.Q. A Study of the Dynamic Recrystallization Behavior of Ni-Based Superalloy during Hot Power Spinning Based on Cellular Automaton. Adv. Eng. Mater. 2019, 21, 1801022. [Google Scholar] [CrossRef]
- Zhang, C.; Zhang, L.W.; Shen, W.F.; Liu, C.R.; Xia, Y.N. The Kinetics of Metadynamic Recrystallization in a Ni-Cr-Mo-Based Superalloy Hastelloy C-276. J. Mater. Eng. Perform. 2016, 25, 545–552. [Google Scholar] [CrossRef]
- Chen, J.; Wang, J.Z.; Yan, F.Y.; Zhang, Q.; Li, Q.A. Corrosion wear synergistic behavior of Hastelloy C276 alloy in artificial seawater. Trans. Nonferrous Met. Soc. China 2015, 25, 661–668. [Google Scholar] [CrossRef]
- Lin, Y.C.; Qian, S.S.; Chen, X.M.; Li, X.H.; Yang, H. Staggered spinning of thin-walled Hastelloy C-276 cylindrical parts: Numerical simulation and experimental investigation. Thin. Wall. Struct. 2019, 140, 466–476. [Google Scholar] [CrossRef]
- Xia, Q.X.; Long, J.C.; Zhu, N.Y.; Xiao, G.F. Research on the microstructure evolution of Ni-based superalloy cylindrical parts during hot power spinning. Adv. Manuf. 2019, 7, 52–63. [Google Scholar] [CrossRef]
- Dhananchezian, M. Study the machinability characteristics of Nicked based Hastelloy C-276 under cryogenic cooling. Measurement 2019, 136, 694–702. [Google Scholar] [CrossRef]
- Wang, X.K.; Xia, Q.X.; Cheng, X.Q. Deformation behavior of haynes230 superalloy during backward flow forming. Int. J. Precis. Eng. Manuf. 2017, 18, 77–83. [Google Scholar] [CrossRef]
- Zhang, C.; Tang, X.L.; Zhang, L.W.; Cui, Y. Cellular automaton modeling of dynamic recrystallization of Ni–Cr–Mo-based C276 superalloy during hot compression. J. Mater. Res. 2019, 34, 3093–3103. [Google Scholar] [CrossRef]
- Zhang, X.Y.; Guo, S.L.; Zhong, J. Microevolution of grain boundary character distribution in Hastelloy C-276 during the annealing process. J. Mater. Res. Technol. 2022, 18, 1534–1541. [Google Scholar] [CrossRef]
- Jaladurgam, N.R.; Kanjarla, A.K. Hot deformation characteristics and microstructure evolution of Hastelloy C-276. Mater. Sci. Eng. A 2018, 712, 240–254. [Google Scholar] [CrossRef]
- Kong, Y.H.; Chang, P.P.; Li, Q.; Xie, L.X.; Zhu, S.G. Hot deformation characteristics and processing map of nickel-based C276 superalloy. J. Alloys Compd. 2015, 622, 738–744. [Google Scholar] [CrossRef]
- Xing, J.; Liu, C.Z.; Li, A.M.; Wang, S.M.; Zhang, X.J.; Shi, Y.X. Microstructural evolution and stability of coarse-grained S31254 super austenitic stainless steel during hot deformation. Metals 2022, 12, 1319. [Google Scholar] [CrossRef]
- Sun, B.; Zhang, T.B.; Song, L.; Zhang, L. Microstructural evolution and dynamic recrystallization of a nickel-based superalloy PMEP962NP during hot deformation at 1150 °C. J. Mater. Res. Technol. 2022, 18, 1436–1449. [Google Scholar] [CrossRef]
- Zhao, H.T.; Zhi, H.R.; Wang, S.W.; Wang, Y.L. The hot deformation behavior and microstructural evolution of TP2 pure Copper. Trans. Indian Inst. Met. 2023, 76, 1467–1474. [Google Scholar] [CrossRef]
- Luo, Y.M.; Shi, C.B.; Xu, H.C. Microstructure evolution and hot deformation characteristics of 15Cr-22Ni iron-base superalloy. J. Alloys Compd. 2022, 938, 168628. [Google Scholar] [CrossRef]
- Li, Q.; Bu, H.Y.; Han, J.Y.; Li, M.N. Dynamic recrystallization behavior and processing maps of 5CrNiMoV steel during hot deformation. Mater. Res. Express 2023, 10, 046519. [Google Scholar] [CrossRef]
- Cai, Y.Q.; Xiang, S.; Tan, Y.B. Insight into the dynamic recrystallization behavior and microstructure evolution of MP159 superalloy during hot deformation. Met. Mater. Int. 2022, 28, 2381–2394. [Google Scholar] [CrossRef]
- Yan, X.T.; Xia, Y.C.; He, D.G.; Lin, Y.C. Microstructural Evolution and an Improved Dynamic Recrystallization Kinetic Model of a Ni-Cr-Mo Alloy in Hot Deformation. Materials 2022, 15, 3161. [Google Scholar] [CrossRef] [PubMed]
- Chen, X.M.; Lin, Y.C.; Li, X.H.; Chen, M.S.; Yuan, W.Q. Investigation on strain dependence of metadynamic recrystallization behaviors of GH4169 superalloy. Vacuum 2018, 149, 1–11. [Google Scholar] [CrossRef]
- Li, B.; Du, Y.; Chu, Z.J.; Zhou, W.; Yang, X.L. Research on dynamic recrystallization behavior of Ni-Fe-Cr based alloy. Mater. Charact. 2020, 169, 110653. [Google Scholar] [CrossRef]
- Chen, F.L.; Li, K.D.; Tang, B.; Liu, D.G.; Zhong, H.; Li, J.S. Deformation behavior and microstructural evolution of Inconel 625 superalloy during the hot compression process. Metals 2021, 11, 824. [Google Scholar] [CrossRef]
- Guo, S.L.; Liu, J.C.; Du, B.; Liu, S.P.; Zhang, X.Y.; Li, D.F. An Investigation on Constitutive Relation and Dynamic Recrystallization of Hastelloy C-276 Alloy During Hot Deformation. J. Mater. Eng. Perform. 2020, 29, 5902–5912. [Google Scholar] [CrossRef]
- Zhang, C.; Zhang, L.W.; Cui, Y.; Feng, Q.Y.; Cheng, C.Q. Effects of High-Temperature Aging on Precipitation and Corrosion Behavior of a Ni-Cr-Mo-Based Hastelloy C276 Superalloy. J. Mater. Eng. Perform. 2020, 29, 2026–2034. [Google Scholar] [CrossRef]
- Kotkunde, N.; Krishnamurthy, H.N.; Singh, S.K.; Jella, G. Experimental and Numerical Investigations on Hot Deformation Behavior and Processing Maps for ASS 304 and ASS 316. High Temp. Mater. Process. 2018, 37, 873–888. [Google Scholar] [CrossRef]
- Wen, D.X.; Gao, C.X.; Zheng, Z.Z.; Wang, K.; Xiong, Y.B.; Wang, J.K.; Li, J.J. Hot tensile behavior of a low-alloyed ultrahigh strength steel: Fracture mechanism and physically-based constitutive model. J. Mater. Res. Technol. 2021, 13, 1684–1697. [Google Scholar] [CrossRef]
- Savaedi, Z.; Motallebi, R.; Mirzadeh, H. A review of hot deformation behavior and constitutive models to predict flow stress of high-entropy alloys. J. Alloys Compd. 2022, 903, 163964. [Google Scholar] [CrossRef]
- Fan, X.G.; Yang, H.; Gao, P.F. Prediction of constitutive behavior and microstructure evolution in hot deformation of TA15 titanium alloy. Mater. Des. 2013, 51, 34–42. [Google Scholar] [CrossRef]
- Xu, W.C.; Jin, X.Z.; Xiong, W.D.; Zeng, X.Q.; Shan, D.B. Study on hot deformation behavior and workability of squeeze-cast 20 vol% SiCw/6061Al composites using processing map. Mater. Charact. 2018, 135, 154–166. [Google Scholar] [CrossRef]
- Tang, C.P.; Liu, W.H.; Chen, Y.Q.; Liu, X.; Deng, Y.L. Hot Deformation Behavior of a Differential Pressure Casting Mg–8Gd–4Y–Nd–Zr Alloy. J. Mater. Eng. Perform. 2017, 26, 383–391. [Google Scholar] [CrossRef]
- Mirzadeh, H. Constitutive Description of 7075 Aluminum Alloy During Hot Deformation by Apparent and Physically-Based Approaches. J. Mater. Eng. Perform. 2015, 24, 1095–1099. [Google Scholar] [CrossRef]
- Chen, X.M.; Lin, Y.C.; Hu, H.W.; Luo, S.C.; Zhou, X.J.; Huang, Y. An Enhanced Johnson–Cook Model for Hot Compressed A356 Aluminum Alloy. Adv. Eng. Mater. 2021, 23, 2000704. [Google Scholar] [CrossRef]
- Detrois, M.; Antonov, S.; Tin, S.; Jablonski, P.D.; Hawk, J.A. Hot deformation behavior and flow stress modeling of a Ni-based superalloy. Mater. Charact. 2019, 157, 109915. [Google Scholar] [CrossRef]
- Quan, G.Z.; Pan, J.; Wang, X. Prediction of the Hot Compressive Deformation Behavior for Superalloy Nimonic 80A by BP-ANN Model. Appl. Sci. 2016, 6, 66. [Google Scholar] [CrossRef]
- Lu, Y.L.; Liu, J.X.; Li, X.K.; Liang, J.P.; Li, Z.J.; Wu, G.Y.; Zhou, X.T. Hot deformation behavior of Hastelly C276 superalloy. Trans. Nonferrous Met. Soc. China 2012, 22, s84–s88. [Google Scholar] [CrossRef]
- Chen, Z.J.; Lin, Y.C.; He, D.G.; Lou, Y.M.; Chen, M.S. A unified dislocation density-based model for an aged polycrystalline Ni-based superalloy considering the coupled effects of complicate deformation mechanisms and initial δ phase. Mater. Sci. Eng. A 2021, 827, 142062. [Google Scholar] [CrossRef]
- Wen, D.X.; Yue, T.Y.; Xiong, Y.B.; Wang, K.; Wang, J.K.; Zheng, Z.Z.; Li, J.J. High-temperature tensile characteristics and constitutive models of ultrahigh strength steel. Mater. Sci. Eng. A 2021, 803, 140491. [Google Scholar] [CrossRef]
- He, D.G.; Yan, X.T.; Lin, Y.C.; Zhang, S.; Chen, Z.J. Microstructure evolution and constitutive model for a Ni-Mo-Cr base alloy in double-stages hot compression with step-strain rates. Mater. Charact. 2022, 194, 112385. [Google Scholar] [CrossRef]
- Chen, F.; Wang, H.; Zhu, H.J.; Zhu, H.Y.; Ren, F.C.; Cui, Z.S. High-temperature deformation mechanisms and physical-based constitutive modeling of ultra-supercritical rotor steel. J. Manuf. Process. 2019, 38, 223–234. [Google Scholar] [CrossRef]
- Dini, H.; Svoboda, A.; Andersson, N.E.; Ghassemali, E.; Lindgren, L.E.; Jarfors, A.E.W. Optimization and validation of a dislocation density based constitutive model for as-cast Mg-9%Al-1%Zn. Mater. Sci. Eng. A 2018, 710, 17–26. [Google Scholar] [CrossRef]
- Opela, P.; Schindler, L.; Kawulok, P.; Kawulok, R.; Rusz, S.; Sauer, M. Shallow and deep learning of an artificial neural network model describing a hot flow stress Evolution: A comparative study. Mater. Des. 2022, 220, 110880. [Google Scholar] [CrossRef]
- Churyumov, A.; Kazakova, A.; Churyumova, T. Modelling of the Steel High-Temperature Deformation Behaviour Using Artificial Neural Network. Metals 2022, 12, 447. [Google Scholar] [CrossRef]
- He, D.G.; Lin, Y.C.; Chen, J.; Chen, D.D.; Huang, J.; Tang, Y.; Chen, M.S. Microstructural evolution and support vector regression model for an aged Ni-based superalloy during two-stage hot forming with stepped strain rates. Mater. Des. 2018, 154, 51–62. [Google Scholar] [CrossRef]
- He, D.G.; Chen, S.B.; Lin, Y.C.; Xie, H.; Li, C.B. Hot tensile behavior of a 7046-aluminum alloy: Fracture mechanisms and constitutive models. Mater. Today Commun. 2023, 34, 105209. [Google Scholar] [CrossRef]
- Wan, P.; Zou, H.; Wang, K.L.; Zhao, Z.Z. Research on hot deformation behavior of Zr-4 alloy based on PSO-BP artificial neural network. J. Alloys Compd. 2020, 826, 154047. [Google Scholar] [CrossRef]
- Huang, K.; Logé, R.E. A review of dynamic recrystallization phenomena in metallic materials. Mater. Des. 2016, 111, 548–574. [Google Scholar] [CrossRef]
- Jiang, Y.Q.; Lin, Y.C.; Pang, G.D.; He, D.G.; Kotkunde, N. Constitutive Model and Processing Maps for a Ti-55511 Alloy in beta Region. Adv. Eng. Mater. 2020, 22, 1900930. [Google Scholar] [CrossRef]
- Mecking, H.; Kocks, U.F. Kinetics of flow and strain-hardening. Acta Mater. 1981, 29, 1865–1875. [Google Scholar] [CrossRef]
- He, D.G.; Su, G.; Lin, Y.C.; Jiang, Y.Q.; Li, Z.; Chen, Z.J.; Yan, X.T.; Xia, Y.C.; Xie, Y.C. Microstructural Variation and a Physical Mechanism Model for a Ti-55511 Alloy during Double-Stage Hot Deformation with Stepped Strain Rates in the beta Region. Materials 2021, 14, 6371. [Google Scholar] [CrossRef] [PubMed]
- Xue, S.; Chen, H.L.; Zheng, X.L. Detection and quantification of anomalies in communication networks based on LSTM-ARIMA combined model. Int. J. Mach. Learn. Cybern. 2022, 13, 3159–3172. [Google Scholar] [CrossRef] [PubMed]


| Elements | C | Si | Cr | Mo | Fe | Co | W | V | P | S | Ni |
|---|---|---|---|---|---|---|---|---|---|---|---|
| Contents | 0.007 | 0.06 | 15.8 | 16.2 | 6.5 | 1.9 | 4.2 | 0.30 | 0.035 | 0.025 | Bal. |
| Material Parameter | Value | Material Parameter | Value |
|---|---|---|---|
| Aw | 1.696 | Av | 206,710.508 |
| Qw (kJ/mol) | 294.993 | Qv (kJ/mol) | 247.962 |
| nw | 0.118 | nv | −0.431 |
| Ag | 0.002 | AX | 0.004 |
| Qg (kJ/mol) | 336.114 | QX (kJ/mol) | 249.845 |
| ng | 0.306 | nX | 0.366 |
| Ay | 128.233 | ny | 7.643 |
| Qy (kJ/mol) | 573,636.89 | ny | 3.907 × 10⁻²² |
Disclaimer/Publisher’s Note: The statements, opinions and data contained in all publications are solely those of the individual author(s) and contributor(s) and not of MDPI and/or the editor(s). MDPI and/or the editor(s) disclaim responsibility for any injury to people or property resulting from any ideas, methods, instructions or products referred to in the content. |
© 2023 by the authors. Licensee MDPI, Basel, Switzerland. This article is an open access article distributed under the terms and conditions of the Creative Commons Attribution (CC BY) license (https://creativecommons.org/licenses/by/4.0/).
Share and Cite
He, D.; Chen, S.; Lin, Y.; Yan, X.; Liu, G. Hot Deformation Behavior of Hastelloy C276 Alloy: Microstructural Variation and Constitutive Models. Materials 2023, 16, 6192. https://doi.org/10.3390/ma16186192
He D, Chen S, Lin Y, Yan X, Liu G. Hot Deformation Behavior of Hastelloy C276 Alloy: Microstructural Variation and Constitutive Models. Materials. 2023; 16(18):6192. https://doi.org/10.3390/ma16186192
Chicago/Turabian StyleHe, Daoguang, Shibing Chen, Yongcheng Lin, Xintao Yan, and Guan Liu. 2023. "Hot Deformation Behavior of Hastelloy C276 Alloy: Microstructural Variation and Constitutive Models" Materials 16, no. 18: 6192. https://doi.org/10.3390/ma16186192