Article

Study on the Fluorination Process of Sc2O3 by NH4HF2

Shandong Provincial Key Laboratory of High Strength Lightweight Metallic Materials, Advanced Materials Institute, Qilu University of Technology (Shandong Academy of Sciences), Jinan 250014, China
*
Authors to whom correspondence should be addressed.
Materials 2023, 16(17), 5984; https://doi.org/10.3390/ma16175984
Submission received: 15 August 2023 / Revised: 29 August 2023 / Accepted: 30 August 2023 / Published: 31 August 2023
(This article belongs to the Special Issue Preparation and Applications of Metal and Alloy Powders)

Abstract

:
Research on rare-earth fluorides is of urgent and critical importance for the preparation and emerging applications of high-purity alloys. The fluorination of Sc2O3 by NH4HF2 to fabricate ScF3 is investigated. The effects of the fluorination temperature, time and mass ratio of reactant on the fluorination rate and fluoride are discussed in this work. The fluorination reaction was first confirmed using thermodynamic calculation. The thermal and mass stability of the fluorination process were analyzed by thermogravimetric and differential scanning calorimetric (TG-DSC). The as-obtained products at different fluorination temperatures were characterized by Powder X-ray diffraction (PXRD), scanning electron microscopy (SEM) and high-resolution transmission electron microscopy (HRTEM). The results indicated that the fluorination began at room temperature (RT) with the formation of (NH4)3ScF6. With the increase of temperature, the reaction proceeded sequentially through the formation of NH4ScF4, (NH4)2Sc3F11, and finally ScF3. The fluorination rate increased with the increase of fluorination temperature and holding time. ScF3 with a purity of 99.997 wt.% could be obtained by fluorination at 400 °C for 2 h.

1. Introduction

With the extensive applications of the Sc element in superconducting materials [1], as well as in automotive [2], aerospace, military [3], fluorescence [4] and solid oxide fuel batteries [5,6,7,8], the requirements for the quality of scandium or its alloys are also increasing. However, obtaining these metals is very difficult due to the high chemical activity of scandium. ScF3 is stabilized, non-hygroscopic, and slightly soluble in water and mineral acids [9,10,11], which constitute an important raw material for the preparation of scandium and aluminum-scandium alloy by electrolytic process [12] or metallothermic method [13].
The production technologies of ScF3 from Sc2O3 involves three main methods: wet, gas and solid-phase fluorination, respectively. The wet preparation method using aqueous hydrofluoric acid (HF) has no specific requirement for equipment, but the efficiency of fluorination is inefficient. Meanwhile, the product has a high content of ScOF, which limits ScF3 applications in high-end fields [14]. Fluorination with hydrogen fluoride gas (HF) or fluorine gas (F2) is a relatively short-term procedure, but these are corrosive and poisonous gases. Solid-phase fluorination using ammonium fluoride (NH4F) or ammonium hydrogen fluoride (NH4HF2) [15] is an economical and efficient preparation method. NH4F is highly hygroscopic, which will lead to the oxygen contamination of fluoride. NH4HF2 is a widely used fluorinating medium at lower temperatures, the fluorination process carries fewer impurities, and the requirements for equipment are lower. At room temperature, NH4HF2 does not represent any significant environmental danger, since it is solid with a very low partial pressure, whereas, when heated, it becomes a powerful fluorinating reagent [16,17]. Therefore, NH4HF2 is widely used to purify minerals and prepare fluorides from rare-earth oxides, for example, silica concentrate desilication [18], metal slag desiliconization [19], desilication of zirconium concentrates [20] and the production of GdF3 [21], PuF3 [22], and YF3 [23].
It is reported that the fluorination process of metal oxides includes the multi-step decomposition of intermediate products, as shown in Table 1. Hao et al. [21] and Claux et al. [22] reported that GdF3 and PuF3 had been obtained through a two-step reaction, respectively. Mukherjee et al. [23] and Zhou et al. [24] suggested that the fluorination of metal oxides required three steps to complete. However, the fluorination processes of BeO2 [25], Al2O3 [26], and Fe2O3 [27] occur through three ammonium metal fluorides, respectively.
The reports on the preparation process of ScF3 by Sc2O3 and NH4HF2 are few. Meanwhile, there are also different opinions about the reaction mechanism of fluorination. Zhang et al. [28] pointed out that Sc2O3 and NH4HF2 underwent a pre-fluorination reaction during the mixing process to generate the intermediate product (NH4)3ScF6, which was thermally decomposed at 274.82 °C to form ScF3. The unreacted NH4HF2 in the pre-fluorination process was thermally decomposed in the fluorination furnace to form NH3 and HF, while Sc2O3 was fluorinated with HF to generate ScF3. Rakov et al. [29] concluded that the pre-fluorination product of (NH4)3ScF6 decomposed to NH4ScF4 at 260–290 °C and that NH4ScF4 decomposed to ScF3 at 340–350 °C. Sokolova et al. [30] pointed out that adding NaF to the aqueous solution of Sc2O3 and NH4HF2 will form Na(NH4)2ScF6/Na3ScF6. After treatment, ScF3 could be obtained.
The goal of this work is to explore the fluorination process of Sc2O3 and NH4HF2. The thermodynamic process of the fluorination reaction is predicated on theoretical calculation. The fluorination intermediate products are investigated. The results indicated that the fluorination started at room temperature (RT) and through the intermediate products of (NH4)3ScF6, NH4ScF4, (NH4)2Sc3F11 on to the final ScF3. The fluorination process of Sc2O3 and the decomposition process of fluorides have been analyzed to provide a new idea for how to obtain high-purity ScF3.

2. Materials and Methods

2.1. Materials

In this study, Sc2O3 powders (>99.9 wt.% purity) were fabricated by Hunan Oriental Scandium Industry, Hunan, China, as shown in Figure 1. Commercially available analytical reagent NH4HF2 crystals (Aladdin, Shanghai, China, >98.00 wt.% purity) were used as the fluorination reagent.

2.2. Preparation

The mixtures (mass ratio of NH4HF2:Sc2O3 = 2 or 3) were ground and stirred in an alumina crucible for several minutes. Then, the mixtures were compacted to achieve full contact between Sc2O3 and NH4HF2 particles to promote the fluorination reaction. Subsequently, the mixtures were kept isothermal with different temperatures and times, and afterwards they were quickly cooled down to room temperature. To analyze the decomposition process of the fluorides, the mixture of Sc2O3 and NH4HF2 with a mass ratio of 1:3 was held at 100 °C for 24 h. The schematic diagram of the experimental process is shown in Figure 2.

2.3. Characterization

The powder X-ray diffraction (PXRD) of the samples was detected on a SmartLab 9 kW diffractometer (Rigaku, Tokyo, Japan) with Cu Ka radiation at a scanning rate of 10°/min under tube conditions of 40 KV and 60 mA. Thermogravimetric analysis and differential scanning calorimetry (TG-DSC) for a few mixtures of Sc2O3 and NH4HF2 were carried out on a TGA/DSC thermal analyzer (Mettler Toledo, Zurich, Switzerland) under argon atmosphere with a heating rate of 3 °C/min from RT to 500 °C in an alumina crucible. The microstructure and morphology were observed using a EVOMA 10 scanning electron microscope (SEM, Carl Zeiss AG, Oberkochen, Germany) with an energy dispersive spectrometer (EDS) to identify different elements. High-resolution transmission electron microscopy (HRTEM) and selected-area electron diffraction (SAED) images were performed on a Talos F200X transmission electron microscope (TEM, Thermo-Fisher Scientific, Waltham, MA, USA) with an accelerating voltage of 200 KV. The composition of the obtained ScF3 was identified using a iCAP 7400 inductively coupled plasma spectrometer (ICP, Thermo-Fisher Scientific, Waltham, MA, USA).

3. Results and Discussion

3.1. Thermodynamic Analysis

At a certain temperature, the value of the Gibbs free energy is a key factor, determining whether a reaction can proceed. The increase or decrease of H 0 can be a judgment dependent on the variation of the overall energy of the reaction. The thermal equilibrium constant K is used to indicate the reactivity of a chemical reaction at a specified temperature. A higher K value means that the reaction can be carried out thoroughly [31,32,33].
According to the previous introduction, the intermediate products will be formed during the fluorination process between NH4HF2 and Sc2O3. Due to the lack of thermodynamic data, this work does not discuss intermediate reactions. Thermodynamic data are only calculated when the final product is ScF3. Figure 3 shows the schematic diagram of the fluorination reaction process. It can be found that the rare-earth sesquioxides cubic structure of Sc2O3 turns into the cubic structure of ScF3 [34]. At the same time, NH3 and H2O are formed. The chemical equation may be expressed by Equation (1).
S c 2 O 3 + 3 N H 4 H F 2 = 2 S c F 3 + 3 N H 3 g + 3 H 2 O g
The thermodynamic data of the fluorination reaction are calculated by HSC Chemistry 6.0 software, as shown in Table 2 and Figure 4. It is clear that G 0 < 0 in the temperature range 0–1000 °C, indicating that the reaction can proceed spontaneously. H 0 < 0 in the temperature range of 0–1000 °C, suggesting that the reaction of Sc2O3 and NH4HF2 is exothermic. Generally, the reaction equilibrium constant K > 105 signifies that the reaction can occur thoroughly. Here, the Lg(K) is more than 9 under 0–1000 °C, confirming that the reaction can be carried out adequately. The results indicate that the fluorination reaction can easily occur under general conditions.

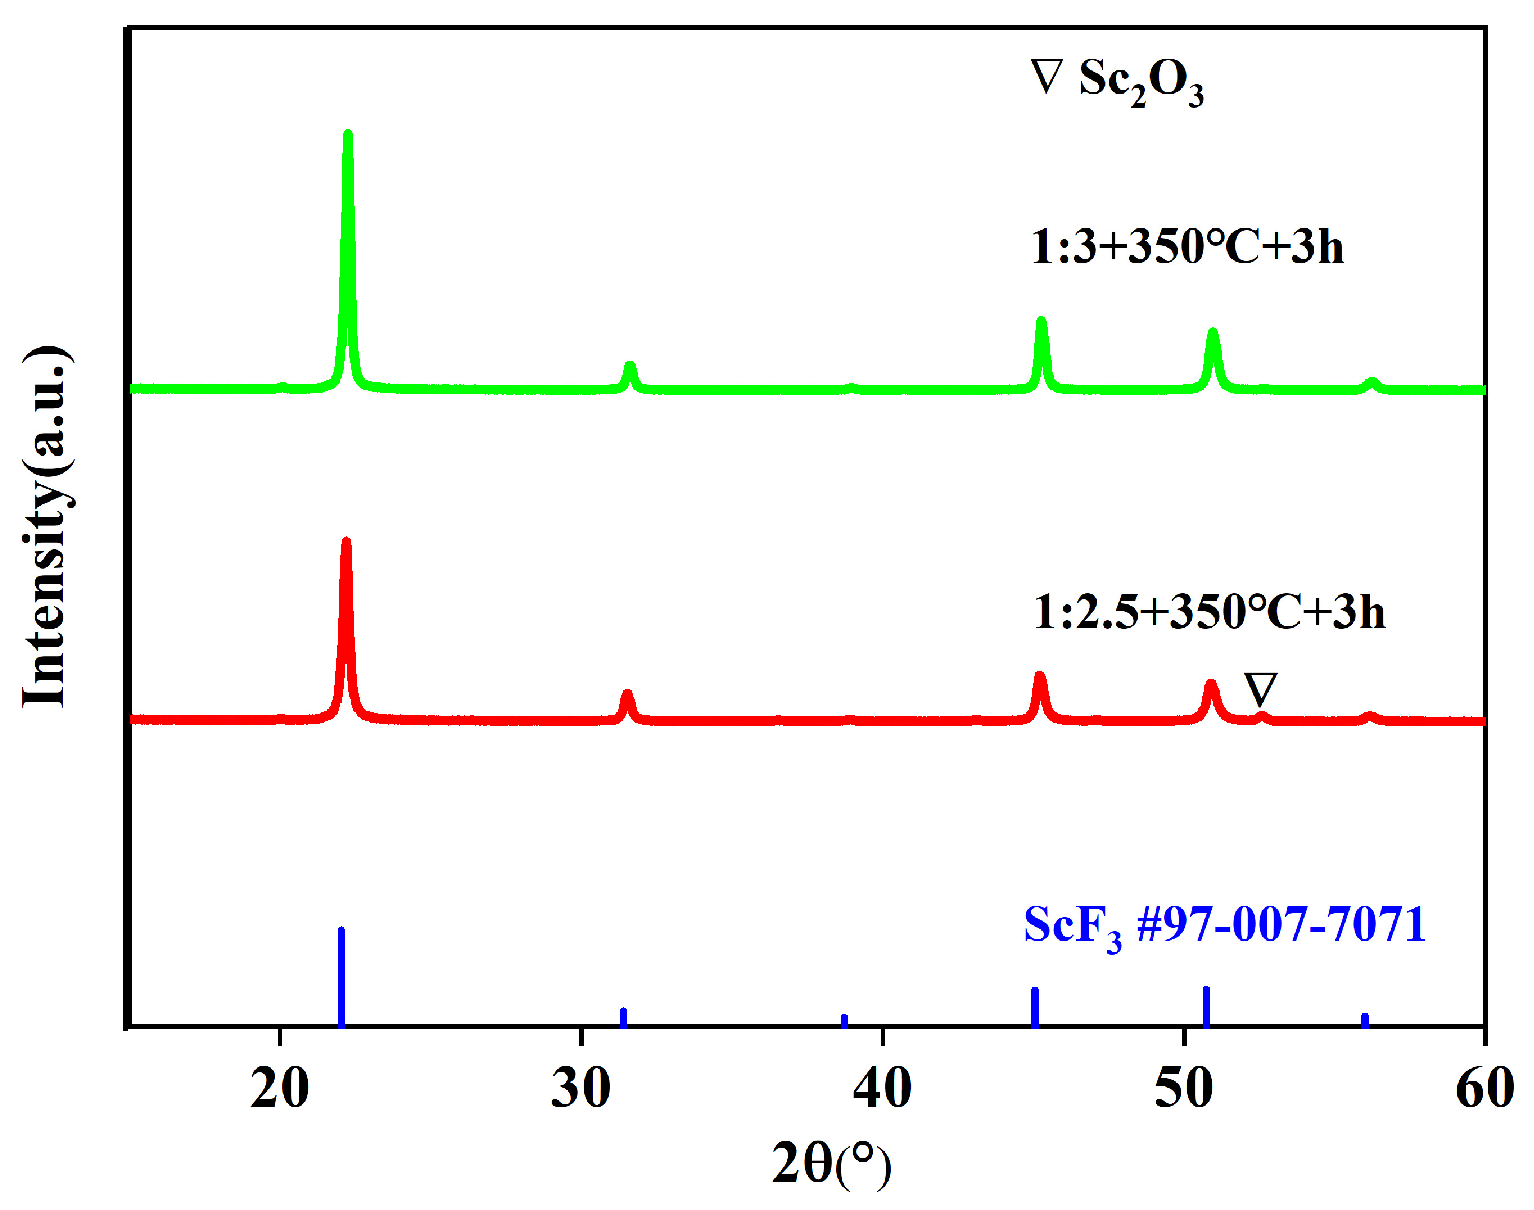
3.2. Fluorination Process Analysis

Figure 5 shows the TG-DSC analysis of the Sc2O3 and NH4HF2 mixtures with a mass ratio of 1:3 after incubation in the 25–500 °C range. The mixtures were kept isothermal at 100 °C for 24 h to ensure that all Sc2O3 was converted into fluoride, while removing unreacted NH4HF2 and formed H2O [23,26,29]. The results show that there are three mass loss peaks at 120 °C, 220 °C and 260 °C and that they are 35%, 7%, and 10%, respectively. The total mass loss is approximately 52% during the fluoridation processes.
The results of TG-DSC indicated that the thermal and mass changes were due to chemical reactions. To further identify and analyze the fluorides obtained in each of the reaction stages on TG-DSC curves, samples were prepared with different fluorination temperatures of RT, 100 °C, 200 °C, 300 °C, 350 °C, and 400 °C and held for 2 h, before being analyzed using PXRD, as shown in Figure 6. One can clearly see that the PXRD diffraction peaks of these fluorinated products occur without the diffraction patterns of ScOF.
The diffraction peaks of (NH4)3ScF6 (#97-001-9073) and Sc2O3 are detected in the PXRD of fluoride at room temperature. An interesting phenomenon was discovered, which was that the alumina crucible became hot during the mixing of the powders at room temperature. At the same time, the mixed powder gradually became moist. The results indicate that the fluorination of Sc2O3 by NH4HF2 had begun at room temperature, forming (NH4)3ScF6 and H2O by exothermic reaction. The possible reaction processes for the (NH4)3ScF6 at room temperature is shown in Equation (2). This is consistent with the results reported by Sokolova et al. [35]. Mukherjee et al. [23] also reported that fluorination of Y2O3 by NH4HF2 begins at room temperature with the formation of (NH4)3Y2F9.
S c 2 O 3 + 6 N H 4 H F 2 = 2 N H 4 3 S c F 6 + 3 H 2 O
When the fluorination temperature is 100 °C, only the diffraction peaks of (NH4)3ScF6 are observed. This illustrates that Sc2O3 had completely reacted and formed (NH4)3ScF6. This is due to the fact that the enhanced atomic activity with a rising temperature promoted the fluorination reaction.
As the fluorination temperature rises to 200 °C, diffraction peaks of NH4ScF4 (#97-024-0472) and (NH4)3ScF6 are detected. This indicates that (NH4)3ScF6 is gradually converted into NH4ScF4. The reaction can be expressed in Equation (3), which is a decomposition reaction. The theoretical calculation suggests that the mass loss before and after the reaction is 34.74%, which coincides with the 35% mass loss of the first stage in the TG curve.
N H 4 3 S c F 6 = N H 4 S c F 4 + 2 N H 3 g + 2 H F g
At a fluorination temperature of 300 °C, the diffraction peaks of (NH4)3ScF6 disappear from the PXRD pattern with the presence of diffraction peaks of NH4ScF4 and a new phase of (NH4)2Sc3F11 (#97-016-5543). This implies that (NH4)3ScF6 had been completely decomposed to NH4ScF4 at 300 °C and that NH4ScF4 had begun to transform into (NH4)2Sc3F11. The decomposition reaction of NH4ScF4 could be illustrated in Equation (4). The theoretical calculation reveals that the mass loss before and after the reaction is 8.79%, which corresponds to the 7% mass loss of the second stage in the TG curve.
3 N H 4 S c F 4 = N H 4 2 S c 3 F 11 + N H 3 g + H F g
The diffraction peaks of NH4ScF4 vanish from the PXRD pattern at 350 °C. Simultaneously, the diffraction peaks of the other phase of ScF3 (#97-007-7071) begin to appear. This is due to the fact that NH4ScF4 had thoroughly decomposed to (NH4)2Sc3F11, while (NH4)2Sc3F11 had gradually disintegrated to form ScF3. The decomposition reaction of (NH4)2Sc3F11 is shown in Equation (5). The theoretical calculation shows that the mass loss of the decomposition reaction is 11.58%, which is consistent with the 10% mass loss of the third stage in the TG curve.
N H 4 2 S c 3 F 11 = 3 S c F 3 + 2 N H 3 g + 2 H F g
All the diffraction peaks of ScF3 agree with the JCPDS card no. 97-007-7071, and no impurity is observed. This means that pure-phase samples with a crystal structure of ScF3 have been obtained at the fluorination temperature of 400 °C.
The above results show that (NH4)3ScF6 loses two NH3 and two HF to form NH4ScF4 at about 200 °C. NH4ScF4 will decompose to form (NH4)2Sc3F11, NH3 and HF at around 300 °C. At approximately 350 °C, (NH4)2Sc3F11 will decompose to form ScF3. In the practical production process, a rational and convenient preparation technology should be considered. Therefore, pure ScF3 can be obtained by fluorination of Sc2O3 with NH4HF2 at 400 °C for 2 h.

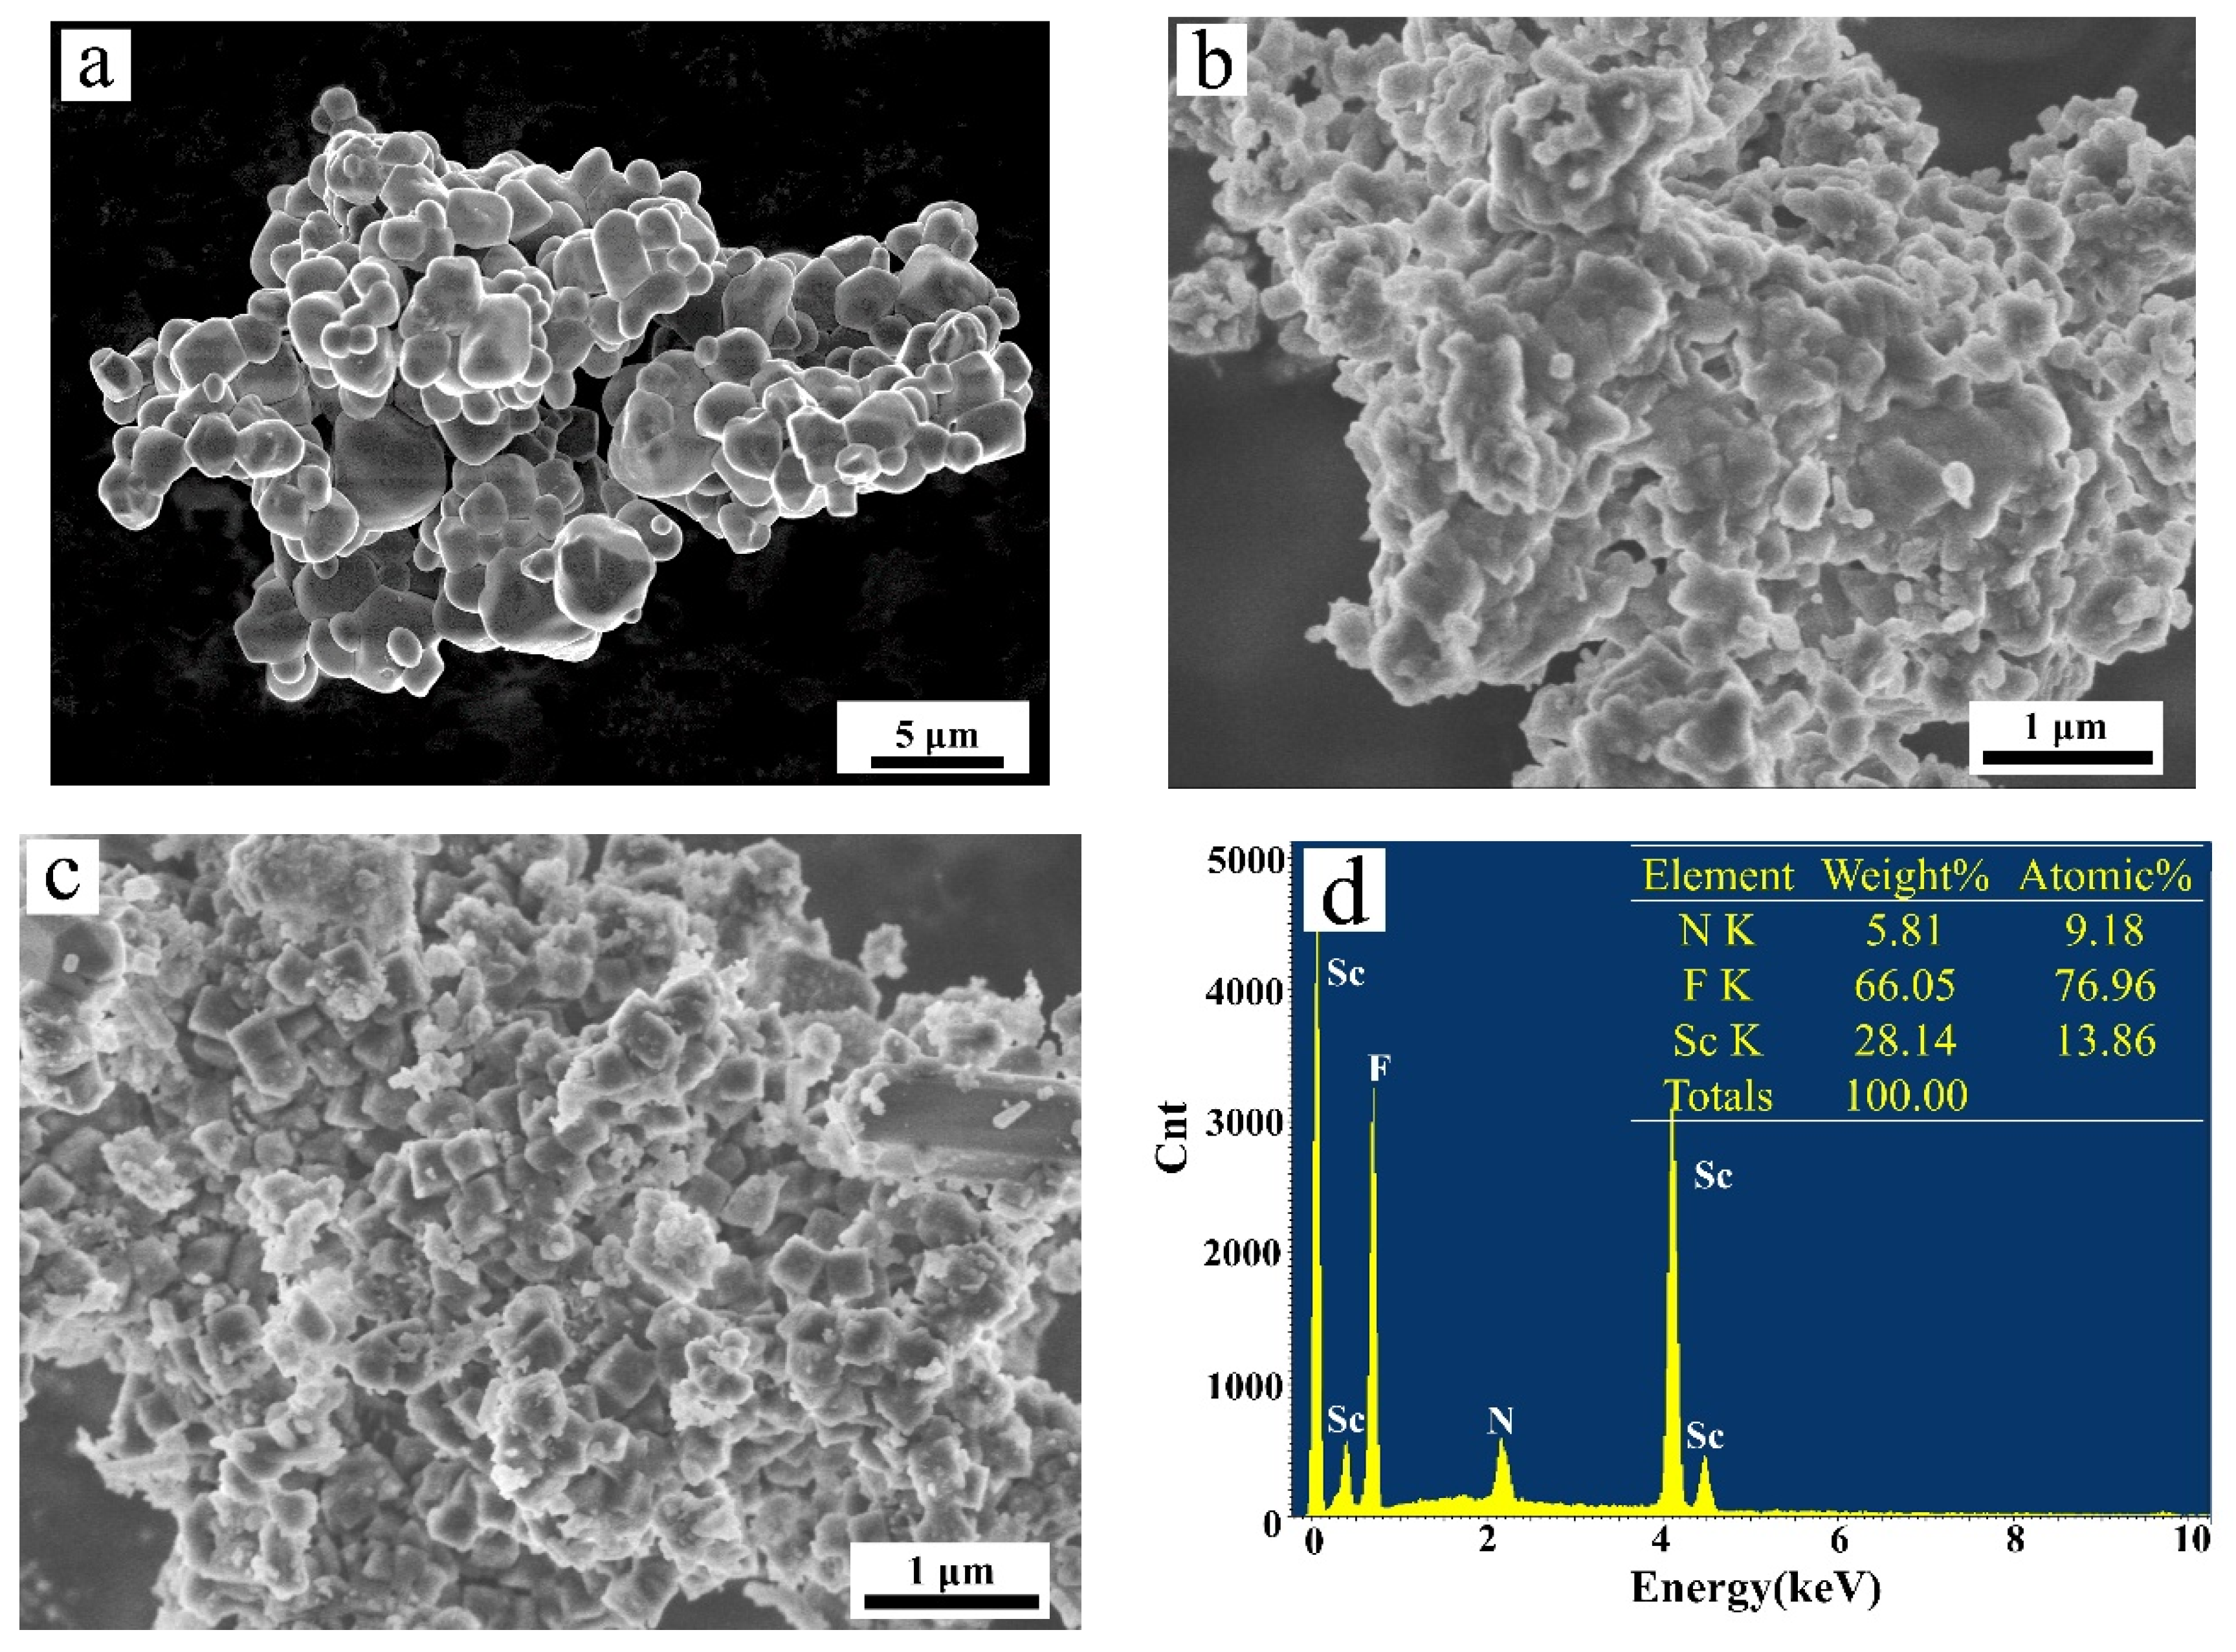
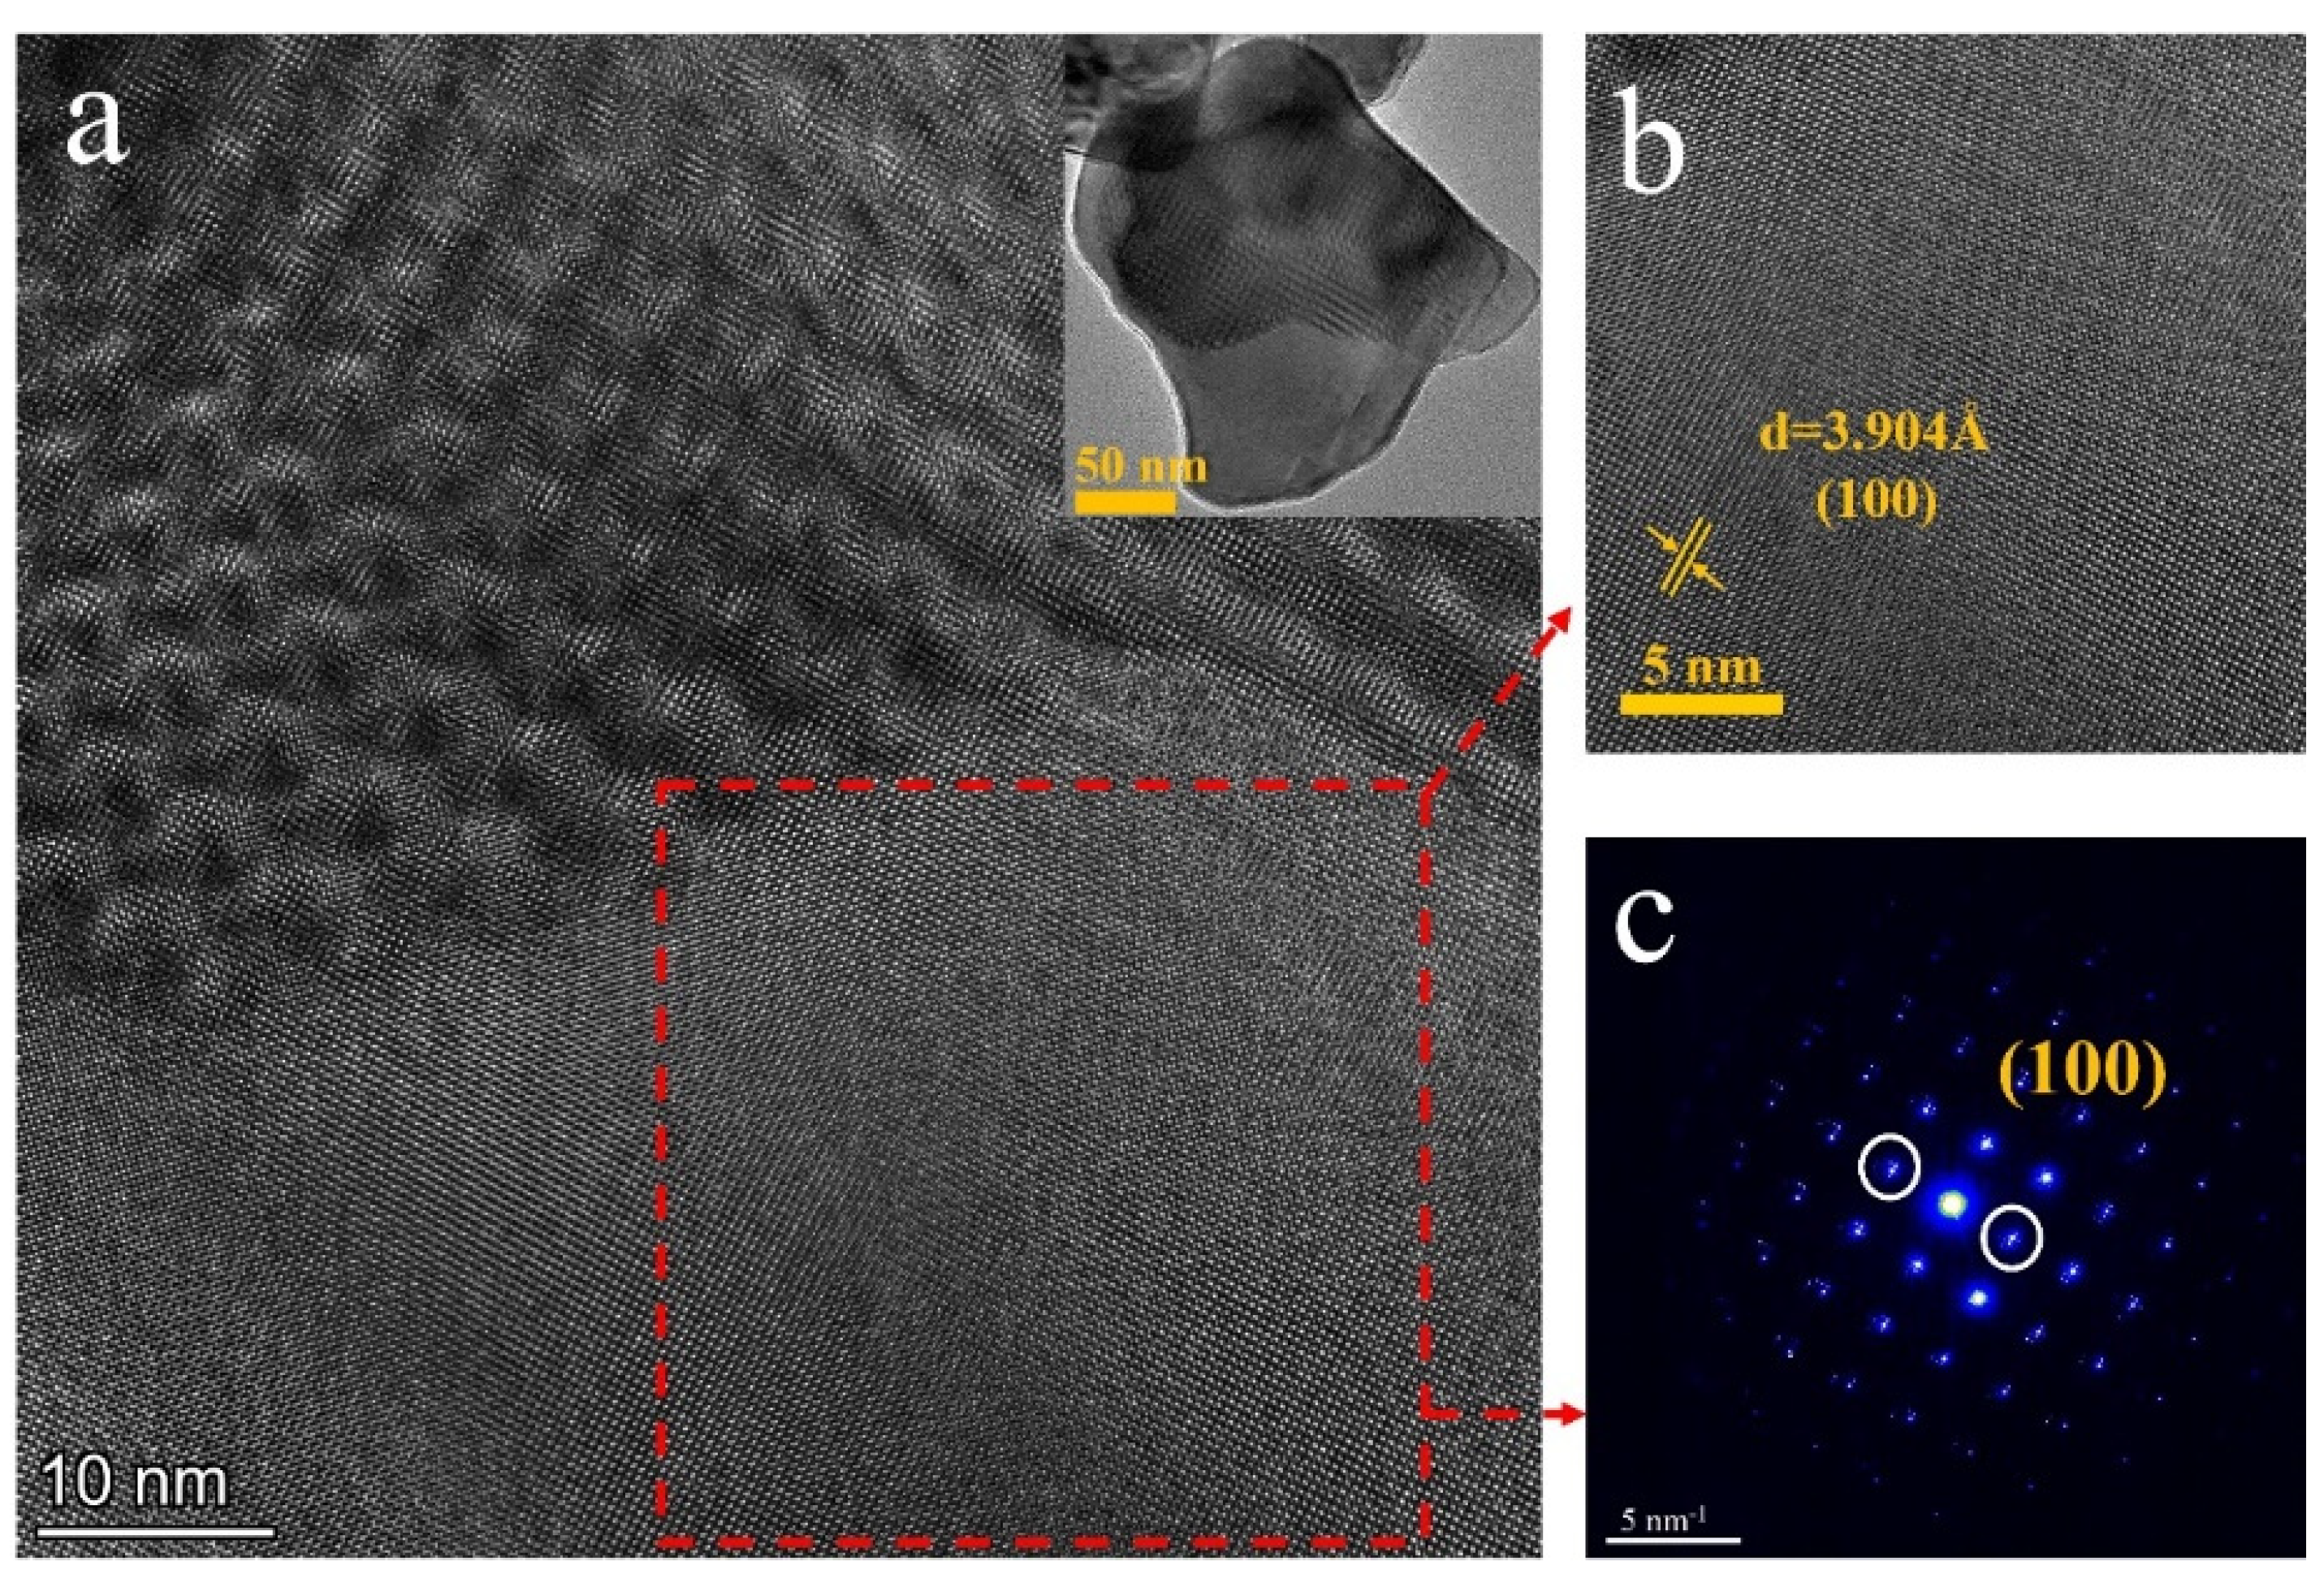
3.3. Microscopic Morphology and Structural Analysis

Figure 7a–c shows the SEM images of (NH4)3ScF6, the mixture of NH4ScF4 and (NH4)2Sc3F11, and ScF3, respectively. It can be observed that the shapes of (NH4)3ScF6, NH4ScF4, and (NH4)2Sc3F11 are irregular, with varying average dimensions and morphologies. However, ScF3 mainly consists of a regular cubic structure with an average size of approximately 0.3 μm (Figure 7c), measured by Image-Pro Plus 6.0 image processing software. To obtain more detailed information about the content in the fluorides, the corresponding EDS analysis is exhibited in Figure 7d–f. Due to the large error in the measurement of light elements using EDS, we only pay attention to F and Sc elements here. It shows that the main components of fluorides are F and Sc and that the atom ratio F to Sc is about 6:1 in (NH4)3ScF6. Meanwhile, the atomic ratio F to Sc is close to 1:3 (Figure 7f), which is consistent with the atomic ratio of ScF3. Figure 7g–j illustrates the crystal structures of (NH4)3ScF6, NH4ScF4, (NH4)2Sc3F11 and ScF3. As shown in Figure 7j, ScF3 belongs to a cubic crystal structure, and the unit cell contains one Sc-atom (located at the center of octahedrons) and three F-atoms (located at the vertex of octahedrons).
To further investigate the microstructures of (NH4)3ScF6 and ScF3, they were characterized by TEM. The HRTEM images of (NH4)3ScF6 particles are shown in Figure 8a,b. The inner-plane distance is about 3.907 Å, corresponding to the (012) crystal plane spacing of (NH4)3ScF6, which matches with the PXRD analysis of 3.835 Å in (NH4)3ScF6 (#97-001-9073). The SAED pattern of (NH4)3ScF6 is shown in Figure 8c, which confirms that (NH4)3ScF6 is a single-crystal structure with regular diffraction spots. Figure 7g shows the crystal structure model of (NH4)3ScF6, which has an octahedral chalcogenide structure as a result of the separated octahedral groups [ScF6]3− and [NH4]+ [34,36,37,38]. The compound contains one site of Sc-ions, which occupy the 4a site and combine with six surrounding F-ions to form an octahedron [ScF6]3− [38].
The HRTEM image and SAED pattern of the ScF3 particle are shown in Figure 9a–c. The results show that the interplanar space of about 3.904 Å corresponds to the (100) planes of ScF3, in keeping with the (100) crystalline spacing of 4.011 Å in ScF3 (#97-007-7071). The SAED was performed on a typical individual cube of ScF3, as shown in Figure 9c. The sharp diffraction spots verify that ScF3 is well developed in a single-crystalline structure with a crystallographic orientation [11].
To further research the purity, the as-prepared ScF3 synthesized at 400 °C for 2 h was analyzed by ICP, as shown in Table 3. The results display that the purity of ScF3 reached 99.997 wt.%. This further proves that relatively pure ScF3 can be prepared by the fluorination of Sc2O3 with NH4HF2 at 400 °C for 2 h.

3.4. Effect of Temperature on Fluorination

The reaction temperature is an important factor affecting the fluorination process. In order to indicate the degree of fluorination reaction, the fluorination rate k% is defined as follows [33]:
k % = m F M F × 100 %
where m F is the theoretical mass of ScF3 after the fluorination, and M F is the mass of fluoride after the fluorination.
Figure 10a shows the fluorination rate k% of ScF3 after the fluorination at different temperatures. In the range of 250–400 °C, k% is enhanced from 51.60% to 99.99% as the reaction temperature increases. The PXRD patterns of Sc2O3 and NH4HF2 mixtures with a mass ratio of 1:3 after fluorination at different temperatures for 3 h were detected, as shown in Figure 10b. Only the diffraction peaks of ScF3 (#97-007-7071) are observed when the fluorination temperature is above 350 °C. This proves that the reaction can be fully carried out at a lower temperature. The results indicate that the reaction can be carried out adequately with a rising temperature. This is consistent with the thermodynamic calculations.

3.5. Effect of Time on Fluorination

The holding time was also a significant influencing factor. The fluorination rate k% of ScF3 after fluorination at 350 °C for different times is shown in Figure 11a. The results show that the fluorination rate k% also increases with an increase in the holding time. The growth rate of k% at 0.5–2 h is significantly faster than at 2–4 h, indicating that the fluorination reaction has made great progress in the early stage. The fluorination rate k% can reach 98% when the fluorination time is 3 h. Figure 11b shows the PXRD patterns of fluoride at different holding times. The diffraction peaks of ScF3 (#97-007-7071) are observed; when the fluorination time is above 3 h, there are no diffraction peaks.
The above results reveal that the fluorination reaction can also be carried out relatively thoroughly at lower temperatures and with enough holding time.

3.6. Effect of Mass Ratio on Fluorination

In addition to the fluorination temperature and time, the mass ratio of Sc2O3 to NH4HF2 also affects the fluorination results. According to the chemical Equation (2), the theoretical mass ratio of Sc2O3 and NH4HF2 is about 1:2.47. Two sets of samples were prepared with a mass ratio of 1:2.5 or 1:3 at 350 °C for 3 h. Figure 12 shows the PXRD patterns of the samples. It can be found that the mass ratios of Sc2O3/NH4HF2 can influence the final product. The diffraction peaks of ScF3 (#97-007-7071) and Sc2O3 are detected in the PXRD of the fluoride at a mass ratio of 1:2.5. This indicates that the fluoridation process is incomplete. Because the boiling point of NH4HF2 is about 230 °C, NH4HF2 could cause mass loss during the experimental process. This leads to a residue of Sc2O3. When the ratio is 1:3, only the diffraction peaks of ScF3 (#97-007-7071) are observed.
The chemical reaction is a process of reaching equilibrium. As the reaction progresses, the concentration of reactants gradually decreases, and the reaction rate slows down. The excess of raw materials helps the reaction move in the direction of generating products, which makes the reaction more complete and increases the reaction rate. Meanwhile, diffusion difficulties can hinder the development of the reaction. Therefore, the appropriate excess of NH4HF2 is beneficial for obtaining high-purity ScF3.

4. Conclusions

In this paper, high-quality ScF3 has been synthesized via a facile solid-phase fluorination method using Sc2O3 and NH4HF2. The fluorination process is investigated by TG-DSC and PXRD. The fluorination temperature has a critical impact on controlling the fluoride. The main conclusions are summed up below:
(1)
The fluorination thermodynamic process between NH4HF2 and Sc2O3 is calculated. In the range of 0–1000 °C, G 0 < 0, H 0 < 0, and Lg(K) > 9, confirming that the fluorination is a spontaneous exothermic reaction and can be carried out completely.
(2)
The fluorination of Sc2O3 by NH4HF2 begins at room temperature, forming (NH4)3ScF6 and H2O by exothermic reaction. As the temperature increases, a series of decomposition reactions will occur, so as to form: NH4ScF4→(NH4)2Sc3F11→ScF3. The PXRD diffraction peaks of the fluorides indicate that ScOF is not produced during the fluorination process.
(3)
ScF3 with a purity of 99.997 wt.% can be obtained at 400 °C for 2 h. The ScF3 shows a regular cubic structure with an average size of 0.3 μm.
(4)
The effects of the fluorination temperature, time, and mass ratio of raw materials were investigated. The results indicated that the fluorination rate increased with an increase of the reaction temperature and time. When the mass ratio of NH4HF2 to Sc2O3 ≥ 3, ScF3 with a higher purity can be obtained.

Author Contributions

Conceptualization, Z.L. and J.W.; Methodology, Z.L. and C.Z.; Formal analysis, H.Y., X.W. and S.T.; Writing—original draft, Z.L. and J.W.; Writing—review & editing, J.Z. and J.W.; Funding acquisition, X.W. All authors have read and agreed to the published version of the manuscript.

Funding

The research was funded by Shandong Province Key Research and Development Plan (Grant Nos. 2021CXGC010310 and Nos. 2021SFGC1001).

Institutional Review Board Statement

Not applicable.

Informed Consent Statement

Not applicable.

Data Availability Statement

All data are available from the corresponding author on reasonable request.

Conflicts of Interest

The authors declare no conflict of interest.

References

  1. Dehabadi, M.; Legin, E.; Legin, A.; Yaghmaei, S.; Nechaev, A.; Babain, V.; Kirsanov, D. Developing potentiometric sensors for scandium. Sensor. Actuat. B Chem. 2021, 348, 130699–130708. [Google Scholar] [CrossRef]
  2. Silvestri, L.; Forcina, A.; Silvestri, C.; Traverso, M. Circularity potential of rare earths for sustainable mobility: Recent developments, challenges and future prospects. J. Clean. Prod. 2021, 292, 126089–126104. [Google Scholar] [CrossRef]
  3. Pasechnik, L.A.; Skachkov, V.M.; Chufarov, A.Y.; Suntsov, A.Y.; Yatsenko, S.P. High purity scandium extraction from red mud by novel simple technology. Hydrometallurgy 2021, 202, 105597–105607. [Google Scholar] [CrossRef]
  4. Binnemans, K.; Jones, P.T.; Müller, T.; Yurramendi, L. Rare Earths and the Balance Problem: How to Deal with Changing Markets? J. Sustain. Metall. 2018, 4, 126–146. [Google Scholar] [CrossRef]
  5. Xia, Z.G.; Liu, Q.L. Progress in discovery and structural design of color conversion phosphors for LEDs. Prog. Mater. Sci. 2016, 84, 59–117. [Google Scholar] [CrossRef]
  6. Riva, S.; Yusenko, K.V.; Lavery, N.P.; Jarvis, D.J.; Brown, S.G.R. The scandium effect in multicomponent alloys. Int. Mater. Rev. 2016, 61, 203–228. [Google Scholar] [CrossRef]
  7. Boulon, G. Fifty years of advances in solid-state laser materials. Opt. Mater. 2012, 34, 499–512. [Google Scholar] [CrossRef]
  8. Laguna-Bercero, M.A.; Kinadjan, N.; Sayers, R.; El Shinawi, H.; Greaves, C.; Skinner, S.J. Performance of La2-xSrxCo0.5Ni0.5O4±δ as an Oxygen Electrode for Solid Oxide Reversible Cells. Fuel Cells 2011, 11, 102–107. [Google Scholar] [CrossRef]
  9. Hu, L.; Chen, J.; Pan, Z.; Deng, J.; Yu, R.; Xing, X.; Barnes, P. Large-Scale Synthesis of Isotropic Single-Crystalline ScF3 Cubes by Hydrothermal Method. Am. Ceram. Soc. Bull. 2014, 97, 1386–1388. [Google Scholar] [CrossRef]
  10. Kasatkin, I.A.; Gulina, L.B.; Platonova, N.V.; Tolstoy, V.P.; Murin, I.V. Strong negative thermal expansion in the hexagonal polymorph of ScF3. CrystEngComm 2018, 20, 2768–2771. [Google Scholar] [CrossRef]
  11. Xu, H.; Liu, R.; Xu, B.; Li, X.; Ouyang, C.; Zhong, S. Preparation and temperature-dependent photoluminescence properties of ScF3:Eu3+submicroparticles. New J. Chem. 2017, 41, 7915–7923. [Google Scholar] [CrossRef]
  12. Harata, M.; Yasuda, K.; Yakushiji, H.; Okabe, T.H. Electrochemical production of Al–Sc alloy in CaCl2–Sc2O3 molten salt. J. Alloys Compd. 2009, 474, 124–130. [Google Scholar] [CrossRef]
  13. Kulikov, B.P.; Baranov, V.N.; Bezrukikh, A.I.; Deev, V.B.; Motkov, M.M. Preparation of Aluminum-Scandium Master Alloys by Aluminothermal Reduction of Scandium Fluoride Extracted from Sc2O3. Metallurgist 2018, 61, 1115–1121. [Google Scholar] [CrossRef]
  14. Ji, C.Q.; Shen, M.W.; Zhu, C.L.; Cai, W. Research on Hydrometallurgy Preparation of Anhydrous Scandium Fluoride. Multipurp. Util. Miner. Resour. 2013, 6, 38–40. [Google Scholar] [CrossRef]
  15. Liu, Y.; Chen, H.G.; Wei, W. Technology of Xeransis Fluorination for Preparing High Purity Scandium Fluoride. Hunan Nonferrous Met. 2017, 33, 53–57. [Google Scholar] [CrossRef]
  16. Wang, Y.; Zhang, Y.; Liang, G.; Zhao, X. Fabrication and properties of amorphous silica particles by fluorination of zircon using ammonium bifluoride. J. Fluor. Chem. 2020, 232, 109467–109476. [Google Scholar] [CrossRef]
  17. Che Zainul Bahri, C.N.A.; Ismail, A.F.; Majid, A.A. Synthesis of thorium tetrafluoride (ThF4) by ammonium hydrogen difluoride (NH4HF2). Nucl. Eng. Technol. 2019, 51, 792–799. [Google Scholar] [CrossRef]
  18. Smorokov, A.; Kantaev, A.; Bryankin, D.; Miklashevich, A.; Kamarou, M.; Romanovski, V. A novel low-energy approach to leucoxene concentrate desiliconization by ammonium bifluoride solutions. J. Chem. Technol. Biotechnol. 2022, 98, 726–733. [Google Scholar] [CrossRef]
  19. Smorokov, A.; Kantaev, A.; Bryankin, D.; Miklashevich, A.; Kamarou, M.; Romanovski, V. Low-temperature method for desiliconization of polymetallic slags by ammonium bifluoride solution. Environ. Sci. Pollut. Res. Int. 2023, 30, 30271–30280. [Google Scholar] [CrossRef]
  20. Smorokov, A.; Kantaev, A.; Bryankin, D.; Miklashevich, A.; Kamarou, M.; Romanovski, V. Low-temperature desiliconization of activated zircon concentrate by NH4HF2 solution. Miner. Eng. 2022, 189, 107909–107916. [Google Scholar] [CrossRef]
  21. Hao, Z.; Zhang, J.; Wang, B.; Zhang, X. Synthesis of GdF3 from the Gd2O3-NH4HF2 system. Rare Met. 2007, 26, 482–487. [Google Scholar] [CrossRef]
  22. Claux, B.; Beneš, O.; Capelli, E.; Souček, P.; Meier, R. On the fluorination of plutonium dioxide by ammonium hydrogen fluoride. J. Fluor. Chem. 2016, 183, 10–13. [Google Scholar] [CrossRef]
  23. Mukherjee, A.; Awasthi, A.; Mishra, S.; Krishnamurthy, N. Studies on fluorination of Y2O3 by NH4HF2. Thermochim. Acta 2011, 520, 145–152. [Google Scholar] [CrossRef]
  24. Zhou, Y.; Zhang, L.; Yang, X.; Wang, H.; Mo, C.; Wang, L. Fluorination of zircon using ammonium bifluoride to produce ZrF4. Thermochim. Acta 2023, 720, 179422–179431. [Google Scholar] [CrossRef]
  25. Kraydenko, R.I.; Dyachenko, A.N.; Malyutin, L.N.; Petlin, I.V. The mechanism for production of beryllium fluoride from the product of ammonium fluoride processing of beryllium- containing raw material. IOP Conf. Ser. Mater. Sci. Eng. 2016, 135, 012021–012027. [Google Scholar] [CrossRef]
  26. Hu, X.W.; Li, L.; Gao, B.L.; Shi, Z.N.; Li, H.; Liu, J.; Wang, Z.W. Thermal decomposition of ammonium hexafluoroaluminate and preparation of aluminum fluoride. Trans. Nonferrous Met. Soc. China 2011, 21, 2087–2092. [Google Scholar] [CrossRef]
  27. Wang, H.; Zhou, Y.; Mo, C.; Zhang, L.; Cui, J. Fluorination of α-Fe2O3 by NH4HF2 to Produce FeF3. Russ. J. Inorg. Chem. 2022, 66, 2017–2026. [Google Scholar] [CrossRef]
  28. Zhang, W.Y.; Huang, P.; Huang, M.S.; Liu, H.; Yang, Z.Q. Reaction Mechanism Investigation of Sc2O3 and NH4HF2. Hunan Nonferrous Met. 2022, 38, 41–43. [Google Scholar] [CrossRef]
  29. Rakov, E.G.; Mel’nichenko, E.I. The Properties and Reactions of Ammonium Fluorides. Russ. Chem. Rev. 1984, 53, 851–869. [Google Scholar] [CrossRef]
  30. Sokolova, Y.V.; Cherepanin, R.N. Preparation and examination of the properties of complex scandium fluorides. Russ. J. Appl. Chem. 2011, 84, 1319–1323. [Google Scholar] [CrossRef]
  31. Resentera, A.C.; Rosales, G.D.; Esquivel, M.R.; Rodriguez, M.H. Thermal and structural analysis of the reaction pathways of α-spodumene with NH4HF2. Thermochim. Acta 2020, 689, 178609–178618. [Google Scholar] [CrossRef]
  32. Kropachev, A.N.; Podrezov, S.V.; Aleksakhin, A.V.; Gudilin, A.A.; Kondratyeva, O.A.; Korshunova, L.N. Thermodynamic Studies and Optimization of the Method for Obtaining Neodymium Fluoride for the Production of Magnetic Sensors’ Sensitive Elements. Sensors 2021, 21, 8361. [Google Scholar] [CrossRef] [PubMed]
  33. Miao, R.; Lu, W.; Chen, D.; Zhang, X.; Pan, B.; Chen, S.; Wang, Y.; Wang, Z. Insight into thermodynamic process and dry preparation of lanthanum fluoride. J. Therm. Anal. Calorim. 2022, 147, 11433–11443. [Google Scholar] [CrossRef]
  34. Hu, L.; Chen, J.; Fan, L.; Deng, J.; Yu, R.; Xing, X.; Wilkinson, A. Rapid Molten Salt Synthesis of Isotropic Negative Thermal Expansion ScF3. Am. Ceram. Soc. Bull. 2014, 97, 1009–1011. [Google Scholar] [CrossRef]
  35. Sokolova, Y.V.; Cherepanin, R.N. Leaching-out of scandium(III) in processing of a fluoride concentrate. Russ. J. Appl. Chem. 2006, 79, 890–892. [Google Scholar] [CrossRef]
  36. Peters, E.M.; Svärd, M.; Forsberg, K. Phase equilibria of ammonium scandium fluoride phases in aqueous alcohol mixtures for metal recovery by anti-solvent crystallization. Sep. Purif. Technol. 2020, 252, 117449–117462. [Google Scholar] [CrossRef]
  37. He, F.; Song, E.; Zhou, Y.; Ming, H.; Chen, Z.; Wu, J.; Shao, P.; Yang, X.; Xia, Z.; Zhang, Q. A General Ammonium Salt Assisted Synthesis Strategy for Cr3+-Doped Hexafluorides with Highly Efficient Near Infrared Emissions. Adv. Funct. Mater. 2021, 31, 2103743–2103753. [Google Scholar] [CrossRef]
  38. Yang, D.; Guo, Q.; Liao, L.; Zhang, Y.; Mei, L.; Liu, H. Crystal structure and up-conversion luminescence properties of K3ScF6:Er3+,Yb3+ cryolite. J. Alloys Compd. 2020, 848, 156336–156360. [Google Scholar] [CrossRef]
Figure 1. Microscopic morphology of Sc2O3 powders.
Materials 16 05984 g001
Figure 2. Schematic diagram of the fluorination experiment.
Materials 16 05984 g002
Figure 3. Schematic diagram of the fluorination reaction.
Materials 16 05984 g003
Figure 4. H 0 , G 0 and Lg(K) versus reaction temperature, respectively.
Materials 16 05984 g004
Figure 5. TG-DSC analysis of Sc2O3 and NH4HF2 mixtures with mass ratio of 1:3 after being held at 100 °C for 24 h.
Materials 16 05984 g005
Figure 6. PXRD patterns of Sc2O3 and NH4HF2 mixtures with mass ratio of 1:3 after fluorination at different temperatures for 2 h.
Materials 16 05984 g006
Figure 7. SEM images of (a) (NH4)3ScF6, (b) the mixture of NH4ScF4 and (NH4)2Sc3F11, and (c) ScF3. (df) EDS analysis. (gj) Crystal structures of (NH4)3ScF6, NH4ScF4, (NH4)2Sc3F11 and ScF3.
Materials 16 05984 g007aMaterials 16 05984 g007b
Figure 8. (a,b) HRTEM image and (c) SEAD pattern of (NH4)3ScF6 particle.
Materials 16 05984 g008
Figure 9. (a,b) HRTEM image and (c) SEAD pattern of ScF3 particle.
Materials 16 05984 g009
Figure 10. (a) Effect of temperature on fluorination rate, and (b) PXRD patterns of Sc2O3 and NH4HF2 mixtures with mass ratio of 1:3 after fluorination at different temperatures for 3 h.
Materials 16 05984 g010
Figure 11. (a) Effect of holding time on fluorination rate at 350 °C. (b) PXRD patterns of Sc2O3 and NH4HF2 mixtures with mass ratio of 1:3 after fluorination at 350 °C for different times.
Materials 16 05984 g011
Figure 12. PXRD patterns of Sc2O3 and NH4HF2 mixtures with different mass ratios after fluorination at 350 °C for 3 h.
Materials 16 05984 g012
Table 1. Fluorination processes of metal oxides.
MetalRef.Reaction Process
Gd[21]Gd2O3→NH4GdF4→GdF3
Pu[22]PuO2→(NH4)2PuF6→PuF3
Y[23]Y2O3→(NH4)3Y2F9→NH4Y2F7→YF3
Zr[24]ZrO2→(NH4)3ZrF7→(NH4)2ZrF6→ZrF4
Be[25]BeO2→(NH4)2BeF4→NH4BeF3→NH4Be2F5→BeF2
Al[26]Al2O3→(NH4)3AlF6→NH4AlF4→(NH4)0.69AlF3→AlF3
Fe[27]Fe2O3→(NH4)3FeF6→NH4FeF4→(NH4)0.18FeF3→FeF3
Sc[28]Sc2O3→(NH4)3ScF6→ScF3
NH4HF2→NH3 + HF & Sc2O3 + HF→ScF3
[29]Sc2O3→(NH4)3ScF6→NH4ScF4→ScF3
[30]Sc2O3→(NH4)3ScF6→Na(NH4)2ScF6/Na3ScF6→ScF3
Table 2. Thermodynamic data calculated by HSC Chemistry.
T/°C H 0 /KJ G 0 /KJLg(K)
0−73.987−54.60710.443
100−48.133−111.10715.554
200−54..895−167.84318.531
300−68.582−222.50020.279
400−87.741−274.29621.286
500−116.727−322.50821.791
600−159.638−365.99721.897
700−215.030−403.87221.680
800−283.161−435.41421.195
900−363.771−460.03120.485
1000−456.935−477.25019.582
Table 3. The chemical composition of ScF3 was identified by ICP.
ElementScFBal.
Content (wt.%)44.11755.8800.003
Disclaimer/Publisher’s Note: The statements, opinions and data contained in all publications are solely those of the individual author(s) and contributor(s) and not of MDPI and/or the editor(s). MDPI and/or the editor(s) disclaim responsibility for any injury to people or property resulting from any ideas, methods, instructions or products referred to in the content.

