

Enhancing Mechanical Behavior and Energy Dissipation in Fiber-Reinforced Polymers through Shape Memory Alloy Integration: A Numerical Study on SMA-FRP Composites under Cyclic Tensile Loading


Abstract
:1. Introduction
2. Specimens Introduction
3. Specimen Numerical Modeling
4. Results and Discussion
4.1. Maximum Stress
- Evaluating the maximum stress in specimens of the G1 group indicates that increasing the volume fraction of SMA fibers in composites made of only SMA fibers (pure composites) significantly increases the maximum stress in the composites. As such, in the G1 group specimens, by increasing the volume fraction of SMA fibers from 8.7% to 20.3%, the maximum stress in the composites increases by 81.30%.
- Comparison of the S7 specimen with other composites in the G2 to G6 groups (hybrid composites) indicates that among composites designed to reach the target elastic modulus, the S7 composite, which has no conventional fibers, has the lowest maximum stress. In other words, the presence of each type of conventional fiber in composites designed to reach the target elastic modulus increases their maximum stress compared to pure composites.
- Evaluation and comparison of maximum stress generated in composites of G2 to G6 groups indicate that in hybrid composites made of a specific type of conventional fibers and SMA fibers of which the initial strain is the same, the higher-volume fraction of SMA fibers (in other words, the lower-volume fraction of conventional fibers) causes the composite to tolerate lower stress.
- With evaluation and comparison of maximum stress values in composites of G2 to G6 groups, it is observed that hybrid composites consist of a specific type of conventional and SMA fibers of which the volume fraction is the same, increasing the initial strain in SMA fibers increases the maximum stress that composites can tolerate.
- Considering the maximum stress values in composites of G2 to G6 groups shows that in composites with equal volume fractions of SMA and conventional fibers and the same initial strain in SMA fibers, the higher failure strain of the conventional fibers used in the composite, the higher maximum stress that can be tolerated by composites. Therefore, hybrid composites produced from high-elastic-modulus carbon (HM-Carbon) fibers have the lowest maximum stress, and hybrid composites made of S-Glass fibers have the highest maximum stress.
- Investigations show that the effect of SMA fibers number on the maximum stress of hybrid composites made of conventional fibers with higher failure strain (composites made of S-Glass and aramid fibers) is greater.
4.2. Residual Strain
- Considering the residual strain in the G1 group specimens indicates that increasing the volume fraction of SMA fibers in pure composites significantly reduces the residual strain in the composites, so in the G1 group specimens, by increasing the volume fraction of SMA fibers from 8.7% to 20.3%, the residual strain in the composites reduces by 46.62%.
- Comparison of the S7 composite with other composites in the G2 to G6 groups indicates that among composites designed to reach the target elastic modulus, the S7 composite, which has no conventional fibers, has the lowest residual strain. In other words, the presence of each type of conventional fiber in composites designed to reach the target elastic modulus increases their residual strain compared to pure composites.
- Evaluation and comparison of residual strain generated in the G2 to G6 group composites show that in hybrid composites that are made of a specific type of conventional fibers and SMA fibers of which the initial strain is the same, the higher volume fraction of SMA fibers (in other words, the lower volume fraction of conventional fibers) causes less residual strain in composites.
- With evaluation and comparison of residual strain values in composites of G2 to G6 groups, it is observed that in hybrid composites consisting of a specific type of conventional and SMA fibers of which the volume fraction is the same, increasing the initial strain in SMA fibers reduces the residual strain. In addition, investigations show that by increasing the initial strain of SMA fibers from 0 to 0.5%, the residual strain reduction amount depends on the volume fraction of SMA fibers. By increasing the SMA fibers volume fraction in the composites, the effect of the initial strain amount on the residual strain increases. For example, in G2 group composites, by increasing the initial strain of SMA fibers from 0 to 0.5%, the residual strain of composites with 2.9%, 8.7%, and 14.5% SMA fibers reduces 1.1647%, 4.2568%, and 8.9825%, respectively.
- Evaluation and comparison of residual strain values in composites of G2 to G6 groups show that in composites with equal volume fractions of SMA and conventional fibers, and the same initial strain in SMA fibers, the lower the elastic modulus of the conventional fibers used in the composite, the lower the residual strain of the composites. Therefore, hybrid composites produced from high elastic modulus carbon (HM-Carbon) fibers have the highest residual strain, and hybrid composites made of E-Glass fibers have the lowest residual strain.
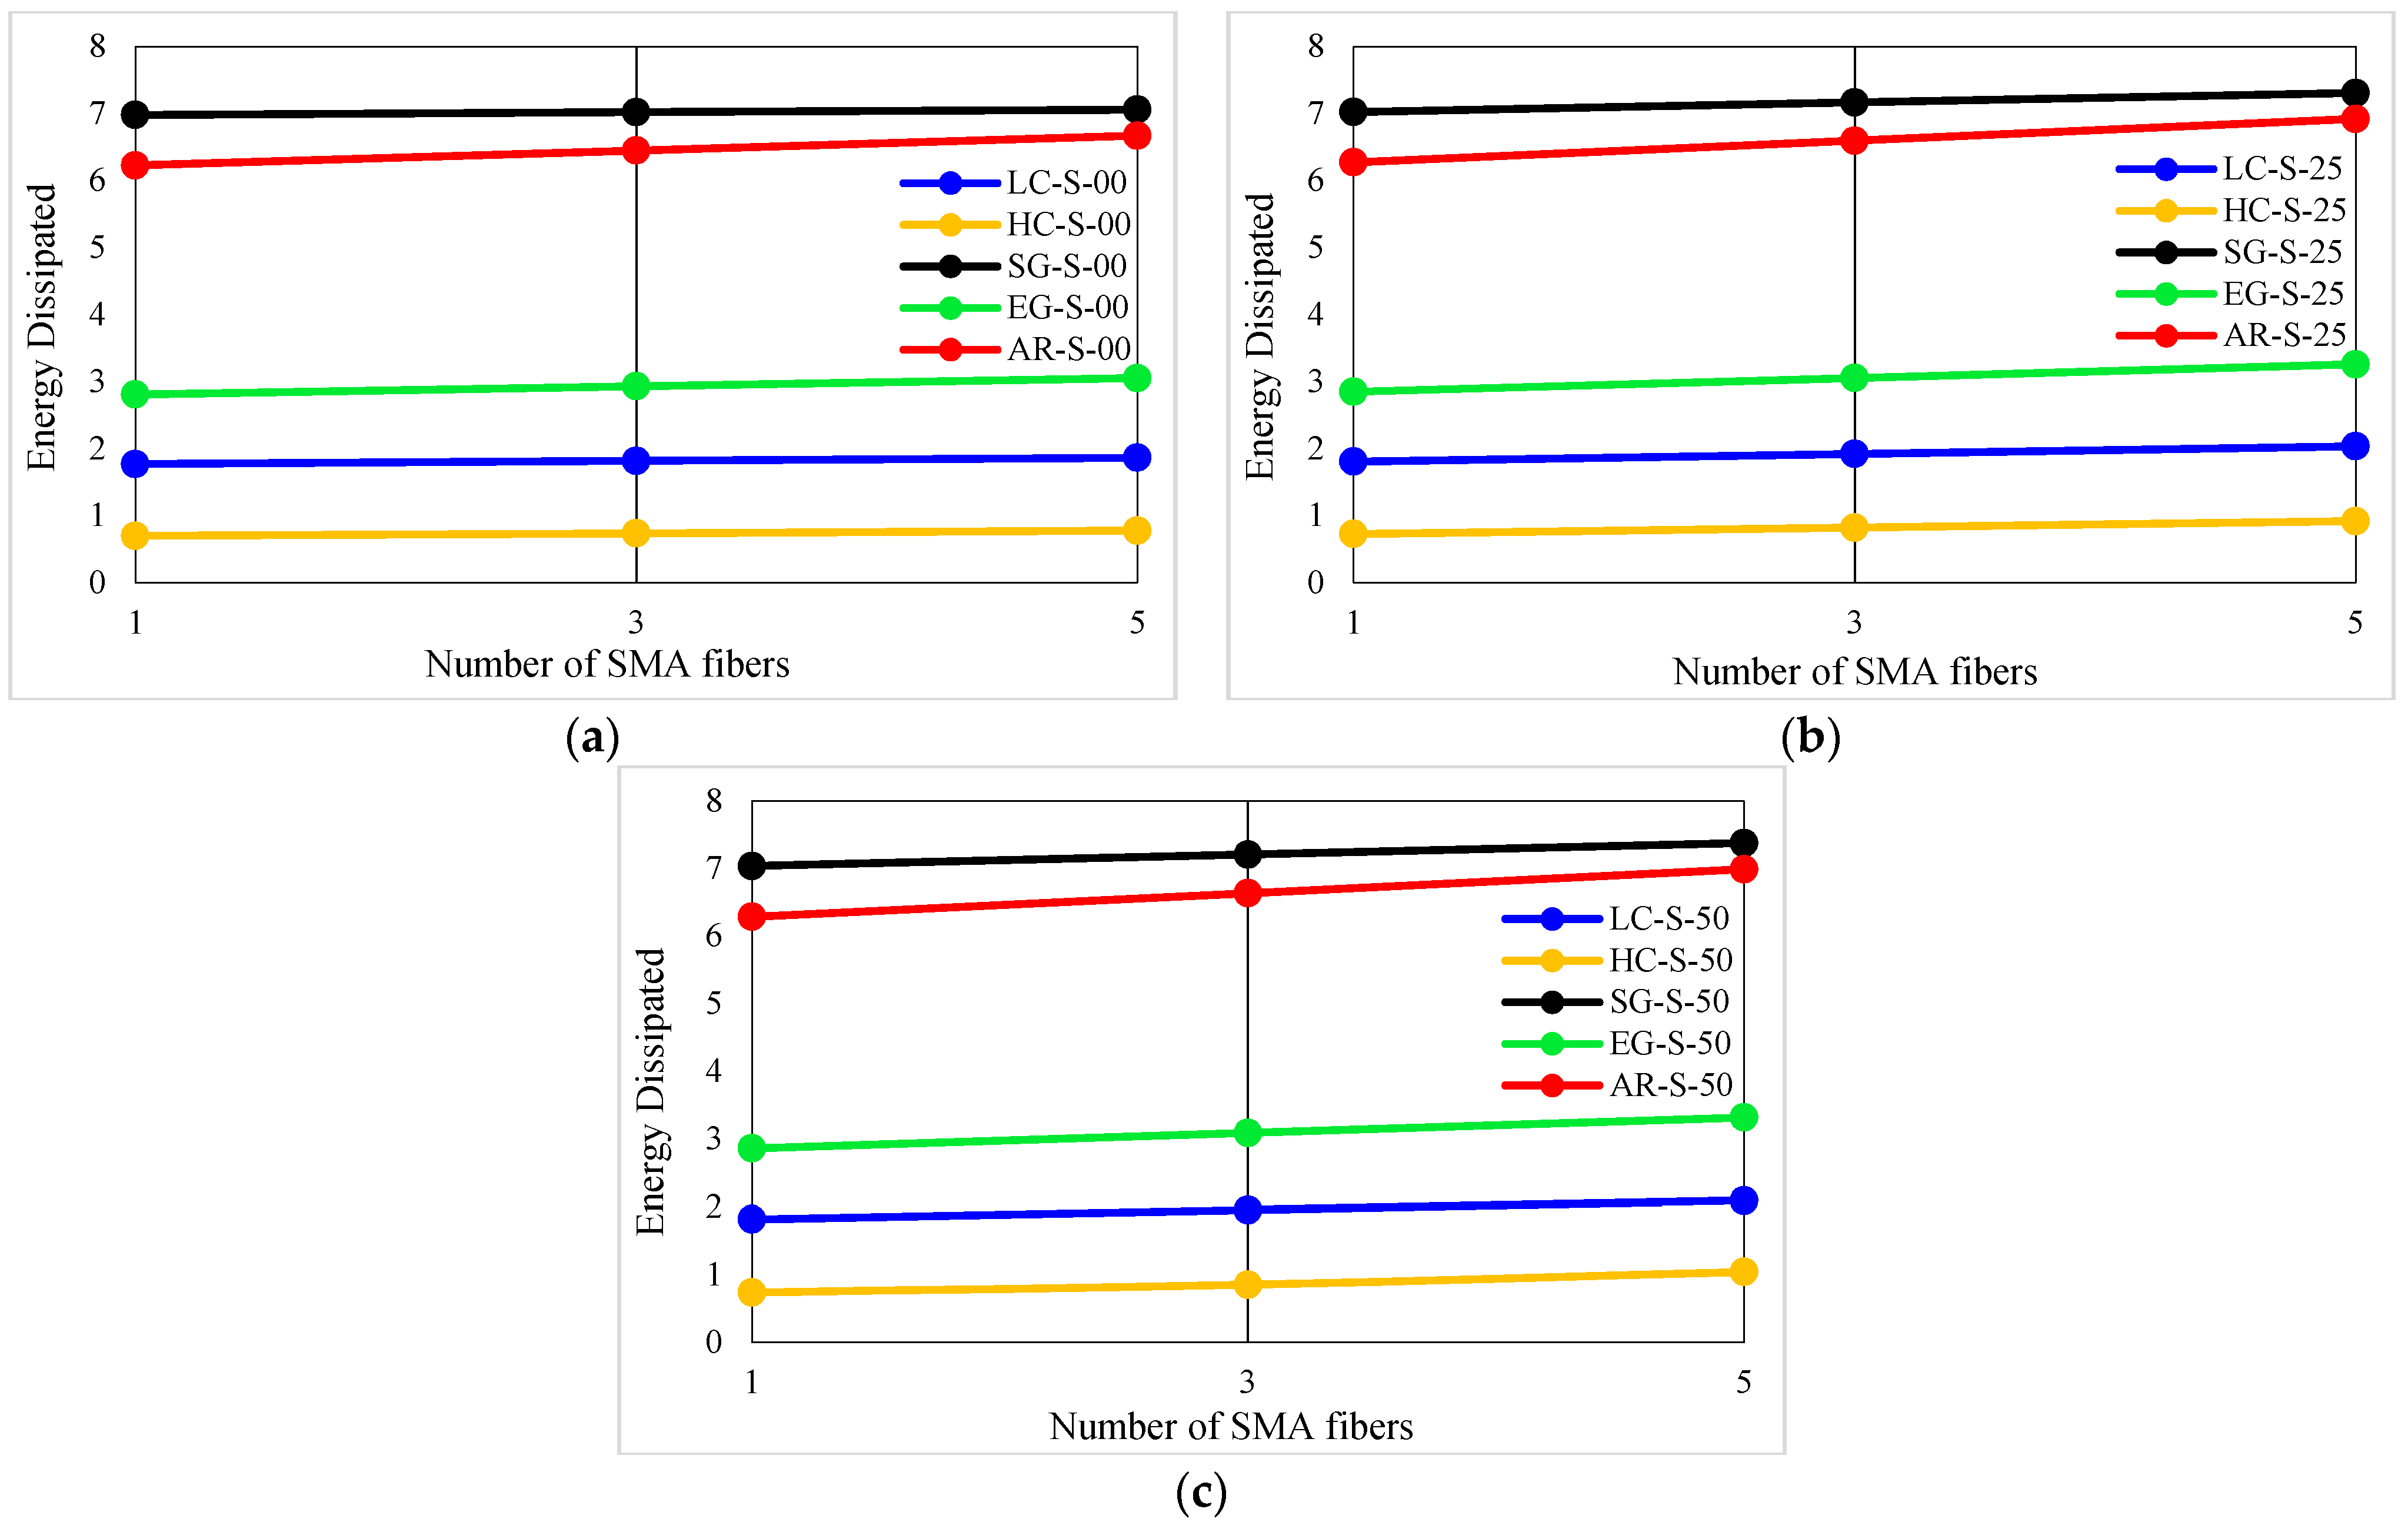
4.3. Energy Dissipation Capability
- Regarding the energy dissipation in the G1 group specimens indicates that increasing the volume fraction of SMA fibers in pure composites significantly increases the energy dissipation in the composites, so in the G1 group composites, by increasing the volume fraction of SMA fibers from 8.7% to 20.3%, the energy dissipation increases by 136.23%.
- Evaluation and comparison of energy dissipation in G2 to G6 group composites demonstrate that in composites made of a specific type of conventional fibers and SMA fibers of which the initial strain is the same, the higher volume fraction of SMA fibers (in other words, the lower volume fraction of conventional fibers) increases the energy dissipation of the composites.
- With evaluation and comparison of energy dissipation values in G2 to G6 group composites, it is observed that in hybrid composites made of a specific type of conventional and SMA fibers of which the volume fraction is the same, increasing the initial strain of SMA fibers increases the energy dissipation values in the composites. In addition, investigations show that by increasing the initial strain of SMA fibers from 0 to 0.5%, the increase in energy dissipation values depends on the volume fraction of SMA fibers. The higher amount of SMA fibers used in the composite, the greater effect of the initial strain on energy dissipation. For example, in G2 group specimens, by increasing the initial strain of SMA fibers from 0 to 0.5%, the energy dissipation of composites with 2.9%, 8.7%, and 14.5%, SMA fibers increases 2.6746%, 7.5570%, and 12.2609%, respectively.
- Evaluation and comparison of energy dissipation values in composites of G2 to G6 groups show that in composites with equal volume fractions of SMA and conventional fibers and the same initial strain in SMA fibers, the higher the failure strain of the conventional fibers used in the composite, the higher the energy dissipation by composites. Therefore, hybrid composites produced from S-Glass fibers have the highest energy dissipation capability, and hybrid composites made of high modulus carbon (HM-Carbon) fibers have the lowest energy dissipation.
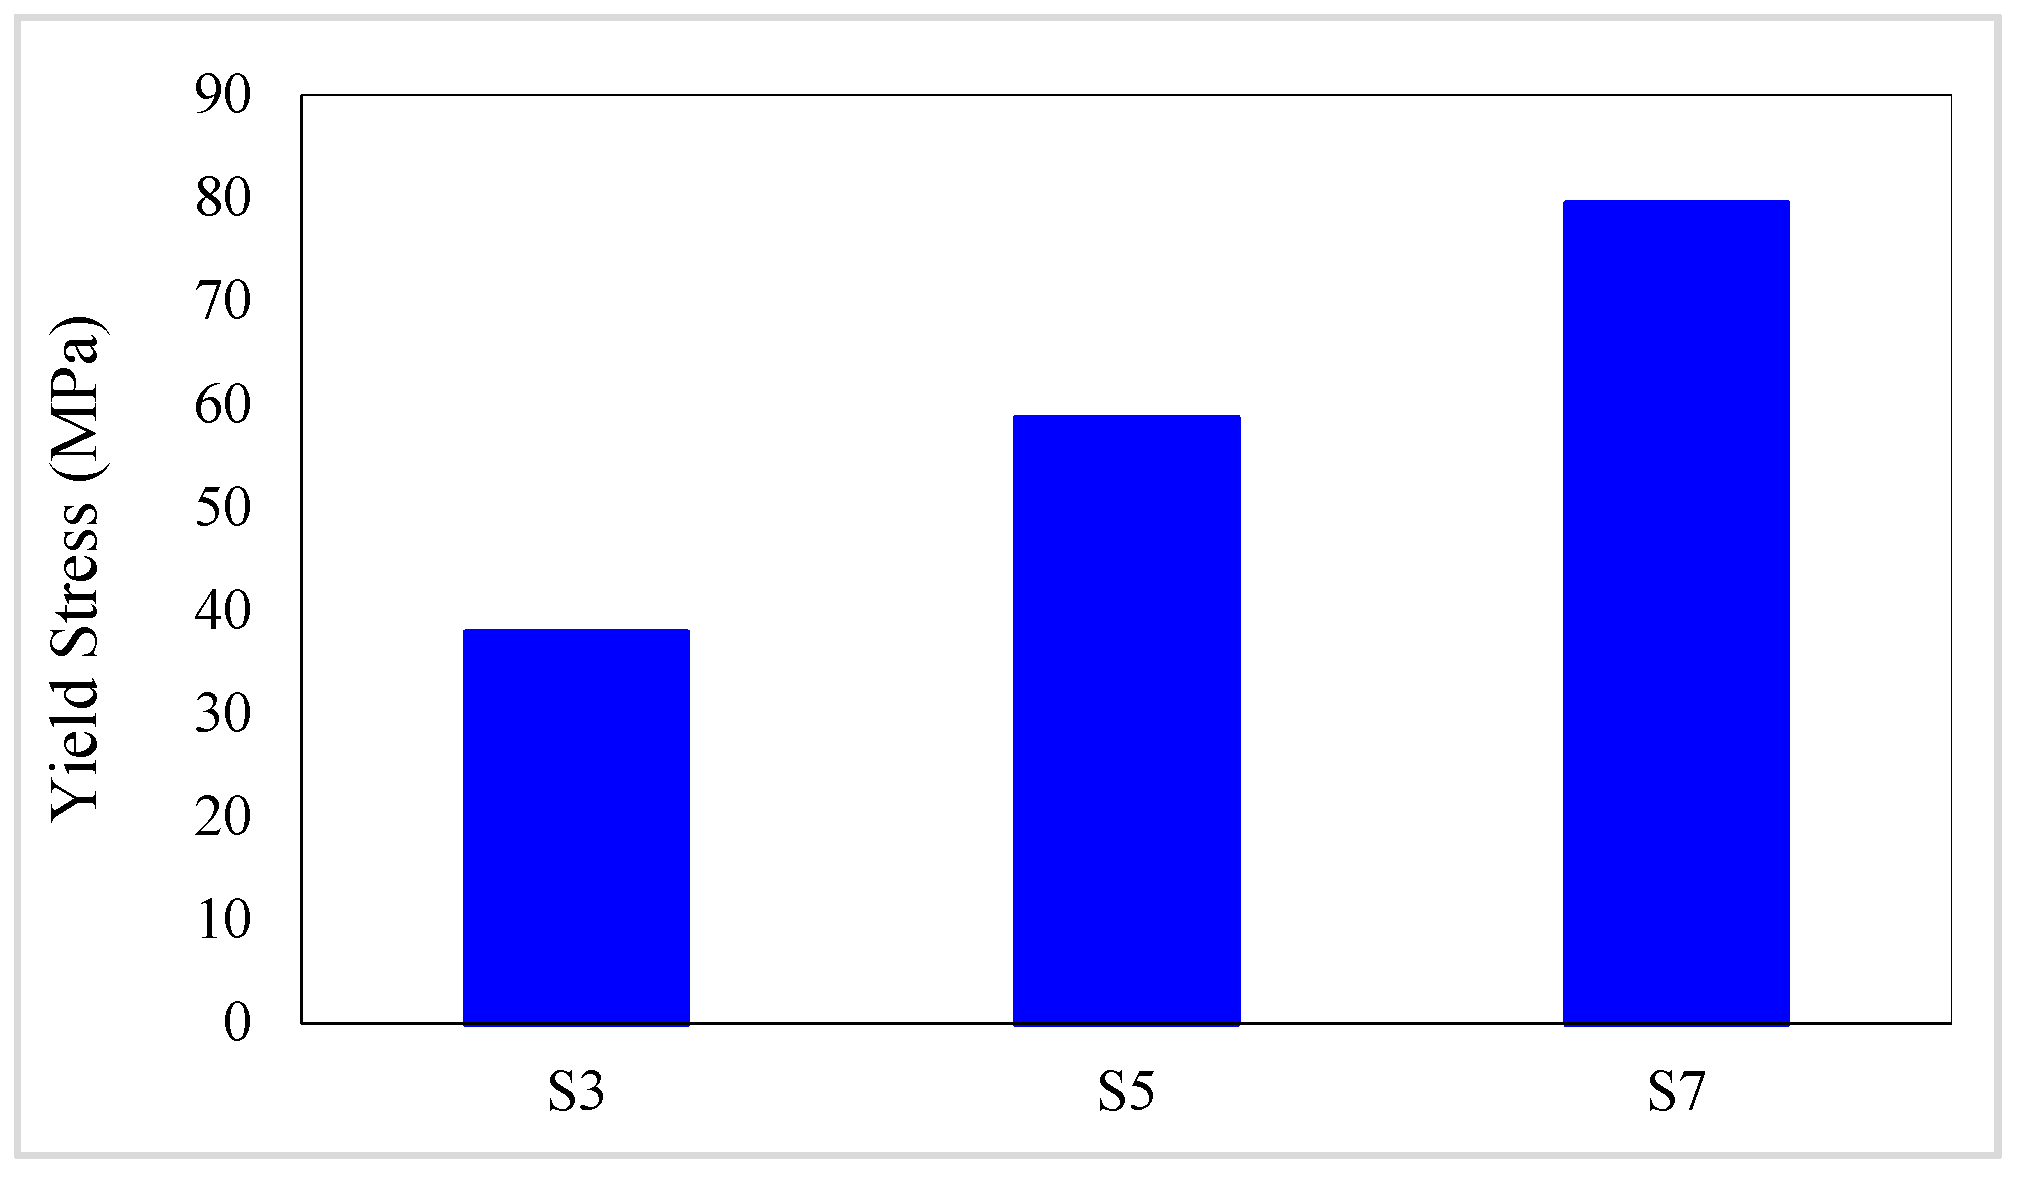
4.4. Yield Stress
- Assessing the yield stress in the G1 group composites indicates that increasing the volume fraction of SMA fibers in pure composites significantly increases the yield stress in the specimens, so in the G1 group composites, by increasing the volume fraction of SMA fibers from 8.7% to 20.3%, the yield stress in the composite increases by 109.73%.
- Comparison of the S7 composite with the G2 to G6 group composites indicates that among composites designed to reach the target elastic modulus and their SMA fibers have no initial strain, the S7 composite which is a pure composite has the lowest yield stress. However, comparing the yield stress of the S7 composite with G2 to G6 group composites in which SMA fibers have initial strain shows that the yield stress of the S7 composite is higher than all these composites.
- Evaluation and comparison of yield stress in composites of G2 to G6 groups reveal that composites consisting of a specific type of conventional fibers and SMA fibers, if the SMA fibers have no initial strain, increasing the volume fraction of the SMA fibers reduces the yield stress. However, if SMA fibers have initial strain (0.25% and 0.50%), increasing the volume fraction of SMA fibers increases the yield stress.
- With evaluation and comparison of yield stress values in the G2 to G6 group composites, it is observed that in composites made of a specific type of conventional and SMA fibers of which the volume fraction is the same, increasing the initial strain in SMA fibers decreases the yield stress. In addition, the investigations show that yield stress reduction value by increasing the initial strain of SMA fibers depends on the volume fraction of SMA fibers. For example, in the G2 group, by increasing the initial strain of SMA fibers from 0 to 0.5%, the yield stress of composites with 2.9%, 8.7%, and 14.5% of SMA fibers decreases 71.37%, 50.09%, and 33.60%, respectively. In other words, with increasing the volume fraction of SMA fibers, the effect of the initial strain on the yield stress of the composite decreases.
- Evaluation and comparison of yield stress values in the G2 to G6 group composites show that in composites with equal volume fractions of SMA and conventional fibers and the same initial strain created in SMA fibers, changing the type of conventional fibers used in hybrid composite construction has a very small effect on yield stress value (approximately 0.39% on average). Therefore, it can be said that the amount of yield stress of the hybrid composites is independent of the type of conventional fibers used in producing the composite.
4.5. Residual Stress
- Considering residual stress in the G2 to G6 group composites reveals that in composites made of a specific type of conventional fibers and SMA fibers and where the initial strain of SMA fibers is the same, increasing the volume fraction of SMA fibers (in other words, decreasing the volume fraction of conventional fibers) significantly increases the residual stress of the composites. For example, in G2 group composites, with increasing the volume fraction of SMA fibers used in composites from 2.9% to 14.5%, the amount of residual stress in the composites increases by 144.39% on average.
- With evaluation and comparison of residual stress values in the G2 to G6 group composites, it is observed that in hybrid composites made of a specific type of conventional and SMA fibers of which the volume fraction is the same, increasing the initial strain in SMA fibers increases the residual stress. In addition, the investigations show that by increasing the initial strain of SMA fibers, increasing the residual stress value depends on the volume fraction of SMA fibers. For example, in the G2 group composites, by increasing the initial strain of SMA fibers from 0 to 0.5%, the residual stress of composites with 2.9%, 8.7%, and 14.5% of SMA fibers increases 0.68%, 1.19%, and 1.41%, respectively. In other words, by increasing the volume fraction of SMA fibers, the effect of the initial strain on the residual stress value increases. On the other hand, considering the very small change of residual stress with changing the initial strain applied to the SMA fibers used in the composite, it can be concluded with high accuracy that the value of the residual stress in the SMA-FRP composite is independent of the initial strain in the SMA fibers.
- Evaluation and comparison of residual stress values in the G2 to G6 group composites show that in hybrid composites with equal volume fractions of SMA and conventional fibers and the same initial strain in SMA fibers, the higher the elastic modulus of the conventional fibers used in producing the composites, the higher the residual stress in composites. Therefore, composites produced from high modulus carbon (HM-Carbon) fibers have the highest residual stress, and the composites made of E-Glass fibers have the lowest residual stress. The reason is that after the failure of conventional fibers, load bearing in the composite is the responsibility of SMA fibers and resin. By increasing the elastic modulus of conventional fibers, due to the constant volume fraction of SMA fibers, the required volume fraction of conventional fibers will be lower, and the required resin volume fraction will be higher (as stated, the design of composites to reach a target elastic modulus is done).
4.6. Strain Hardening Ratio
- Regarding the strain hardening ratio in the G1 group specimens indicates that increasing the volume fraction of SMA fibers in pure composites significantly decreases the strain hardening ratio in the composites. As such, in the G1 group specimens, with increasing the volume fraction of SMA fibers from 8.7% to 20.3%, the strain hardening ratio in the composite decreases by 41.29%.
- Comparison of the S7 specimen with the G2 to G6 group composites indicates that among composites designed to reach the target elastic modulus, the S7 composite, which is a pure composite, has the lowest strain hardening ratio. In other words, the presence of each type of conventional fiber in hybrid composites designed to reach the target elastic modulus increases their strain hardening ratio compared to pure composites.
- Evaluation and comparison of strain hardening ratio in the G2 to G6 group composites reveal that in composites made of a specific type of conventional fibers and SMA fibers of which the initial strain percentage is the same, the higher volume fraction of SMA fibers (in other words, the lower volume fraction of conventional fibers) decreases strain hardening ratio. For example, in G2 group composites, with an increase in the volume fraction of SMA fibers from 2.9% to 14.5%, the strain hardening ratio decreases by 58.87% on average.
- With evaluation and comparison of strain hardening ratio in the G2 to G6 group composites, it is observed that in hybrid composites made of a specific type of conventional and SMA fibers of which the volume fraction is the same, by changing the initial strain percentage in SMA fibers, the strain hardening ratio of composites does not change (the changes are very small). Therefore, it can be stated that the strain hardening ratio of SMA-FRP composites is independent of the initial strain percentage in SMA fibers.
- Evaluation and comparison of strain hardening ratio in the G2 to G6 group composites show that in composites with equal volume fractions of SMA and conventional fibers and the same initial strain in SMA fibers, the higher the failure strain of the conventional fibers used in composites, the smaller the strain hardening ratio in composites. Therefore, composites produced from high elastic modulus carbon (HM-Carbon) fibers have the highest strain hardening ratio, and the composites made of S-Glass fibers have the lowest strain hardening ratio. The investigations show that the amount of these changes is minor.
5. Conclusions
- In composites made of only SMA fibers (pure composites), increasing the volume fraction of SMA fibers increases the maximum stress, energy dissipation capability, and yield stress, and also reduces the residual strain and strain hardening ratio of the composite.
- By comparing the pure composites and hybrid composites that are designed to reach a target elastic modulus, it can be seen that the maximum stress, residual strain, and strain hardening ratio of pure composites are lower than those of the hybrid composites. In other words, the presence of each type of conventional fiber in hybrid composites designed to reach the target elastic modulus increases their maximum stress, residual strain, and strain hardening ratio compared to pure composites.
- By comparing pure composites and hybrid composites that are designed to reach a target elastic modulus and their SMA fibers having no initial strain, the pure composites have the lowest yield stress. However, comparing the yield stress of the pure composites with hybrid composites in which the initial strain of SMA fibers is not zero, shows that the yield stress of the pure composites is higher than all hybrid composites.
- In hybrid composites that are designed to achieve a target elastic modulus, with an increase in the volume fraction of SMA fibers, the maximum stress, residual strain, and strain hardening ratio decrease, and the energy dissipation capability and residual stress of the composites increase.
- In hybrid composites that are designed to achieve a target elastic modulus, increasing the volume fraction of SMA fibers with no initial strain reduces the yield stress of the composite. However, increasing the volume fraction of SMA fibers with an initial strain (0.25% and 0.50% in this research) will increase the yield stress of the composite.
- In hybrid composites that are designed to achieve a target elastic modulus, increasing the initial strain percentage in SMA fibers increases the maximum stress and energy dissipation capability and reduces the residual strain and yield stress.
- In hybrid composites that are designed to achieve a specific elastic modulus, the amount of residual stress and the strain hardening ratio of the composites are independent of the initial strain percentage in the SMA fibers.
- In hybrid composites that are designed to achieve a specific elastic modulus, fibers with a larger failure strain increase the maximum stress and energy dissipation capability of the composites and reduce the strain hardening ratio of the composites.
- In hybrid composites that are designed to achieve a specific elastic modulus, increasing the elastic modulus of conventional fibers increases the residual strain and residual stress of the composites.
- In hybrid composites that are designed to achieve a target elastic modulus, the yield stress in the composites is independent of the conventional fibers type used in producing the composites.
Author Contributions
Funding
Institutional Review Board Statement
Informed Consent Statement
Data Availability Statement
Conflicts of Interest
References
- Jani, J.M.; Leary, M.; Subic, A.; Gibson, M.A. A review of shape memory alloy research, applications and opportunities. Mater. Des. (1980–2015) 2014, 56, 1078–1113. [Google Scholar] [CrossRef]
- Zareie, S.; Alam, M.S.; Seethaler, R.J.; Zabihollah, A. Effect of shape memory alloy-magnetorheological fluid-based structural control system on the marine structure using nonlinear time-history analysis. Appl. Ocean Res. 2019, 91, 101836. [Google Scholar] [CrossRef]
- Zareie, S.; Issa, A.S.; Seethaler, R.J.; Zabihollah, A. Recent advances in the applications of shape memory alloys in civil infrastructures: A review. Structures 2020, 27, 1535–1550. [Google Scholar] [CrossRef]
- Zareie, S.; Alam, M.S.; Seethaler, R.J.; Zabihollah, A. A novel shape memory alloy-based element for structural stability control in offshore structures under cyclic loading. Ships Offshore Struct. 2020, 15, 844–851. [Google Scholar] [CrossRef]
- Alikhani, A.; Basaeri, A. The effect of pre-strain and number of SMA wires on the compression properties of glass-epoxy conical grid composites. Compos. Struct. 2021, 262, 113624. [Google Scholar] [CrossRef]
- Van Den Einde, L.; Zhao, L.; Seible, F. Use of FRP composites in civil structural applications. Constr. Build. Mater. 2003, 17, 389–403. [Google Scholar] [CrossRef]
- Rana, A.K.; Scarpa, F.; Thakur, V.K. Cellulose/polyaniline hybrid nanocomposites: Design, fabrication, and emerging multidimensional applications. Ind. Crops Prod. 2022, 187, 115356. [Google Scholar] [CrossRef]
- Rana, A.K.; Guleria, S.; Gupta, V.K.; Thakur, V.K. Cellulosic pine needles-based biorefinery for a circular bioeconomy. Bioresour. Technol. 2022, 128255. [Google Scholar] [CrossRef]
- Daghash, S.M.; Ozbulut, O.E. Characterization of superelastic shape memory alloy fiber-reinforced polymer composites under tensile cyclic loading. Mater. Des. 2016, 111, 504–512. [Google Scholar] [CrossRef]
- Zafar, A.; Andrawes, B. Fabrication and cyclic behavior of highly ductile superelastic shape memory composites. J. Mater. Civ. Eng. 2014, 26, 622–632. [Google Scholar] [CrossRef]
- Hietanen, S. ER fluids and MR materials-Basic properties and some application developments. VTT Symp. 2003, 225, 33–50. [Google Scholar]
- Ozbulut, O.E.; Hurlebaus, S.; DesRoches, R. Seismic response control using shape memory alloys: A review. J. Intell. Mater. Syst. Struct. 2011, 22, 1531–1549. [Google Scholar] [CrossRef]
- Naito, H.; Sato, J.; Funami, K.; Matsuzaki, Y.; Ikeda, T. Analytical study on training effect of pseudoelastic transformation of shape memory alloys in cyclic loading. J. Intell. Mater. Syst. Struct. 2001, 12, 295–300. [Google Scholar] [CrossRef]
- Zafar, A. Application of SMA Fiber Composite as Seismic Reinforcement for Concrete Moment Resisting Frames; University of Illinois at Urbana-Champaign: Champaign, IL, USA, 2013. [Google Scholar]
- Lecce, L. Shape Memory Alloy Engineering: For Aerospace, Structural and Biomedical Applications; Elsevier: Amsterdam, The Netherlands, 2014. [Google Scholar]
- Li, S.; Dezfuli, F.H.; Wang, J.-q.; Alam, M.S. Longitudinal seismic response control of long-span cable-stayed bridges using shape memory alloy wire-based lead rubber bearings under near-fault records. J. Intell. Mater. Syst. Struct. 2018, 29, 703–728. [Google Scholar] [CrossRef]
- De Domenico, D.; Gandelli, E.; Quaglini, V. Adaptive isolation system combining low-friction sliding pendulum bearings and SMA-based gap dampers. Eng. Struct. 2020, 212, 110536. [Google Scholar] [CrossRef]
- Cao, S.; Ozbulut, O.E.; Wu, S.; Sun, Z.; Deng, J. Multi-level SMA/lead rubber bearing isolation system for seismic protection of bridges. Smart Mater. Struct. 2020, 29, 055045. [Google Scholar] [CrossRef]
- Deng, J.; Hu, F.; Ozbulut, O.E.; Cao, S. Verification of multi-level SMA/lead rubber bearing isolation system for seismic protection of bridges. Soil Dyn. Earthq. Eng. 2022, 161, 107380. [Google Scholar] [CrossRef]
- Farmani, M.A.; Ghassemieh, M. Steel beam-to-column connections equipped with SMA tendons and energy dissipating devices including shear tabs or web hourglass pins. J. Constr. Steel Res. 2017, 135, 30–48. [Google Scholar] [CrossRef]
- Fang, C.; Yam, M.C.; Chan, T.-M.; Wang, W.; Yang, X.; Lin, X. A study of hybrid self-centring connections equipped with shape memory alloy washers and bolts. Eng. Struct. 2018, 164, 155–168. [Google Scholar] [CrossRef]
- Nia, M.M.; Moradi, S. Surrogate models for endplate beam-column connections with shape memory alloy bolts. J. Constr. Steel Res. 2021, 187, 106929. [Google Scholar]
- Qiu, C.; Li, H.; Ji, K.; Hou, H.; Tian, L. Performance-based plastic design approach for multi-story self-centering concentrically braced frames using SMA braces. Eng. Struct. 2017, 153, 628–638. [Google Scholar] [CrossRef]
- Qiu, C.-X.; Zhu, S. Performance-based seismic design of self-centering steel frames with SMA-based braces. Eng. Struct. 2017, 130, 67–82. [Google Scholar] [CrossRef]
- Mahmoudi, M.; Montazeri, S.; Abad, M.J.S. Seismic performance of steel X-knee-braced frames equipped with shape memory alloy bars. J. Constr. Steel Res. 2018, 147, 171–186. [Google Scholar] [CrossRef]
- Qiu, C.; Du, X.; Teng, J.; Li, Z.; Chen, C. Seismic design method for multi-story SMA braced frames based on inelastic displacement ratio. Soil Dyn. Earthq. Eng. 2021, 147, 106794. [Google Scholar] [CrossRef]
- Zareie, S.; Issa, A.S.; Seethaler, R.; Zabihollah, A.; Ahmad, R. A novel SMA-magnetorheological hybrid bracing system for seismic control. Eng. Struct. 2021, 244, 112709. [Google Scholar] [CrossRef]
- Mirzai, N.M.; Mansouri, I.; Tezcan, J.; Awoyera, P.O.; Hu, J.W. Estimating optimum parameters of a new SMA damper under different earthquake ground motions. Structures 2021, 33, 2700–2712. [Google Scholar] [CrossRef]
- Zhang, S.; Hou, H.; Qu, B.; Zhu, Y.; Li, K.; Fu, X. Tests of a novel re-centering damper with SMA rods and friction wedges. Eng. Struct. 2021, 236, 112125. [Google Scholar] [CrossRef]
- Qiu, C.; Liu, J.; Du, X. Cyclic behavior of SMA slip friction damper. Eng. Struct. 2022, 250, 113407. [Google Scholar] [CrossRef]
- Chen, J.; Wang, W.; Fang, C. Manufacturing, testing and simulation of novel SMA-based variable friction dampers with enhanced deformability. J. Build. Eng. 2022, 45, 103513. [Google Scholar] [CrossRef]
- Pareek, S.; Suzuki, Y.; Araki, Y.; Youssef, M.; Meshaly, M. Plastic hinge relocation in reinforced concrete beams using Cu-Al-Mn SMA bars. Eng. Struct. 2018, 175, 765–775. [Google Scholar] [CrossRef]
- Azadpour, F.; Maghsoudi, A. Experimental and analytical investigation of continuous RC beams strengthened by SMA strands under cyclic loading. Constr. Build. Mater. 2020, 239, 117730. [Google Scholar] [CrossRef]
- Shafei, E.; Kianoush, R. Transient analysis of hybrid SMA-FRP reinforced concrete beams under sequential impacts. Eng. Struct. 2020, 208, 109915. [Google Scholar] [CrossRef]
- Gholampour, A.; Ozbakkaloglu, T. Confinement of normal-and high-strength concrete by Shape Memory Alloy (SMA) Spirals. IOP Conf. Ser. Mater. Sci. Eng. 2018, 301, 012056. [Google Scholar] [CrossRef]
- Gholampour, A.; Ozbakkaloglu, T. Understanding the compressive behavior of shape memory alloy (SMA)-confined normal-and high-strength concrete. Compos. Struct. 2018, 202, 943–953. [Google Scholar] [CrossRef]
- Deogekar, P.S.; Andrawes, B. Hybrid confinement of high strength concrete using shape memory alloys and fiber-reinforced polymers. J. Struct. Integr. Maint. 2018, 3, 22–32. [Google Scholar] [CrossRef]
- Jung, D.; Deogekar, P.; Andrawes, B. Seismic performance of bridges with high strength concrete columns reinforced with SMA-FRP jackets. Smart Mater. Struct. 2019, 28, 035008. [Google Scholar] [CrossRef]
- Hong, C.; Qian, H.; Song, G. Uniaxial compressive behavior of concrete columns confined with superelastic shape memory alloy wires. Materials 2020, 13, 1227. [Google Scholar] [CrossRef] [PubMed]
- El-Hacha, R.; Abdelrahman, K. Behaviour of circular SMA-confined reinforced concrete columns subjected to eccentric loading. Eng. Struct. 2020, 215, 110443. [Google Scholar] [CrossRef]
- Pan, S.; Yue, R.; Hui, H.; Fan, S. Lateral cyclic behavior of bridge columns confined with pre-stressed shape memory alloy wires. J. Asian Archit. Build. Eng. 2022, 21, 66–79. [Google Scholar] [CrossRef]
- Ghafoori, E.; Neuenschwander, M.; Shahverdi, M.; Czaderski, C.; Fontana, M. Elevated temperature behavior of an iron-based shape memory alloy used for prestressed strengthening of civil structures. Constr. Build. Mater. 2019, 211, 437–452. [Google Scholar] [CrossRef]
- Oudah, F.; El-Hacha, R. Joint performance in concrete beam-column connections reinforced using SMA smart material. Eng. Struct. 2017, 151, 745–760. [Google Scholar] [CrossRef]
- Nahar, M.; Billah, A.M.; Kamal, H.R.; Islam, K. Numerical seismic performance evaluation of concrete beam-column joint reinforced with different super elastic shape memory alloy rebars. Eng. Struct. 2019, 194, 161–172. [Google Scholar] [CrossRef]
- Nahar, M.; Islam, K.; Billah, A.M. Seismic collapse safety assessment of concrete beam-column joints reinforced with different types of shape memory alloy rebars. J. Build. Eng. 2020, 29, 101106. [Google Scholar] [CrossRef]
- Suhail, R.; Amato, G.; Broderick, B.; Grimes, M.; McCrum, D. Efficacy of prestressed SMA diagonal loops in seismic retrofitting of non-seismically detailed RC beam-column joints. Eng. Struct. 2021, 245, 112937. [Google Scholar] [CrossRef]
- Huang, H.; Chang, W.-S. Application of pre-stressed SMA-based tuned mass damper to a timber floor system. Eng. Struct. 2018, 167, 143–150. [Google Scholar] [CrossRef]
- Das, S.; Tesfamariam, S. Multiobjective design optimization of multi-outrigger tall-timber building: Using SMA-based damper and Lagrangian model. J. Build. Eng. 2022, 51, 104358. [Google Scholar] [CrossRef]
- Jang, B.-K.; Koo, J.-H.; Toyama, N.; Akimune, Y.; Kishi, T. Influence of lamination direction on fracture behavior and mechanical properties of TiNi SMA wire-embedded CFRP smart composites. In Smart Structures and Materials 2001: Modeling, Signal Processing, and Control in Smart Structures; SPIE: Bellingham, WA, USA, 2001; pp. 188–197. [Google Scholar]
- Xu, Y.; Otsuka, K.; Toyama, N.; Yoshida, H.; Jang, B.-K.; Nagai, H.; Oishi, R.; Kishi, T. Fabrication of TiNi/CFRP smart composite using cold drawn TiNi wires. In Smart Structures and Materials 2002: Active Materials: Behavior and Mechanics; SPIE: Bellingham, WA, USA, 2002; pp. 564–574. [Google Scholar]
- Xu, Y.; Otsuka, K.; Toyama, N.; Yoshida, H.; Nagai, H.; Kishi, T. A novel technique for fabricating SMA/CFRP adaptive composites using ultrathin TiNi wires. Smart Mater. Struct. 2003, 13, 196. [Google Scholar] [CrossRef]
- Šittner, P.; Stalmans, R. Developing hybrid polymer composites with embedded shape-memory alloy wires. JOM 2000, 52, 15–20. [Google Scholar] [CrossRef]
- Michaud, V.J.; Schrooten, J.; Parlinska, M.; Gotthardt, R.; Bidaux, J.-E. Shape memory alloy wires turn composites into smart structures. Part II: Manufacturing and properties. In Smart Structures and Materials 2002: Industrial and Commercial Applications of Smart Structures Technologies; SPIE: Bellingham, WA, USA, 2002; pp. 406–415. [Google Scholar]
- Pappadà, S.; Rametta, R.; Toia, L.; Coda, A.; Fumagalli, L.; Maffezzoli, A. Embedding of superelastic SMA wires into composite structures: Evaluation of impact properties. J. Mater. Eng. Perform. 2009, 18, 522–530. [Google Scholar] [CrossRef]
- Wierschem, N.; Andrawes, B. Superelastic SMA–FRP composite reinforcement for concrete structures. Smart Mater. Struct. 2010, 19, 025011. [Google Scholar] [CrossRef]
- Nissle, S.; Hübler, M.; Gurka, M.; Schmeer, S.; Voll, N. Integration of Shape Memory Alloy Wires in Fiber Reinforced Polymers for Endless Crash Absorber Structures. In Smart Materials, Adaptive Structures and Intelligent Systems; SPIE: Bellingham, WA, USA, 2002; p. V002T004A005. [Google Scholar]
- Sharifishourabi, G.; Alebrahim, R.; Sharifi, S.; Ayob, A.; Vrcelj, Z.; Yahya, M. Mechanical properties of potentially-smart carbon/epoxy composites with asymmetrically embedded shape memory wires. Mater. Des. 2014, 59, 486–493. [Google Scholar] [CrossRef]
- Cohades, A.; Michaud, V. Shape memory alloys in fibre-reinforced polymer composites. Adv. Ind. Eng. Polym. Res. 2018, 1, 66–81. [Google Scholar] [CrossRef]
- Xu, L.; Shi, M.; Wang, Z.; Zhang, X.; Xue, G. Experimental and numerical investigation on the low-velocity impact response of shape memory alloy hybrid composites. Mater. Today Commun. 2021, 26, 101711. [Google Scholar] [CrossRef]
- Wierschem, N.E. Superelastic Shape Memory Alloy Composite Bars for Reinforcing Concrete Structures. Ph.D. Dissertation, University of Illinois at Urbana-Champaign, Champaign, IL, USA, 2010. [Google Scholar]
- Payandeh, Y.; Meraghni, F.; Patoor, E.; Eberhardt, A. Study of the martensitic transformation in NiTi–epoxy smart composite and its effect on the overall behavior. Mater. Des. 2012, 39, 104–110. [Google Scholar] [CrossRef]
- Saeedi, A.; Shokrieh, M. Effect of shape memory alloy wires on the enhancement of fracture behavior of epoxy polymer. Polym. Test. 2017, 64, 221–228. [Google Scholar] [CrossRef]
- Wang, Z.; Xu, L.; Sun, X.; Shi, M.; Liu, J. Fatigue behavior of glass-fiber-reinforced epoxy composites embedded with shape memory alloy wires. Compos. Struct. 2017, 178, 311–319. [Google Scholar] [CrossRef]
- Buehler, W.J.; Wang, F.E. A summary of recent research on the nitinol alloys and their potential application in ocean engineering. Ocean Eng. 1968, 1, 105–120. [Google Scholar] [CrossRef]
- Verma, L.; Andrew, J.J.; Sivakumar, S.M.; Balaganesan, G.; Vedantam, S.; Dhakal, H.N. Evaluation of quasi-static indentation response of superelastic shape memory alloy embedded GFRP laminates using AE monitoring. Polym. Test. 2021, 93, 106942. [Google Scholar] [CrossRef]
- Gangil, N.; Siddiquee, A.N.; Maheshwari, S. Towards applications, processing and advancements in shape memory alloy and its composites. J. Manuf. Process. 2020, 59, 205–222. [Google Scholar] [CrossRef]
- Bank, L.C. Composites for Construction: Structural Design with FRP Materials; John Wiley & Sons: Hoboken, NJ, USA, 2006. [Google Scholar]
- Zhao, S.; Zhao, Z.; Yang, Z.; Ke, L.; Kitipornchai, S.; Yang, J. Functionally graded graphene reinforced composite structures: A review. Eng. Struct. 2020, 210, 110339. [Google Scholar] [CrossRef]
- Available online: https://opensees.berkeley.edu/ (accessed on 31 January 2023).
- Tazarv, M.; Saiid Saiidi, M. Reinforcing NiTi superelastic SMA for concrete structures. J. Struct. Eng. 2015, 141, 04014197. [Google Scholar] [CrossRef]


| Number | Material | Mechanical Properties | Abvn. | Value |
|---|---|---|---|---|
| 1 | Resin [14] | Young’s Modulus | Em | Em = 1.57 GPa |
| Yield Stress | Fym | Fym = 22 MPa | ||
| 2 | Nitinol fibers [14] | Young’s Modulus | ESMA | ESMA = 63.50 GPa |
| Austenite to Martensite start stress | σAMS | σAMS = 365 MPa | ||
| Austenite to Martensite finish stress | σAMf | σAMf = 425 MPa | ||
| Martensite to Austenite start stress | σMAS | σMAS = 102 MPa | ||
| Martensite to Austenite finish stress | σMAf | σMAf = 50 MPa | ||
| 3 | Low Modulus carbon fiber [67] | Young’s Modulus | Ef | Ef = 230 GPa |
| Rupture Strain | ε = 1.6% | |||
| 4 | High Modulus carbon fiber [67] | Young’s Modulus | Ef | Ef = 370 GPa |
| Rupture Strain | ε = 1% | |||
| 5 | S-Glass fiber [14] | Young’s Modulus | Ef | Ef = 86.7 GPa |
| Rupture Strain | ε = 3.20% | |||
| 6 | E-Glass fiber [67] | Young’s Modulus | Ef | Ef = 68.9 GPa |
| Rupture Strain | ε = 2% | |||
| 7 | Aramid fiber [67] | Young’s Modulus | Ef | Ef = 124.1 GPa |
| Rupture Strain | ε = 3% |
| Number | Group Name | Description |
|---|---|---|
| 1 | G1 | composites made of nitinol fibers (pure composites) |
| 2 | G2 | composites made of a combination of nitinol fibers and low-modulus carbon (LM-Carbon) fibers (hybrid composites) |
| 3 | G3 | composites made of a combination of nitinol fibers and high-modulus carbon (HM-Carbon) fibers (hybrid composites) |
| 4 | G4 | composites made of a combination of nitinol fibers and S-Glass fibers (hybrid composites) |
| 5 | G5 | composites made of a combination of nitinol fibers and E-Glass fibers (hybrid composites) |
| 6 | G6 | composites made of a combination of nitinol fibers and Aramid fibers (hybrid composites) |
| Group Name | Specimen Name | NSMA | ASMA (mm2) | VSMA | SMA Pre-strain (%) | Vf | Vm | Ec (GPa) |
|---|---|---|---|---|---|---|---|---|
| G1 | S3 | 3 | 0.5889 | 0.087 | 0 | 0 | 0.913 | 6.9579 |
| S5 | 5 | 0.9815 | 0.145 | 0 | 0 | 0.855 | 10.5498 | |
| S7 | 7 | 1.3741 | 0.203 | 0 | 0 | 0.797 | 14.1418 | |
| G2 | LC-S1-00 | 1 | 0.1963 | 0.029 | 0.00 | 0.0471 | 0.9239 | 14.1022 |
| LC-S1-25 | 1 | 0.1963 | 0.029 | 0.25 | 0.0471 | 0.9239 | 14.1022 | |
| LC-S1-50 | 1 | 0.1963 | 0.029 | 0.50 | 0.0471 | 0.9239 | 14.1022 | |
| LC-S3-00 | 3 | 0.5889 | 0.087 | 0.00 | 0.0314 | 0.8816 | 14.1306 | |
| LC-S3-25 | 3 | 0.5889 | 0.087 | 0.25 | 0.0314 | 0.8816 | 14.1306 | |
| LC-S3-50 | 3 | 0.5889 | 0.087 | 0.50 | 0.0314 | 0.8816 | 14.1306 | |
| LC-S5-00 | 5 | 0.9815 | 0.145 | 0.00 | 0.0157 | 0.8393 | 14.1362 | |
| LC-S5-25 | 5 | 0.9815 | 0.145 | 0.25 | 0.0157 | 0.8393 | 14.1362 | |
| LC-S5-50 | 5 | 0.9815 | 0.145 | 0.50 | 0.0157 | 0.8393 | 14.1362 | |
| G3 | HC-S1-00 | 1 | 0.1963 | 0.029 | 0.00 | 0.0292 | 0.9418 | 14.1241 |
| HC-S1-25 | 1 | 0.1963 | 0.029 | 0.25 | 0.0292 | 0.9418 | 14.1241 | |
| HC-S1-50 | 1 | 0.1963 | 0.029 | 0.50 | 0.0292 | 0.9418 | 14.1241 | |
| HC-S3-00 | 3 | 0.5889 | 0.087 | 0.00 | 0.0195 | 0.8935 | 14.1423 | |
| HC-S3-25 | 3 | 0.5889 | 0.087 | 0.25 | 0.0195 | 0.8935 | 14.1423 | |
| HC-S3-50 | 3 | 0.5889 | 0.087 | 0.50 | 0.0195 | 0.8935 | 14.1423 | |
| HC-S5-00 | 5 | 0.9815 | 0.145 | 0.00 | 0.0100 | 0.8450 | 14.2341 | |
| HC-S5-25 | 5 | 0.9815 | 0.145 | 0.25 | 0.0100 | 0.8450 | 14.2341 | |
| HC-S5-50 | 5 | 0.9815 | 0.145 | 0.50 | 0.0100 | 0.8450 | 14.2341 | |
| G4 | SG-S1-00 | 1 | 0.1963 | 0.029 | 0.00 | 0.1265 | 0.8445 | 14.1349 |
| SG-S1-25 | 1 | 0.1963 | 0.029 | 0.25 | 0.1265 | 0.8445 | 14.1349 | |
| SG-S1-50 | 1 | 0.1963 | 0.029 | 0.50 | 0.1265 | 0.8445 | 14.1349 | |
| SG-S3-00 | 3 | 0.5889 | 0.087 | 0.00 | 0.0844 | 0.8286 | 14.1428 | |
| SG-S3-25 | 3 | 0.5889 | 0.087 | 0.25 | 0.0844 | 0.8286 | 14.1428 | |
| SG-S3-50 | 3 | 0.5889 | 0.087 | 0.50 | 0.0844 | 0.8286 | 14.1428 | |
| SG-S5-00 | 5 | 0.9815 | 0.145 | 0.00 | 0.0422 | 0.8128 | 14.1423 | |
| SG-S5-25 | 5 | 0.9815 | 0.145 | 0.25 | 0.0422 | 0.8128 | 14.1423 | |
| SG-S5-50 | 5 | 0.9815 | 0.145 | 0.50 | 0.0422 | 0.8128 | 14.1423 | |
| G5 | EG-S1-00 | 1 | 0.1963 | 0.029 | 0.00 | 0.1600 | 0.8110 | 14.1388 |
| EG-S1-25 | 1 | 0.1963 | 0.029 | 0.25 | 0.1600 | 0.8110 | 14.1388 | |
| EG-S1-50 | 1 | 0.1963 | 0.029 | 0.50 | 0.1600 | 0.8110 | 14.1388 | |
| EG-S3-00 | 3 | 0.5889 | 0.087 | 0.00 | 0.1067 | 0.8063 | 14.1420 | |
| EG-S3-25 | 3 | 0.5889 | 0.087 | 0.25 | 0.1067 | 0.8063 | 14.1420 | |
| EG-S3-50 | 3 | 0.5889 | 0.087 | 0.50 | 0.1067 | 0.8063 | 14.1420 | |
| EG-S5-00 | 5 | 0.9815 | 0.145 | 0.00 | 0.0533 | 0.8017 | 14.1385 | |
| EG-S5-25 | 5 | 0.9815 | 0.145 | 0.25 | 0.0533 | 0.8017 | 14.1385 | |
| EG-S5-50 | 5 | 0.9815 | 0.145 | 0.50 | 0.0533 | 0.8017 | 14.1385 | |
| G6 | AR-S1-00 | 1 | 0.1963 | 0.029 | 0.00 | 0.0879 | 0.8831 | 14.1363 |
| AR-S1-25 | 1 | 0.1963 | 0.029 | 0.25 | 0.0879 | 0.8831 | 14.1363 | |
| AR-S1-50 | 1 | 0.1963 | 0.029 | 0.50 | 0.0879 | 0.8831 | 14.1363 | |
| AR-S3-00 | 3 | 0.5889 | 0.087 | 0.00 | 0.0586 | 0.8544 | 14.1381 | |
| AR-S3-25 | 3 | 0.5889 | 0.087 | 0.25 | 0.0586 | 0.8544 | 14.1381 | |
| AR-S3-50 | 3 | 0.5889 | 0.087 | 0.50 | 0.0586 | 0.8544 | 14.1381 | |
| AR-S5-00 | 5 | 0.9815 | 0.145 | 0.00 | 0.0293 | 0.8257 | 14.1400 | |
| AR-S5-25 | 5 | 0.9815 | 0.145 | 0.25 | 0.0293 | 0.8257 | 14.1400 | |
| AR-S5-50 | 5 | 0.9815 | 0.145 | 0.50 | 0.0293 | 0.8257 | 14.1400 |
| Specimen Name | Volume Fraction of SMA Fiber | Volume Fraction of S-Glass Fiber | Volume Fraction of Resin | Elastic Modulus of SMA | Elastic Modulus of S-Glass | Elastic Modulus of Resin |
|---|---|---|---|---|---|---|
| PRC3 | 0.08 | 0.09 | 0.83 | 60.12 Gpa | 86.70 Gpa | 1.57 Gpa |
| Specimen Name | Maximum Stress | Specimen Name | Maximum Stress | Specimen Name | Maximum Stress | Specimen Name | Maximum Stress |
|---|---|---|---|---|---|---|---|
| S3 | 56.382 | HC-S1-00 | 129.032 | SG-S3-00 | 287.540 | EG-S5-00 | 147.053 |
| S5 | 79.304 | HC-S1-25 | 129.251 | SG-S3-25 | 287.937 | EG-S5-25 | 147.648 |
| S7 | 102.223 | HC-S1-50 | 129.352 | SG-S3-50 | 288.260 | EG-S5-50 | 148.195 |
| LC-S1-00 | 200.483 | HC-S3-00 | 114.167 | SG-S5-00 | 193.632 | AR-S1-00 | 358.223 |
| LC-S1-25 | 200.705 | HC-S3-25 | 114.553 | SG-S5-25 | 194.219 | AR-S1-25 | 358.335 |
| LC-S1-50 | 200.809 | HC-S3-50 | 114.856 | SG-S5-50 | 194.768 | AR-S1-50 | 358.447 |
| LC-S3-00 | 164.055 | HC-S5-00 | 100.040 | EG-S1-00 | 249.393 | AR-S3-00 | 271.848 |
| LC-S3-25 | 164.437 | HC-S5-25 | 100.631 | EG-S1-25 | 249.515 | AR-S3-25 | 272.236 |
| LC-S3-50 | 164.736 | HC-S5-50 | 101.175 | EG-S1-50 | 249.637 | AR-S3-50 | 272.515 |
| LC-S5-00 | 127.627 | SG-S1-00 | 381.172 | EG-S3-00 | 198.291 | AR-S5-00 | 185.474 |
| LC-S5-25 | 128.210 | SG-S1-25 | 381.289 | EG-S3-25 | 198.702 | AR-S5-25 | 186.057 |
| LC-S5-50 | 128.745 | SG-S1-50 | 381.405 | EG-S3-50 | 199.029 | AR-S5-50 | 186.601 |
| Specimen Name | Residual Strain | Specimen Name | Residual Strain | Specimen Name | Residual Strain | Specimen Name | Residual Strain |
|---|---|---|---|---|---|---|---|
| S3 | 0.014 | HC-S1-00 | 0.01806 | SG-S3-00 | 0.014 | EG-S5-00 | 0.010 |
| S5 | 0.011 | HC-S1-25 | 0.01795 | SG-S3-25 | 0.013 | EG-S5-25 | 0.010 |
| S7 | 0.007 | HC-S1-50 | 0.01785 | SG-S3-50 | 0.013 | EG-S5-50 | 0.0095 |
| LC-S1-00 | 0.018 | HC-S3-00 | 0.01440 | SG-S5-00 | 0.010 | AR-S1-00 | 0.017 |
| LC-S1-25 | 0.017 | HC-S3-25 | 0.01409 | SG-S5-25 | 0.010 | AR-S1-25 | 0.017 |
| LC-S1-50 | 0.017 | HC-S3-50 | 0.01379 | SG-S5-50 | 0.0096 | AR-S1-50 | 0.017 |
| LC-S3-00 | 0.014 | HC-S5-00 | 0.01096 | EG-S1-00 | 0.017 | AR-S3-00 | 0.014 |
| LC-S3-25 | 0.014 | HC-S5-25 | 0.01047 | EG-S1-25 | 0.017 | AR-S3-25 | 0.013 |
| LC-S3-50 | 0.013 | HC-S5-50 | 0.009994 | EG-S1-50 | 0.017 | AR-S3-50 | 0.013 |
| LC-S5-00 | 0.010 | SG-S1-00 | 0.01785 | EG-S3-00 | 0.013 | AR-S5-00 | 0.010 |
| LC-S5-25 | 0.010 | SG-S1-25 | 0.01773 | EG-S3-25 | 0.013 | AR-S5-25 | 0.010 |
| LC-S5-50 | 0.009 | SG-S1-50 | 0.01761 | EG-S3-50 | 0.013 | AR-S5-50 | 0.009 |
| Specimen Name | Energy Dissipated | Specimen Name | Energy Dissipated | Specimen Name | Energy Dissipated | Specimen Name | Energy Dissipated |
|---|---|---|---|---|---|---|---|
| S3 | 3.703 | HC-S1-00 | 0.700 | SG-S3-00 | 7.020 | EG-S5-00 | 3.054 |
| S5 | 6.151 | HC-S1-25 | 0.729 | SG-S3-25 | 7.166 | EG-S5-25 | 3.259 |
| S7 | 8.748 | HC-S1-50 | 0.740 | SG-S3-50 | 7.208 | EG-S5-50 | 3.319 |
| LC-S1-00 | 1.772 | HC-S3-00 | 0.738 | SG-S5-00 | 7.058 | AR-S1-00 | 6.228 |
| LC-S1-25 | 1.808 | HC-S3-25 | 0.822 | SG-S5-25 | 7.306 | AR-S1-25 | 6.273 |
| LC-S1-50 | 1.819 | HC-S3-50 | 0.855 | SG-S5-50 | 7.378 | AR-S1-50 | 6.287 |
| LC-S3-00 | 1.819 | HC-S5-00 | 0.779 | EG-S1-00 | 2.809 | AR-S3-00 | 6.449 |
| LC-S3-25 | 1.922 | HC-S5-25 | 0.919 | EG-S1-25 | 2.850 | AR-S3-25 | 6.595 |
| LC-S3-50 | 1.957 | HC-S5-50 | 1.045 | EG-S1-50 | 2.862 | AR-S3-50 | 6.636 |
| LC-S5-00 | 1.866 | SG-S1-00 | 6.979 | EG-S3-00 | 2.932 | AR-S5-00 | 6.670 |
| LC-S5-25 | 2.037 | SG-S1-25 | 7.024 | EG-S3-25 | 3.056 | AR-S5-25 | 6.920 |
| LC-S5-50 | 2.095 | SG-S1-50 | 7.038 | EG-S3-50 | 3.092 | AR-S5-50 | 6.991 |
| Specimen Name | Yield Stress | Specimen Name | Yield Stress | Specimen Name | Yield Stress | Specimen Name | Yield Stress |
|---|---|---|---|---|---|---|---|
| S3 | 37.879 | HC-S1-00 | 82.804 | SG-S3-00 | 81.950 | EG-S5-00 | 80.707 |
| S5 | 58.663 | HC-S1-25 | 53.314 | SG-S3-25 | 61.450 | EG-S5-25 | 69.361 |
| S7 | 79.447 | HC-S1-50 | 23.706 | SG-S3-50 | 40.866 | EG-S5-50 | 57.966 |
| LC-S1-00 | 82.861 | HC-S3-00 | 81.760 | SG-S5-00 | 80.698 | AR-S1-00 | 83.047 |
| LC-S1-25 | 53.351 | HC-S3-25 | 61.319 | SG-S5-25 | 69.355 | AR-S1-25 | 53.350 |
| LC-S1-50 | 23.722 | HC-S3-50 | 40.794 | SG-S5-50 | 57.963 | AR-S1-50 | 23.653 |
| LC-S3-00 | 81.723 | HC-S5-00 | 81.166 | EG-S1-00 | 83.269 | AR-S3-00 | 81.847 |
| LC-S3-25 | 61.293 | HC-S5-25 | 69.628 | EG-S1-25 | 53.491 | AR-S3-25 | 61.379 |
| LC-S3-50 | 40.780 | HC-S5-50 | 58.042 | EG-S1-50 | 23.714 | AR-S3-50 | 40.827 |
| LC-S5-00 | 80.585 | SG-S1-00 | 83.149 | EG-S3-00 | 82.009 | AR-S5-00 | 80.647 |
| LC-S5-25 | 69.276 | SG-S1-25 | 53.415 | EG-S3-25 | 61.491 | AR-S5-25 | 69.319 |
| LC-S5-50 | 57.921 | SG-S1-50 | 23.681 | EG-S3-50 | 40.889 | AR-S5-50 | 57.944 |
| Specimen Name | Residual Stress | Specimen Name | Residual Stress | Specimen Name | Residual Stress | Specimen Name | Residual Stress |
|---|---|---|---|---|---|---|---|
| S3 | ------- | HC-S1-00 | 32.818 | SG-S3-00 | 54.525 | EG-S5-00 | 78.131 |
| S5 | ------- | HC-S1-25 | 32.929 | SG-S3-25 | 54.860 | EG-S5-25 | 78.688 |
| S7 | ------- | HC-S1-50 | 33.041 | SG-S3-50 | 55.194 | EG-S5-50 | 79.246 |
| LC-S1-00 | 32.424 | HC-S3-00 | 55.953 | SG-S5-00 | 78.375 | AR-S1-00 | 31.527 |
| LC-S1-25 | 32.536 | HC-S3-25 | 56.287 | SG-S5-25 | 78.932 | AR-S1-25 | 31.638 |
| LC-S1-50 | 32.647 | HC-S3-50 | 56.621 | SG-S5-50 | 79.490 | AR-S1-50 | 31.749 |
| LC-S3-00 | 55.691 | HC-S5-00 | 79.084 | EG-S1-00 | 29.940 | AR-S3-00 | 55.093 |
| LC-S3-25 | 56.025 | HC-S5-25 | 79.641 | EG-S1-25 | 30.052 | AR-S3-25 | 55.427 |
| LC-S3-50 | 56.359 | HC-S5-50 | 80.198 | EG-S1-50 | 30.163 | AR-S3-50 | 55.761 |
| LC-S5-00 | 78.958 | SG-S1-00 | 30.677 | EG-S3-00 | 54.035 | AR-S5-00 | 78.659 |
| LC-S5-25 | 79.515 | SG-S1-25 | 30.788 | EG-S3-25 | 54.369 | AR-S5-25 | 79.216 |
| LC-S5-50 | 80.072 | SG-S1-50 | 30.900 | EG-S3-50 | 54.704 | AR-S5-50 | 79.773 |
| Specimen Name | Strain Hardening Ratio (%) | Specimen Name | Strain Hardening Ratio (%) | Specimen Name | Strain Hardening Ratio (%) | Specimen Name | Strain Hardening Ratio (%) |
|---|---|---|---|---|---|---|---|
| S3 | 8.7896 | HC-S1-00 | 87.3200 | SG-S3-00 | 59.0857 | EG-S5-00 | 36.0758 |
| S5 | 6.3313 | HC-S1-25 | 87.5851 | SG-S3-25 | 59.4562 | EG-S5-25 | 36.1493 |
| S7 | 5.1586 | HC-S1-50 | 87.7073 | SG-S3-50 | 59.7667 | EG-S5-50 | 36.1658 |
| LC-S1-00 | 87.4643 | HC-S3-00 | 61.9953 | SG-S5-00 | 32.9600 | AR-S1-00 | 84.5696 |
| LC-S1-25 | 87.6026 | HC-S3-25 | 62.1867 | SG-S5-25 | 33.2905 | AR-S1-25 | 84.8828 |
| LC-S1-50 | 87.7290 | HC-S3-50 | 62.2319 | SG-S5-50 | 33.5374 | AR-S1-50 | 85.2181 |
| LC-S3-00 | 62.0752 | HC-S5-00 | 36.3707 | EG-S1-00 | 87.5509 | AR-S3-00 | 49.2492 |
| LC-S3-25 | 62.1832 | HC-S5-25 | 36.4953 | EG-S1-25 | 87.5965 | AR-S3-25 | 59.6139 |
| LC-S3-50 | 62.2257 | HC-S5-50 | 36.5047 | EG-S1-50 | 87.7167 | AR-S3-50 | 59.8989 |
| LC-S5-00 | 35.9689 | SG-S1-00 | 84.4147 | EG-S3-00 | 62.2251 | AR-S5-00 | 33.1755 |
| LC-S5-25 | 36.0328 | SG-S1-25 | 84.7252 | EG-S3-25 | 62.3508 | AR-S5-25 | 33.4982 |
| LC-S5-50 | 36.0283 | SG-S1-50 | 85.0631 | EG-S3-50 | 62.4405 | AR-S5-50 | 33.7319 |
| Composite Type | Maximum Stress | Residual Strain | Energy Dissipation | Yield Stress | Residual Stress | Strain Hardening Ratio |
|---|---|---|---|---|---|---|
| Pure Composite | direct ratio | inverse ratio | direct ratio | direct ratio | #N/A | inverse ratio |
| Hybrid Composite | inverse ratio | inverse ratio | direct ratio | If the initial strain of SMA fibers is equal to zero, it has an inverse ratio and if the initial strain of SMA fibers is not zero, the ratio is direct. | direct ratio | inverse ratio |
| Composite Type | Maximum Stress | Residual Strain | Energy Dissipation | Yield Stress | Residual Stress | Strain Hardening Ratio |
|---|---|---|---|---|---|---|
| Hybrid Composite | direct ratio | inverse ratio | direct ratio | inverse ratio | independent | independent |
| Composite Type: Hybrid Composite | Maximum Stress | The Higher the Failure Strain of the Conventional Fibers, the Higher the Maximum Stress that the Composite Can Tolerate. |
| Residual strain | The lower the elastic modulus of the conventional fibers, the lower the residual strain in the composite. | |
| Energy dissipation | The higher the failure strain of the conventional fibers, the higher the energy dissipation by the composite. | |
| Yield stress | Independent | |
| Residual stress | The higher the elastic modulus of the conventional fibers, the higher the residual stress in the composite. | |
| Stress hardening ratio | The higher the failure strain of the conventional fibers, the lower the strain hardening ratio in the composite. |
Disclaimer/Publisher’s Note: The statements, opinions and data contained in all publications are solely those of the individual author(s) and contributor(s) and not of MDPI and/or the editor(s). MDPI and/or the editor(s) disclaim responsibility for any injury to people or property resulting from any ideas, methods, instructions or products referred to in the content. |
© 2023 by the authors. Licensee MDPI, Basel, Switzerland. This article is an open access article distributed under the terms and conditions of the Creative Commons Attribution (CC BY) license (https://creativecommons.org/licenses/by/4.0/).
Share and Cite
Eilbeigi, S.; Tavakkolizadeh, M.; Masoodi, A.R. Enhancing Mechanical Behavior and Energy Dissipation in Fiber-Reinforced Polymers through Shape Memory Alloy Integration: A Numerical Study on SMA-FRP Composites under Cyclic Tensile Loading. Materials 2023, 16, 5695. https://doi.org/10.3390/ma16165695
Eilbeigi S, Tavakkolizadeh M, Masoodi AR. Enhancing Mechanical Behavior and Energy Dissipation in Fiber-Reinforced Polymers through Shape Memory Alloy Integration: A Numerical Study on SMA-FRP Composites under Cyclic Tensile Loading. Materials. 2023; 16(16):5695. https://doi.org/10.3390/ma16165695
Chicago/Turabian StyleEilbeigi, Saeed, Mohammadreza Tavakkolizadeh, and Amir R. Masoodi. 2023. "Enhancing Mechanical Behavior and Energy Dissipation in Fiber-Reinforced Polymers through Shape Memory Alloy Integration: A Numerical Study on SMA-FRP Composites under Cyclic Tensile Loading" Materials 16, no. 16: 5695. https://doi.org/10.3390/ma16165695