
Analyzing the Role of Fe0 and Fe3+ in the Formation of Expanded Clay Aggregates
 , , , , ,
  , , and
Abstract
:1. Introduction
2. Materials and Methods
2.1. Raw Materials: Clay and Additives
2.2. Mixture Design
2.3. Manufacture and Characterization of Sintered Aggregates
2.4. Modelling and Optimization
3. Results and Discussion
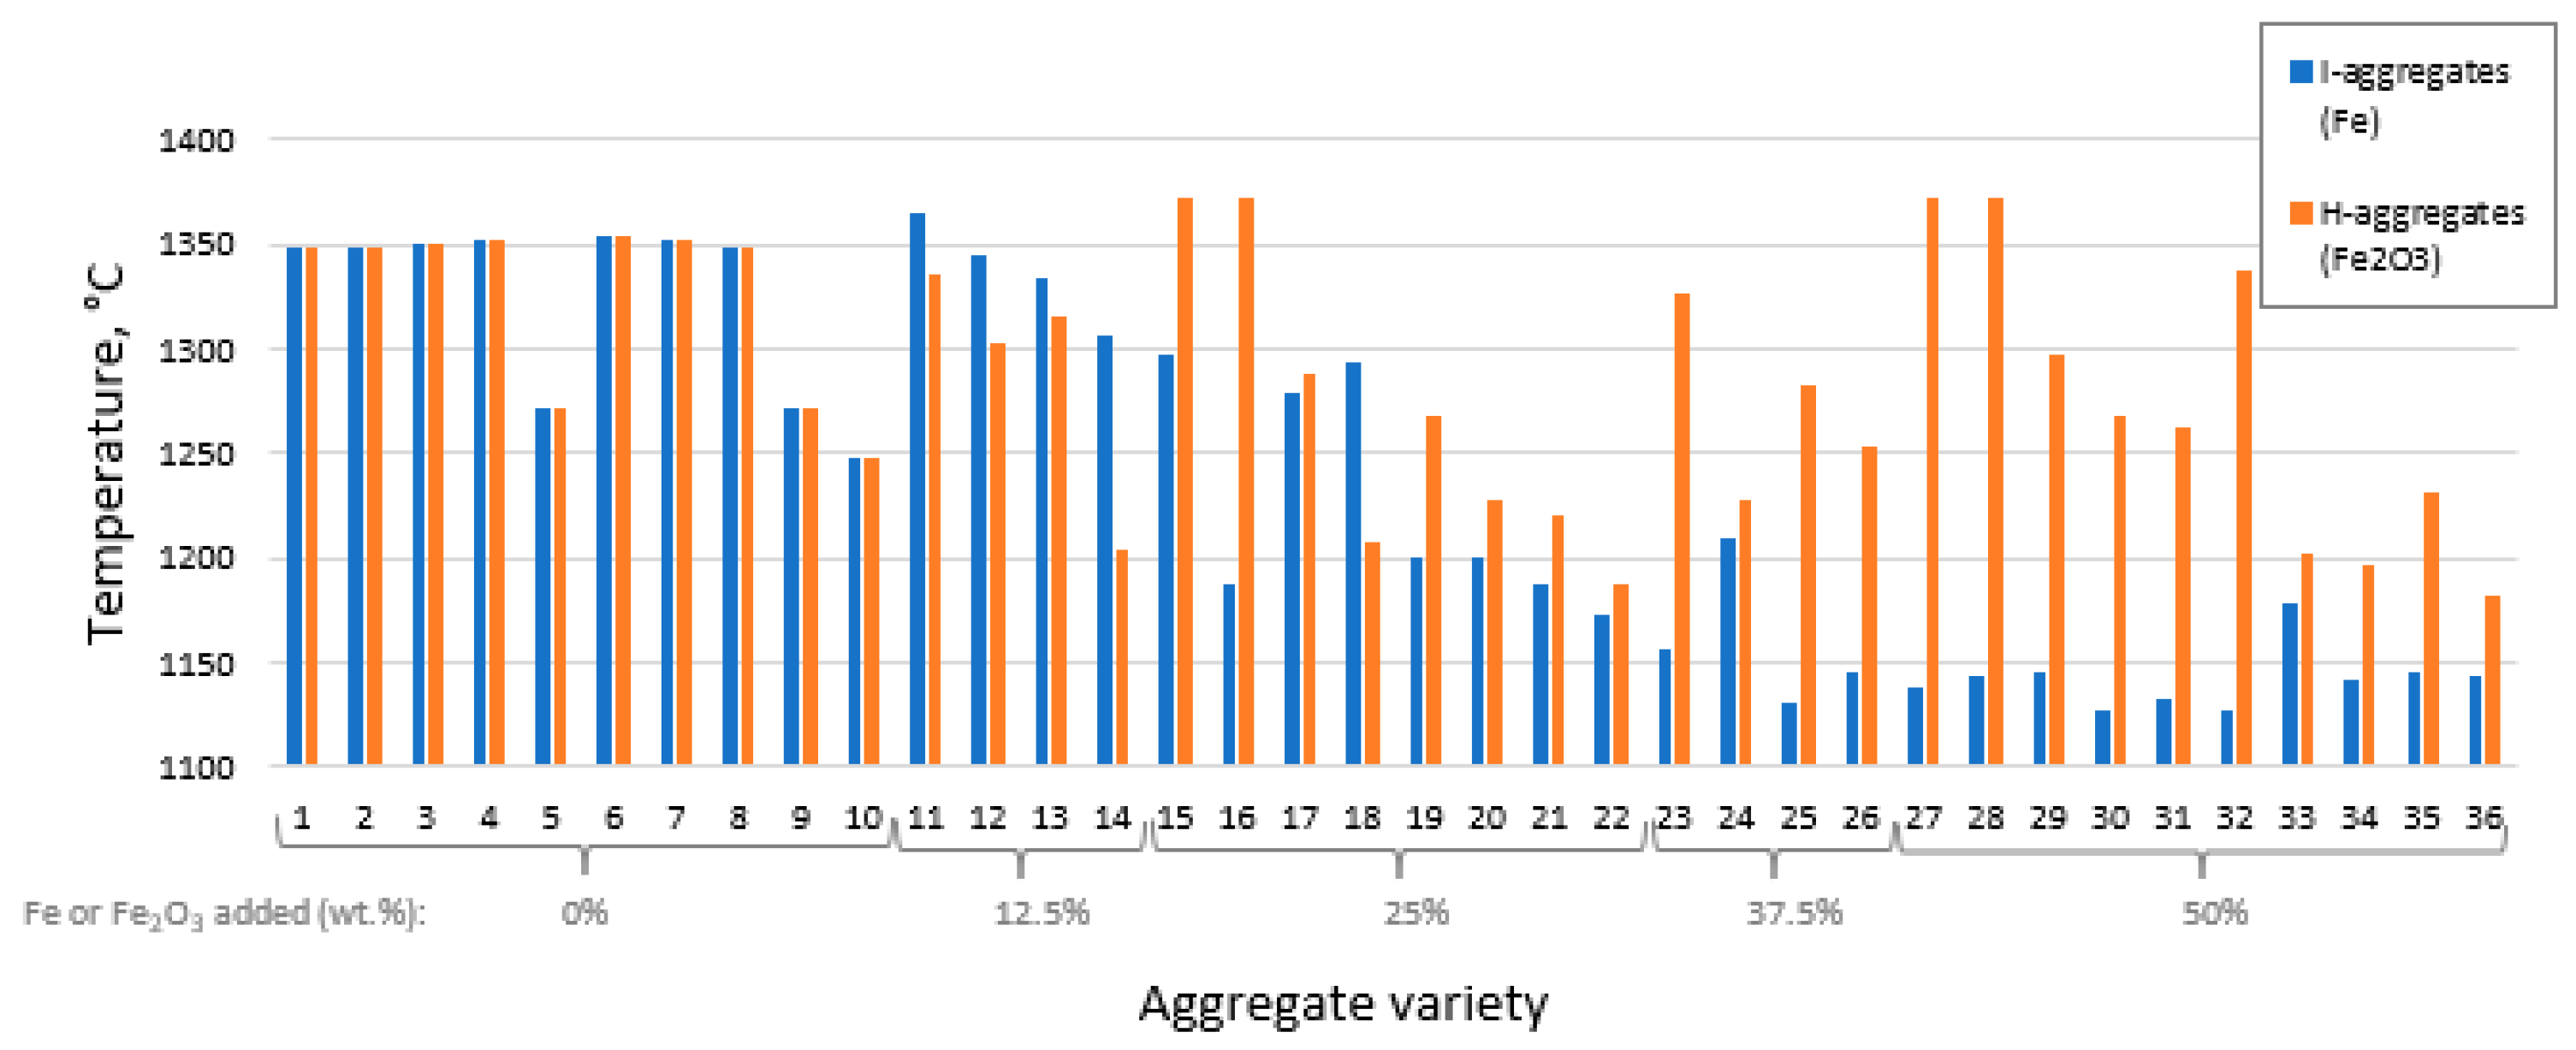
3.1. LOI and Working Temperature
3.2. Bloating Index
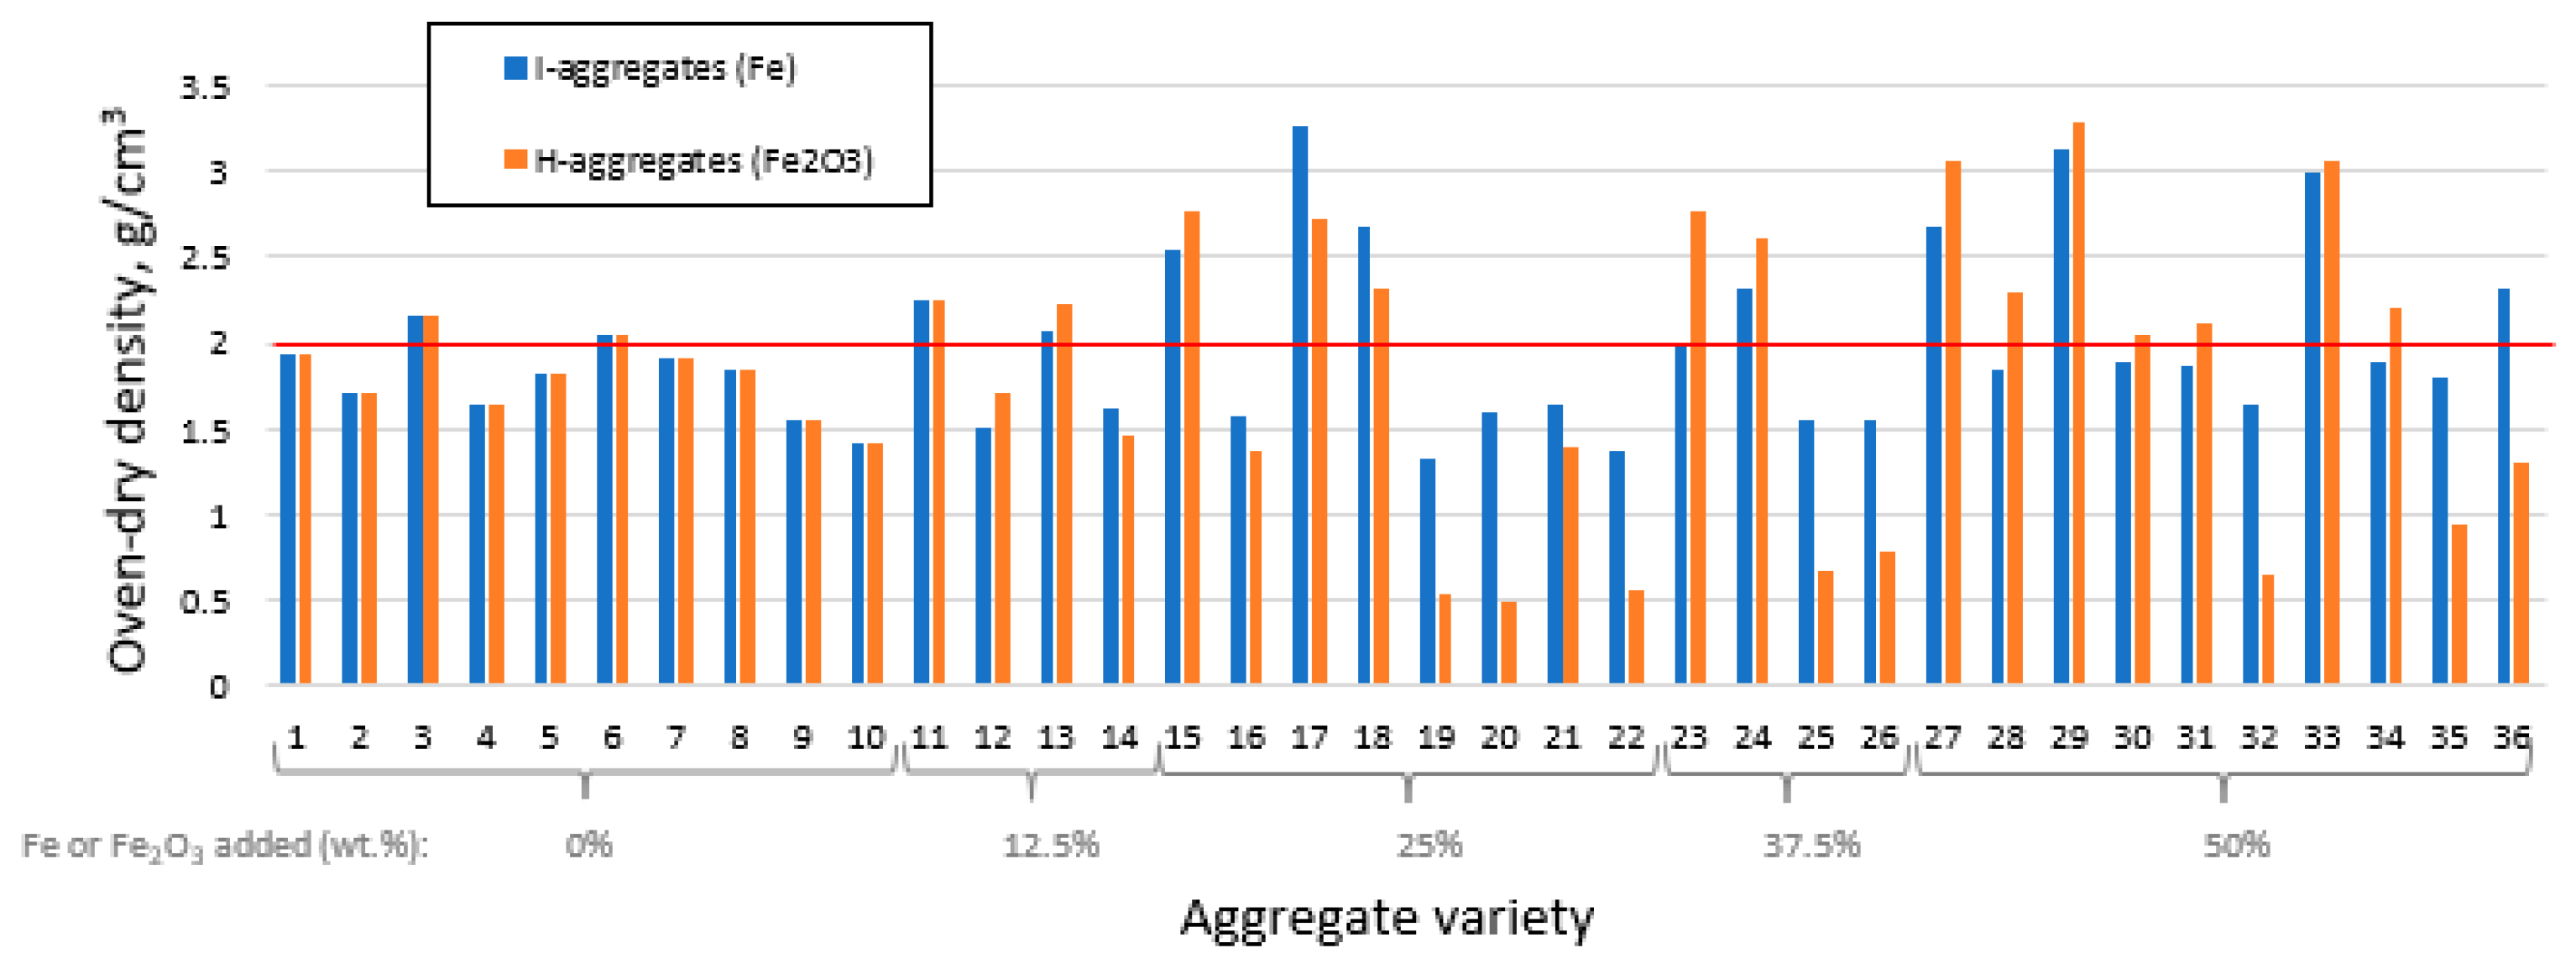
3.3. Density
3.4. The Role of Fe0 and Fe3+ in Expanded Clay Aggregate Formation
3.5. Water Absorption and Crushing Strength
3.6. Characterization of Optimal Mixtures and Validation of Models
4. Conclusions
- The process of expansion, pore generation and the associated decrease in density requires the addition of iron, such that the optimum mixtures of these properties presented between 25 and 40 wt.% of this additive, and also required the incorporation of organic carbon.
- The addition of H is linked to a greater volumetric expansion (max. 53%) than the use of I (max. 8%), suggesting that the formation of the FeO leading to bloating would require reducing and oxidizing conditions in the former and the latter, respectively. In this sense, the addition of organic carbon, C, seems to be crucial, since its incomplete thermal decomposition generates, on the one hand, CO, which would facilitate the reduction of Fe2O3 to FeO, while, on the other hand, the burning of C would release H2O(g) which, on the contrary, could intervene in the oxidation of native Fe to FeO.
- To obtain high mechanical strength, the addition of iron will be necessary, highlighting its combination with sodium carbonate (N) as a flux (especially in the range 2–2.5 wt.%) to obtain a more compact structure. Conversely, addition of organic carbon leads to a loss of mechanical strength. However, this component is crucial to facilitate open porosity formation, thus improving water absorption capacity.
- The experimental and model-estimated results are in good agreement, especially in the I-aggregates, which reinforces their application for further studies.
Supplementary Materials
Author Contributions
Funding
Data Availability Statement
Acknowledgments
Conflicts of Interest
References
- Ayati, B.; Ferrándiz-Mas, V.; Newport, D.; Cheeseman, C. Use of clay in the manufacture of lightweight aggregate. Constr. Build. Mater. 2018, 162, 124–131. [Google Scholar] [CrossRef]
- Dondi, M.; Cappelletti, P.; D’Amore, M.; de Gennaro, R.; Graziano, S.F.; Langella, A.; Raimondo, M.; Zanelli, C. Lightweight aggregates from waste materials: Reappraisal of expansion behavior and prediction schemes for bloating. Constr. Build. Mater. 2016, 127, 394–409. [Google Scholar] [CrossRef]
- Moreno-Maroto, J.M.; Cobo-Ceacero, C.J.; Uceda-Rodríguez, M.; Cotes-Palomino, T.; Martínez-García, C.; Alonso-Azcárate, J. Unraveling the expansion mechanism in lightweight aggregates: Demonstrating that bloating barely requires gas. Constr. Build. Mater. 2020, 247, 118583. [Google Scholar] [CrossRef]
- ESCSI. Expanded Shale, Clay and Slate Institute. 2022. Available online: https://www.escsi.org/ (accessed on 20 June 2022).
- Toyama, S.; Kawamura, M. On the relationship between the bloating of lightweight aggregate and reaction progress of the constituents. J. Chem. Eng. Jpn. 1971, 4, 251–256. [Google Scholar] [CrossRef] [Green Version]
- Sandrolini, F.; Palmonari, C. Role of iron oxides in the bloating of vitrified ceramic materials. Trans. J. Brit. Ceram. Soc. 1976, 75, 25–32. [Google Scholar]
- Bernhardt, M.; Justnes, H.; Tellesbø, H.; Wiik, K. The effect of additives on the properties of lightweight aggregates produced from clay. Cem. Concr. Compos. 2014, 53, 233–238. [Google Scholar] [CrossRef] [Green Version]
- Wie, Y.M.; Lee, K.G.; Lee, K.H. Chemical design of lightweight aggregate to prevent adhesion at bloating activation temperature. J. Asian Ceram. Soc. 2020, 8, 245–254. [Google Scholar] [CrossRef] [Green Version]
- Wei, Y.L.; Lin, Y.Y. Role of Fe compounds in light aggregate formation from a reservoir sediment. J. Hazard. Mater. 2009, 171, 111–115. [Google Scholar] [CrossRef]
- Wei, Y.L.; Jang, J.C.; Ko, K.W. Evidence for a new mechanism of Fe2O3 decomposition in lightweight aggregate formation. Environ. Chem. Lett. 2012, 10, 41–47. [Google Scholar] [CrossRef]
- Moreno-Maroto, J.M.; Cobo-Ceacero, C.J.; Conde-Sánchez, A.; Martínez-Rodríguez, A.M.; González-Corrochano, B.; Alonso-Azcárate, J.; Uceda-Rodríguez, M.; López, A.B.; Martínez-García, C.; Cotes-Palomino, T. Can statistical methods optimize complex multicomponent mixtures for sintering ceramic granular materials? A case of success with synthetic aggregates. Ceram. Int. 2023, 49, 24195–24206. [Google Scholar] [CrossRef]
- Menezes, R.R.; Malzac Neto, H.G.; Santana, L.N.L.; Lira, H.L.; Ferreira, H.S.; Neves, G.A. Optimization of wastes content in ceramic tiles using statistical design of mixture experiments. J. Eur. Ceram. Soc. 2008, 28, 3027–3039. [Google Scholar] [CrossRef]
- Arsenović, M.; Radojević, A.; Jakšić, Ž.; Pezo, L. Mathematical approach to application of industrial wastes in clay brick production—Part I: Testing and analysis. Ceram. Int. 2015, 41, 4890–4898. [Google Scholar] [CrossRef]
- Arsenović, M.; Radojević, A.; Jakšić, Ž.; Pezo, L. Mathematical approach to application of industrial wastes in clay brick production—Part II: Optimization. Ceram. Int. 2015, 41, 4899–4905. [Google Scholar] [CrossRef]
- Hu, C.; Wang, L.; Bai, J.; Yang, L.; Zhan, X.; Gong, J. Optimization mixture ratio parameters of lightweight aggregates incorporating municipal solid waste incineration fly ash and electrolytic manganese residues using the Uniform Design Method. Fresenius Environ. Bull. 2018, 27, 9147–9155. [Google Scholar]
- Wie, Y.M.; Lee, K.G.; Lee, K.H.; Ko, T.; Lee, K.H. The Experimental Process Design of Artificial Lightweight Aggregates Using an Orthogonal Array Table and Analysis by Machine Learning. Materials 2020, 13, 5570. [Google Scholar] [CrossRef]
- Moreno-Maroto, J.M.; Alonso-Azcárate, J. What is clay? A new definition of “clay” based on plasticity and its impact on the most widespread soil classification systems. Appl. Clay Sci. 2018, 161, 57–63. [Google Scholar] [CrossRef]
- Fakhfakh, E.; Hajjaji, W.; Medhioub, M.; Rocha, F.; López-Galindo, A.; Setti, M.; Kooli, F.; Zargouni, F.; Jamoussi, F. Effects of sand addition on production of lightweight aggregates from tunisian smectite-rich clayey rocks. Appl. Clay Sci. 2007, 35, 228–237. [Google Scholar] [CrossRef]
- EN-1097-3; Tests for Mechanical and Physical Properties of Aggregates. Part 3: Determination of Loose Bulk Density and Voids. European Committee for Standardization: Brussels, Belgium, 1998.
- EN-1097-6; Tests for Mechanical and Physical Properties of Aggregates. Part 6: Determination of Particle Density and Water Absorption. European Committee for Standardization: Brussels, Belgium, 2013.
- De Santiago Buey, C.; Raya García, M. Análisis del peso específico y porosidad de materiales porosos mediante picnometría de helio. Ing. Civil 2008, 151, 95–103. [Google Scholar]
- Yashima, S.; Kanda, Y.; Sano, S. Relationship between particle size and fracture energy or impact velocity required to fracture as estimated from single particle crushing. Powder Technol. 1987, 51, 277–282. [Google Scholar] [CrossRef]
- Földvári, M. Handbook of Thermogravimetric System of Minerals and Its Use in Geological Practice; Occasional Papers of the Geological Institute of Hungary; Geological Institute of Hungary: Budapest, Hungary, 2011; Volume 213, ISBN 978-963-671-288-4. [Google Scholar]
- EN-13055-1; Lightweight Aggregates. Part 1: Lightweight Aggregates for Concrete, Mortar and Grout. European Committee for Standardization: Brussels, Belgium, 2002.
- Moreno-Maroto, J.M.; González-Corrochano, B.; Alonso-Azcárate, J.; Rodríguez, L.; Acosta, A. Assessment of crystalline phase changes and glass formation by Rietveld- XRD method on ceramic lightweight aggregates sintered from mineral and polymeric wastes. Ceram. Int. 2018, 44, 11840–11851. [Google Scholar] [CrossRef]
- Riley, C.M. Relation of chemical properties to the bloating of clays. J. Am. Ceram. Soc. 1951, 34, 121–128. [Google Scholar] [CrossRef]
- Park, J.Y.; Kim, Y.T.; Lee, K.G.; Kang, S.; Kim, J.H. The mechanism of black core formation. J. Korean Cryst. Growth Cryst. Technol. 2005, 15, 208–215. [Google Scholar]
- Lee, K.G. Bloating Mechanism of Lightweight Aggregate with the Size. J. Korean Ceram. Soc. 2016, 53, 241–245. [Google Scholar] [CrossRef]


| Fe0 mix. | I1 | I2 | I3 | I4 | I5 | I6 | I7 | I8 | I9 | I10 | I11 | I12 |
| K (%) | 100 | 97.5 | 97.5 | 95 | 95 | 95 | 95 | 92.5 | 92.5 | 90 | 85 | 82.5 |
| I (%) | 0 | 0 | 0 | 0 | 0 | 0 | 0 | 0 | 0 | 0 | 12.5 | 12.5 |
| C (%) | 0 | 2.5 | 0 | 5 | 0 | 2.5 | 2.5 | 5 | 2.5 | 5 | 1.25 | 3.75 |
| N (%) | 0 | 0 | 2.5 | 0 | 5 | 2.5 | 2.5 | 2.5 | 5 | 5 | 1.25 | 1.25 |
| I13 | I14 | I15 | I16 | I17 | I18 | I19 | I20 | I21 | I22 | I23 | I24 | |
| K (%) | 82.5 | 80 | 75 | 72.5 | 72.5 | 70 | 70 | 67.5 | 67.5 | 65 | 60 | 57.5 |
| I (%) | 12.5 | 12.5 | 25 | 25 | 25 | 25 | 25 | 25 | 25 | 25 | 37.5 | 37.5 |
| C (%) | 1.25 | 3.75 | 0 | 2.5 | 0 | 0 | 5 | 5 | 2.5 | 5 | 1.25 | 1.25 |
| N (%) | 3.75 | 3.75 | 0 | 0 | 2.5 | 5 | 0 | 2.5 | 5 | 5 | 1.25 | 3.75 |
| I25 | I26 | I27 | I28 | I29 | I30 | I31 | I32 | I33 | I34 | I35 | I36 | |
| K (%) | 57.5 | 55 | 50 | 47.5 | 47.5 | 45 | 45 | 45 | 45 | 42.5 | 42.5 | 40 |
| I (%) | 37.5 | 37.5 | 50 | 50 | 50 | 50 | 50 | 50 | 50 | 50 | 50 | 50 |
| C (%) | 3.75 | 3.75 | 0 | 2.5 | 0 | 2.5 | 2.5 | 5 | 0 | 2.5 | 5 | 5 |
| N (%) | 1.25 | 3.75 | 0 | 0 | 2.5 | 2.5 | 2.5 | 0 | 5 | 5 | 2.5 | 5 |
| Fe3+ mix. | H1 | H2 | H3 | H4 | H5 | H6 | H7 | H8 | H9 | H10 | H11 | H12 |
| K (%) | 100 | 97.5 | 97.5 | 95 | 95 | 95 | 95 | 92.5 | 92.5 | 90 | 85 | 82.5 |
| H (%) | 0 | 0 | 0 | 0 | 0 | 0 | 0 | 0 | 0 | 0 | 12.5 | 12.5 |
| C (%) | 0 | 2.5 | 0 | 5 | 0 | 2.5 | 2.5 | 5 | 2.5 | 5 | 1.25 | 3.75 |
| N (%) | 0 | 0 | 2.5 | 0 | 5 | 2.5 | 2.5 | 2.5 | 5 | 5 | 1.25 | 1.25 |
| H13 | H14 | H15 | H16 | H17 | H18 | H19 | H20 | H21 | H22 | H23 | H24 | |
| K (%) | 82.5 | 80 | 75 | 72.5 | 72.5 | 70 | 70 | 67.5 | 67.5 | 65 | 60 | 57.5 |
| H (%) | 12.5 | 12.5 | 25 | 25 | 25 | 25 | 25 | 25 | 25 | 25 | 37.5 | 37.5 |
| C (%) | 1.25 | 3.75 | 0 | 2.5 | 0 | 0 | 5 | 5 | 2.5 | 5 | 1.25 | 1.25 |
| N (%) | 3.75 | 3.75 | 0 | 0 | 2.5 | 5 | 0 | 2.5 | 5 | 5 | 1.25 | 3.75 |
| H25 | H26 | H27 | H28 | H29 | H30 | H31 | H32 | H33 | H34 | H35 | H36 | |
| K (%) | 57.5 | 55 | 50 | 47.5 | 47.5 | 45 | 45 | 45 | 45 | 42.5 | 42.5 | 40 |
| H (%) | 37.5 | 37.5 | 50 | 50 | 50 | 50 | 50 | 50 | 50 | 50 | 50 | 50 |
| C (%) | 3.75 | 3.75 | 0 | 2.5 | 0 | 2.5 | 2.5 | 5 | 0 | 2.5 | 5 | 5 |
| N (%) | 1.25 | 3.75 | 0 | 0 | 2.5 | 2.5 | 2.5 | 0 | 5 | 5 | 2.5 | 5 |
| Parameter | Method and Equipment (If Applicable) |
|---|---|
| Loss on ignition (LOI) during preheating and firing a; % | Weight variation before and after firing 25 specimens in a Nannetti® TOR-R 120-14 tubular rotary kiln |
| Bloating index (BI); % | Size variation before and after firing 25 specimens [18] in a Nannetti® TOR-R 120-14 tubular rotary kiln |
| Loose bulk density (ρb); g/cm3 | Container filling [19] |
| Apparent density (ρa); g/cm3 | Water pycnometry [20] |
| Oven dry density (ρrd); g/cm3 | Water pycnometry [20] |
| 24 h Water absorption (WA24); % | Water pycnometry [20] |
| Porosity: Total (PT) open (PO) and closed (PC) porosity; % | PT = (1 − (ρrd/ρsolid b)) × 100; PO = (1 − (ρrd/ρa)) × 100; PC = PT − PO [3,21] |
| Single aggregate crushing strength (S); MPa | Average value of 25 specimens/Nannetti®FM 96 press [3,22] |
| Aggregate | Amorphous | Mullite | Quartz | Fe | Cristobalite | Hematite | Hercinite | Clinopyroxene |
|---|---|---|---|---|---|---|---|---|
| Max. BI 56.8% K + 39.7% I + 3.5% C + 0% N | 57.5 | 17.7 | 2.9 | 0.9 | 7.6 | 7.5 | 5.9 | |
| Max. WA24 71.7% K + 18.6% H + 4.7% C + 5.0% | 65.6 | 22.1 | 1.4 | 0.5 | 5.8 | 1.5 | 3.2 |
| Bloating Index (%) | Particle Density (g/cm3) | Water Absorption (%) | Crushing Strength (MPa) | ||||||||||
|---|---|---|---|---|---|---|---|---|---|---|---|---|---|
| Optimum Formulation | Exp. | Est. | Dif. | Exp. | Est. | Dif. | Exp. | Est. | Dif. | Exp. | Est. | Dif. | |
| I-agg. | Max. BI 56.8% K + 39.7% I + 3.5% C + 0% N | 8.1 | 9.8 | 1.7 | 1.67 | 1.47 | −0.2 | 15 | 18.4 | 3.4 | 2.5 | 2.4 | −0.1 |
| Min. ρrd 68.8% K + 26.2% I + 5.0% C + 0% N | 5.3 | 7.4 | 2.1 | 1.36 | 1.28 | −0.08 | 19.2 | 19.5 | 0.3 | 3.4 | 2.9 | −0.5 | |
| Max. WA24 90.0% K + 0% I + 5.0% C + 5.0% N | −7.8 | −8.2 | −0.4 | 1.42 | 1.46 | 0.04 | 24.5 | 23.6 | −0.9 | 1.7 | 2 | 0.3 | |
| Max. S 88.1% K + 10% I + 0% C + 1.9% N | −12.1 | −14.9 | −2.8 | 2.47 | 2.57 | 0.1 | 1.3 | −0.9 | −2.2 | 20.1 | 26.3 | 6.2 | |
| Bloating index (%) | Particle density (g/cm3) | Water absorption (%) | Crushing strength (MPa) | ||||||||||
| Optimum formulation | Exp. | Est. | Dif. | Exp. | Est. | Dif. | Exp. | Est. | Dif. | Exp. | Est. | Dif. | |
| H-agg. | Max. BI; Min. ρrd 56.8% K + 38.2% H + 5.0% C + 0% N | 52.6 | 62.7 | 10.1 | 0.57 | 0.32 | −0.25 | 18.1 | 19.4 | 1.3 | 0.5 | 0.4 | −0.1 |
| Max. WA24 71.7% K + 18.6% H + 4.7% C + 5.0% N | 10 | 17.8 | 7.8 | 0.83 | 0.66 | −0.17 | 16.4 | 27 | 10.6 | 3.8 | 1.5 | 2.3 | |
| Max. S 47.2% K + 50% H + 0% C + 2.8% N | −19.5 | −18.5 | 1 | 3.15 | 3.36 | 0.21 | 0.1 | 0.2 | 0.1 | 18 | 25.1 | 7.1 | |
Disclaimer/Publisher’s Note: The statements, opinions and data contained in all publications are solely those of the individual author(s) and contributor(s) and not of MDPI and/or the editor(s). MDPI and/or the editor(s) disclaim responsibility for any injury to people or property resulting from any ideas, methods, instructions or products referred to in the content. |
© 2023 by the authors. Licensee MDPI, Basel, Switzerland. This article is an open access article distributed under the terms and conditions of the Creative Commons Attribution (CC BY) license (https://creativecommons.org/licenses/by/4.0/).
Share and Cite
Moreno-Maroto, J.M.; González-Corrochano, B.; Martínez-Rodríguez, A.M.; Conde-Sánchez, A.; Cobo-Ceacero, C.J.; Alonso-Azcárate, J.; Uceda-Rodríguez, M.; López, A.B.; Martínez-García, C.; Cotes-Palomino, T. Analyzing the Role of Fe0 and Fe3+ in the Formation of Expanded Clay Aggregates. Materials 2023, 16, 5623. https://doi.org/10.3390/ma16165623
Moreno-Maroto JM, González-Corrochano B, Martínez-Rodríguez AM, Conde-Sánchez A, Cobo-Ceacero CJ, Alonso-Azcárate J, Uceda-Rodríguez M, López AB, Martínez-García C, Cotes-Palomino T. Analyzing the Role of Fe0 and Fe3+ in the Formation of Expanded Clay Aggregates. Materials. 2023; 16(16):5623. https://doi.org/10.3390/ma16165623
Chicago/Turabian StyleMoreno-Maroto, José Manuel, Beatriz González-Corrochano, Ana M. Martínez-Rodríguez, Antonio Conde-Sánchez, Carlos Javier Cobo-Ceacero, Jacinto Alonso-Azcárate, Manuel Uceda-Rodríguez, Ana B. López, Carmen Martínez-García, and Teresa Cotes-Palomino. 2023. "Analyzing the Role of Fe0 and Fe3+ in the Formation of Expanded Clay Aggregates" Materials 16, no. 16: 5623. https://doi.org/10.3390/ma16165623