
Drying Kinetics of Microwave-Assisted Drying of Leaching Residues from Hydrometallurgy of Zinc

Abstract
:1. Introduction
2. Experimental Section
2.1. Experimental Substances
2.2. Experimental Equipment
2.3. Experimental Procedures
3. Methods
3.1. Calculation of the Relevant Parameters
- (1)
- Moisture content
- (2)
- Hydration ratios
- (3)
- Instantaneous drying rate
- (4)
- Average drying rate
3.2. Numerical and Kinetic Models for Thin Layer Drying
4. Results and Discussion
4.1. Effect of Microwave Heating Power on the Drying of Acid-Leaching Residues Using Microwaves
4.2. Effect of Initial Moisture Content on the Drying of Acid-Leaching Residues Using Microwaves
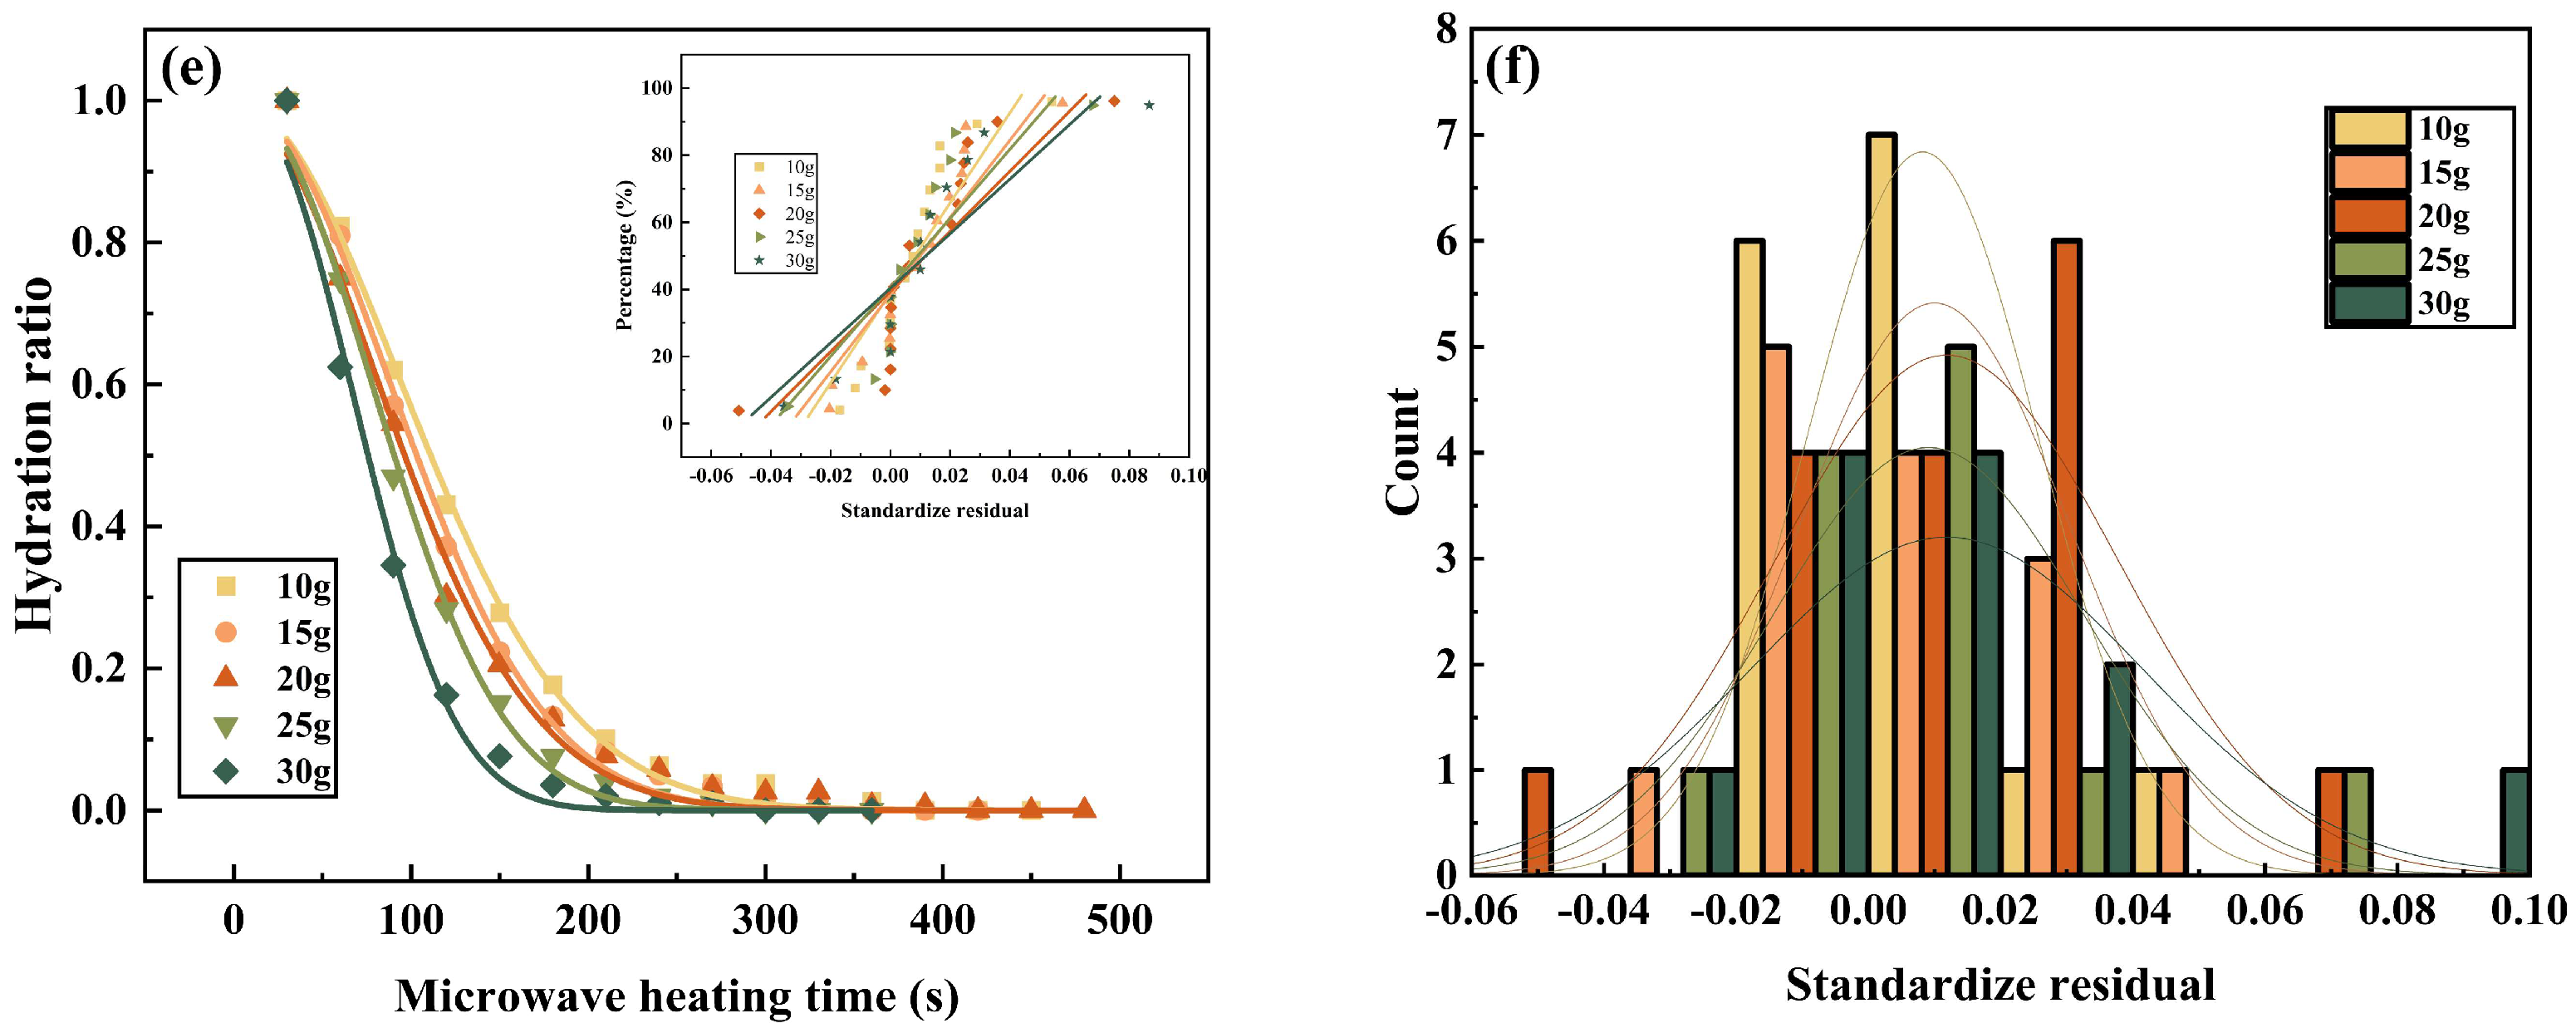
4.3. Effect of Initial Mass on the Drying of Acid-Leaching Residues Using Microwaves
4.4. Results and Analysis of the X-ray Diffractometer
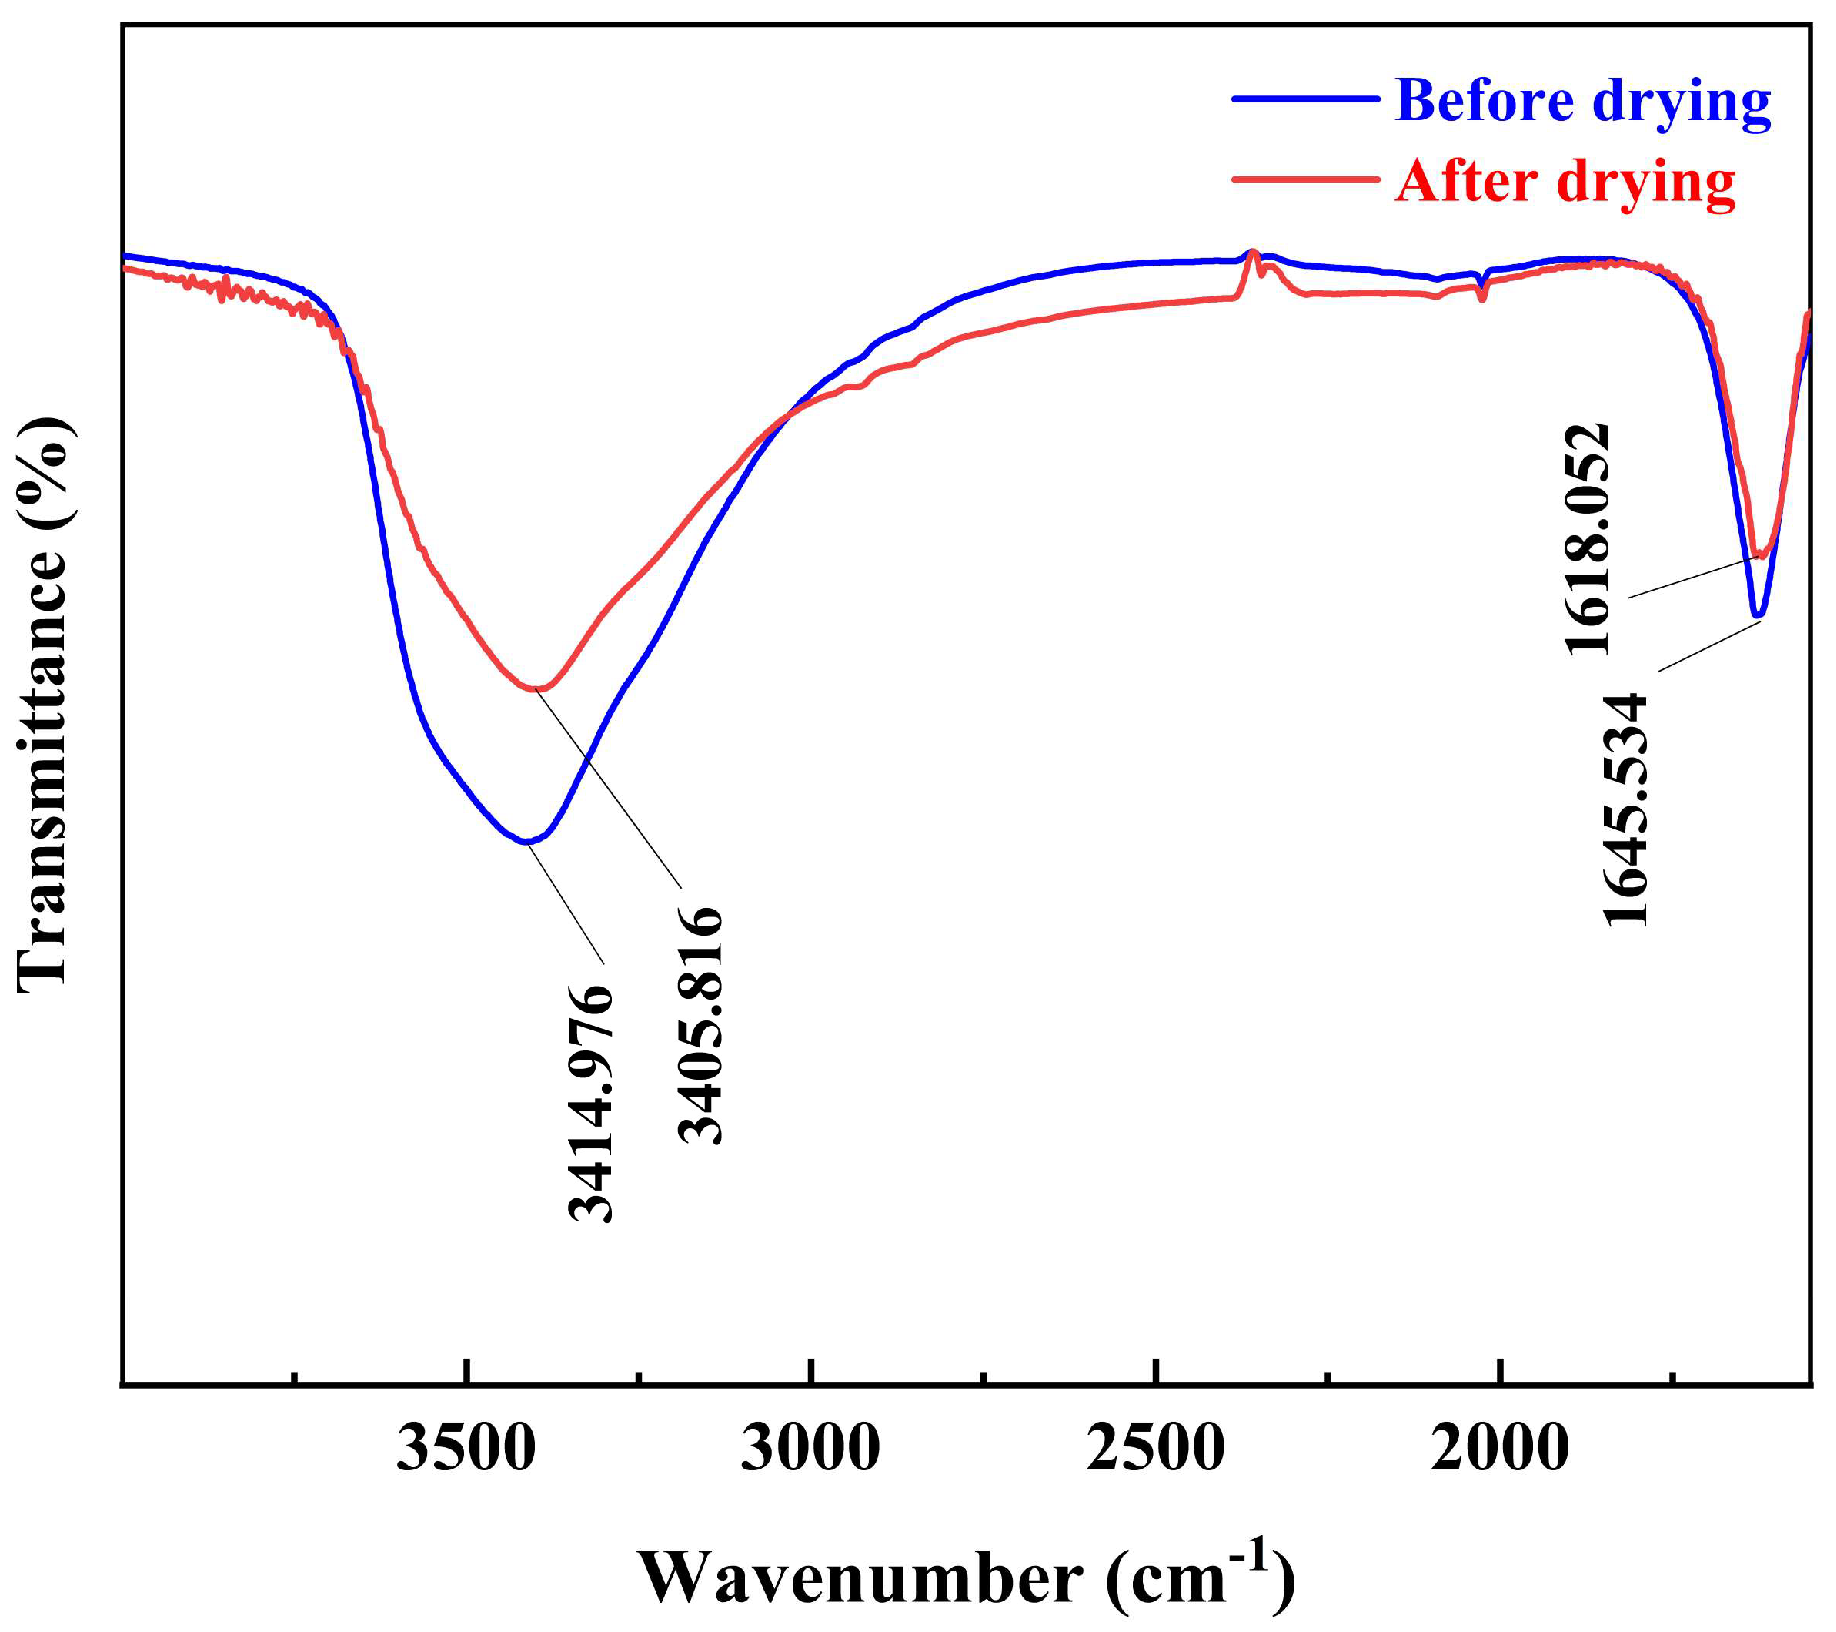
4.5. Results and Analysis of the Fourier Transform Infrared Spectroscopy
4.6. Drying Kinetics Model Fitting Process
4.7. Calculating the Diffusion Coefficient and Activation Energy
5. Conclusions
Author Contributions
Funding
Institutional Review Board Statement
Informed Consent Statement
Data Availability Statement
Conflicts of Interest
References
- Singh, J.; Singh, S.P. Geopolymerization of solid waste of non-ferrous metallurgy—A review. J. Environ. Manag. 2019, 251, 109571. [Google Scholar] [CrossRef]
- Yan, L.Y.; Wang, A.J.; Chen, Q.S.; Li, J.W. Dynamic material flow analysis of zinc resources in China. Resour. Conserv. Recycl. 2013, 75, 23–31. [Google Scholar] [CrossRef]
- Li, J.H.; Chen, Z.F.; Shen, B.P.; Xu, Z.F.; Zhang, Y.F. The extraction of valuable metals and phase transformation and formation mechanism in roasting-water leaching process of laterite with ammonium sulfate. J. Clean. Prod. 2017, 140, 1148–1155. [Google Scholar] [CrossRef]
- Song, S.L.; Sun, W.; Wang, L.; Liu, R.Q.; Han, H.S.; Hu, Y.H.; Yang, Y. Recovery of cobalt and zinc from the leaching solution of zinc smelting slag. J. Environ. Chem. Eng. 2019, 7, 102777. [Google Scholar] [CrossRef]
- Ma, A.Y.; Zheng, X.M.; Zhang, L.B.; Peng, J.H.; Li, Z.; Li, S.; Li, S.W. Clean recycling of zinc from blast furnace dust with ammonium acetate as complexing agents. Sep. Sci. Technol. 2018, 53, 1327–1341. [Google Scholar] [CrossRef]
- Wang, H.J.; Liu, Z.Y.; Liu, Z.H.; Li, Y.H.; Li, S.W.; Zhang, W.H.; Li, Q.H. Leaching of iron concentrate separated from kiln slag in zinc hydrometallurgy with hydrochloric acid and its mechanism. Trans. Nonferrous Met. Soc. China 2017, 27, 901–907. [Google Scholar] [CrossRef]
- VijayaVenkataRaman, S.; Iniyan, S.; Goic, R. A review of solar drying technologies. Renew. Sustain. Energy Rev. 2012, 16, 2652–2670. [Google Scholar] [CrossRef]
- Tiwari, A. A review on solar drying of agricultural produce. Food Process 2016, 7, 1–12. [Google Scholar] [CrossRef]
- Nguyen, M.H.; Price, W.E. Air-drying of banana: Influence of experimental parameters, slab thickness, banana maturity and harvesting season. J. Food Eng. 2007, 79, 200–207. [Google Scholar] [CrossRef] [Green Version]
- El Hage, H.; Herez, A.; Ramadan, M.; Bazzi, H.; Khaled, M. An investigation on solar drying: A review with economic and environmental assessment. Energy 2018, 157, 815–829. [Google Scholar] [CrossRef]
- Rao, T.S.S.B.; Murugan, S. Solar drying of medicinal herbs: A review. Sol. Energy 2021, 223, 415–436. [Google Scholar]
- Lewicki, P.P. Design of hot air drying for better foods. Trends Food Sci. Technol. 2006, 17, 153–163. [Google Scholar] [CrossRef]
- Salim, N.S.M.; Gariepy, Y.; Raghavan, V. Hot Air Drying and Microwave-Assisted Hot Air Drying of Broccoli Stalk Slices (Brassica oleracea L. Var. Italica). J. Food Process. Preserv. 2017, 41, e12905. [Google Scholar] [CrossRef]
- Ratti, C. Hot air and freeze-drying of high-value foods: A review. J. Food Eng. 2001, 49, 311–319. [Google Scholar] [CrossRef]
- Yang, W.J.; Du, H.J.; Mariga, A.M.; Pei, F.; Ma, N.; Hu, Q.H. Hot air drying process promotes lignification of Lentinus edodes. Lwt-Food Sci. Technol. 2017, 84, 726–732. [Google Scholar] [CrossRef]
- Chaturvedi, P.K. Introduction to Microwaves. In Microwave, Radar & RF Engineering; Springer: Singapore, 2018; pp. 1–17. [Google Scholar]
- Anwar, J.; Shafique, U.; Waheed-uz-Zaman; Rehman, R.; Salman, M.; Dar, A.; Anzano, J.M.; Ashraf, U.; Ashraf, S. Microwave chemistry: Effect of ions on dielectric heating in microwave ovens. Arab. J. Chem. 2015, 8, 100–104. [Google Scholar] [CrossRef] [Green Version]
- Mishra, R.R.; Sharma, A.K. Microwave–material interaction phenomena: Heating mechanisms, challenges and opportunities in material processing. Compos. Part A Appl. Sci. Manuf. 2016, 81, 78–97. [Google Scholar] [CrossRef]
- Yu, C.-H.; Fu, Q.J.; Tsang, S.C.E. 13—Aerogel materials for insulation in buildings. In Materials for Energy Efficiency and Thermal Comfort in Buildings; Elsevier: Amsterdam, The Netherlands, 2010; pp. 319–344. [Google Scholar]
- Yang, S.; Yang, Y.Y.; Zhang, J.Y.; Zhang, Z.Y.; Zhang, L.; Lin, X.C. Laser-induced cracks in ice due to temperature gradient and thermal stress. Opt. Laser Technol. 2018, 102, 115–123. [Google Scholar] [CrossRef]
- Carvalho, G.R.; Monteiro, R.L.; Laurindo, J.B.; Augusto, P.E.D. Microwave and microwave-vacuum drying as alternatives to convective drying in barley malt processing. Innov. Food Sci. Emerg. Technol. 2021, 73, 102770. [Google Scholar] [CrossRef]
- de Faria, R.Q.; dos Santos, A.R.P.; Gariepy, Y.; da Silva, E.A.A.; Sartori, M.M.P.; Raghavan, V. Optimization of the process of drying of corn seeds with the use of microwaves. Dry. Technol. 2019, 38, 676–684. [Google Scholar] [CrossRef]
- Demiray, E.; Seker, A.; Tulek, Y. Drying kinetics of onion (Allium cepa L.) slices with convective and microwave drying. Heat Mass Transf. 2017, 53, 1817–1827. [Google Scholar] [CrossRef]
- Li, Y.S.; Yang, W.S. Microwave synthesis of zeolite membranes: A review. J. Membr. Sci. 2008, 316, 3–17. [Google Scholar] [CrossRef]
- Kipcak, A.S. Microwave drying kinetics of mussels (Mytilus edulis). Res. Chem. Intermed. 2017, 43, 1429–1445. [Google Scholar] [CrossRef]
- Liu, C.H.; Zhang, M.P.; Zhu, X.J.; Wang, Q.; Xiong, H.B.; Chen, M.H.; Liu, M.H. Drying kinetics and upgrading characteristics analysis of Zhaotong lignite with microwave deep drying. Int. J. Coal Prep. Util. 2021, 42, 3531–3553. [Google Scholar] [CrossRef]
- Huang, W.W.; Zhang, Y.Q.; Qiu, H.J.; Huang, J.Z.; Chen, J.; Gao, L.; Omran, M.; Chen, G. Drying characteristics of ammonium polyvanadate under microwave heating based on a thin-layer drying kinetics fitting model. J. Mater. Res. Technol. 2022, 19, 1497–1509. [Google Scholar] [CrossRef]
- Ling, Y.Q.; Li, Q.N.; Zheng, H.W.; Omran, M.; Gao, L.; Chen, J.; Chen, G. Optimisation on the stability of CaO-doped partially stabilised zirconia by microwave heating. Ceram. Int. 2021, 47, 8067–8074. [Google Scholar] [CrossRef]
- Zheng, H.W.; Hao, X.D.; Zhang, S.R.; Omran, M.; Chen, G.; Chen, J.; Gao, L. Modeling of process and analysis of drying characteristics for natural TiO2 under microwave heating. Chem. Eng. Process.-Process Intensif. 2022, 174, 108900. [Google Scholar] [CrossRef]
- GB/T 10561-2019; Methods for Chemical Analysis of Lead-Zinc Ore [S]. China Standard Publishing House: Beijing, China, 2019.
- Kucuk, H.; Midilli, A.; Kilic, A.; Dincer, I. A Review on Thin-Layer Drying-Curve Equations. Dry. Technol. 2014, 32, 757–773. [Google Scholar] [CrossRef]
- Jones, D.A.; Lelyveld, T.P.; Mavrofidis, S.D.; Kingman, S.W.; Miles, N.J. Microwave heating applications in environmental engineering—A review. Resour. Conserv. Recycl. 2002, 34, 75–90. [Google Scholar] [CrossRef]
- Fan, J.L.; Chen, B.Q.; Wu, L.F.; Zhang, F.C.; Lu, X.H.; Xiang, Y.Z. Evaluation and development of temperature-based empirical models for estimating daily global solar radiation in humid regions. Energy 2018, 144, 903–914. [Google Scholar] [CrossRef]
- Zhang, Q.Z.; He, J.M.; Song, L.; Hu, K.; Sun, P.S. Theoretical model of water vapor absorption–desorption equilibrium of concrete considering the effect of temperature. Constr. Build. Mater. 2023, 375, 130968. [Google Scholar] [CrossRef]
- Kucuk, H.; Kilic, A.; Midilli, A. Common Applications of Thin Layer Drying Curve Equations and Their Evaluation Criteria. In Progress in Energy, and the Environment; Springer: Cham, Switzerland, 2014; pp. 669–680. [Google Scholar]
- Meda, V.; Orsat, V.; Raghavan, V. 2—Microwave heating and the dielectric properties of foods. In The Microwave Processing of Foods, 3rd ed.; Elsevier: Amsterdam, The Netherlands, 2017; pp. 23–43. [Google Scholar]
- Clark, D.E.; Folz, D.C.; West, J.K. Processing materials with microwave energy. Mater. Sci. Eng. A 2000, 287, 153–158. [Google Scholar] [CrossRef]
- Zhang, Y.; Man, R.L.; Ni, W.D.; Wang, H. Selective leaching of base metals from copper smelter slag. Hydrometallurgy 2010, 103, 25–29. [Google Scholar]
- Wu, S.K.; He, M.Y.; Yang, M.; Zhang, B.Y.; Wang, F.; Li, Q.Z. Near-Infrared Spectroscopy Study of Serpentine Minerals and Assignment of the OH Group. Crystals 2021, 11, 1130. [Google Scholar] [CrossRef]
- Hu, L.; Wang, G.H.; Wang, Q.D. Efficient drying and oxygen-containing functional groups characteristics of lignite during microwave irradiation process. Dry. Technol. 2018, 36, 1086–1097. [Google Scholar] [CrossRef]
- Jtte Editorial Office; Chen, J.Q.; Dan, H.C.; Ding, Y.J.; Gao, Y.M.; Guo, M.; Guo, S.C.; Han, B.Y.; Hong, B.; Hou, Y.; et al. New innovations in pavement materials and engineering: A review on pavement engineering research. J. Traffic Transp. Eng. Engl. Ed. 2021, 8, 815–999. [Google Scholar]
- Jha, P.; Meghwal, M.; Prabhakar, P.K. Microwave drying of banana blossoms (Musa acuminata): Mathematical modeling and drying energetics. J. Food Process. Preserv. 2021, 45, e15717. [Google Scholar] [CrossRef]
- Koua, B.K.; Koffi, P.M.E.; Gbaha, P. Evolution of shrinkage, real density, porosity, heat and mass transfer coefficients during indirect solar drying of cocoa beans. J. Saudi Soc. Agric. Sci. 2019, 18, 72–82. [Google Scholar] [CrossRef]
- Chen, Y.S.; Wang, J.Z.; Flanagan, D.R. Chapter 9—Fundamental of Diffusion and Dissolution. In Developing Solid Oral Dosage Forms, 3rd ed.; Elsevier: Amsterdam, The Netherlands, 2017; pp. 253–270. [Google Scholar]
- Nowakowski, B. Reaction rate and diffusion coefficient of reactive Lorentz gas. Phys. A: Stat. Mech. Its Appl. 1998, 255, 93–119. [Google Scholar] [CrossRef]
- Zheng, F.Q.; Chen, F.; Guo, Y.F.; Jiang, T.; Travyanov, A.Y.; Qiu, G.Z. Kinetics of Hydrochloric Acid Leaching of Titanium from Titanium-Bearing Electric Furnace Slag. JOM 2016, 68, 1476–1484. [Google Scholar] [CrossRef]
- Dadali, G.; Demirhan, E.; Ozbek, B. Color change kinetics of spinach undergoing microwave drying. Dry. Technol. 2007, 25, 1713–1723. [Google Scholar] [CrossRef]


| Element | Fe2O3 | ZnO | SiO2 | PbO | CuO | MnO | K2O | |
| Contain (wt%) | 36.448 | 29.243 | 14.617 | 11.262 | 1.720 | 0.637 | 0.479 | |
| Element | CdO | Tr2O3 | TiO2 | C1 | SrO | V2O5 | Ag2O | ZrO2 |
| Contain (wt%) | 0.414 | 0.358 | 0.289 | 0.240 | 0.238 | 0.084 | 0.055 | 0.048 |
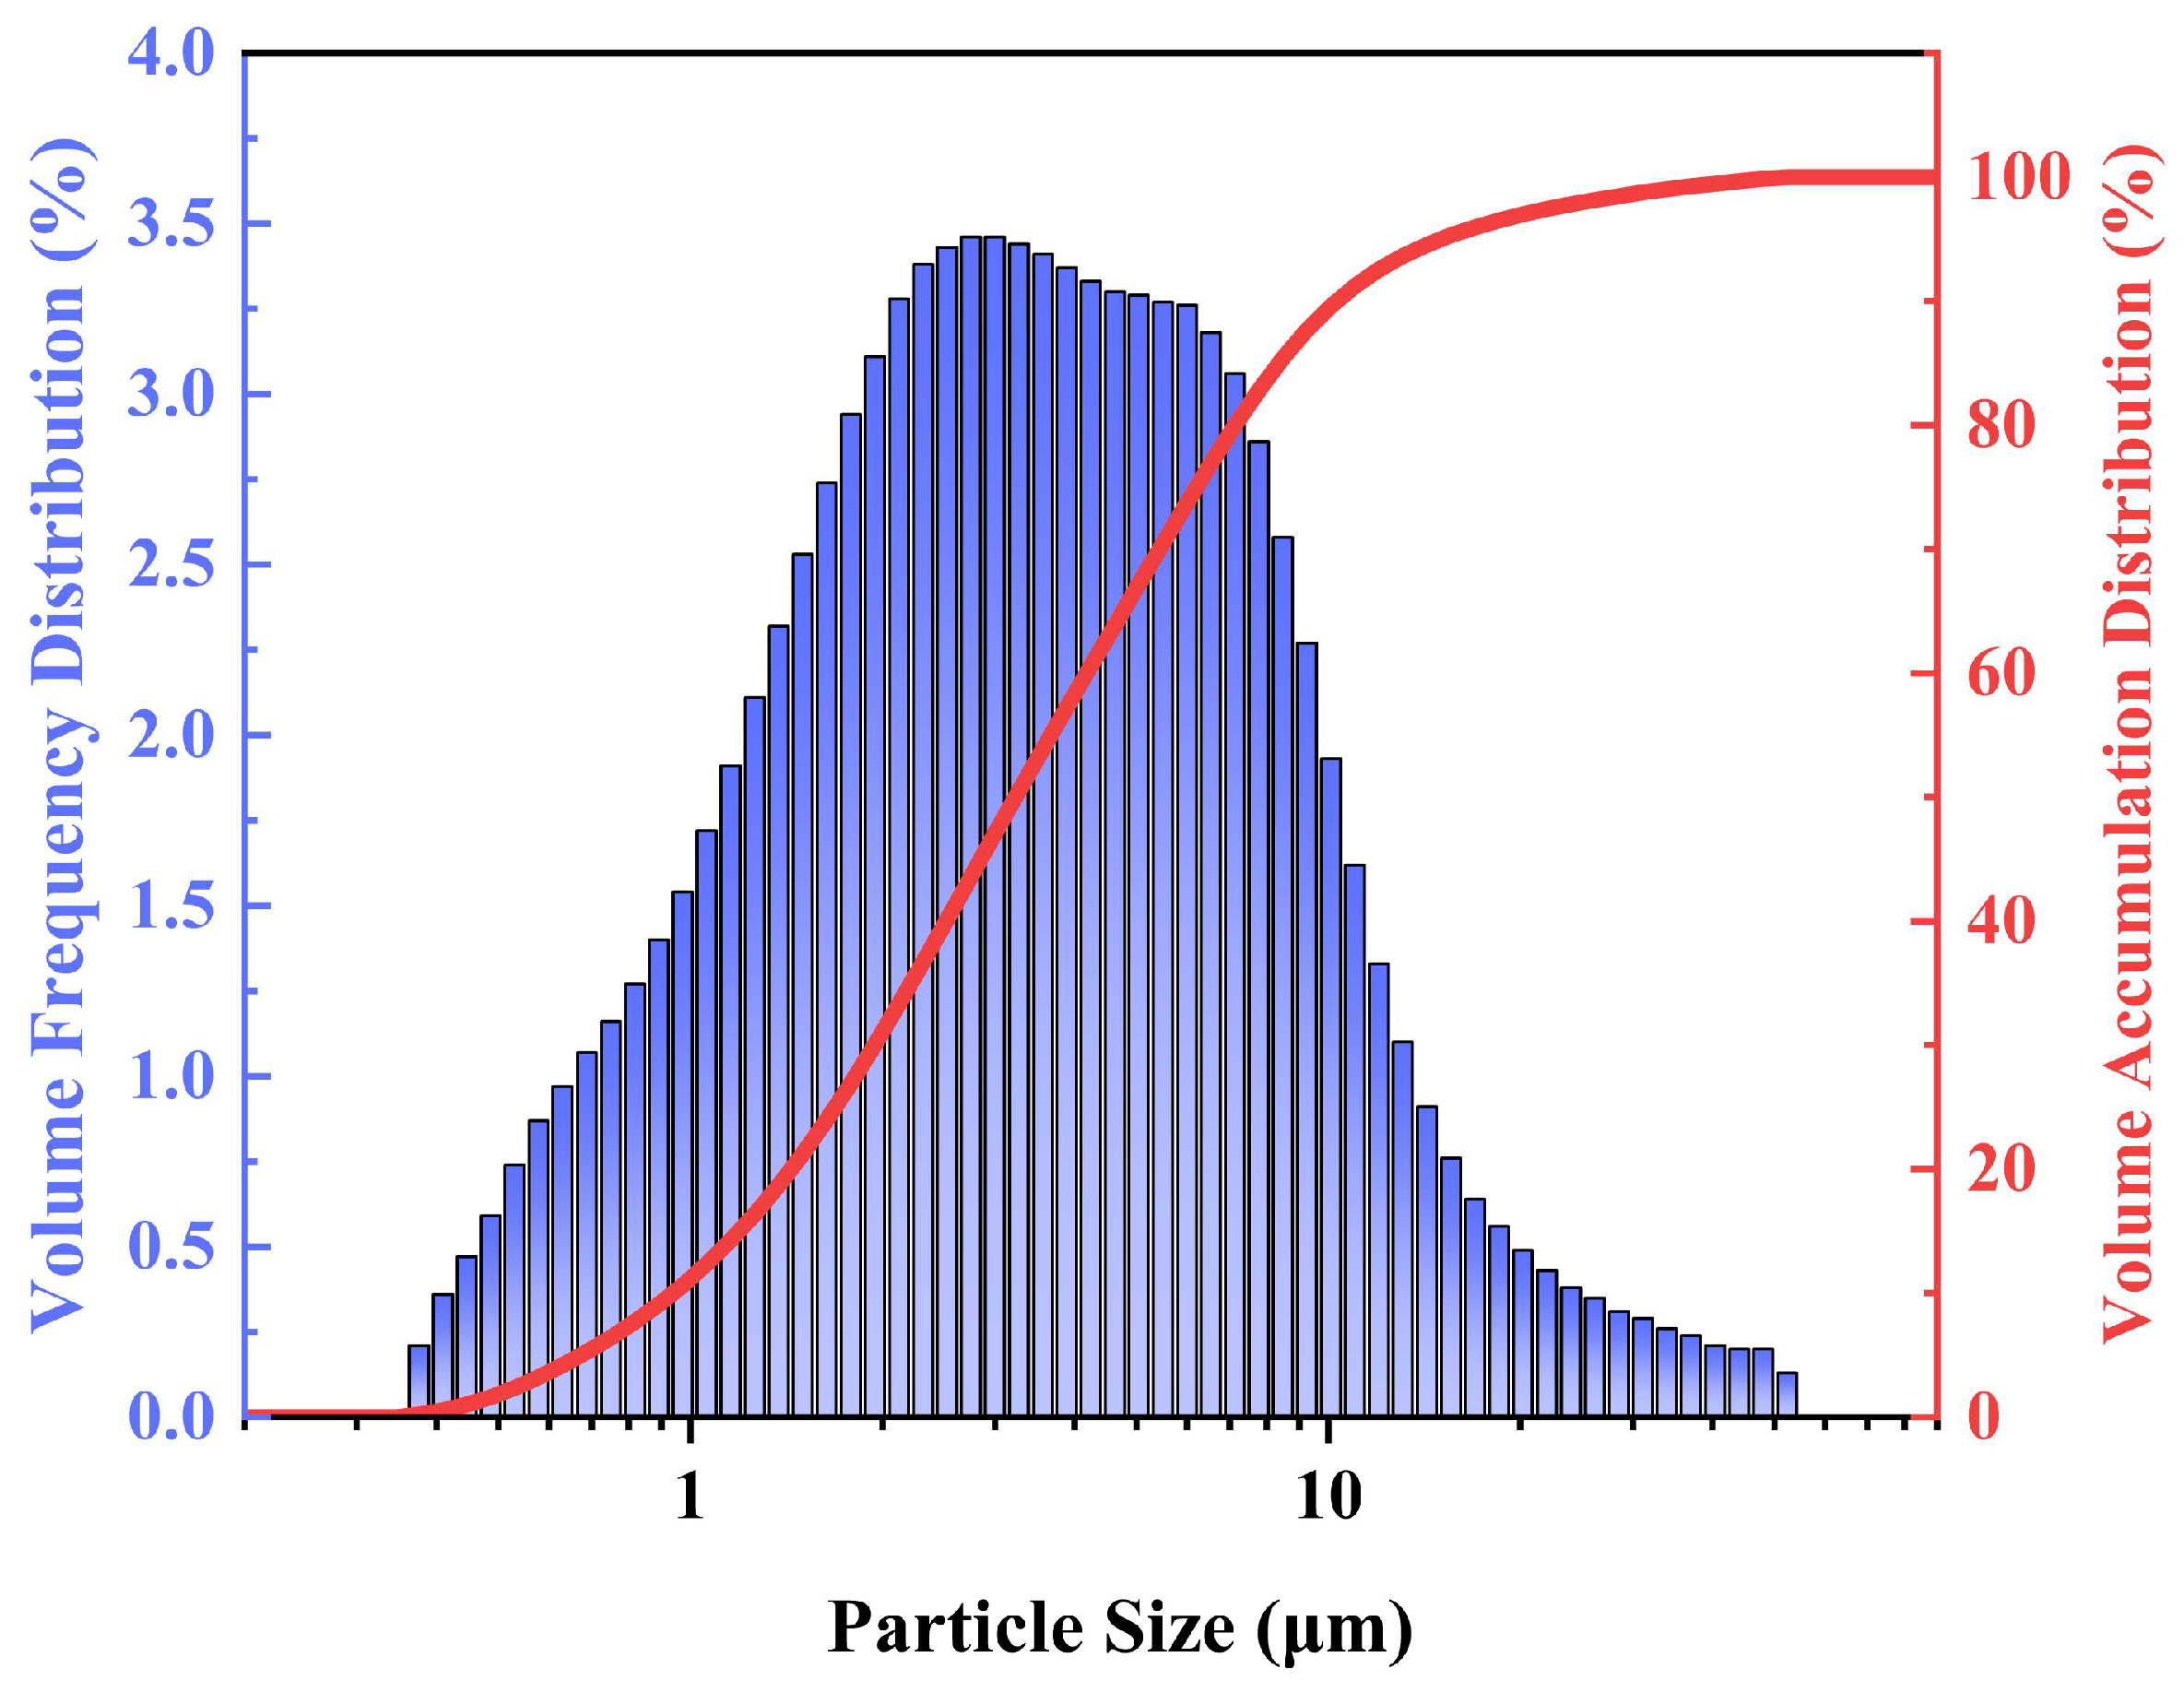
| Particle Size Distribution Ratio | D10 | D20 | D30 | D40 | D50 | D60 | D70 | D80 | D90 | D95 | Mz |
|---|---|---|---|---|---|---|---|---|---|---|---|
| Particle size/µm | 0.938 | 1.438 | 1.943 | 2.541 | 3.23 | 4.18 | 5.44 | 7.14 | 10.3 | 15 | 4.19 |
| No. | Model | Model Expression |
|---|---|---|
| 1 | Page | |
| 2 | Lewis | |
| 3 | Wang and Singh | |
| 4 | Quadratic |
| Statistical Indicators | Equations |
|---|---|
| slimming coefficient | |
| residual sum of squares | |
| F-Value |
| Model | Params | R2 | RSS | F-Value |
|---|---|---|---|---|
| Page | k = 1.34012 × 10⁻⁴ n = 1.87167 | 0.99117 | 0.01233 | 1139.59521 |
| Lewis | k = 0.61636 | −0.44709 | 2.02034 | 1.38423 × 10⁻⁷ |
| Wang and Singh | a = −0.00592 b = 8.34054 × 10⁻⁶ | 0.93963 | 0.08428 | 160.80051 |
| Quadratic | a = 1.06336 b = −0.00643 c = 9.20115 × 10⁻⁶ | 0.94357 | 0.07878 | 108.6863 |
| Model | Params | R2 | RSS | F-Value |
|---|---|---|---|---|
| Page | k = 8.09485 × 10⁻⁵ n = 1.91271 | 0.9944 | 0.00822 | 1786.59595 |
| Lewis | k= 0.61636 | −0.67299 | 2.45557 | 9.87034 × 10⁻⁸ |
| Wang and Singh | a = −0.00551 b = 7.48395 × 10⁻⁶ | 0.95554 | 0.06526 | 219.75131 |
| Quadratic | a = 1.19557 b = −0.0073 c = 1.09222 × 10⁻⁵ | 0.98555 | 0.02121 | 375.17481 |
| Model | Params | R2 | RSS | F-Value |
|---|---|---|---|---|
| Page | k = 7.85963 × 10⁻⁵ n = 1.92866 | 0.9965 | 0.00529 | 2907.07712 |
| Lewis | k = 0.61636 | −0.56991 | 2.373341 | 1.09979 × 10⁻⁷ |
| Wang and Singh | a = −0.00559 b = 7.63484 × 10⁻⁶ | 0.95834 | 0.06299 | 238.41688 |
| Quadratic | a = 1.16422 b = −0.007 c = 1.01621 × 10⁻⁵ | 0.98082 | 0.029 | 306.8248 |
| Condition | Params | R2 | RSS | F-Value | |
|---|---|---|---|---|---|
| Microwave heating power | 160 W | k = 2.28837 × 10⁻⁵ n = 1.75036 | 0.99763 | 0.00891 | 15,116.38519 |
| 320 W | k = 5.76718 × 10⁻⁵ n = 1.82929 | 0.9971 | 0.00644 | 5620.87119 | |
| 480 W | k = 1.34012 × 10⁻⁴ n = 1.87167 | 0.99117 | 0.01233 | 1139.59521 | |
| 640 W | k = 1.07697 × 10⁻⁴ n = 1.98482 | 0.98746 | 0.0154 | 715.01768 | |
| 800 W | k = 1.56908 × 10⁻⁴ n = 1.91609 | 0.98269 | 0.02051 | 513.26985 | |
| Moisture content | 3.25% | k = 8.09485 × 10⁻⁵ n = 1.91271 | 0.9944 | 0.00822 | 1786.59595 |
| 6.55% | k = 3.40842 × 10⁻⁵ n = 2.15056 | 0.99572 | 0.00574 | 1874.06956 | |
| 8.15% | k = 3.72183 × 10⁻⁵ n = 2.15197 | 0.99637 | 0.00452 | 2025.6383 | |
| 9.75% | k = 5.95382 × 10⁻⁵ n = 2.04029 | 0.99566 | 0.00558 | 1855.28185 | |
| 11.35% | k = 5.37631 × 10⁻⁵ n = 2.10929 | 0.99196 | 0.00957 | 870.83348 | |
| Mass | 10 g | k = 7.85963 × 10⁻⁵ n = 1.92866 | 0.9965 | 0.00529 | 2907.07712 |
| 15 g | k = 6.82384 × 10⁻⁵ n = 1.98976 | 0.99511 | 0.00694 | 1895.00272 | |
| 20 g | k = 1.34012 × 10⁻⁴ n = 1.87167 | 0.99117 | 0.01233 | 1139.59521 | |
| 25 g | k = 6.04899 × 10⁻⁵ n = 2.07446 | 0.99423 | 0.00714 | 1318.63153 | |
| 30 g | k = 5.17039 × 10⁻⁵ n = 2.19605 | 0.98961 | 001151 | 665.16048 |
| Microwave Heating Powder (W) | De (10−12 m2/s) | Moisture Content (%) | De (10−12 m2/s) | Mass (g) | De (10−12 m2/s) |
|---|---|---|---|---|---|
| 160 | 1.89056 | 3.25 | 5.18777 | 10 | 5.84803 |
| 320 | 3.87545 | 6.55 | 8.04206 | 15 | 6.1679 |
| 480 | 5.87673 | 8.15 | 8.1815 | 20 | 5.87673 |
| 640 | 5.81932 | 9.75 | 7.06192 | 25 | 8.07487 |
| 800 | 6.18021 | 11.35 | 8.94838 | 30 | 8.63671 |
Disclaimer/Publisher’s Note: The statements, opinions and data contained in all publications are solely those of the individual author(s) and contributor(s) and not of MDPI and/or the editor(s). MDPI and/or the editor(s) disclaim responsibility for any injury to people or property resulting from any ideas, methods, instructions or products referred to in the content. |
© 2023 by the authors. Licensee MDPI, Basel, Switzerland. This article is an open access article distributed under the terms and conditions of the Creative Commons Attribution (CC BY) license (https://creativecommons.org/licenses/by/4.0/).
Share and Cite
Tian, C.; Zhou, J.; Ren, C.; Omran, M.; Zhang, F.; Tang, J. Drying Kinetics of Microwave-Assisted Drying of Leaching Residues from Hydrometallurgy of Zinc. Materials 2023, 16, 5546. https://doi.org/10.3390/ma16165546
Tian C, Zhou J, Ren C, Omran M, Zhang F, Tang J. Drying Kinetics of Microwave-Assisted Drying of Leaching Residues from Hydrometallurgy of Zinc. Materials. 2023; 16(16):5546. https://doi.org/10.3390/ma16165546
Chicago/Turabian StyleTian, Chunlan, Ju Zhou, Chunxiao Ren, Mamdouh Omran, Fan Zhang, and Ju Tang. 2023. "Drying Kinetics of Microwave-Assisted Drying of Leaching Residues from Hydrometallurgy of Zinc" Materials 16, no. 16: 5546. https://doi.org/10.3390/ma16165546