
(Sub)structure Development in Gradually Swaged Electroconductive Bars


Abstract
:1. Introduction
2. Materials and Methods
3. Results
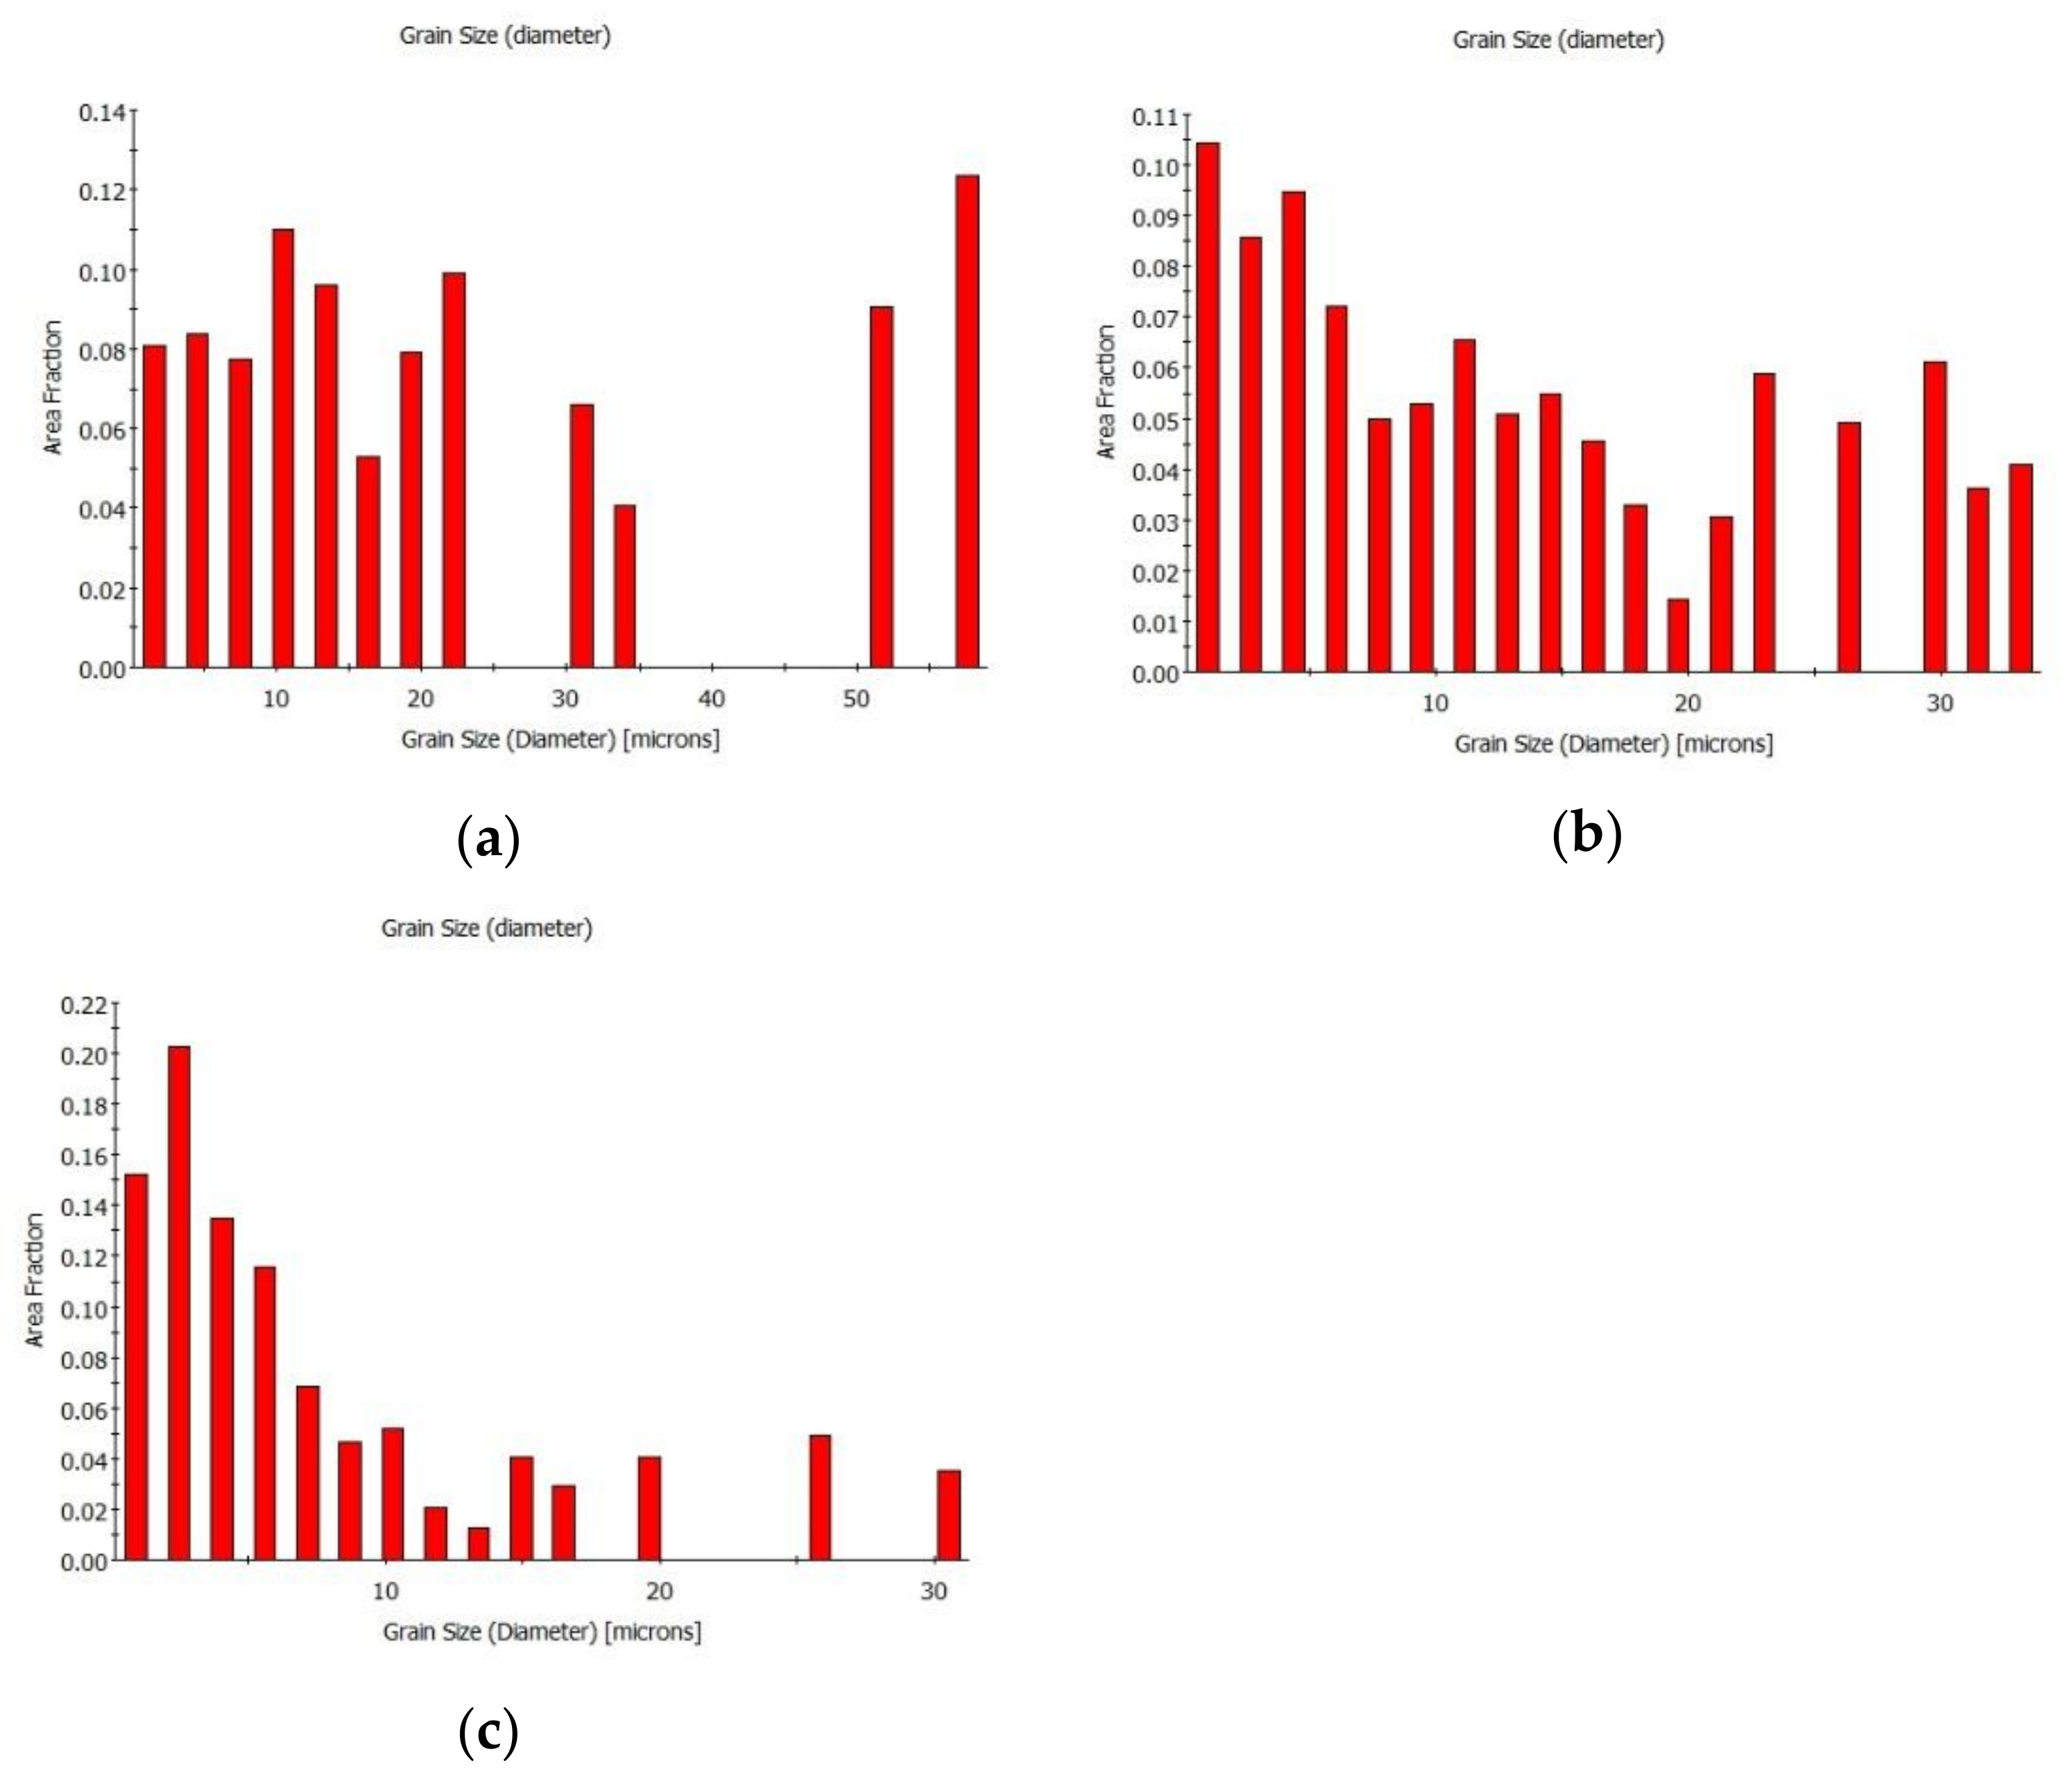
3.1. Grain Size
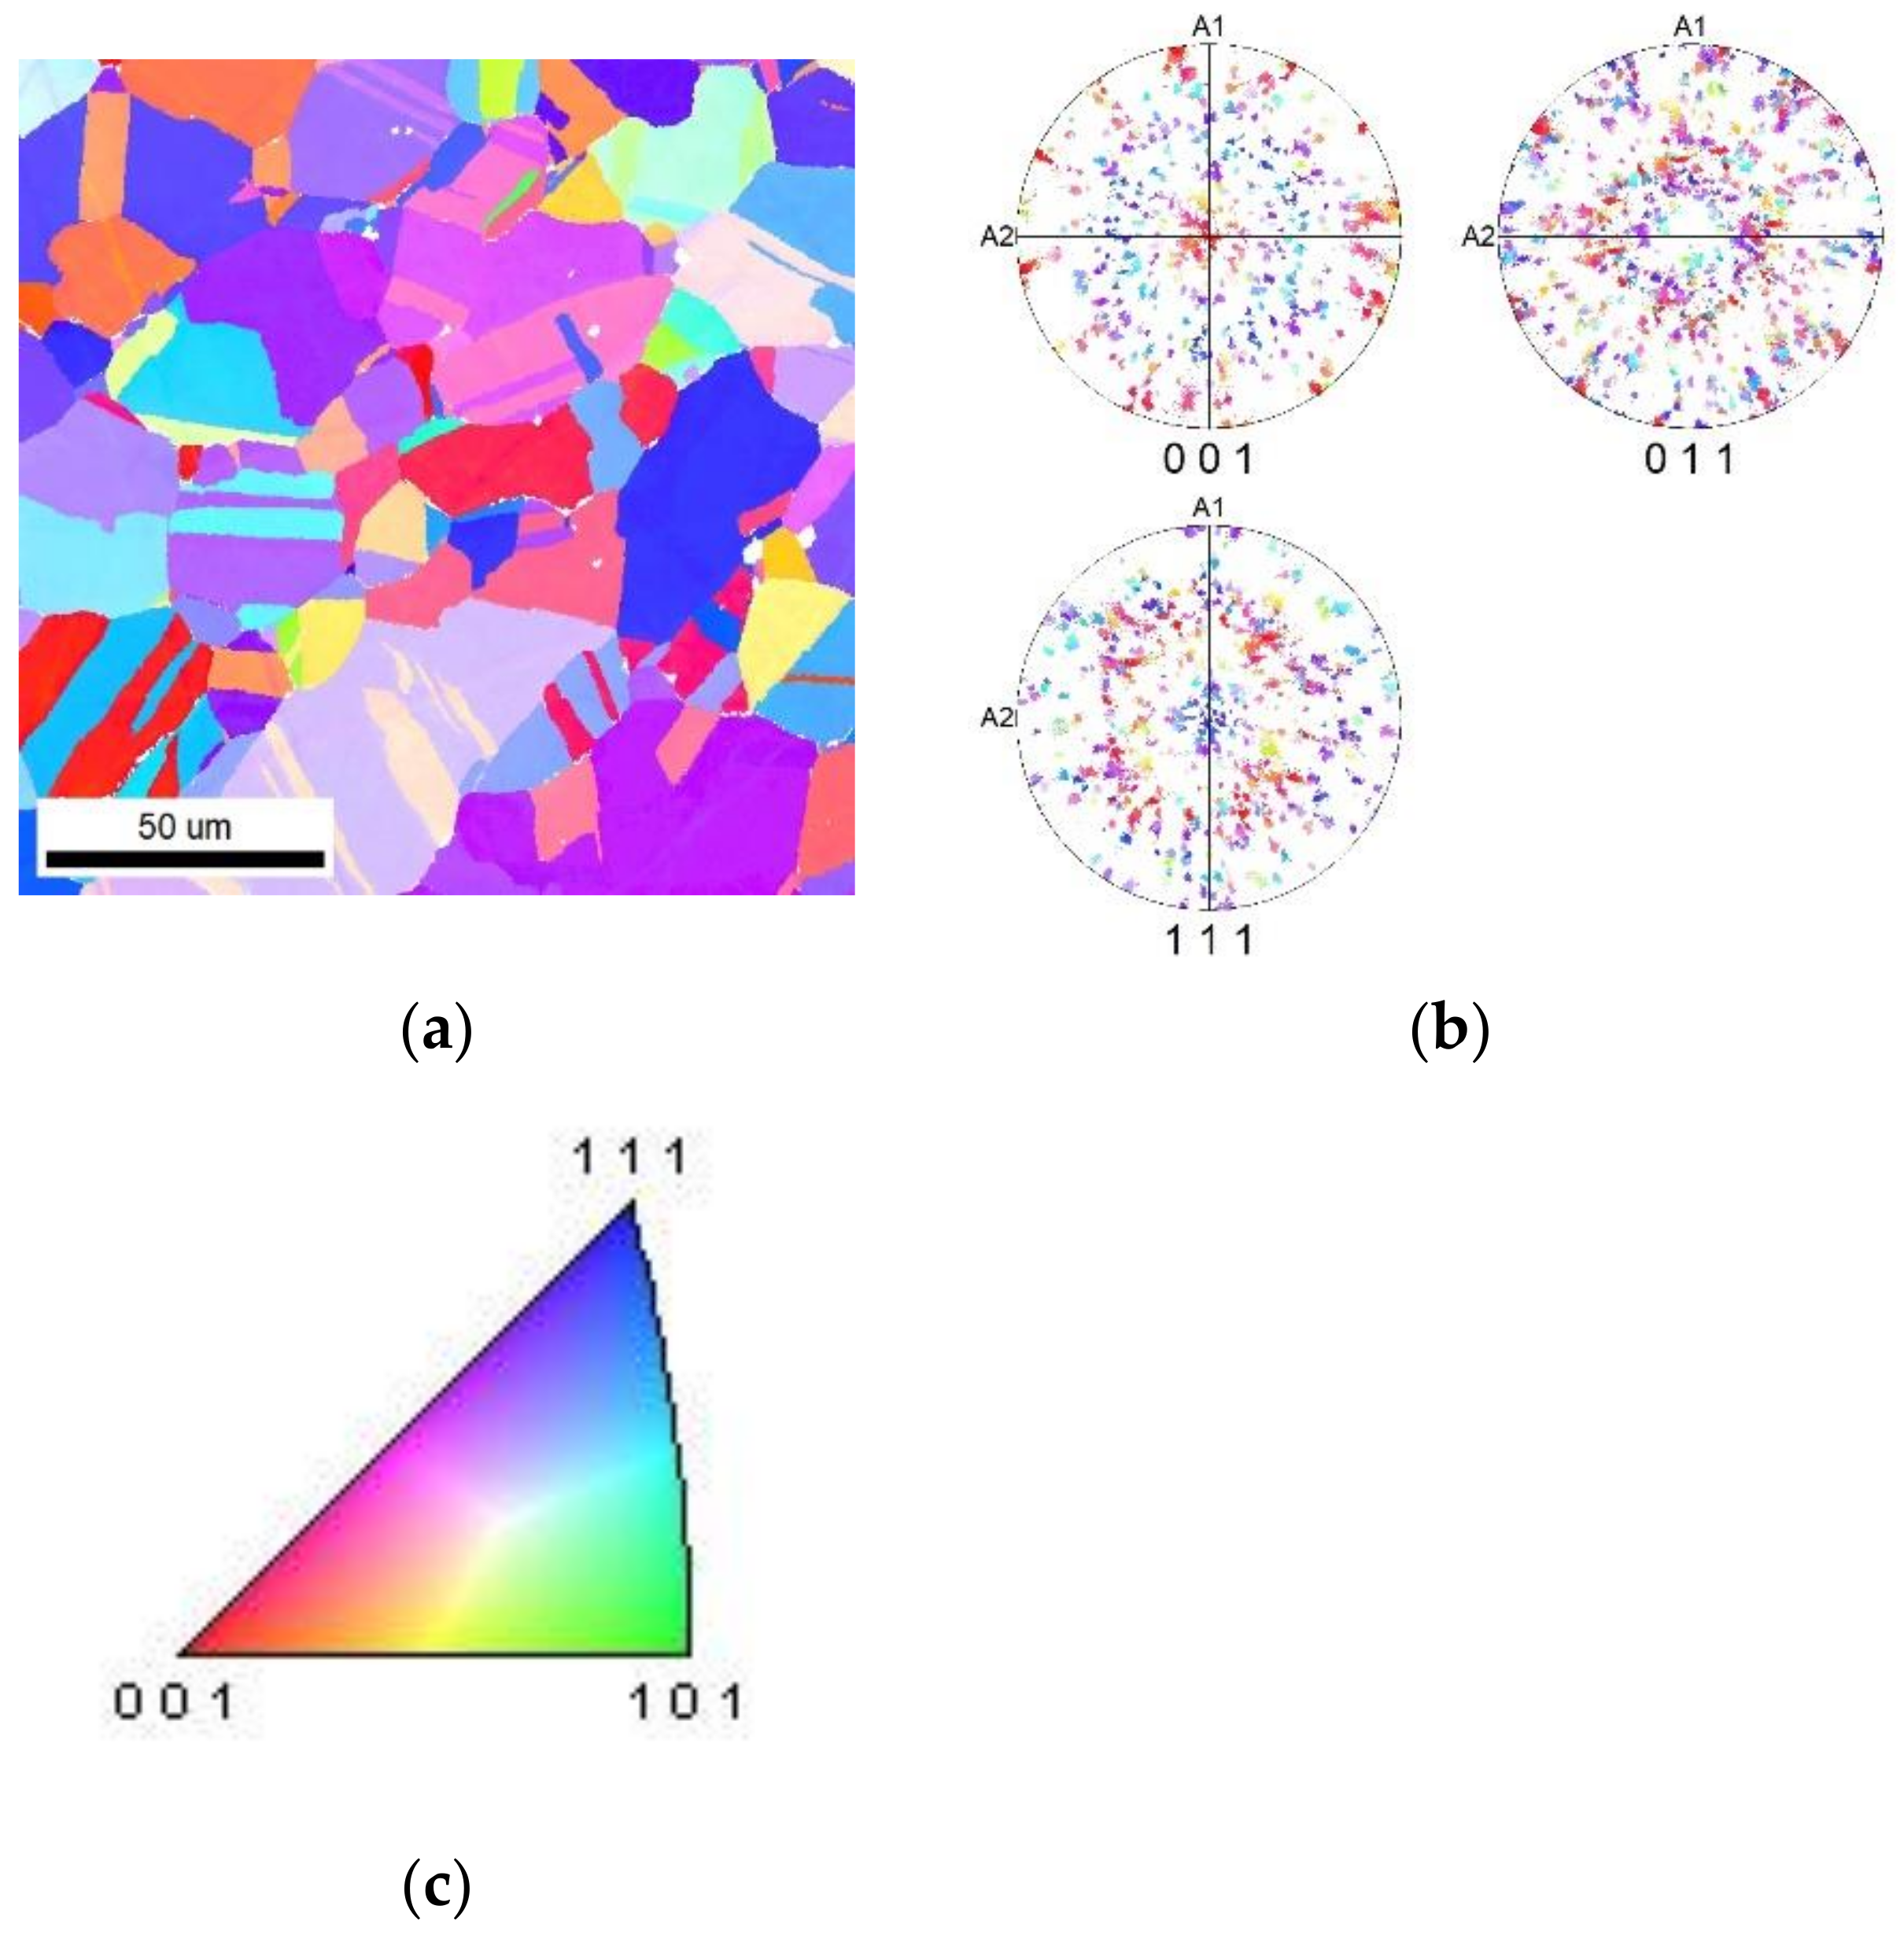
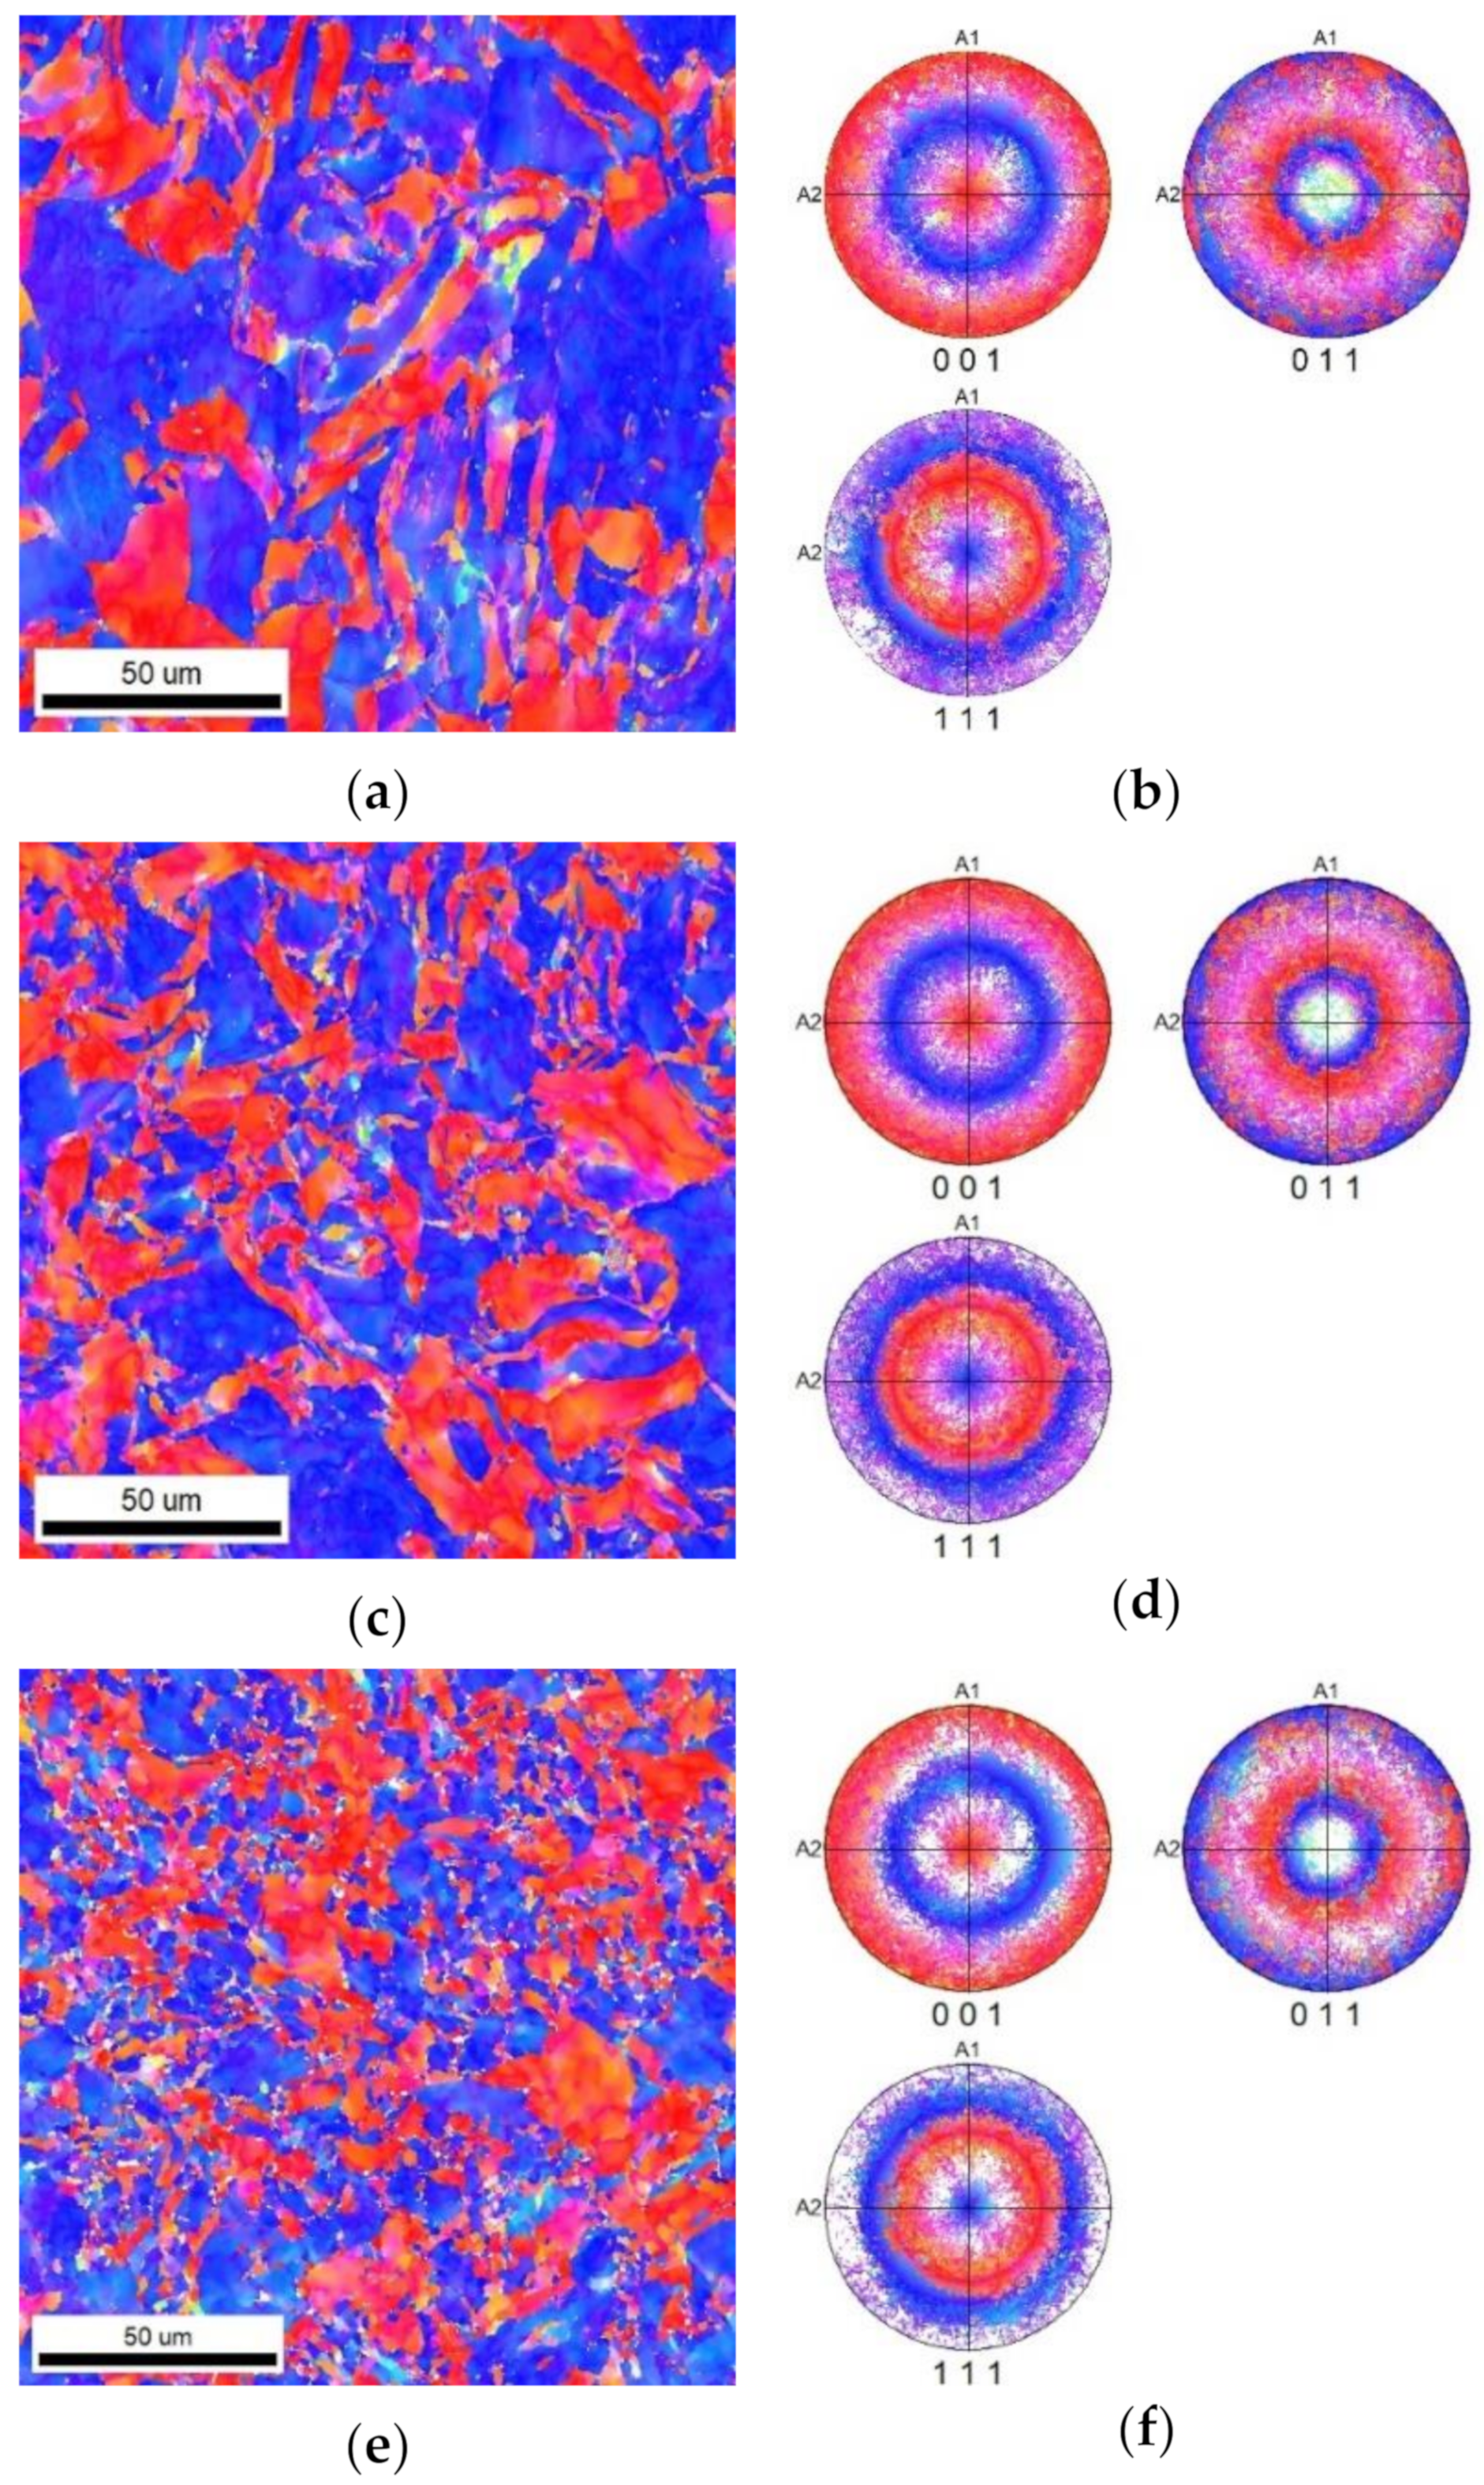
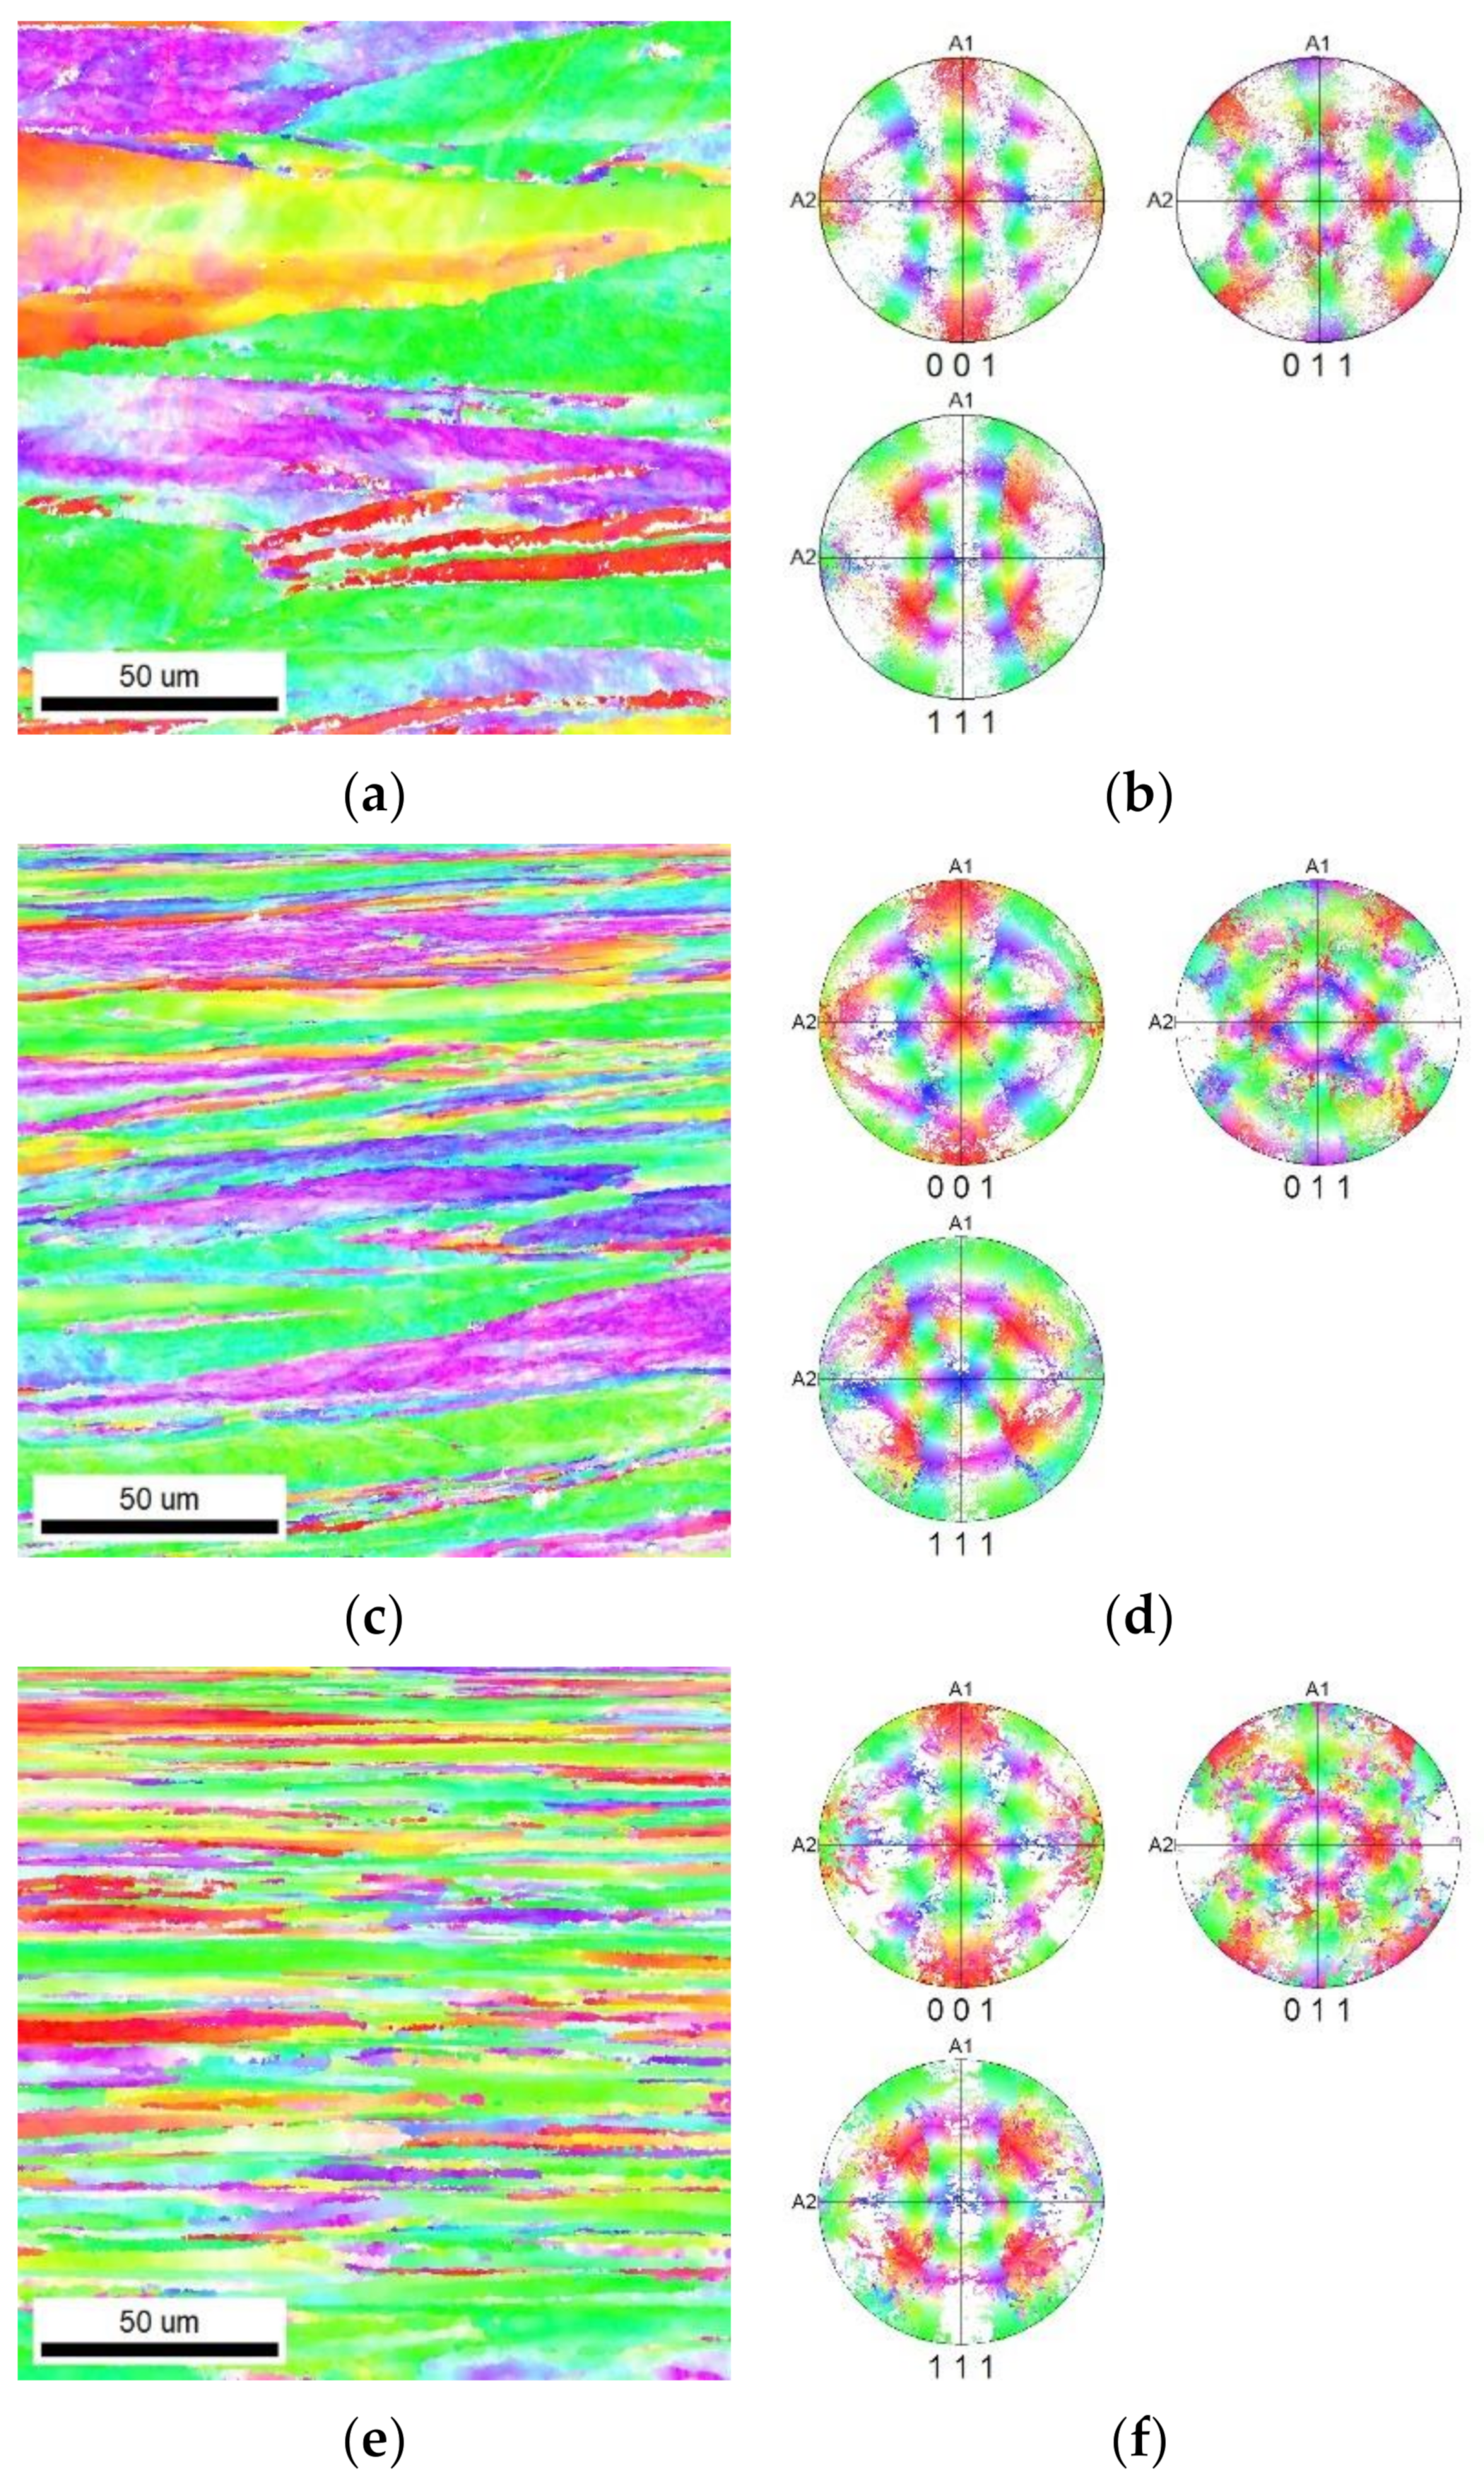
3.2. Orientations of Grains
3.3. Electrical Conductivity
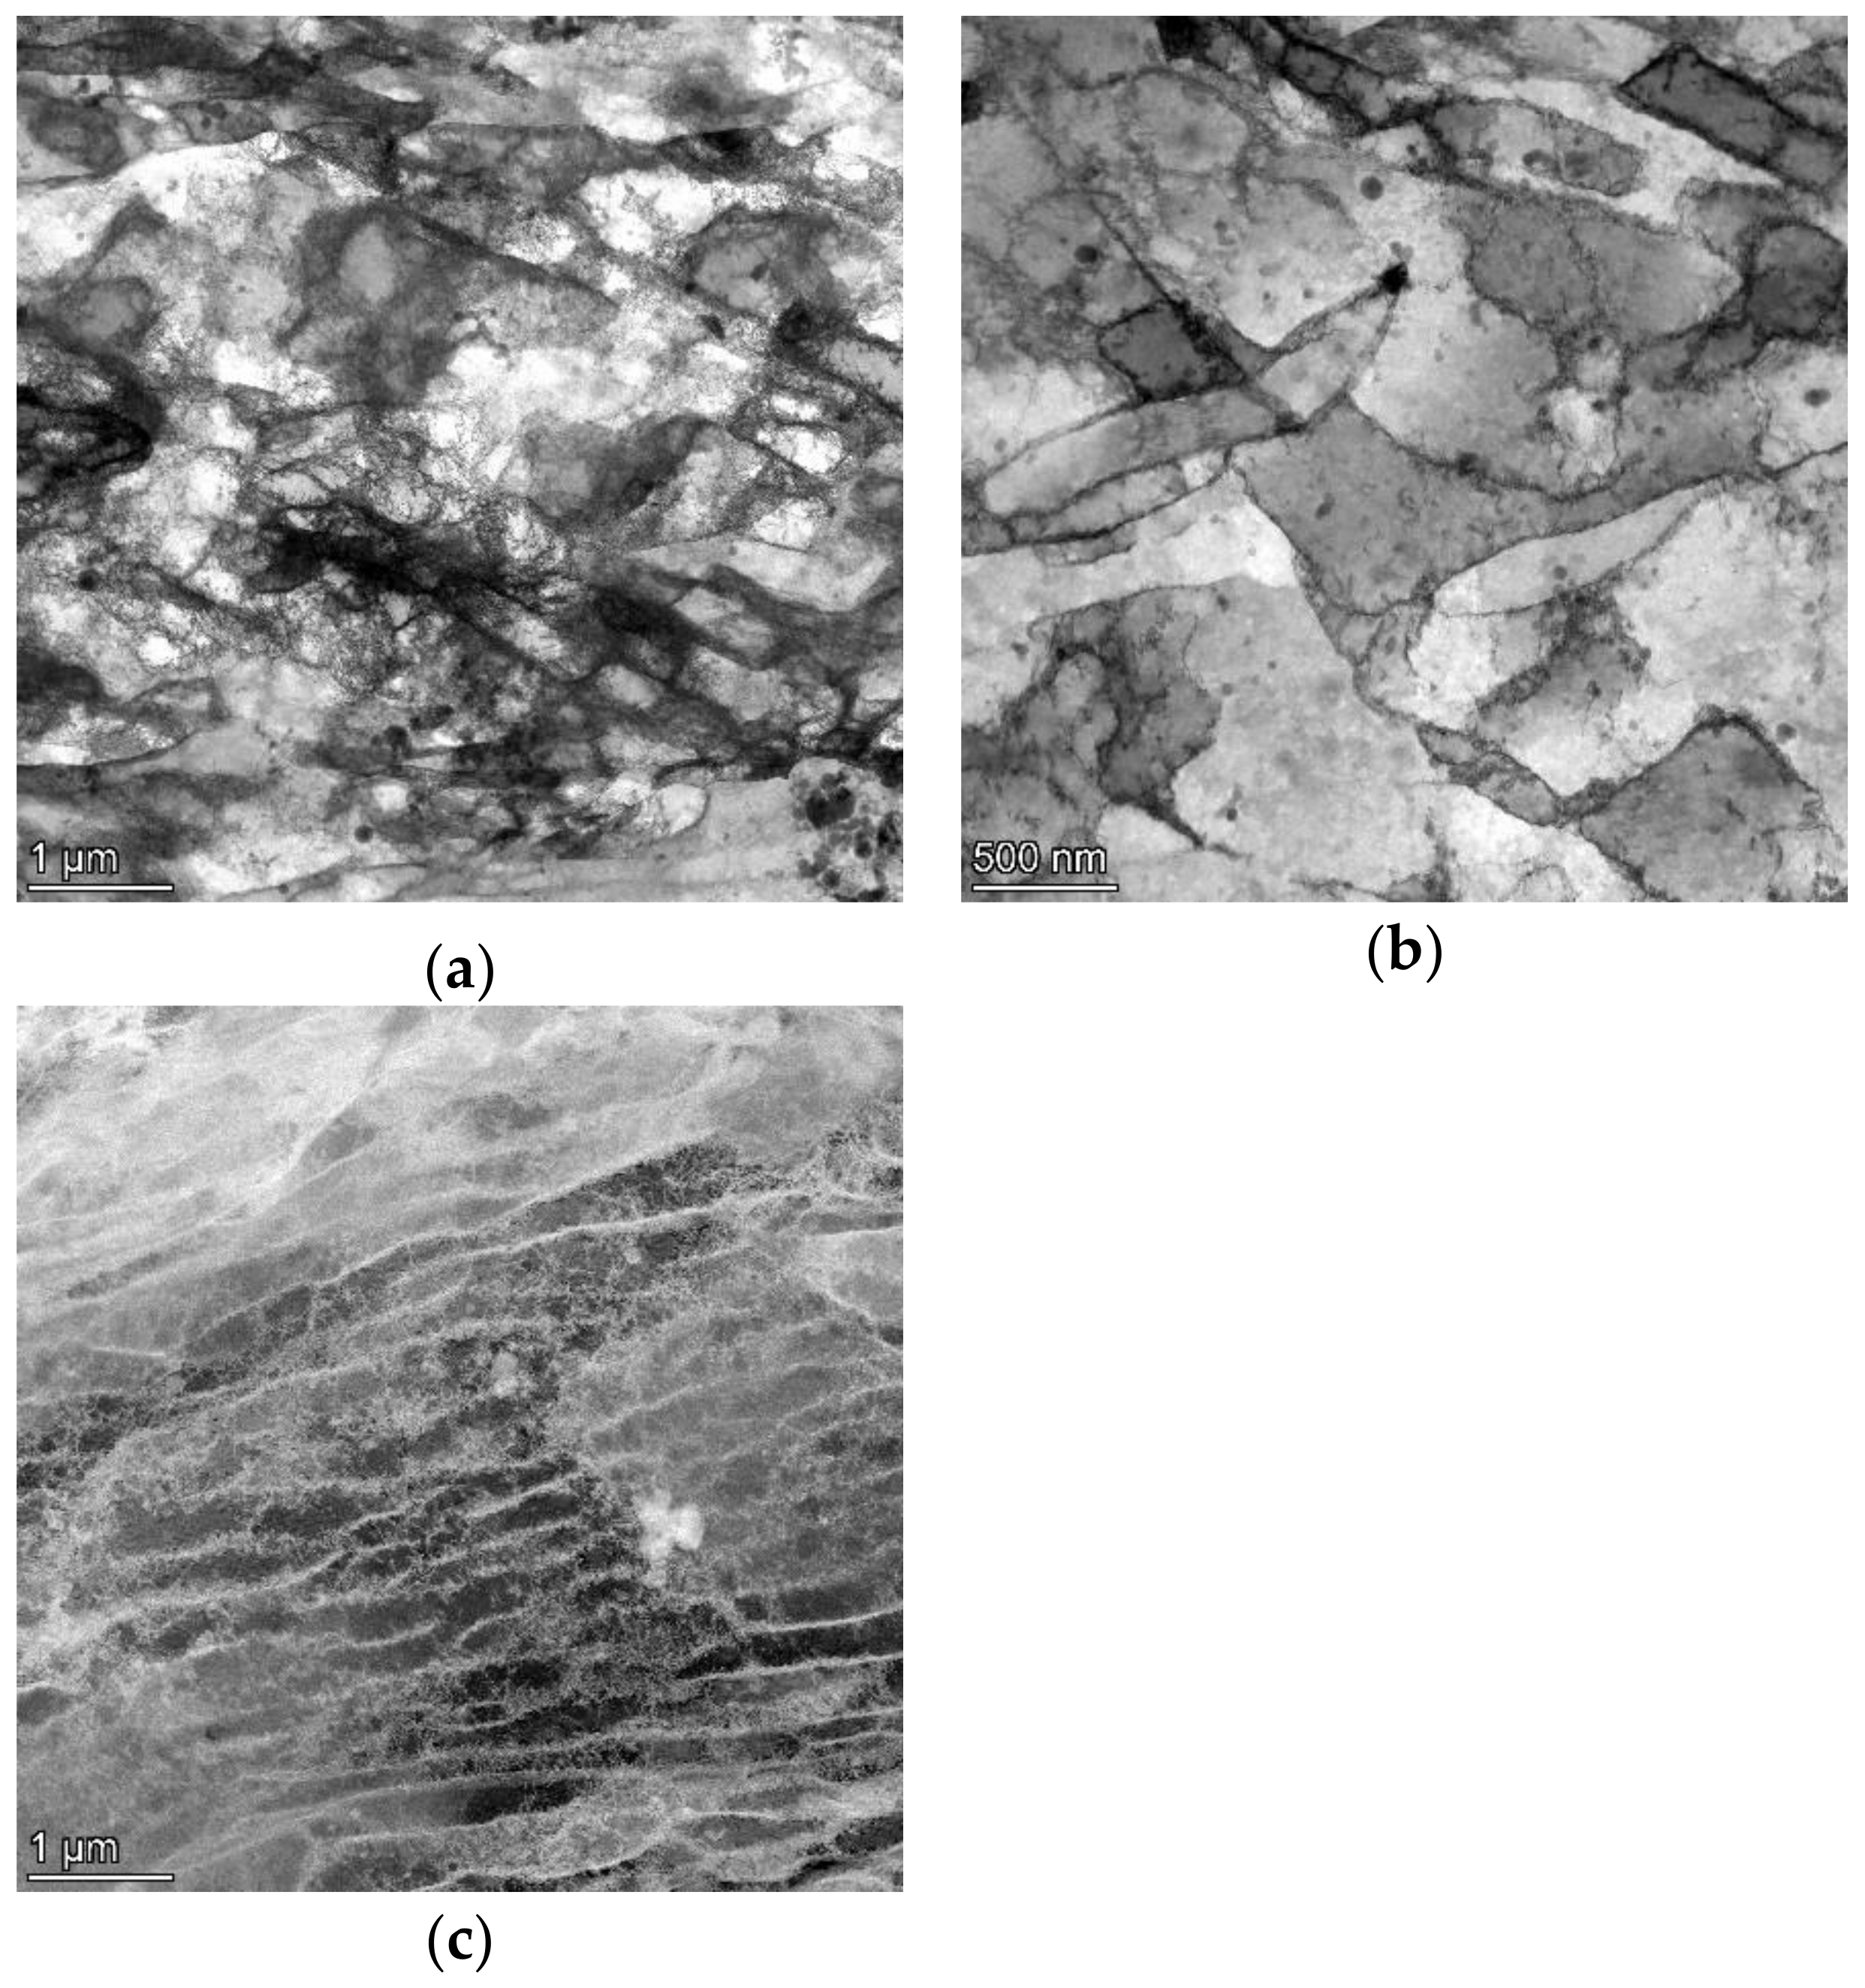
3.4. Substructure
4. Discussion
5. Conclusions
Author Contributions
Funding
Institutional Review Board Statement
Informed Consent Statement
Data Availability Statement
Conflicts of Interest
References
- Wang, Z.; Chen, J.; Kocich, R.; Tardif, S.; Dolbnya, I.P.; Kunčická, L.; Micha, J.-S.; Liogas, K.; Magdysyuk, O.V.; Szurman, I.; et al. Grain Structure Engineering of NiTi Shape Memory Alloys by Intensive Plastic Deformation. ACS Appl. Mater. Interfaces 2022, 14, 31396–31410. [Google Scholar] [CrossRef] [PubMed]
- Wang, Z.; Chen, J.; Besnard, C.; Kunčická, L.; Kocich, R.; Korsunsky, A.M. In Situ Neutron Diffraction Investigation of Texture-Dependent Shape Memory Effect in a near Equiatomic NiTi Alloy. Acta Mater. 2021, 202, 135–148. [Google Scholar] [CrossRef]
- Baron, A.A.; Bevza, V.F.; Grusha, V.P.; Gurulev, D.N.; Palatkina, L.V. Structure and Properties of the Hollow Cast Iron Castings Formed by Continuous Cyclic Freeze Casting. Russ. Metall. 2021, 2021, 297–301. [Google Scholar] [CrossRef]
- Wu, M.; Yang, J.; Huang, F.; Hua, L.; Xiong, S. Bonding of Cast Iron-Aluminum in Bimetallic Castings by High-Pressure Die Casting Process. Int. J. Adv. Manuf. Technol. 2022, 120, 537–549. [Google Scholar] [CrossRef]
- Chlupová, A.; Šulák, I.; Kunčická, L.; Kocich, R.; Svoboda, J. Microstructural Aspects of New Grade ODS Alloy Consolidated by Rotary Swaging. Mater. Charact. 2021, 181, 111477. [Google Scholar] [CrossRef]
- Michalcová, A.; Özkan, M.; Mikula, P.; Marek, I.; Knaislová, A.; Kopeček, J.; Vojtěch, D. The Influence of Powder Milling on Properties of SPS Compacted FeAl. Molecules 2020, 25, 2263. [Google Scholar] [CrossRef]
- Johnson, J.L. Enhanced Sintering of Tungsten. Int. J. Refract. Met. Hard Mater. 2023, 110, 106017. [Google Scholar] [CrossRef]
- de Oro Calderon, R.; Gierl-Mayer, C.; Danninger, H. Thermoanalytical Techniques for Characterizing Sintering Processes in Ferrous Powder Metallurgy. J. Therm. Anal. Calorim. 2023, 148, 1309–1320. [Google Scholar] [CrossRef]
- Lee, J.-H.; Kim, B.-N.; Jang, B.-K. Non-Uniform Sintering Behavior during Spark Plasma Sintering of Y2O3. Ceram. Int. 2020, 46, 4030–4034. [Google Scholar] [CrossRef]
- Gaffin, N.D.; Ang, C.; Milner, J.L.; Palomares, K.B.; Zinkle, S.J. Consolidation Behavior of Mo30W Alloy Using Spark Plasma Sintering. Int. J. Refract. Met. Hard Mater. 2022, 104, 105778. [Google Scholar] [CrossRef]
- Nkhasi, N.; du Preez, W.; Bissett, H. Plasma Spheroidisation of Irregular Ti6Al4V Powder for Powder Bed Fusion. Metals 2021, 11, 1763. [Google Scholar] [CrossRef]
- Speidel, A.; Gargalis, L.; Ye, J.; Matthews, M.J.; Spierings, A.; Hague, R.; Clare, A.T.; Murray, J.W. Chemical Recovery of Spent Copper Powder in Laser Powder Bed Fusion. Addit. Manuf. 2022, 52, 102711. [Google Scholar] [CrossRef]
- Hedicke-Claus, Y.; Kriwall, M.; Stonis, M.; Behrens, B.-A. Automated Design of Multi-Stage Forging Sequences for Die Forging. Prod. Eng. 2023. [Google Scholar] [CrossRef]
- Dindorf, R.; Wos, P. Energy-Saving Hot Open Die Forging Process of Heavy Steel Forgings on an Industrial Hydraulic Forging Press. Energies 2020, 13, 1620. [Google Scholar] [CrossRef] [Green Version]
- Wei, D.; Min, X.; Hu, X.; Xie, Z.; Fang, F. Microstructure and Mechanical Properties of Cold Drawn Pearlitic Steel Wires: Effects of Drawing-Induced Heating. Mater. Sci. Eng. A 2020, 784, 139341. [Google Scholar] [CrossRef]
- El Amine, K.; Larsson, J.; Pejryd, L. Experimental Comparison of Roller Die and Conventional Wire Drawing. J. Mater. Process. Technol. 2018, 257, 7–14. [Google Scholar] [CrossRef]
- Lukáč, P.; Kocich, R.; Greger, M.; Padalka, O.; Szaraz, Z. Microstructure of AZ31 and AZ61 Mg Alloys Prepared by Rolling and ECAP. Kov. Mater. Mater. 2007, 45, 115–120. [Google Scholar]
- Gimaletdinov, R.H.; Gulakov, A.A.; Tukhvatulin, I.H.; Petrov, A.V.; Filippov, V.S. Development of Sheet Rolling Roll Production from Advanced Materials in the Kushva Rolling Roll Plant. Metallurgist 2021, 65, 160–168. [Google Scholar] [CrossRef]
- Čapek, J.; Kadeřávek, L.; Pinc, J.; Kopeček, J.; Klimša, L. Influence of the Microstructure of the Initial Material on the Zn Wires Prepared by Direct Extrusion with a Huge Extrusion Ratio. Metals 2021, 11, 787. [Google Scholar] [CrossRef]
- Reza-E-Rabby, M.; Wang, T.; Canfield, N.; Roosendaal, T.; Taysom, B.S.; Graff, D.; Herling, D.; Whalen, S. Effect of Various Post-Extrusion Tempering on Performance of AA2024 Tubes Fabricated by Shear Assisted Processing and Extrusion. CIRP J. Manuf. Sci. Technol. 2022, 37, 454–463. [Google Scholar] [CrossRef]
- Kopeček, J.; Staněk, J.; Habr, S.; Seitl, F.; Petrich, L.; Schmidt, V.; Beneš, V. Analysis of Polycrystalline Microstructure of AlMgSc Alloy Observed by 3D EBSD. Image Anal. Stereol. 2020, 39. [Google Scholar] [CrossRef] [Green Version]
- Kunčická, L.; Kocich, R.; Král, P.; Pohludka, M.; Marek, M. Effect of Strain Path on Severely Deformed Aluminium. Mater. Lett. 2016, 180, 280–283. [Google Scholar] [CrossRef]
- Jamili, A.M.; Zarei-Hanzaki, A.; Abedi, H.R.; Mosayebi, M.; Kocich, R.; Kunčická, L. Development of Fresh and Fully Recrystallized Microstructures through Friction Stir Processing of a Rare Earth Bearing Magnesium Alloy. Mater. Sci. Eng. A 2019, 775, 138837. [Google Scholar] [CrossRef]
- Hlaváč, L.M.; Kocich, R.; Gembalová, L.; Jonšta, P.; Hlaváčová, I.M. AWJ Cutting of Copper Processed by ECAP. Int. J. Adv. Manuf. Technol. 2016, 86, 885–894. [Google Scholar] [CrossRef]
- Kunčická, L.; Kocich, R.; Ryukhtin, V.; Cullen, J.C.T.; Lavery, N.P. Study of Structure of Naturally Aged Aluminium after Twist Channel Angular Pressing. Mater. Charact. 2019, 152, 94–100. [Google Scholar] [CrossRef] [Green Version]
- Kocich, R.; Kunčická, L. Development of Structure and Properties in Bimetallic Al/Cu Sandwich Composite during Cumulative Severe Plastic Deformation. J. Sandw. Struct. Mater. 2021, 23, 4252–4275. [Google Scholar] [CrossRef]
- Wu, Y.; Dong, X. Upper Bound Analysis of Forging Penetration in a Radial Forging Process. Int. J. Mech. Sci. 2015, 103, 1–8. [Google Scholar] [CrossRef]
- Yang, X.; Dong, X.; Wu, Y. An Upper Bound Solution of Forging Load in Cold Radial Forging Process of Rectangular Cross-Section Billet. Int. J. Adv. Manuf. Technol. 2017, 92, 2765–2776. [Google Scholar] [CrossRef]
- Macháčková, A.; Krátká, L.; Petrmichl, R.; Kunčická, L.; Kocich, R. Affecting Structure Characteristics of Rotary Swaged Tungsten Heavy Alloy Via Variable Deformation Temperature. Materials 2019, 12, 4200. [Google Scholar] [CrossRef] [Green Version]
- Kunčická, L.; Kocich, R.; Strunz, P.; Macháčková, A. Texture and Residual Stress within Rotary Swaged Cu/Al Clad Composites. Mater. Lett. 2018, 230, 88–91. [Google Scholar] [CrossRef]
- Mohan Agarwal, K.; Tyagi, R.K.; Chaubey, V.K.; Dixit, A. Comparison of Different Methods of Severe Plastic Deformation for Grain Refinement. IOP Conf. Ser. Mater. Sci. Eng. 2019, 691, 012074. [Google Scholar] [CrossRef]
- Kunčická, L.; Macháčková, A.; Lavery, N.P.; Kocich, R.; Cullen, J.C.T.; Hlaváč, L.M. Effect of Thermomechanical Processing via Rotary Swaging on Properties and Residual Stress within Tungsten Heavy Alloy. Int. J. Refract. Met. Hard Mater. 2020, 87, 105120. [Google Scholar] [CrossRef]
- Hansen, N.; Huang, X.; Hughes, D.A. Microstructural Evolution and Hardening Parameters. Mater. Sci. Eng. A 2001, 317, 3–11. [Google Scholar] [CrossRef]
- Herrmann, M.; Schenck, C.; Leopold, H.; Kuhfuss, B. Material Improvement of Mild Steel S355J2C by Hot Rotary Swaging. Procedia Manuf. 2020, 47, 282–287. [Google Scholar] [CrossRef]
- Strunz, P.; Kunčická, L.; Beran, P.; Kocich, R.; Hervoches, C. Correlating Microstrain and Activated Slip Systems with Mechanical Properties within Rotary Swaged WNiCo Pseudoalloy. Materials 2020, 13, 208. [Google Scholar] [CrossRef] [Green Version]
- Canelo-Yubero, D.; Kocich, R.; Hervoches, C.; Strunz, P.; Kunčická, L.; Krátká, L. Neutron Diffraction Study of Residual Stresses in a W–Ni–Co Heavy Alloy Processed by Rotary Swaging at Room and High Temperatures. Met. Mater. Int. 2021, 28, 919–930. [Google Scholar] [CrossRef]
- Liu, R.; Xie, Z.M.; Yao, X.; Zhang, T.; Wang, X.P.; Hao, T.; Fang, Q.F.; Liu, C.S. Effects of Swaging and Annealing on the Microstructure and Mechanical Properties of ZrC Dispersion-Strengthened Tungsten. Int. J. Refract. Met. Hard Mater. 2018, 76, 33–40. [Google Scholar] [CrossRef]
- Bochvar, N.R.; Rybalchenko, O.V.; Leonova, N.P.; Tabachkova, N.Y.; Rybalchenko, G.V.; Rokhlin, L.L. Effect of Cold Plastic Deformation and Subsequent Aging on the Strength Properties of Al-Mg2Si Alloys with Combined (Sc + Zr) and (Sc + Hf) Additions. J. Alloys Compd. 2020, 821, 153426. [Google Scholar] [CrossRef]
- Görtan, M.O.; Groche, P. Tool Design Guidelines for the Equal Channel Angular Swaging (ECAS) Process. J. Mater. Process. Technol. 2014, 214, 2220–2232. [Google Scholar] [CrossRef]
- Kunčická, L.; Macháčková, A.; Krátká, L.; Kocich, R. Analysis of Deformation Behaviour and Residual Stress in Rotary Swaged Cu/Al Clad Composite Wires. Materials 2019, 12, 3462. [Google Scholar] [CrossRef] [Green Version]
- Kunčická, L.; Kocich, R. Comprehensive Characterisation of a Newly Developed Mg-Dy-Al-Zn-Zr Alloy Structure. Metals 2018, 8, 73. [Google Scholar] [CrossRef] [Green Version]
- Chen, X.; Liu, C.; Jiang, S.; Chen, Z.; Wan, Y. Fabrication of Nanocrystalline High-Strength Magnesium−Lithium Alloy by Rotary Swaging. Adv. Eng. Mater. 2022, 24, 2100666. [Google Scholar] [CrossRef]
- Lourenço, C.J.; Souza, L.; Silva, G.; Suzuki, P.A.; Robin, A.L.M.; Nunes, C.A.; Tomachuk, C.R. Effects of Solidification, Rotary Swaging and Recrystallization on the Microstructure, Crystallographic Orientation and Electrochemical Behavior of an Al-4.5 Wt.% Cu Alloy. Int. J. Electrochem. Sci. 2021, 16, 211054. [Google Scholar] [CrossRef]
- Jin, H.; Guan, R.; Tie, D. Mechanical and Conductive Performance of Aged 6xxx Aluminum Alloy during Rotary Swaging. Crystals 2022, 12, 530. [Google Scholar] [CrossRef]
- Kunčická, L.; Kocich, R. Effect of Activated Slip Systems on Dynamic Recrystallization during Rotary Swaging of Electro-Conductive Al-Cu Composites. Mater. Lett. 2022, 321, 10–13. [Google Scholar] [CrossRef]
- Giribaskar, S.; Gouthama; Prasad, R. Ultra-Fine Grained Al-SiC Metal Matrix Composite by Rotary Swaging Process. Mater. Sci. Forum 2011, 702–703, 320–323. [Google Scholar] [CrossRef]
- Panov, D.; Kudryavtsev, E.; Naumov, S.; Klimenko, D.; Chernichenko, R.; Mirontsov, V.; Stepanov, N.; Zherebtsov, S.; Salishchev, G.; Pertcev, A. Gradient Microstructure and Texture Formation in a Metastable Austenitic Stainless Steel during Cold Rotary Swaging. Materials 2023, 16, 1706. [Google Scholar] [CrossRef] [PubMed]
- Mao, Q.; Chen, X.; Li, J.; Zhao, Y. Nano-Gradient Materials Prepared by Rotary Swaging. Nanomaterials 2021, 11, 2223. [Google Scholar] [CrossRef]
- Kunčická, L.; Kocich, R.; Benč, M.; Dvořák, J. Affecting Microstructure and Properties of Additively Manufactured AISI 316L Steel by Rotary Swaging. Materials 2022, 15, 6291. [Google Scholar] [CrossRef]
- Kunčická, L.; Kocich, R.; Németh, G.; Dvořák, K.; Pagáč, M. Effect of Post Process Shear Straining on Structure and Mechanical Properties of 316 L Stainless Steel Manufactured via Powder Bed Fusion. Addit. Manuf. 2022, 59, 103128. [Google Scholar] [CrossRef]
- Russell, A.; Lee, K.L. Structure-Property Relations in Nonferrous Metals, 1st ed.; John Wiley & Sons, Inc.: Hoboken, NJ, USA, 2005; ISBN 978-0-471-64952-6. [Google Scholar]
- Bahador, A.; Umeda, J.; Hamzah, E.; Yusof, F.; Li, X.; Kondoh, K. Synergistic Strengthening Mechanisms of Copper Matrix Composites with TiO2 Nanoparticles. Mater. Sci. Eng. A 2020, 772, 138797. [Google Scholar] [CrossRef]
- Zhao, Y.; Peng, X.; Fu, T.; Zhu, X.; Hu, N.; Yan, C. Strengthening Mechanisms of Graphene Coated Copper under Nanoindentation. Comput. Mater. Sci. 2018, 144, 42–49. [Google Scholar] [CrossRef]
- Zhou, M.; Geng, Y.; Zhang, Y.; Ban, Y.; Li, X.; Jia, Y.; Liang, S.; Tian, B.; Liu, Y.; Volinsky, A.A. Enhanced Mechanical Properties and High Electrical Conductivity of Copper Alloy via Dual-Nanoprecipitation. Mater. Charact. 2023, 195, 112494. [Google Scholar] [CrossRef]
- Wu, J.; Li, Z.; Luo, Y.; Gao, Z.; Li, Y.; Zhao, Y.; Liao, Y.; Wu, C.; Jin, M. Influence of Synergistic Strengthening Effect of B4C and TiC on Tribological Behavior of Copper-Based Powder Metallurgy. Ceram. Int. 2023, 49, 2978–2990. [Google Scholar] [CrossRef]
- Kunčická, L.; Kocich, R. Optimizing Electric Conductivity of Innovative Al-Cu Laminated Composites via Thermomechanical Treatment. Mater. Des. 2022, 215, 110441. [Google Scholar] [CrossRef]
- Zhang, Q.; Jin, K.; Mu, D.; Zhang, Y.; Li, Y. Energy-Controlled Rotary Swaging Process for Tube Workpiece. Int. J. Adv. Manuf. Technol. 2015, 80, 2015–2026. [Google Scholar] [CrossRef]
- Humphreys, F.J.; Hetherly, M.; Rollett, A.; Rohrer, G.S. Recrystallization and Related Annealing Phenomena, 2nd ed.; Elsevier Ltd.: Oxford, UK, 2004; ISBN 008-044164-5. [Google Scholar]
- Otto, F.; Frenzel, J.; Eggeler, G. On the Evolution of Microstructure in Oxygen-Free High Conductivity Copper during Thermo-Mechanical Processing Using Rotary Swaging. Int. J. Mater. Res. 2011, 102, 363–370. [Google Scholar] [CrossRef]
- Tian, W.; Zhang, F.; Han, S.; Chen, X.; Gao, P.; Zheng, K. Analysis of Microstructure and Properties in Cold Rotary Swaged Copper-Clad Magnesium Wires. Metals 2023, 13, 467. [Google Scholar] [CrossRef]
- Verlinden, B.; Driver, J.; Samajdar, I.; Doherty, R.D. Thermo-Mechanical Processing of Metallic Materials; Elsevier: Amsterdam, The Netherlands, 2007; ISBN 9780080444970. [Google Scholar]
- Mao, Q.; Zhang, Y.; Guo, Y.; Zhao, Y. Enhanced Electrical Conductivity and Mechanical Properties in Thermally Stable Fine-Grained Copper Wire. Commun. Mater. 2021, 2, 46. [Google Scholar] [CrossRef]


| Bar Diameter [mm] | 20 | 15 | 10 |
|---|---|---|---|
| Reduction ratio | 1.8 | 2.4 | 3.2 |
| Sample denotation | bar20 | bar15 | bar10 |
| Sample | CP Cu | 20 | 15 | 10 |
|---|---|---|---|---|
| Electric conductivity (% IACS) | 100 | 101.9 | 102.2 | 103.2 |
Disclaimer/Publisher’s Note: The statements, opinions and data contained in all publications are solely those of the individual author(s) and contributor(s) and not of MDPI and/or the editor(s). MDPI and/or the editor(s) disclaim responsibility for any injury to people or property resulting from any ideas, methods, instructions or products referred to in the content. |
© 2023 by the authors. Licensee MDPI, Basel, Switzerland. This article is an open access article distributed under the terms and conditions of the Creative Commons Attribution (CC BY) license (https://creativecommons.org/licenses/by/4.0/).
Share and Cite
Kopeček, J.; Bajtošová, L.; Veřtát, P.; Šimek, D. (Sub)structure Development in Gradually Swaged Electroconductive Bars. Materials 2023, 16, 5324. https://doi.org/10.3390/ma16155324
Kopeček J, Bajtošová L, Veřtát P, Šimek D. (Sub)structure Development in Gradually Swaged Electroconductive Bars. Materials. 2023; 16(15):5324. https://doi.org/10.3390/ma16155324
Chicago/Turabian StyleKopeček, Jaromír, Lucia Bajtošová, Petr Veřtát, and Daniel Šimek. 2023. "(Sub)structure Development in Gradually Swaged Electroconductive Bars" Materials 16, no. 15: 5324. https://doi.org/10.3390/ma16155324