Article

Structural Characterization and Thermoelectric Properties of Br-Doped AgSnm[Sb0.8Bi0.2]Te2+m Systems

by
Daniela Delgado
1,
Silvana Moris
2,
Paulina Valencia-Gálvez
1,
María Luisa López
3,
Inmaculada Álvarez-Serrano
3,
Graeme R. Blake
4,* and
Antonio Galdámez
1,*
1
Departamento de Química, Facultad de Ciencias, Universidad de Chile, Las Palmeras 3425, Santiago 7800003, Chile
2
Centro de Investigación de Estudios Avanzados del Maule (CIEAM), Vicerrectoría de Investigación y Postgrado, Universidad Católica del Maule, Avenida San Miguel 3605, Talca 3480112, Chile
3
Departamento de Química Inorgánica, Facultad de Ciencias Químicas, Universidad Complutense, 28040 Madrid, Spain
4
Zernike Institute for Advanced Materials, University of Groningen, Nijenborgh 4, 9747 AG Groningen, The Netherlands
*
Authors to whom correspondence should be addressed.
Materials 2023, 16(15), 5213; https://doi.org/10.3390/ma16155213
Submission received: 30 June 2023 / Revised: 21 July 2023 / Accepted: 22 July 2023 / Published: 25 July 2023
(This article belongs to the Topic Thermoelectric Energy Harvesting)

Abstract

:
Herein, we report the synthesis, structural and microstructural characterization, and thermoelectric properties of AgSnm[Sb0.8Bi0.2]Te2+m and Br-doped telluride systems. These compounds were prepared by solid-state reaction at high temperature. Powder X-ray diffraction data reveal that these samples exhibit crystal structures related to the NaCl-type lattice. The microstructures and morphologies are investigated by scanning electron microscopy, energy-dispersive X-ray spectroscopy (EDS), and high-resolution transmission electron microscopy (HRTEM). Positive values of the Seebeck coefficient (S) indicate that the transport properties are dominated by holes. The S of undoped AgSnm[Sb0.8Bi0.2]Te2+m ranges from +40 to 57 μV·K−1. Br-doped samples with m = 2 show S values of +74 μV·K−1 at RT, and the Seebeck coefficient increases almost linearly with increasing temperature. The total thermal conductivity (κtot) monotonically increases with increasing temperature (10–300 K). The κtot values of undoped AgSnm[Sb0.8Bi0.2]Te2+m are ~1.8 W m−1 K−1 (m = 4) and ~1.0 W m−1 K−1 (m = 2) at 300 K. The electrical conductivity (σ) decreases almost linearly with increasing temperature, indicating metal-like behavior. The ZT value increases as a function of temperature. A maximum ZT value of ~0.07 is achieved at room temperature for the Br-doped phase with m = 4.

1. Introduction

In recent years, the challenge of finding new sources of renewable energy that can generate power from waste heat has attracted considerable interest. It has been estimated that only one-third of produced energy is used efficiently, while the remaining two-thirds are discarded, mainly as waste heat. Therefore, taking advantage of this form of energy would result in an increase in energy efficiency [1,2]. Thermoelectric materials can be used for this purpose due to their ability to generate a potential difference (ΔV) from a temperature gradient (ΔT). The efficiency of these materials is determined by the dimensionless figure of merit (ZT) defined as ZT = (σS2/κtot)T, where T is the temperature, S is the Seebeck coefficient, σ is the electrical conductivity, σS2 is the thermopower, and κ is the thermal conductivity given by κtot = κe+ κlatt (electronic thermal conductivity and lattice thermal conductivity, respectively) [3,4,5,6,7,8].
One of the most common and well-studied thermoelectric materials is PbTe due to its high efficiency; however, the presence of Pb has limited its applications. There has been interest in SnTe as a similar alternative, but spontaneously formed Sn vacancies induce a high carrier concentration, which leads to a low Seebeck coefficient and a high electric contribution to the thermal conductivity [9,10,11]. To increase the efficiency of this material by decreasing the carrier concentration, alloys with AgSbTe2 and AgBiTe2 have been previously reported, which form quaternary compounds with the general formula AgSnmMTem+2 (M = Sb, Bi) [12,13,14,15,16].
To enhance the efficiency of materials that contain Sb in their composition, different types of doping have been reported in recent years, including the use of Bi to replace Sb. Bi has an atomic weight greater than that of Sb, which can increase phonon dispersion, leading to a decrease in the lattice thermal conductivity and, therefore, the total thermal conductivity [15,16]. In 2013, Mohanraman et al. [17] studied the effect of this substitution on p-type Ag(Sb1−xBix)Te2 material (x = 0; 0.03; 0.05; 0.07; 0.1) and reported a decrease in κlatt, with a minimum value of 0.38 Wm−1 K−1 for x = 0.05 at 510 K compared to the value obtained for AgSbTe2 (0.52 Wm−1 K−1). In 2015, Guin et al. [18] obtained an increase in electrical conductivity from 5 to 51 S cm−1 when AgSnSe2 was doped with 2% Bi, which led to an increase in ZT compared to the pristine sample. Tan et al. studied the effects of replacing all Sb in AgSnmSbTem+2 with Bi and reported that Bi is more efficient at neutralizing the Sn vacancies in SnTe than Sb, which leads to a higher Seebeck coefficient [15].
On the other hand, studies with the aim of improving the thermoelectric properties of PbTe have reported the use of halogen anions such as Cl, I, or Br. In 2011, Lalonde et al. reported an improvement in the electrical properties of PbTe when doped with iodine (n-type) at a temperatures between 700 and 800 K, obtaining a decrease in resistivity [19]. In 2018, Li et al. reported a study of SnSe doped with bromine, which caused a fourfold increase in the thermopower for the composition SnSe0.9Br0.147 compared to the pristine sample (4.5 W cm−1 K−2 and 1.1 W cm−1 K−2, respectively) [20]. In addition, doping generates a change in semiconductor behavior, from p-type to n-type, which is reflected by Hall-effect measurements. The ZT values obtained for samples doped with Br were larger than those for polycrystalline SnSe and can be compared to the values obtained for SnSe single crystals [20]. Guin et al. reported improvements in the room-temperature electrical conductivity of AgBiSe2 (n-type) by doping with chlorine, bromine, or iodine. This increase was mainly due to an increase in the carrier concentration, from 5.85 × 10¹⁸ (AgBiSe2) to 3.72 × 10¹⁹ carriers per cm3 (AgBiSe1.98Cl0.02), while the mobility decreased slightly for samples doped with 2% halogen compared to the pristine material [18].
In this work, we report the structural characterization and thermoelectric properties of lead-free systems with the general formula of AgSnm[Sb0.8Bi0.2]Te2+m and doped with Br (m = 2 and 4). These compounds were synthesized at 1223 K using solid-state reactions. Powder X-ray diffraction patterns fitted using the Rietveld method are consistent with phases related to the cubic NaCl-type lattice. Scanning electron microscopy (SEM) and high-resolution transmission electron microscopy (HRTEM) were used to investigate the microstructures and morphologies of these systems. The electrical and thermal transport properties of the samples at low temperature were characterized by measurements of the Seebeck effect, thermal conductivity, and electrical conductivity. The figure of merit (ZT) for temperatures from 10 K to 300 K was evaluated.

2. Experimental Methods

AgSnm[Sb0.8Bi0.2]Te2+m and Br-doped samples were synthesized under a dry and oxygen-free argon atmosphere using silver powder (99.99% purity, Aldrich, Saint Louis, MO, USA), antimony powder, (99.99% purity, Aldrich), tin powder (99.9% purity, Aldrich), tellurium powder (99.99% purity, Aldrich), bismuth powder (99.99% purity, Aldrich), and tin (II) bromide (Aldrich). Phases with the nominal compositions listed above were prepared via the solid-state reaction of powders of Ag, Sn, Bi, Sb, and Te (as well as SnBr2 for the Br-doped phases) mixed in stoichiometric proportions, then placed inside evacuated quartz ampoules. The reaction mixture was gradually heated to 1223 K at a rate of +423 K/h and maintained at this temperature for ~16 h. Then, the furnace was cooled to room temperature. The AgSnm[Sb0.8Bi0.2]Te2+m (m = 2, 4,) system shows congruent melting points at ~680 and ~720 °C. A comparison of the PXRD patterns before and after DSC/TG analyses showed no significant changes. The melting point decreased from 700 °C to 680 °C when Bi was substituted by Sb in the pristine phase (m = 4). The same trend was shown when doped with bromine, where the melting point decreased from 720 °C to 660 °C (m = 4). For electrical measurements, the samples obtained via the solid-state reactions were crushed into powders and placed into a quartz cell with a parallelepiped shape. This quartz cell was placed into a Schlenk tube under an argon atmosphere to prevent oxidation of the bulk by air. This tube was then placed into a furnace at 1223 K for 20 min and quickly removed. The obtained ingots were cut and polished for measurements of their electrical transport and thermal properties, with approximate dimensions of 3 × 3 × 8 mm3. The density was calculated from the sample’s geometry and mass. Table S1 (Supplementary Materials) shows the percentage density of the parallelepiped-shaped samples (>92% theoretical density for all samples).
XRD patterns were obtained at RT using a Bruker D8 Advance powder diffractometer (Bruker, Billerica, MA, USA) with CuKα radiation over the 2θ range of 5°–80° at a step size of 0.01. The collected data were analyzed by Fullprof Rietveld refinement software (https://www.ill.eu/sites/fullprof/php/downloads.html) [21]. A standard LaB6 sample was used to determine the instrumental profiles. The chemical compositions of the samples were determined by scanning electron microscopy (SEM, JEOL 5400 system, Tokyo, Japan) and energy-dispersive X-ray spectroscopy (EDS, Oxford LinK ISIS microanalyzer, Oxford Instruments, Abingdon, UK). High-resolution transmission electron microscopy (HRTEM) and electron diffraction (ED) patterns were obtained using a JEOL JEM 2100 operating at an accelerating voltage of 300 kV. Samples were prepared by crushing the powders under n-butanol and dispersing them over copper grids covered with a porous carbon film. Semiquantitative chemical analyses were carried out using EDS. Differential scanning calorimetry (DSC) and thermogravimetric analysis (TG) were performed on a Rheometric Scientific STA 1500H/625 thermal analysis system. DSC/TG curves were acquired simultaneously for each sample over a temperature range from room temperature to 1273 K; the samples were heated at 10 K min−1 under flowing argon. Low-temperature thermoelectric properties were obtained in a helium-cooled cryostat using a PPMS system (Quantum Design) for temperatures from 10 K to 300 K. Hall-effect measurements were performed using an ECOPIA HMS 2000 system. Electrical contacts of gold were deposited by sputtering on pellets used in the thermoelectric measurements. The Hall coefficient at a field of ±0.556 T was obtained from linear fits of the Hall resistivity using the van der Pauw method at RT.

3. Results and Discussion

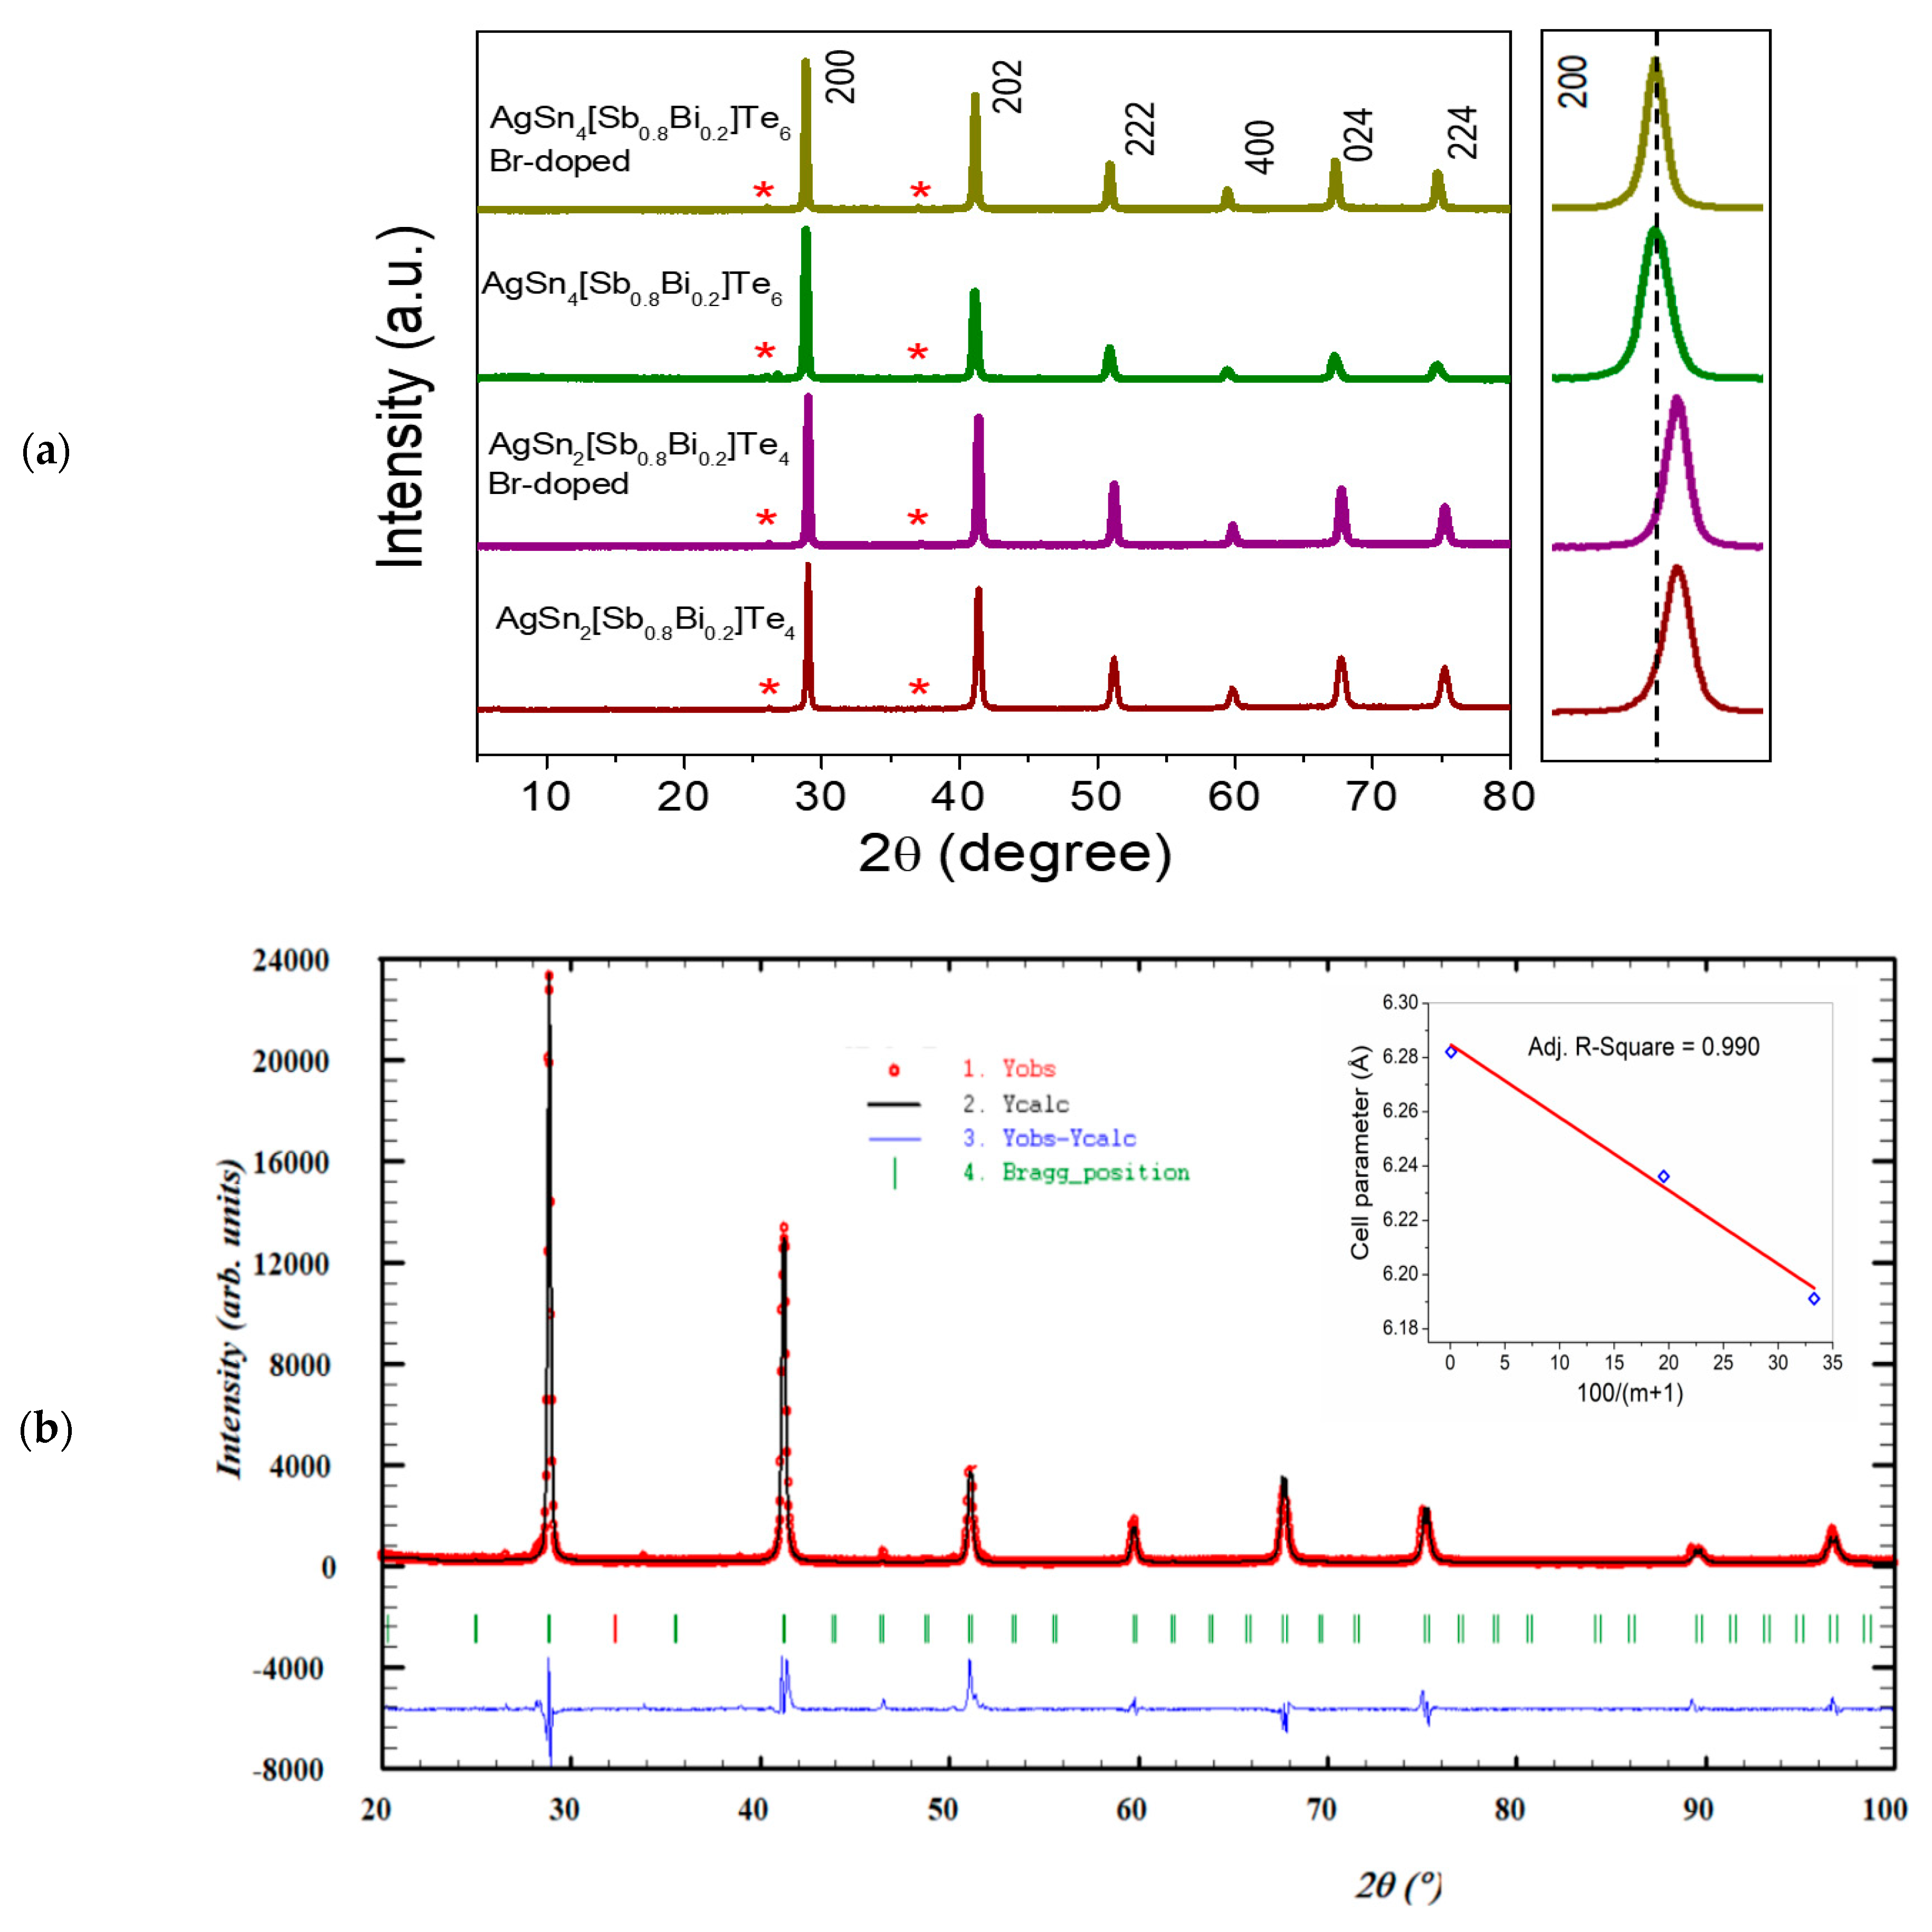
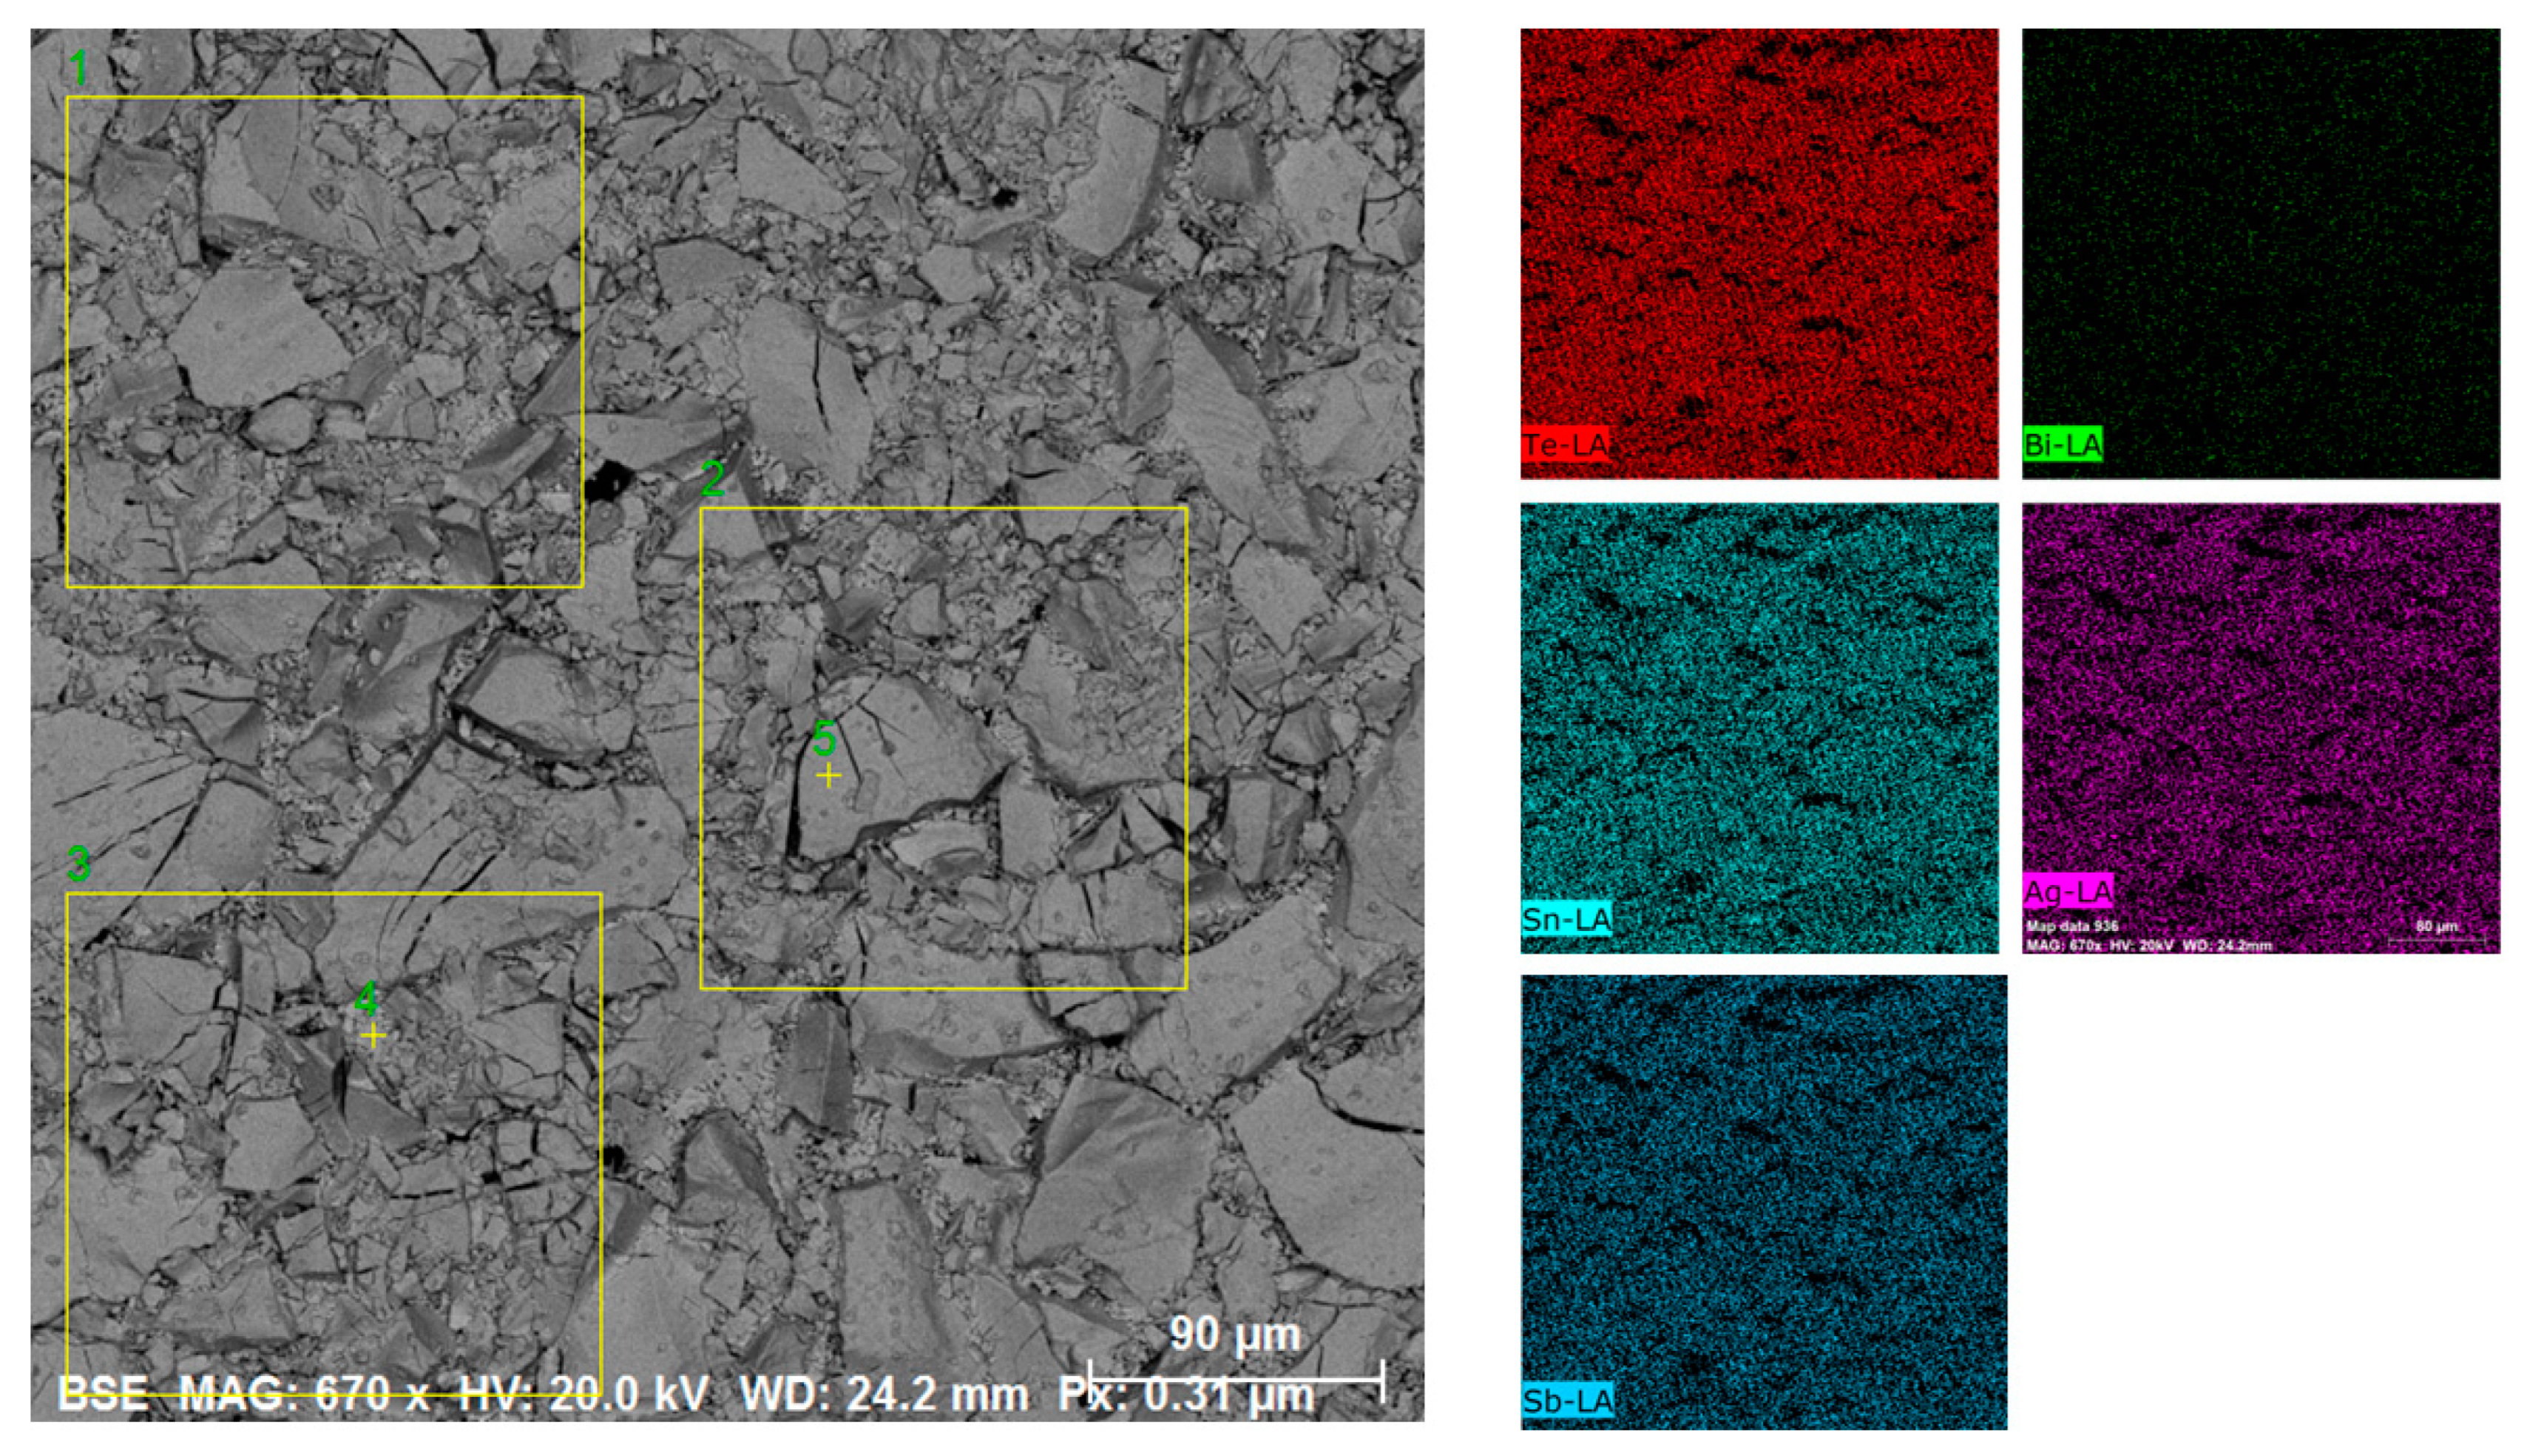
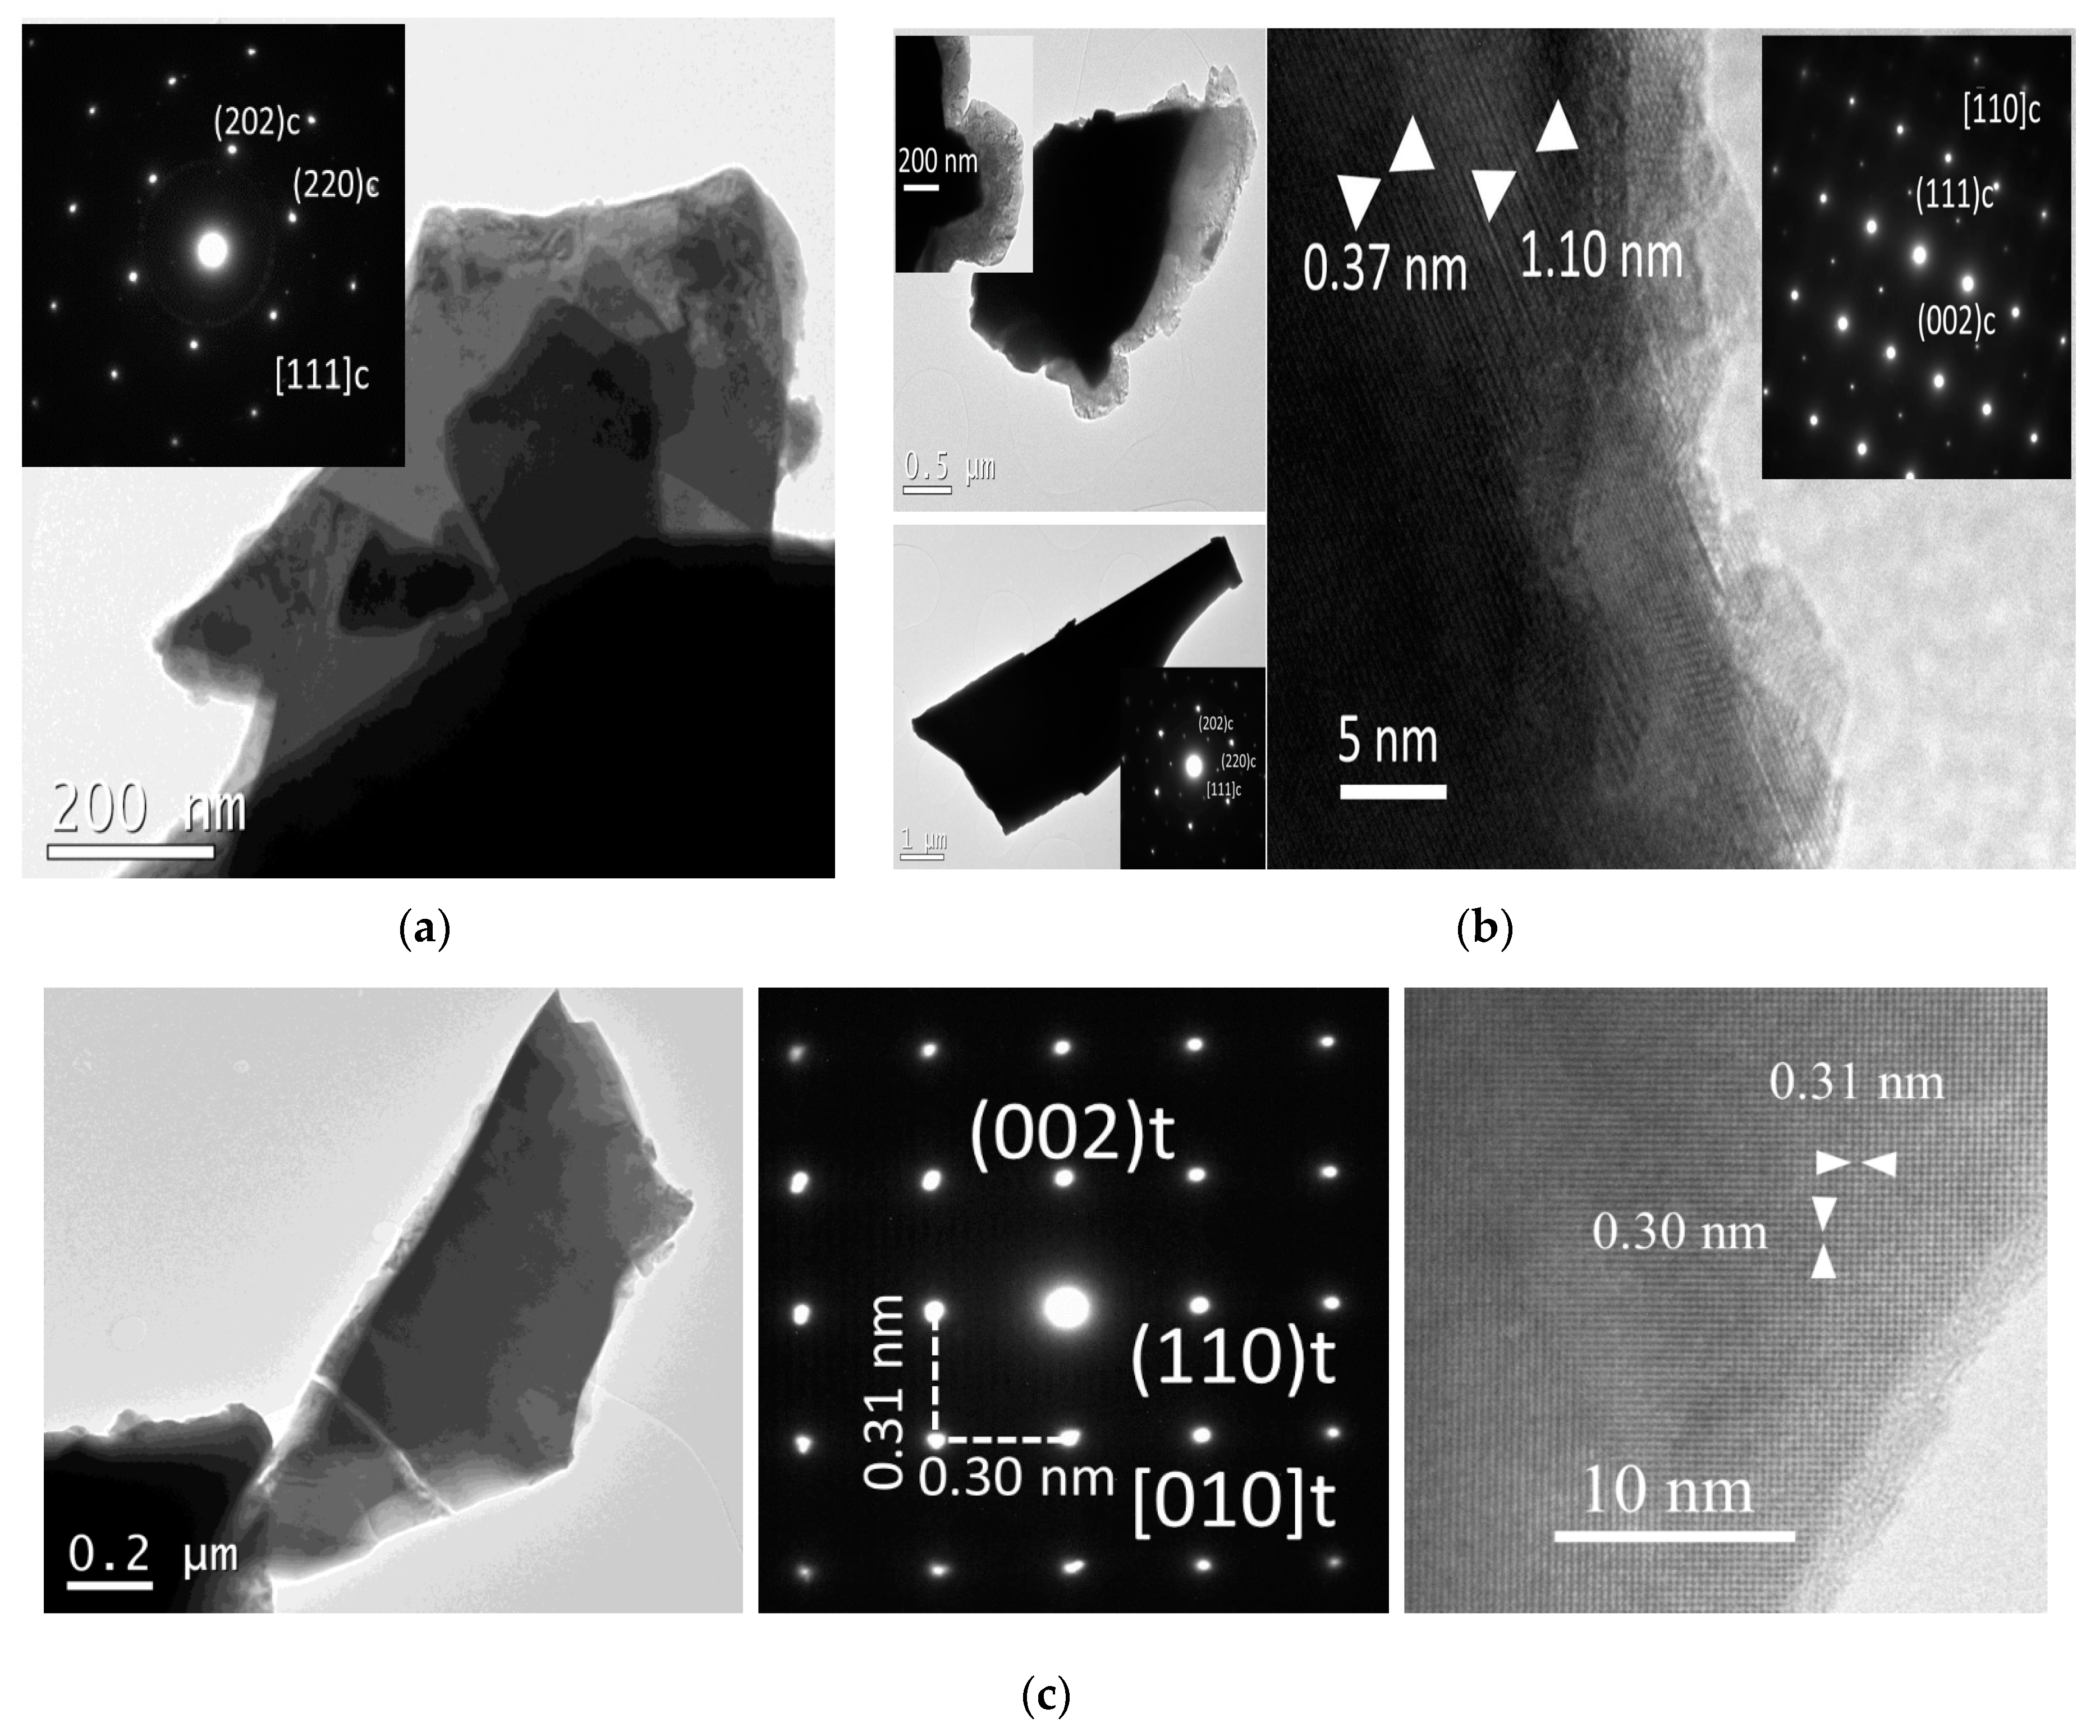
3.1. X-ray Powder Diffraction (XRD) and Electron Microscopic Characterization (SEM-EDS and HRTEM)

The XRD patterns of all samples were fully indexed in the Pm-3m space group, with the exception of two very weak impurity peaks, within the detection limits of the technique. The shape and intensity of the XRD peaks indicate the high crystallinity of all the telluride samples, as shown in Figure 1. The experimental XRD patterns were compared with those of previously reported pristine AgSnmSbTe2+m samples, indicating that they are isostructural, and the measured d-spacings are in good agreement with the calculated values. Increasing Sn content in AgSnm[Sb0.8Bi0.2]Te2+m leads to an increase in the cell parameters (Table S1, Supplementary Materials). For the Br-doped compounds, the cell parameters increase gradually as tellurium is replaced by bromine. Figure 1b displays the Rietveld refinement profile at room temperature for AgSn4[Sb0.8Bi0.2]Te6 using the cubic model. The R indices obtained by Rietveld refinement are shown in Table S1. Similar structures have previously been reported for AgSn[Bi1−xSbx]Se3 samples [22]. The experimental results provide evidence that the AgSnm[Sb0.8Bi0.2]Te2+m and Br-doped compounds have a cubic NaCl-type lattice.
The inset in Figure 1b shows the a-lattice parameter as a function of Ag[Sb0.8Bi0.2]Te2% plotted in the form of the 100/(1 + m) molar ratio. This linear dependence has previously been observed for AgSnxBiTex+2 and AgSnmSbSe2Tem systems [15,23].
SEM-EDS analyses of the powder samples indicate that the chemical composition of all the phases is uniform throughout the scanned region, within the detection limits of the technique, as represented for AgSn2[Sb0.8Bi0.2]Te4 (Figure 2 and Table 1) and AgSn4[Sb0.8Bi0.2]Te5.97Br0.03 (Figure S1, Supplementary Materials). EDS microprobe chemical analysis performed on several areas of the AgSn2[Sb0.8Bi0.2]Te4 sample revealed an average chemical composition consistent with the nominal composition (as shown in Figure 2, yellow squares). The chemical distributions of bismuth, antimony, silver, tellurium, tin, and bromine in both samples are homogeneous.
HRTEM analysis and electron diffraction (ED) patterns show the microstructural characteristics of the telluride samples. Small crystals of between 1 and 5 µm with irregular shapes are observed. ED patterns obtained along the [111]c and [110]c zone axes for different selected regions of AgSn2[Sb0.8Bi0.2]Te4 and AgSn4[Sb0.8Bi0.2]Te6 are shown in Figure 3a,b.
Electron diffraction (ED) patterns and distances associated with lattice fringes in the HRTEM images of AgSnm[Sb0.8Bi0.2]Te2+m and the Br-doped family of compounds are generally consistent with cubic symmetry. Figure 3c displays ED patterns obtained along the [111]c zone axis for different selected regions of AgSn2Sb0.8Bi0.2Te3.97Br0.03. Although most of the ED patterns are coherent with cubic symmetry, the separation between spots in the ED patterns for some crystallites suggests the existence of tetragonal regions. Some high-magnification images show nanoregions, intergrowths, and regions with very low crystallinity (see Figure 3b,c). Previously, Quarez et al. experimentally demonstrated that the cubic space group (Pm-3m) and a lower symmetric space group such as P4/mmm coexist in AgPbmSbTe2+m phases by performing HRTEM analyses and single-crystal XRD [24].
The mean atomic compositions of AgSn2[Sb0.8Bi0.2]Te4 and AgSn4[Sb0.8Bi0.2]Te6 determined according EDS mapping data collected from the entire crystals are consistent with the nominal compositions within the detection limits of the technique (Tables S2–S4, Supplementary Materials). In the Br-doped phases, a homogeneous bromine distribution is observed in several crystals when measured in different regions. These EDS results from HRTEM are in agreement with the SEM-EDS analysis.

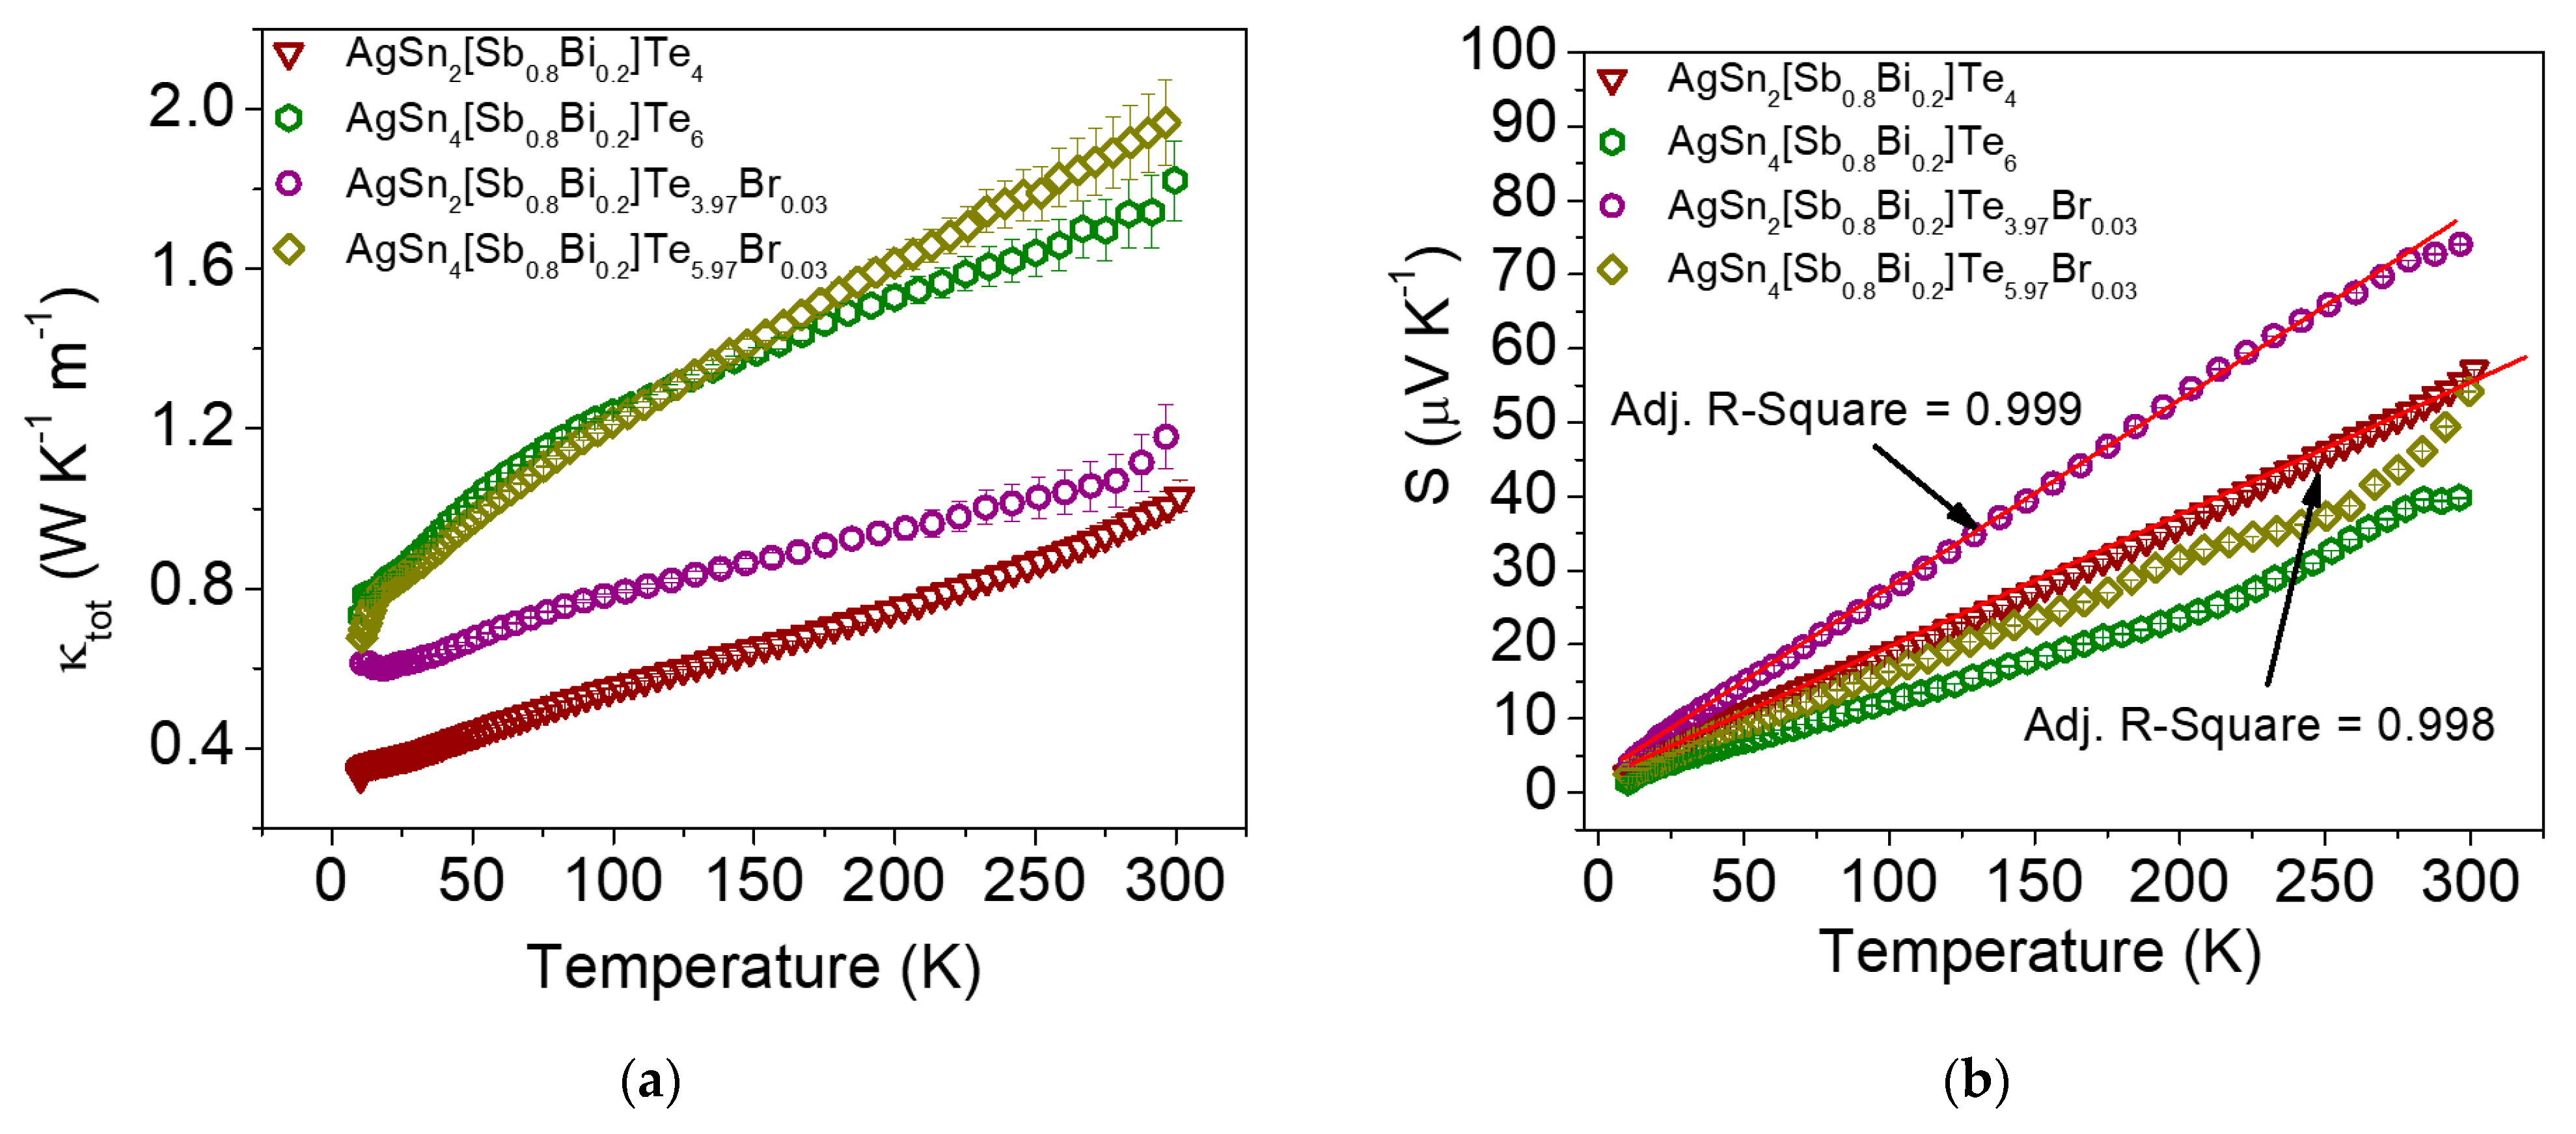
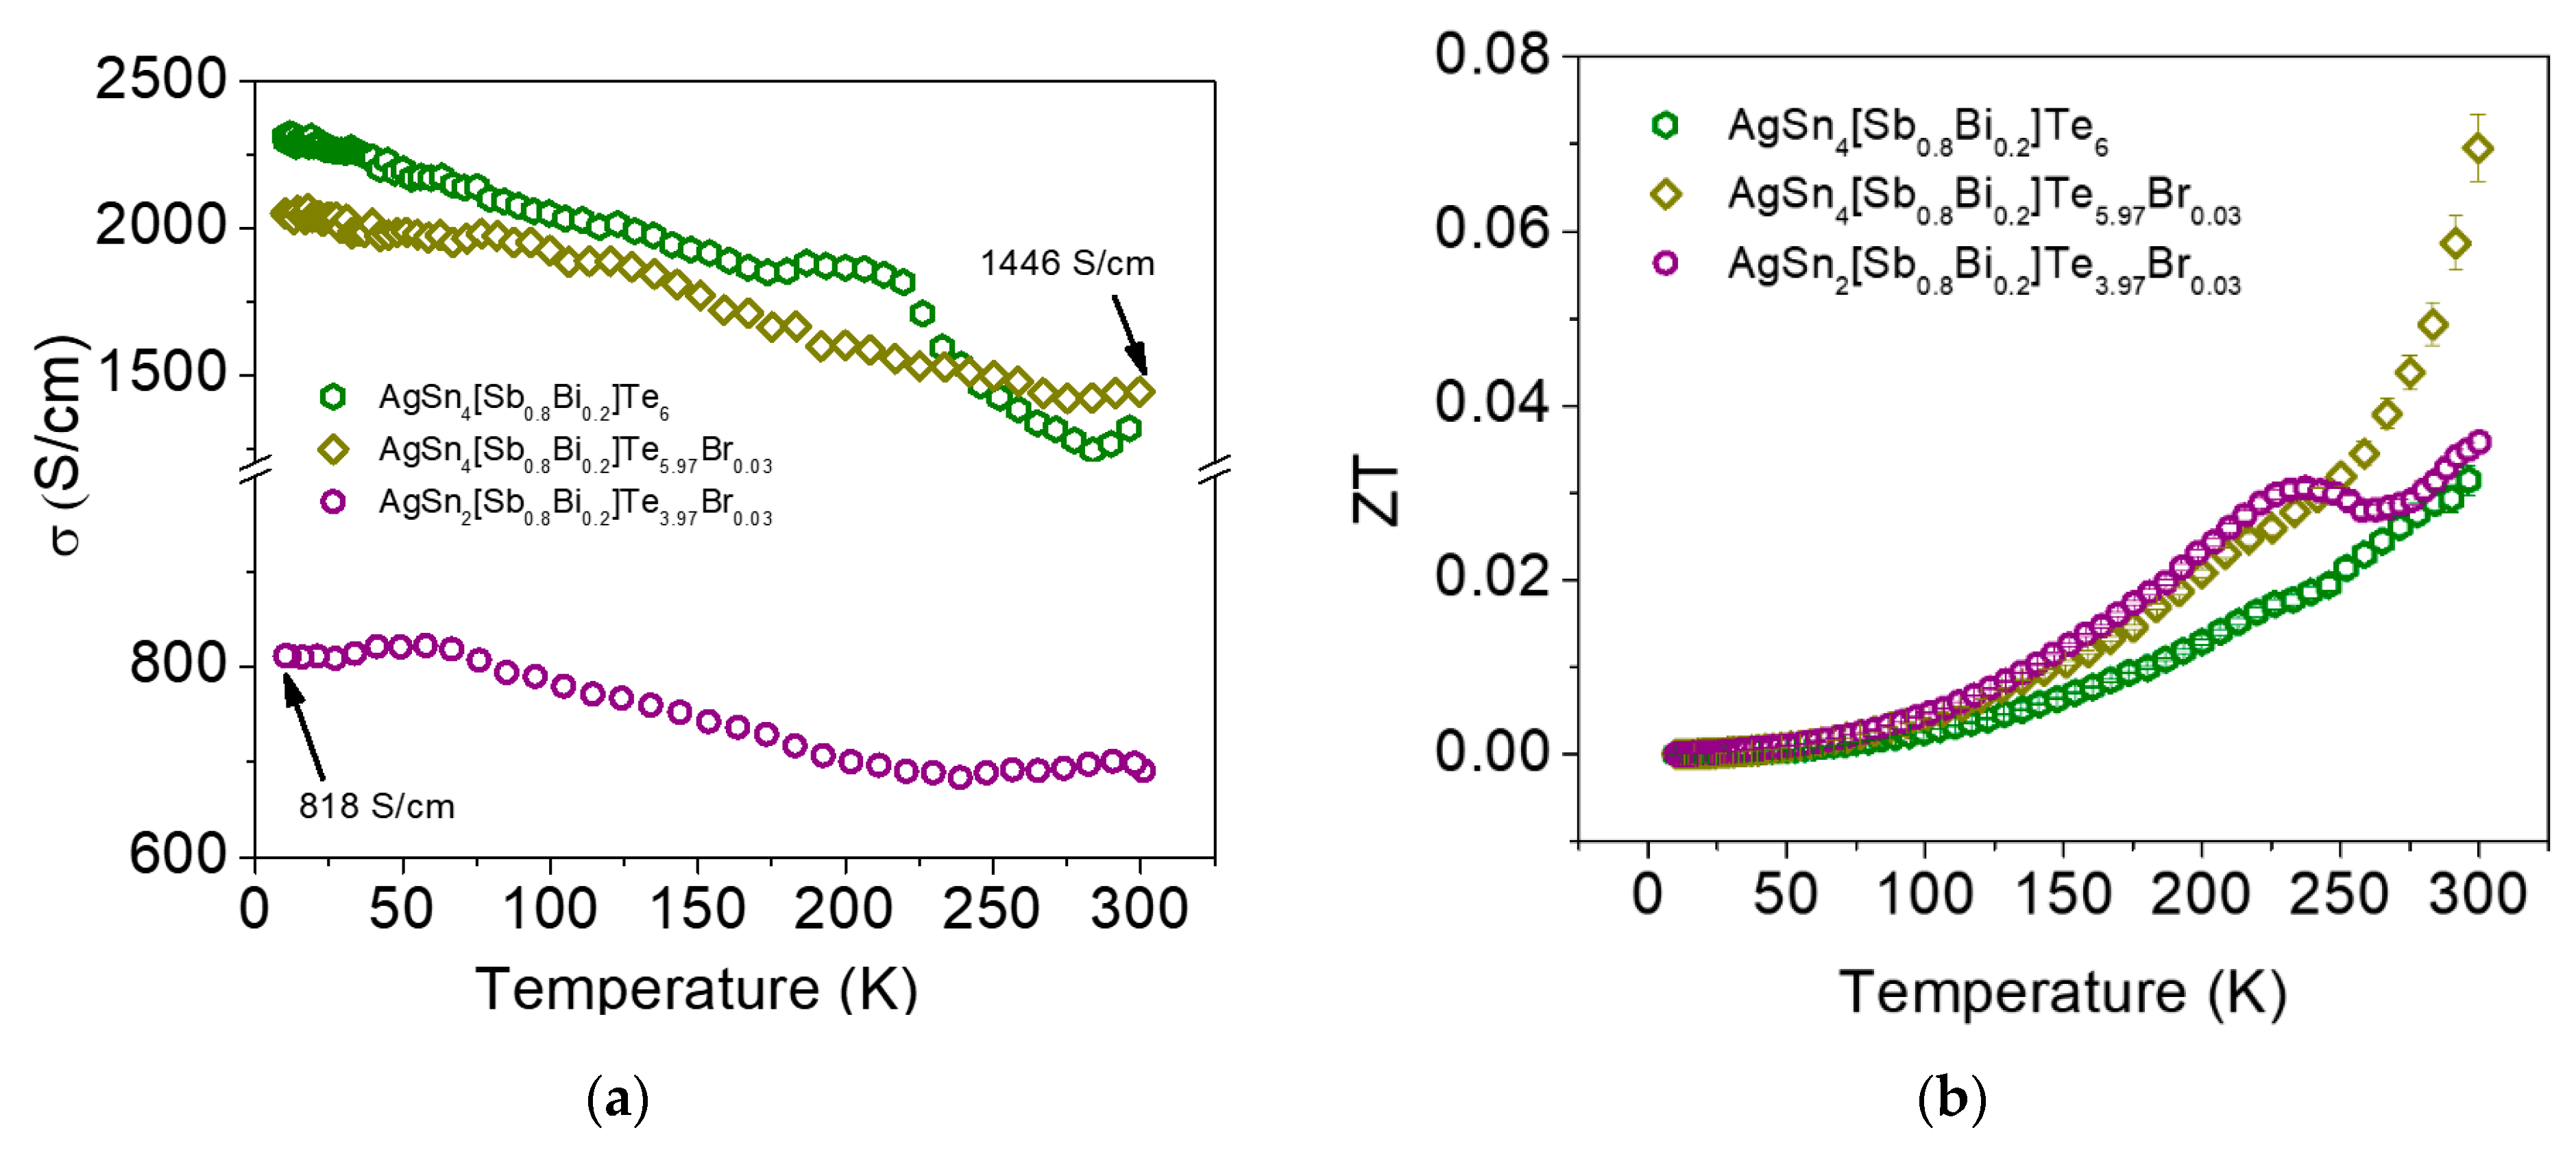
3.2. Thermoelectric Properties

The temperature dependence of the total thermal conductivity (κtot) at low temperatures for the AgSnm[Sb0.8Bi0.2]Te2+m and Br-doped phases is shown in Figure 4a. The thermal conductivity monotonically increases with increasing temperature. The κtot values are ~1.8 W m−1 K−1 (m = 4) and ~1.0 W m−1 K−1 (m = 2) at 300 K. The AgSnmSbTe2+m pristine phases have very low total thermal conductivity, ranging from ~1.5 to ~3.0 W m−1 K−1 at 300 K [13]. The κtot value of AgSnm[Sb0.8Bi0.2]Te2+m (m = 2 in this work) is lower than the value reported for AgSn5SbTe7 (κtot = ~1.6 W m−1 K−1 at RT) [16]. The partial chemical substitution of 20 mol% bismuth by antimony can therefore decrease the κtot of AgSnmSbTe2+m. The Br-doped phases show similar values of κtot throughout the studied temperature range. For example, the κtot of AgSn4[Sb0.8Bi0.2]Te5.97Br0.03 is ~2.0 W m−1 K−1 and ~1.1 W m−1 K−1 at 300 and 70 K, respectively. A lower κtot is obtained for AgSn2[Sb0.8Bi0.2]Te3.97Br0.03 (~1.2 W m−1 K−1 at RT).
Figure 4b shows the temperature dependence of the Seebeck coefficient (S) of the AgSnm[Sb1−xBix]Te2+m (x = 0.2; m = 2 and 4) and Br-doped samples. An almost linear increase in the Seebeck coefficient is observed between 10 and 300 K. These results were checked by performing several heating–cooling cycles on each sample. The S values of the AgSnm[Sb0.8Bi0.2]Te2+m systems (m = 2 and 4) obtained via the isoelectronic substitution of a fraction of Sb atoms with Bi indicate that holes are the dominant conduction carriers.
The Seebeck coefficient of AgSnm[Sb0.8Bi0.2]Te2+m increases from +40 μV·K−1 (m = 4) to +57 μV·K−1 (m = 2) with decreasing Sn content at 300 K. This value is approximately 1.5 times lower than that of Ag0.8SnSb1.15Te3 (~+80 μV·K−1) and is comparable with the Seebeck coefficient of SnTe at 300 K (+40 μV·K−1) and the S values of ~+80 to 30 μV·K−1 for SnTe-AgSbTe2 systems at RT [16,25,26]. Han et al. reported that the Seebeck coefficients of p-type AgSnmSbTe2+m decreased from ~+75 μV·K−1 for m = 10 to ~+50 μV·K−1 for m = 2 at RT [13]. In the systems measured in the current study, the chemical substitution of Bi for Sb does not considerably increase the S values compared to the pristine phases. However, bromine doping contributes to enhancement of the Seebeck coefficient. The highest S value obtained is +74 μV·K−1 for AgSn2[Sb0.8Bi0.2]Te3.97Br0.03 compared to +57 μV·K−1 for the non-doped phase (m = 2). This value is comparable to the Seebeck coefficient of the Ag0.8SnSb1.15Te3 and SnTe-AgBiTe2 systems at RT [16,25,26]. Doping with Br increases the S coefficient from +40 μV·K−1 to +57 μV·K−1 for m = 4, AgSn4[Sb0.8Bi0.2]Te5.97Br0.03, but this increase is considerably smaller than that observed for m = 2 at RT.
The temperature dependence of the Seebeck coefficient typical of metallic or degenerate semiconductors is expressed by the following formula:
S = [ 8 π 2 / 3 k B 2 ( r + 3 / 2 ) 3 5 / 3 e h 2 ] ( m * n 2 / 3 ) T
where S is the Seebeck coefficient, m* is the effective mass, kB is Boltzmann’s constant, e is the charge of an electron, h is Planck’s constant, and n is the carrier concentration [3,7]. The Seebeck coefficient was fitted in the temperature range from 10 K to 300 K for AgSn2[Sb0.8Bi0.2]Te4 and AgSn2[Sb0.8Bi0.2]Te3.97Br0.03, as shown in Figure 4b. Hall-effect measurements revealed that the carrier concentration of the telluride samples was in the range of +2.5–1.7 × 1019 cm−3 at room temperature. These measurements imply an m* of ~0.91·m0 assuming an acoustic phonon scattering mechanism (r = −1/2) and an m* of ~0.32·m0 assuming an ionized impurity scattering mechanism (r = 3/2). Density-of-states effective masses, m* ~ 0.61−0.99·m0 and m* ~ 0.32·m0 at room temperature, were previously reported for Sn0.85Sb0.15Te and PbTe, respectively [27,28].
Figure 5a shows plots of the temperature dependence of the electrical conductivity (σ) for AgSn4[Sb0.8Bi0.2]Te6 and the Br-doped phases. σ decreases almost linearly with increasing temperature, indicating that the samples show metal-like behavior. AgSn4[Sb0.8Bi0.2]Te6 has similar electrical conductivity to the Br-doped phases and lower values than the pristine phases (Table 2). For example, our measured value of σ is 1232 S cm−1 for AgSnm[Sb0.8Bi0.2]Te2+m (m = 4), and the reported σ value of AgSn2SbTe4 is ~1800 S cm−1 at 300 K [13]. The figure of merit (ZT) is plotted as a function of temperature for AgSn4[Sb0.8Bi0.2]Te6 and the Br-doped samples in Figure 5b. The samples show monotonically increasing ZT with Br doping. A maximum ZT value of ~0.07 is achieved at room temperature for AgSn4[Sb0.8Bi0.2]Te5.97Br0.03.

4. Conclusions

In summary, polycrystalline AgSnm[Sb0.8Bi0.2]Te2+m and Br-doped phases were successfully prepared at high temperatures using solid-state reactions. EDS mapping analysis using SEM and HRTEM indicates that the chemical substitution of bismuth and bromine in the pristine AgSnmSbTe2+m samples is homogeneous within experimental error. HRTEM images and electron diffraction patterns reveal the existence of nanoregions with different orientations or symmetries, whether cubic or tetragonal. X-ray diffraction (XRD) and electron diffraction (ED) data are consistent with a cubic NaCl-type superstructure. The Seebeck coefficient (S) of AgSnm[Sb0.8Bi0.2]Te2+m ranges from +40 to 74 μV·K−1. The total thermal conductivity (κtot) is decreased by bromine doping (~1.2 W m−1 K−1 at RT). S and κtot increase over the studied temperature range, whereas the electrical conductivity (σ) decreases with increasing temperature. It is worth mentioning that all samples show metal-like behavior. Finally, a maximum ZT value of ~0.07 was obtained at room temperature for the Br-doped AgSn4[Sb0.8Bi0.2]Te6 phase. This study deepens the understanding of rocksalt-type telluride phases and provides a new approach for optimizing TE performance by introducing chemical substitutions.

Supplementary Materials

The following supporting information can be downloaded at: https://www.mdpi.com/article/10.3390/ma16155213/s1, Table S1: Lattice parameters and R indices obtained from Rietveld refinement of PXRD patterns; Figure S1: Representative energy-dispersive X-ray (EDS) chemical mapping images of AgSn4[Sb0.8Bi0.2]Te5.97Br0.03 powder sample; Table S2: EDS chemical analysis from HRTEM measurements of AgSn2Sb0.8Bi0.2Te4 samples collected from different crystals and zones; Table S3: EDS chemical analysis from HRTEM measurements of AgSn4Sb0.8Bi0.2Te6 samples collected from different crystals and zones; Table S4: EDS chemical analysis from HRTEM measurements of AgSn4Sb0.8Bi0.2Te5.97Br0.03 samples collected from different crystals and zones.

Author Contributions

Conceptualization, A.G., S.M. and D.D.; methodology and experiments, M.L.L., I.Á.-S., A.G., G.R.B. and D.D.; writing—original draft preparation, S.M., P.V.-G., M.L.L., I.Á.-S., G.R.B. and A.G.; electrical measurements, D.D. and G.R.B. All authors have read and agreed to the published version of the manuscript.

Funding

This research received no external funding.

Institutional Review Board Statement

Not applicable.

Informed Consent Statement

Not applicable.

Data Availability Statement

Data are contained within the article.

Acknowledgments

This work was supported by FONDECYT-ANID No. 1190856. The authors also acknowledge the CAI center of UCM (HRTEM).

Conflicts of Interest

The authors declare no conflict of interest.

References

  1. Rowe, D.M. Thermoelectric harvesting of low temperature natural/waste heat. AIP Conf. Proc. 2012, 1449, 485–492. [Google Scholar] [CrossRef]
  2. Zhao, L.D.; Tan, G.; Hao, S.; He, J.; Pei, Y.; Chi, H.; Wang, H.; Gong, S.; Xu, H.; Dravid, V.P.; et al. Ultrahigh power factor and thermoelectric performance in hole-doped single-crystal SnSe. Science 2016, 351, 141–144. [Google Scholar] [CrossRef] [PubMed] [Green Version]
  3. Zhang, X.; Zhao, L.D. Thermoelectric materials: Energy conversion between heat and electricity. J. Mater. 2015, 1, 92–105. [Google Scholar] [CrossRef] [Green Version]
  4. Soleimani, Z.; Zoras, S.; Ceranic, B.; Shahzad, S.; Cui, Y. A review on recent developments of thermoelectric materials for room-temperature applications. Sustain. Energy Technol. Assess. 2020, 37, 100604. [Google Scholar] [CrossRef]
  5. Hamid Elsheikh, M.; Shnawah, D.A.; Sabri, M.F.M.; Said, S.B.M.; Haji Hassan, M.; Ali Bashir, M.B.; Mohamad, M. A review on thermoelectric renewable energy: Principle parameters that affect their performance. Renew. Sustain. Energy Rev. 2014, 30, 337–355. [Google Scholar] [CrossRef]
  6. Hasan, M.N.; Wahid, H.; Nayan, N.; Mohamed Ali, M.S. Inorganic thermoelectric materials: A review. Int. J. Energy Res. 2020, 44, 6170–6222. [Google Scholar] [CrossRef]
  7. Snyder, G.J.; Toberer, E. Complex thermoelectric materials. Nat. Mater. 2008, 7, 105–114. [Google Scholar] [CrossRef] [Green Version]
  8. Sootsman, J.R.; Chung, D.Y.; Kanatzidis, M.G. New and old concepts in thermoelectric materials. Angew. Chem.-Int. Ed. 2009, 48, 8616–8639. [Google Scholar] [CrossRef]
  9. Singh, D.J. Thermopower of SnTe from Boltzmann transport calculations. Funct. Mater. Lett. 2010, 3, 223–226. [Google Scholar] [CrossRef] [Green Version]
  10. Brebrick, R.F.; Strauss, A.J. Anomalous thermoelectric power as evidence for two-valence bands in SnTe. Phys. Rev. 1963, 131, 104–110. [Google Scholar] [CrossRef]
  11. Chen, Z.; Guo, X.; Zhang, F.; Shi, Q.; Tang, M.; Ang, R. Routes for advancing SnTe thermoelectrics. J. Mater. Chem. A 2020, 8, 16790–16813. [Google Scholar] [CrossRef]
  12. Tan, G.; Hao, S.; Hanus, R.C.; Zhang, X.; Anand, S.; Bailey, T.P.; Rettie, A.J.E.; Su, X.; Uher, C.; Dravid, V.P.; et al. High Thermoelectric Performance in SnTe-AgSbTe2 Alloys from Lattice Softening, Giant Phonon-Vacancy Scattering, and Valence Band Convergence. ACS Energy Lett. 2018, 3, 705–712. [Google Scholar] [CrossRef]
  13. Han, M.K.; Androulakis, J.; Kim, S.J.; Kanatzidis, M.G. Lead-free thermoelectrics: High figure of merit in p-type AgSnmSbTem+2. Adv. Energy Mater. 2012, 2, 157–161. [Google Scholar] [CrossRef]
  14. Guo, Z.; Wu, G.; Tan, X.; Wang, R.; Yan, Z.; Zhang, Q.; Song, K.; Sun, P.; Hu, H.; Cui, C.; et al. Synergistic Manipulation of Interdependent Thermoelectric Parameters in SnTe−AgBiTe2 Alloys by Mn Doping. ACS Appl. Mater. Interfaces 2022, 14, 29032–29038. [Google Scholar] [CrossRef] [PubMed]
  15. Tan, G.; Shi, F.; Sun, H.; Zhao, L.-D.; Uher, C.; Dravid, V.P.; Kanatzidis, M.G. SnTe–AgBiTe2 as an efficient thermoelectric material with low thermal conductivity. J. Mater. Chem. A 2014, 2, 5878–5884. [Google Scholar] [CrossRef]
  16. Chen, Y.; Nielsen, M.D.; Gao, Y.B.; Zhu, T.J.; Zhao, X.; Heremans, J.P. SnTe-AgSbTe2 thermoelectric alloys. Adv. Energy Mater. 2012, 2, 58–62. [Google Scholar] [CrossRef]
  17. Mohanraman, R.; Sankar, R.; Chou, F.C.; Lee, C.H.; Chen, Y.Y. Enhanced thermoelectric performance in Bi-doped p-type AgSbTe2 compounds. J. Appl. Phys. 2013, 114, 163712. [Google Scholar] [CrossRef]
  18. Guin, S.N.; Srihari, V.; Biswas, K. Promising thermoelectric performance in n-type AgBiSe2: Effect of aliovalent anion doping. J. Mater. Chem. A 2015, 3, 648–655. [Google Scholar] [CrossRef]
  19. Lalonde, A.D.; Pei, Y.; Snyder, G.J. Reevaluation of PbTe1-xIx as high performance n-type thermoelectric material. Energy Environ. Sci. 2011, 4, 2090–2096. [Google Scholar] [CrossRef] [Green Version]
  20. Li, S.; Wang, Y.; Chen, C.; Li, X.; Xue, W.; Wang, X.; Zhang, Z.; Cao, F.; Sui, J.; Liu, X.; et al. Heavy Doping by Bromine to Improve the Thermoelectric Properties of n-type Polycrystalline SnSe. Adv. Sci. 2018, 5, 6–11. [Google Scholar] [CrossRef]
  21. Rodríguez-Carvajal, J. Recent advances in magnetic structure determination by neutron powder diffraction. Phys. B Phys. Condens. Matter 1993, 192, 55–69. [Google Scholar] [CrossRef]
  22. Valencia-Galvez, P.; Delgado, D.; López, M.L.; Alvarez-Serrano, I.; Moris, S.; Galdamez, A. AgSn[Bi1−xSbx]Se3: Synthesis, Structural Characterization, and Electrical Behavior. Crystals 2021, 11, 864. [Google Scholar] [CrossRef]
  23. Figueroa-Millon, S.; Álvarez-Serrano, I.; Bérardan, D.; Galdámez, A. Synthesis and transport properties of p-type lead-free AgSnmSbSe2Tem thermoelectric systems. Mater. Chem. Phys. 2018, 211, 321–328. [Google Scholar] [CrossRef]
  24. Quarez, E.; Hsu, K.F.; Pcionek, R.; Frangis, N.; Polychroniadis, E.K.; Kanatzidis, M.G. Nanostructuring, compositional fluctuations, and atomic ordering in the thermoelectric materials AgPbmSbTe2+m. The myth of solid solutions. J. Am. Chem. Soc. 2005, 127, 9177–9190. [Google Scholar] [CrossRef] [PubMed]
  25. Androulakis, J.; Pcionek, R.; Quarez, E.; Do, J.H.; Kong, H.; Palchik, O.; Uher, C.; D’Angelo, J.J.; Short, J.; Hogan, T.; et al. Coexistence of large thermopower and degenerate doping in the nanostructured material Ag0.85SnSb1.15Te3. Chem. Mater. 2006, 18, 4719–4721. [Google Scholar] [CrossRef]
  26. Falkenbach, O.; Schmitz, A.; Dankwort, T.; Koch, G.; Kienle, L.; Mueller, E.; Schlecht, S. Tin Telluride-Based Nanocomposites of the Type AgSnmBiTe2+m (BTST-m) as Effective Lead-Free Thermoelectric Materials. Chem. Mater. 2015, 27, 7296–7305. [Google Scholar] [CrossRef]
  27. Fu, T.; Xin, J.; Zhu, T.; Shen, J.; Fang, T.; Zhao, X. Approaching the minimum lattice thermal conductivity of p-type SnTe thermoelectric materials by Sb and Mg alloying. Sci. Bull. 2019, 64, 1024–1030. [Google Scholar] [CrossRef]
  28. Zhao, L.; Xiao, Y.; Wu, H.; Cui, J.; Wang, D.; Fu, L.; Zhang, Y.; Chen, Y.; He, J.; Pennycook, S.-J. Realizing high performance n-type PbTe by synergistically optimizing effective mass and carrier mobility and suppressing bipolar thermal conductivity. Energy Environ. Sci. 2018, 11, 2486–2495. [Google Scholar] [CrossRef]
Figure 1. (a) XRD patterns and hkl peak indexing based on the cubic unit cell for AgSnm[Sb0.8Bi0.2]Te2+m systems at room temperature; the enlarged pattern shows the 200 peak in the range of 26° to 31° in 2θ. The red asterisks indicate reflections associated with an unidentified impurity. (b) Observed, calculated, and difference XRD profiles of AgSn4[Sb0.8Bi0.2]Te6 fitted using the Rietveld method with Fullprof software (https://www.ill.eu/sites/fullprof/php/downloads.html). The inset shows a plot of the a-lattice parameter as a function of the molar ratio (100/(1 + m)).
Materials 16 05213 g001
Figure 2. Representative SEM-EDS analysis of AgSn2[Sb0.8Bi0.2]Te4: backscattered electron (BSE) and energy-dispersive X-ray (EDS) chemical mapping images from powder sample.
Materials 16 05213 g002
Figure 3. HRTEM images and ED patterns of different selected regions of AgSn2[Sb0.8Bi0.2]Te4 (a), AgSn4[Sb0.8Bi0.2]Te6 (b), and AgSn2Sb0.8Bi0.2Te3.97Br0.03 (c). The high-magnification images and ED patterns in (a) and (b) are coherent, with cubic symmetry along zone axes [111]c and [110]c. The images exhibit regions with intergrowths and local deviation from cubic symmetry. The images and ED pattern in (c) show crystals of micrometer size that have local regions with tetragonal symmetry.
Materials 16 05213 g003
Figure 4. Temperature dependence of (a) total thermal conductivity κtot and (b) Seebeck coefficient S as a function of temperature for AgSnm[Sb0.8Bi0.2]Te2+m and Br-doped phases. The solid red lines show representative linear fits to the experimental data in the low-temperature range.
Materials 16 05213 g004
Figure 5. Temperature dependence of (a) the electrical conductivity (σ) and (b) figure of merit (ZT) for AgSnm[Sb0.8Bi0.2]Te2+m and Br-doped phases.
Materials 16 05213 g005
Table 1. Chemical analysis of AgSn2[Sb0.8Bi0.2]Te4 nominal composition performed on several areas of the sample (See BSE-Figure 2). The chemical formula averaged over these areas is shown.
SpectrumMass Percentage (%)Average Chemical Formula
AgSnSbBiTe
110.1223.399.666.8949.94Ag1.00Sn2.06[Sb0.88Bi0.32]Te4.14
210.0123.219.927.5849.28
310.3322.779.947.1349.82
410.0424.549.394.9651.07
510.5921.6611.815.3250.63
Mean value:10.2223.1110.146.3750.15
Sigma:0.241.040.961.160.70
Sigma mean:0.110.470.430.520.32
Table 2. Room-temperature physical properties, including Seebeck coefficient (S), electrical conductivity (σ), and Hall-carrier concentration (n).
S (μV·K−1)σ (S cm−1)n§ (cm−3)
AgSn4[Sb0.8Bi0.2]Te6+401429+1.71 × 10¹⁹
AgSn4[Sb0.8Bi0.2]Te5.97Br0.03+571443+5.51 × 10¹⁹
AgSn2[Sb0.8Bi0.2]Te3.97Br0.03+74685+2.12 × 10¹⁹
§ Hall-effect measurements using the van der Pauw method.
Disclaimer/Publisher’s Note: The statements, opinions and data contained in all publications are solely those of the individual author(s) and contributor(s) and not of MDPI and/or the editor(s). MDPI and/or the editor(s) disclaim responsibility for any injury to people or property resulting from any ideas, methods, instructions or products referred to in the content.

