

Modeling of Hydrogen-Charged Notched Tensile Tests of an X70 Pipeline Steel with a Hydrogen-Informed Gurson Model
 , , , , and
Abstract
:1. Introduction
2. Experimental Summary
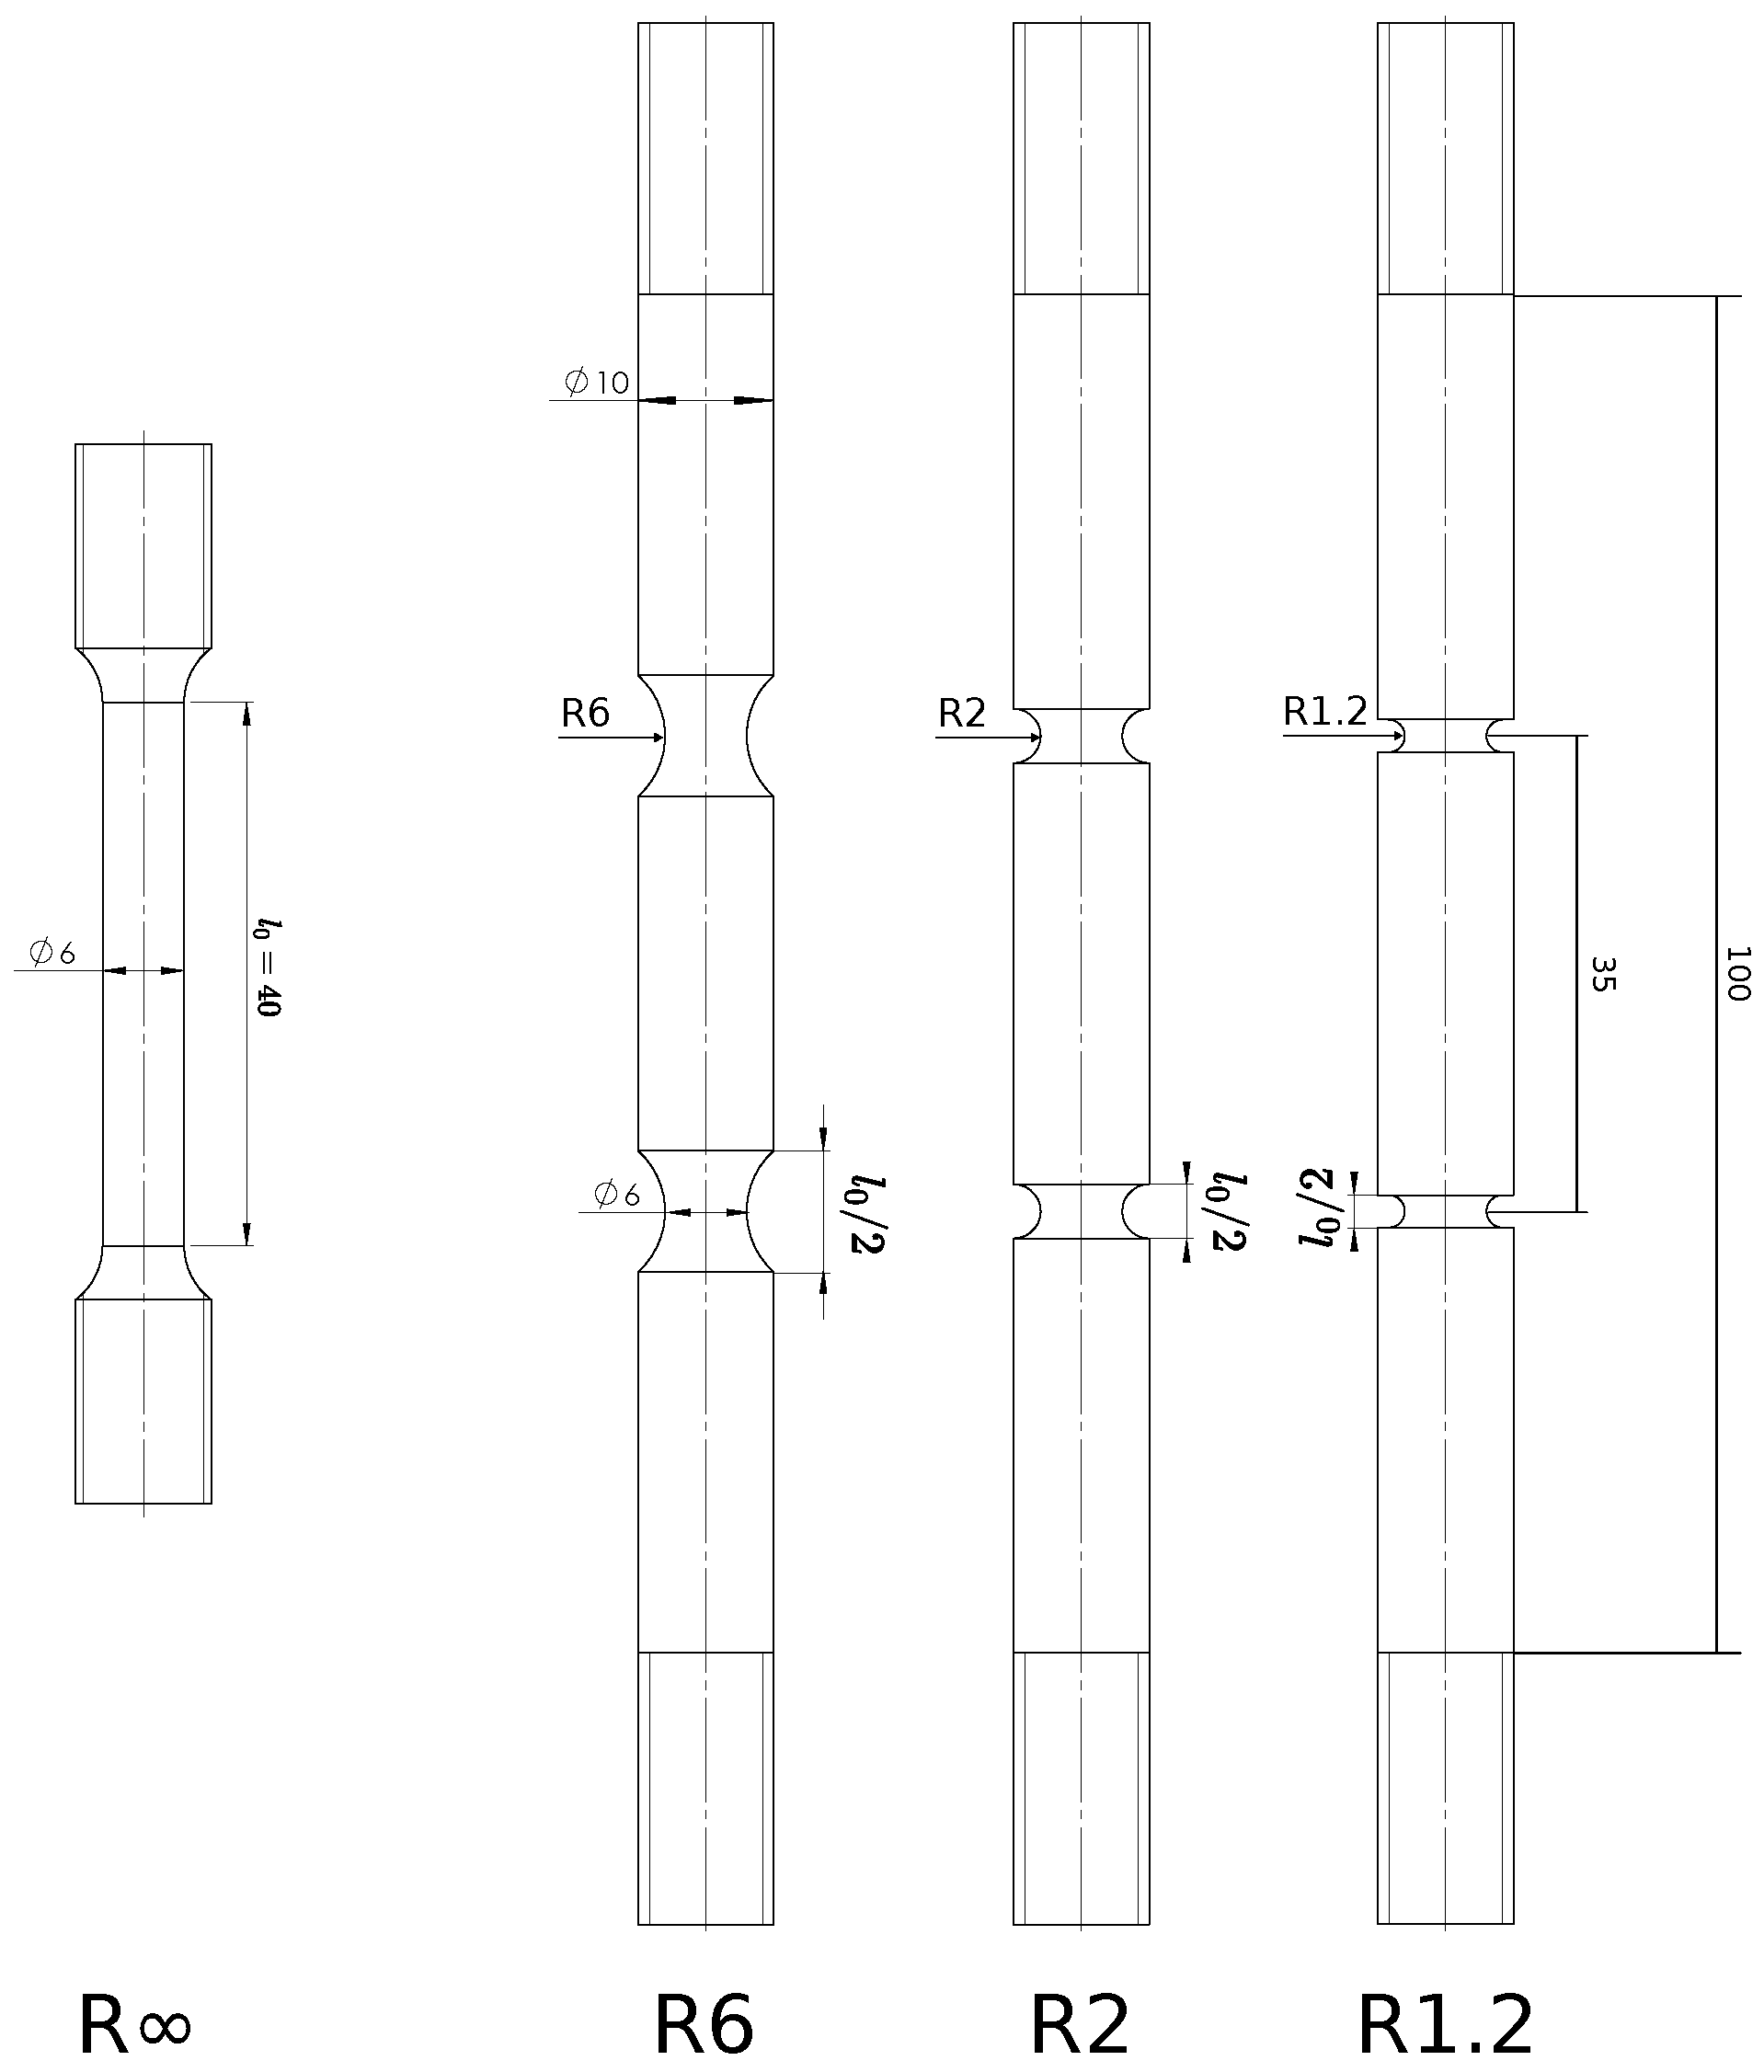
2.1. Materials
2.2. Experimental Methods
2.3. Tensile Test Results
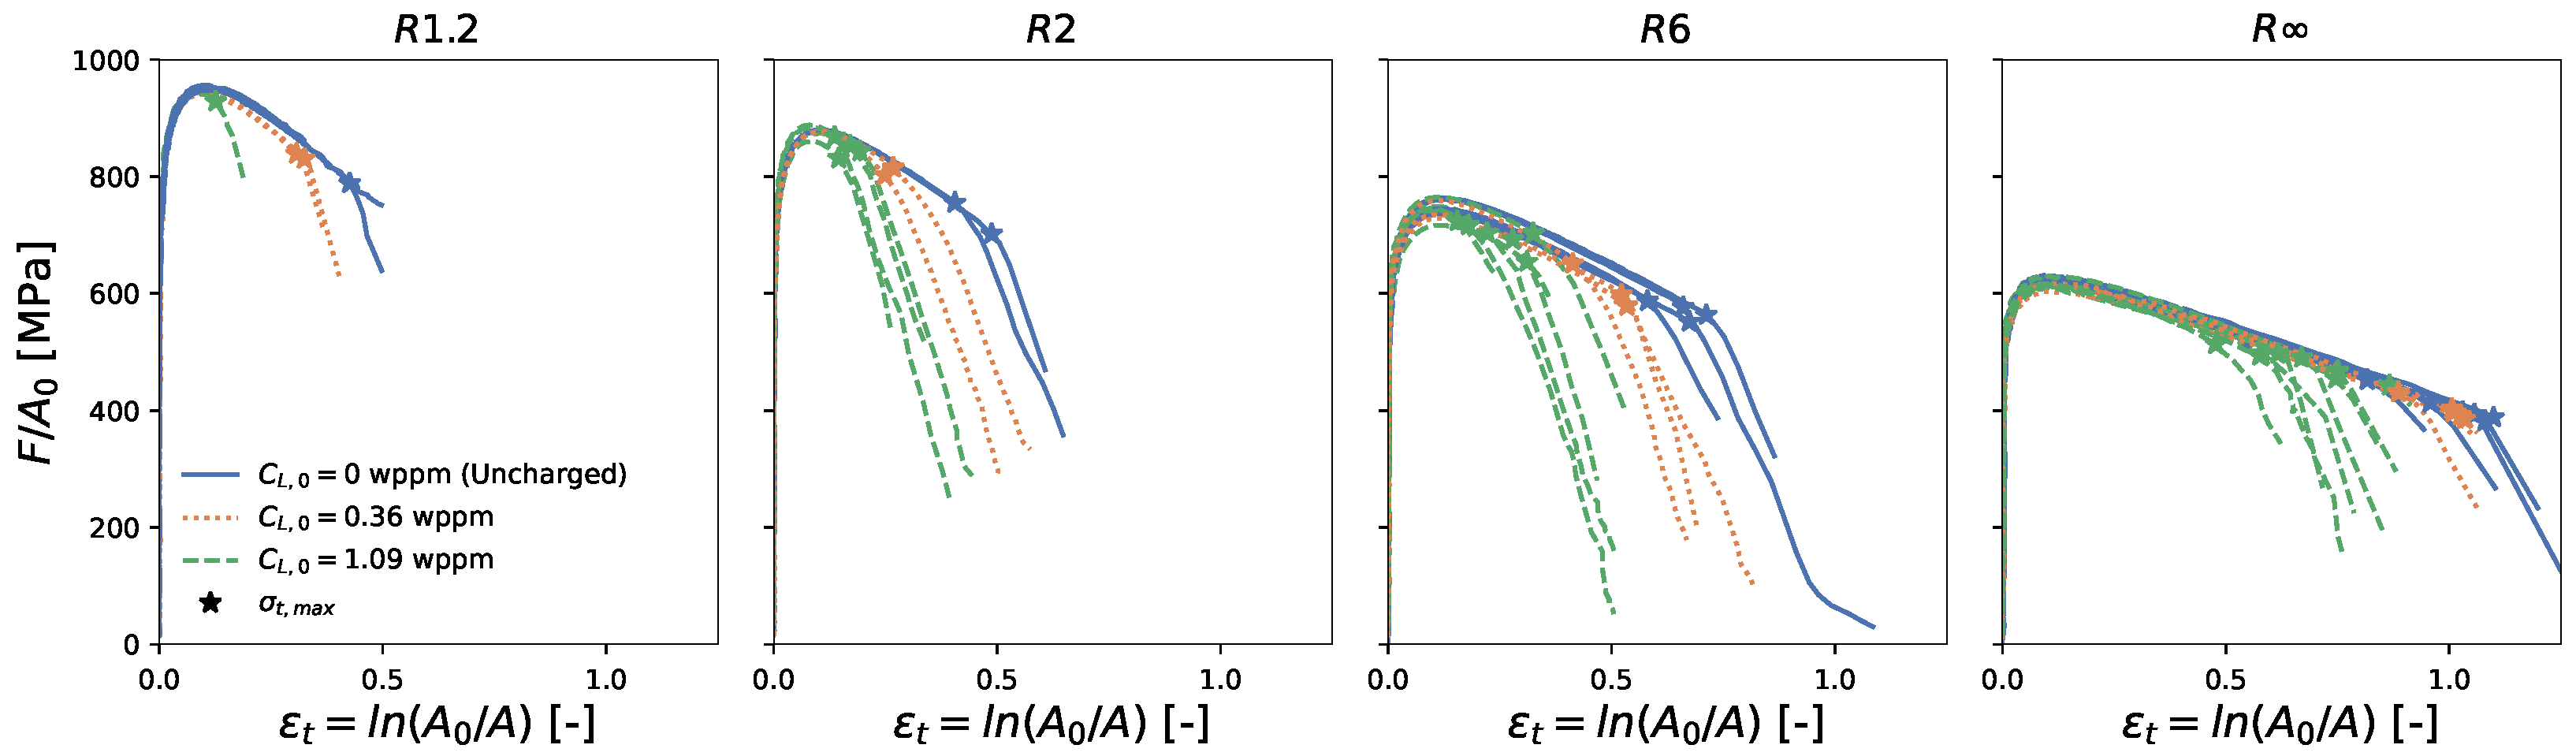
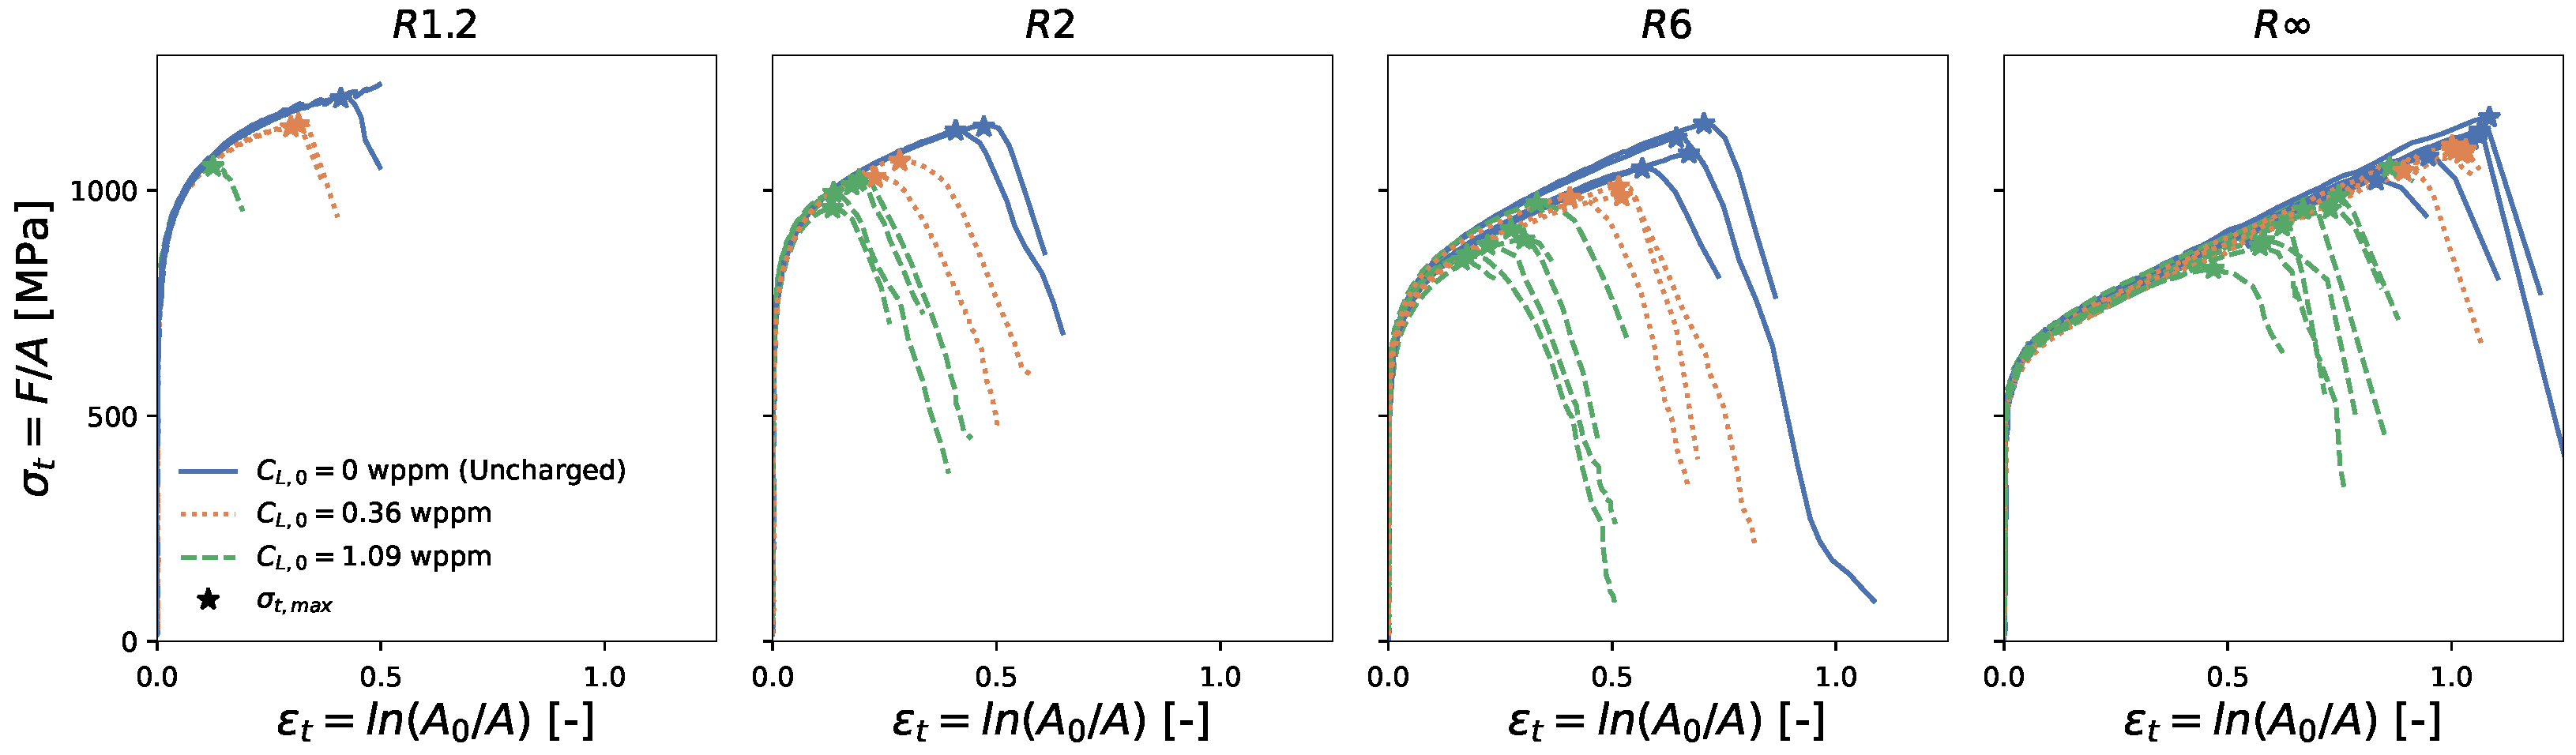
2.3.1. Macro-Mechanical Responses
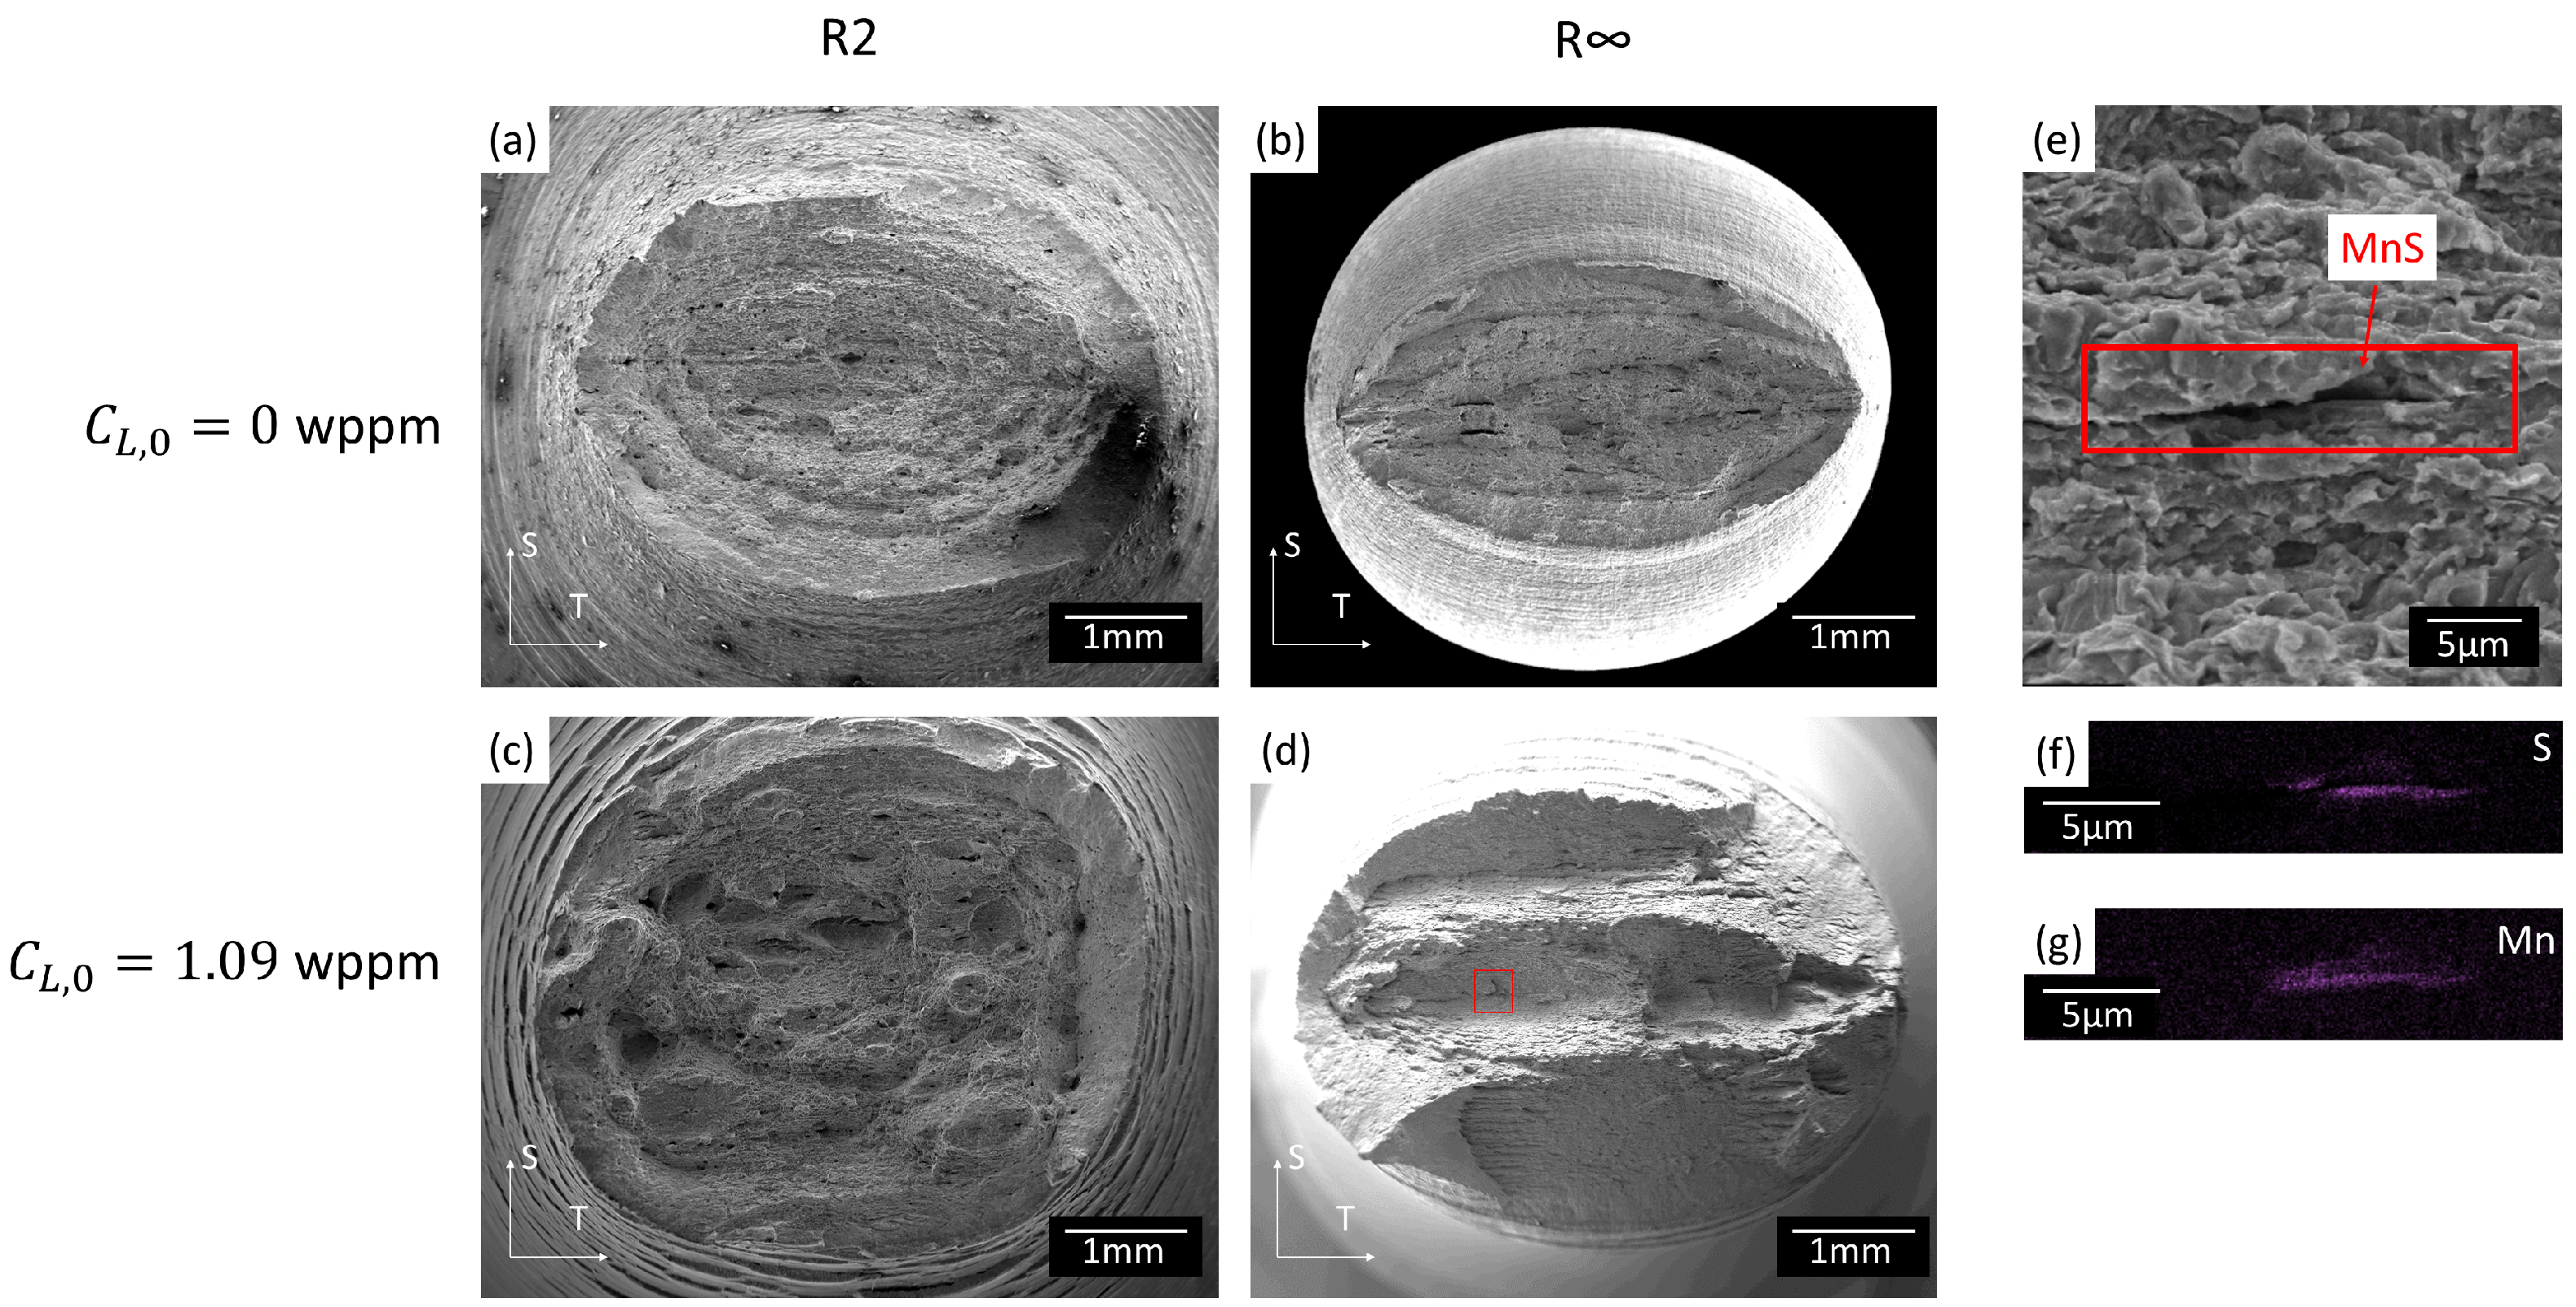
2.3.2. Failure Mechanisms
3. Numerical Method
3.1. Hydrogen-Informed Gurson Model
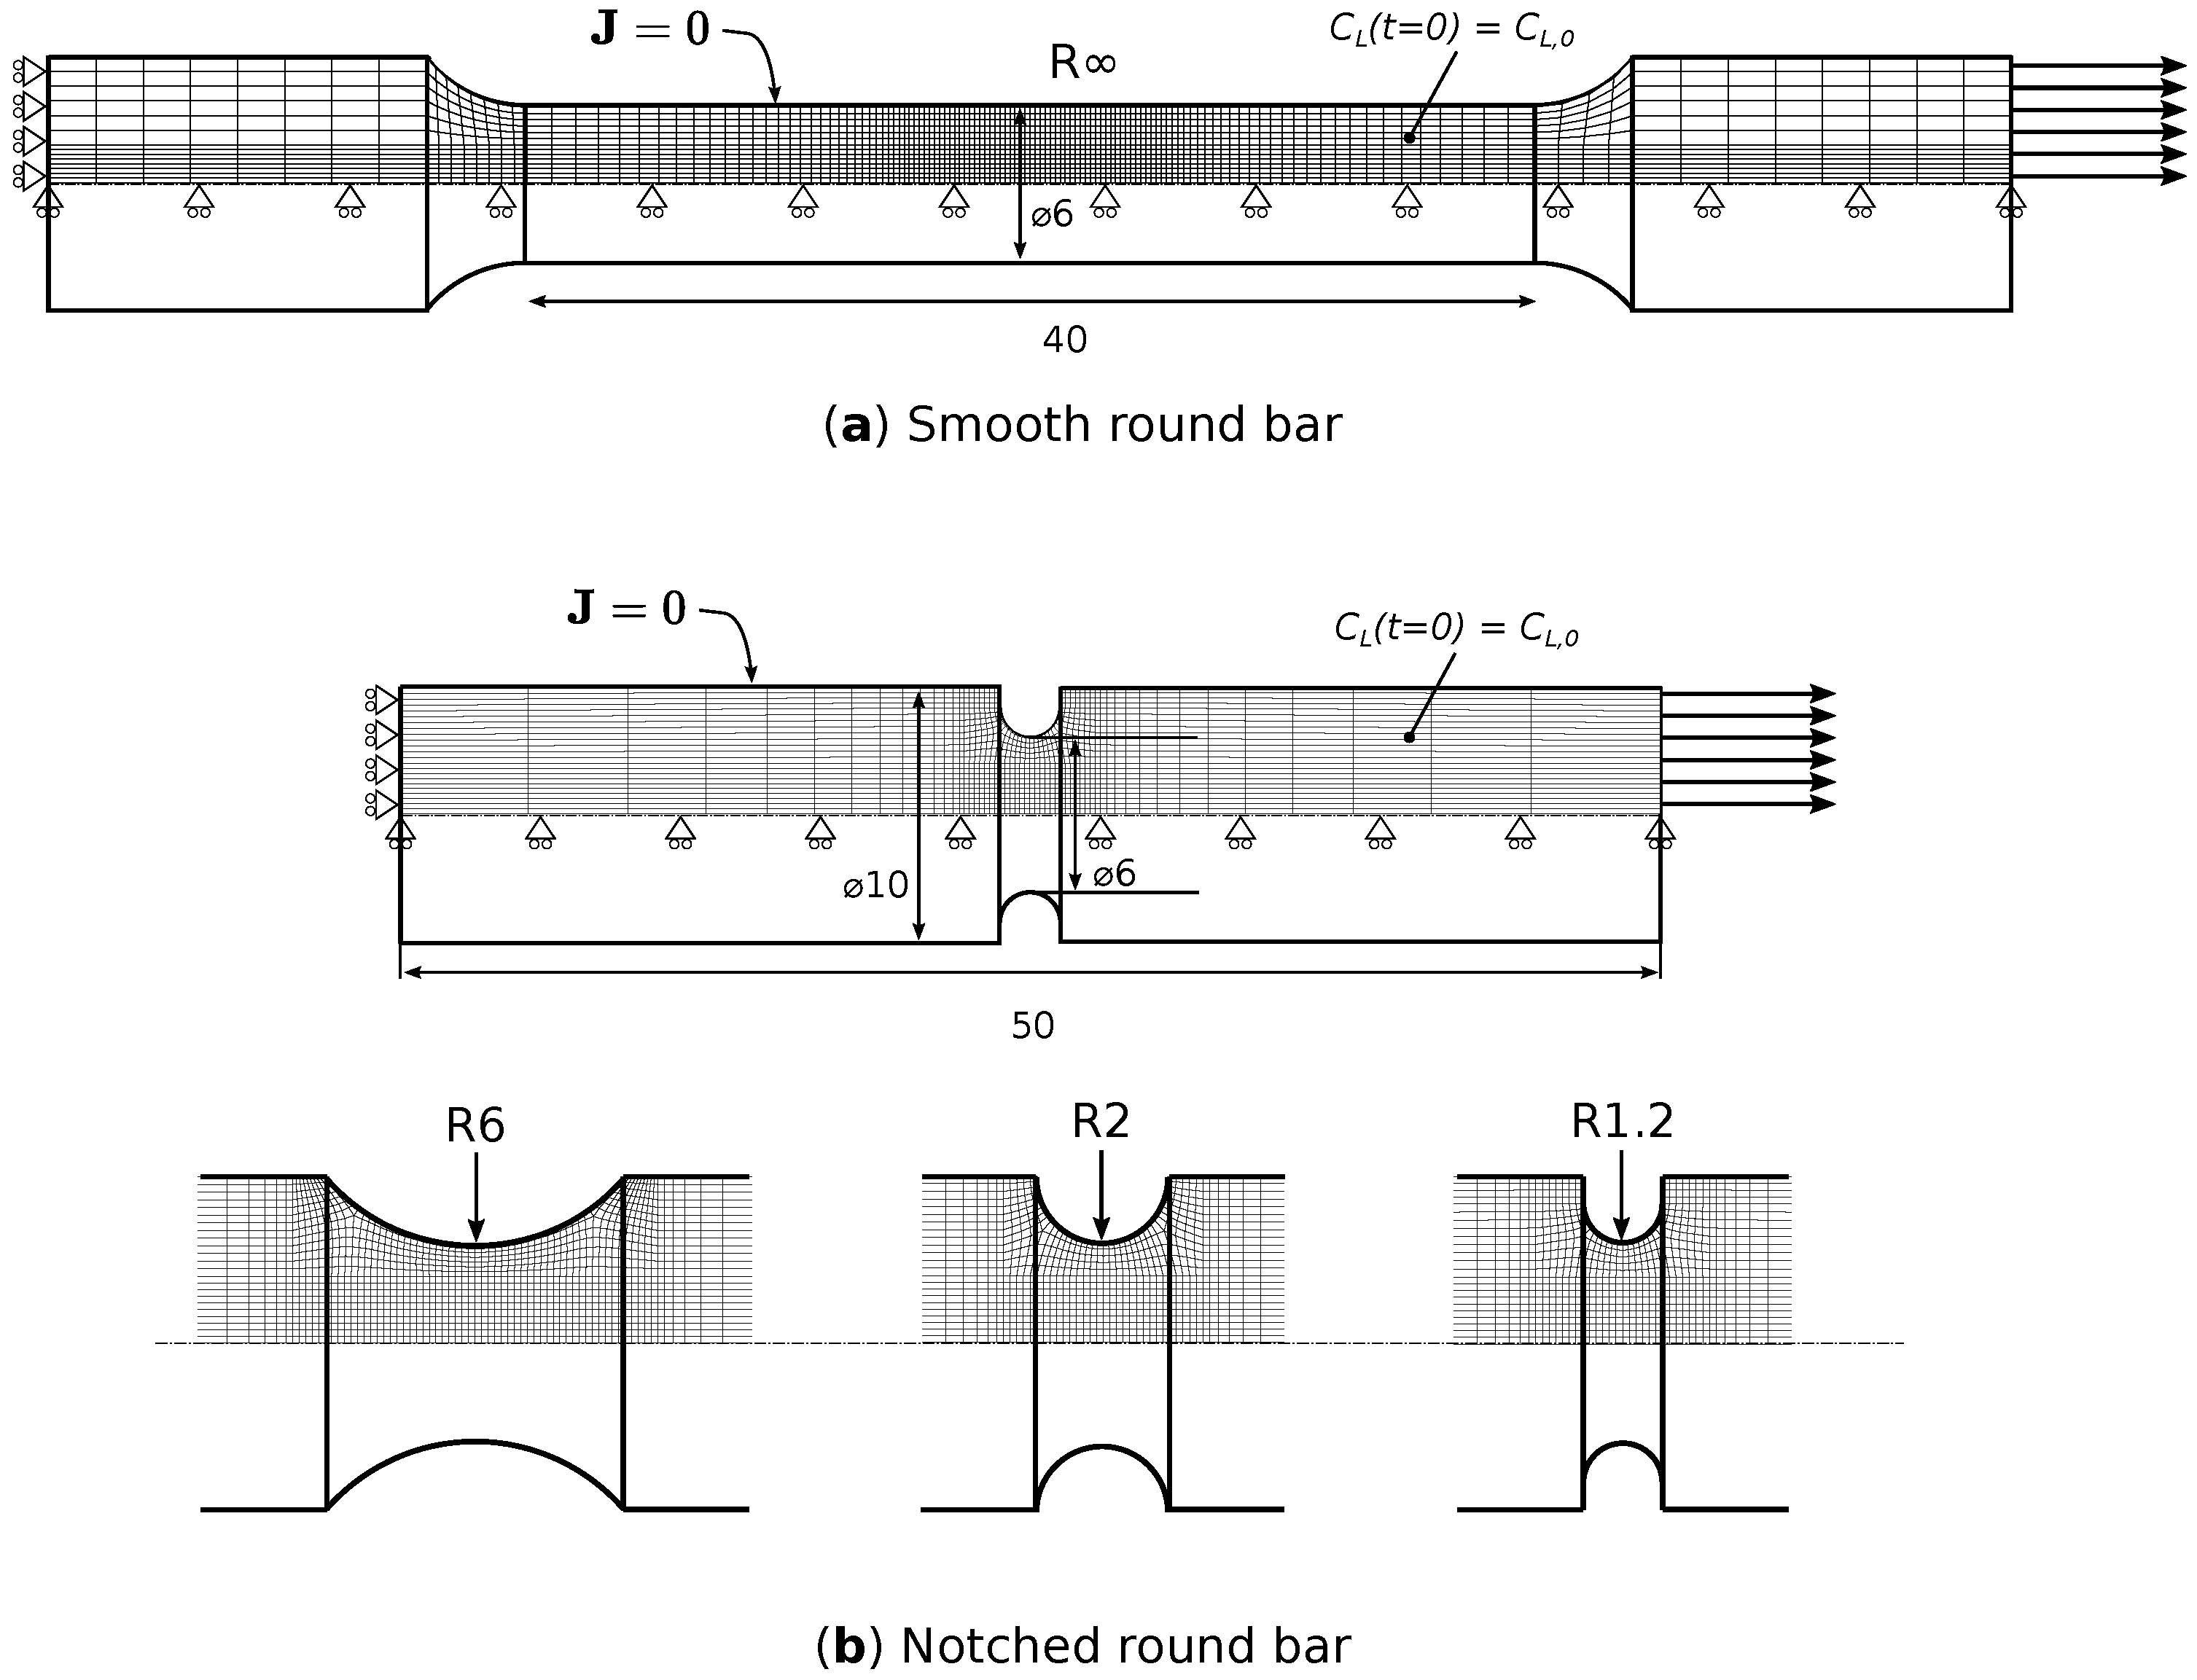
3.2. Finite Element (FE) Models
3.3. Calibration Procedure
4. Results and Discussion
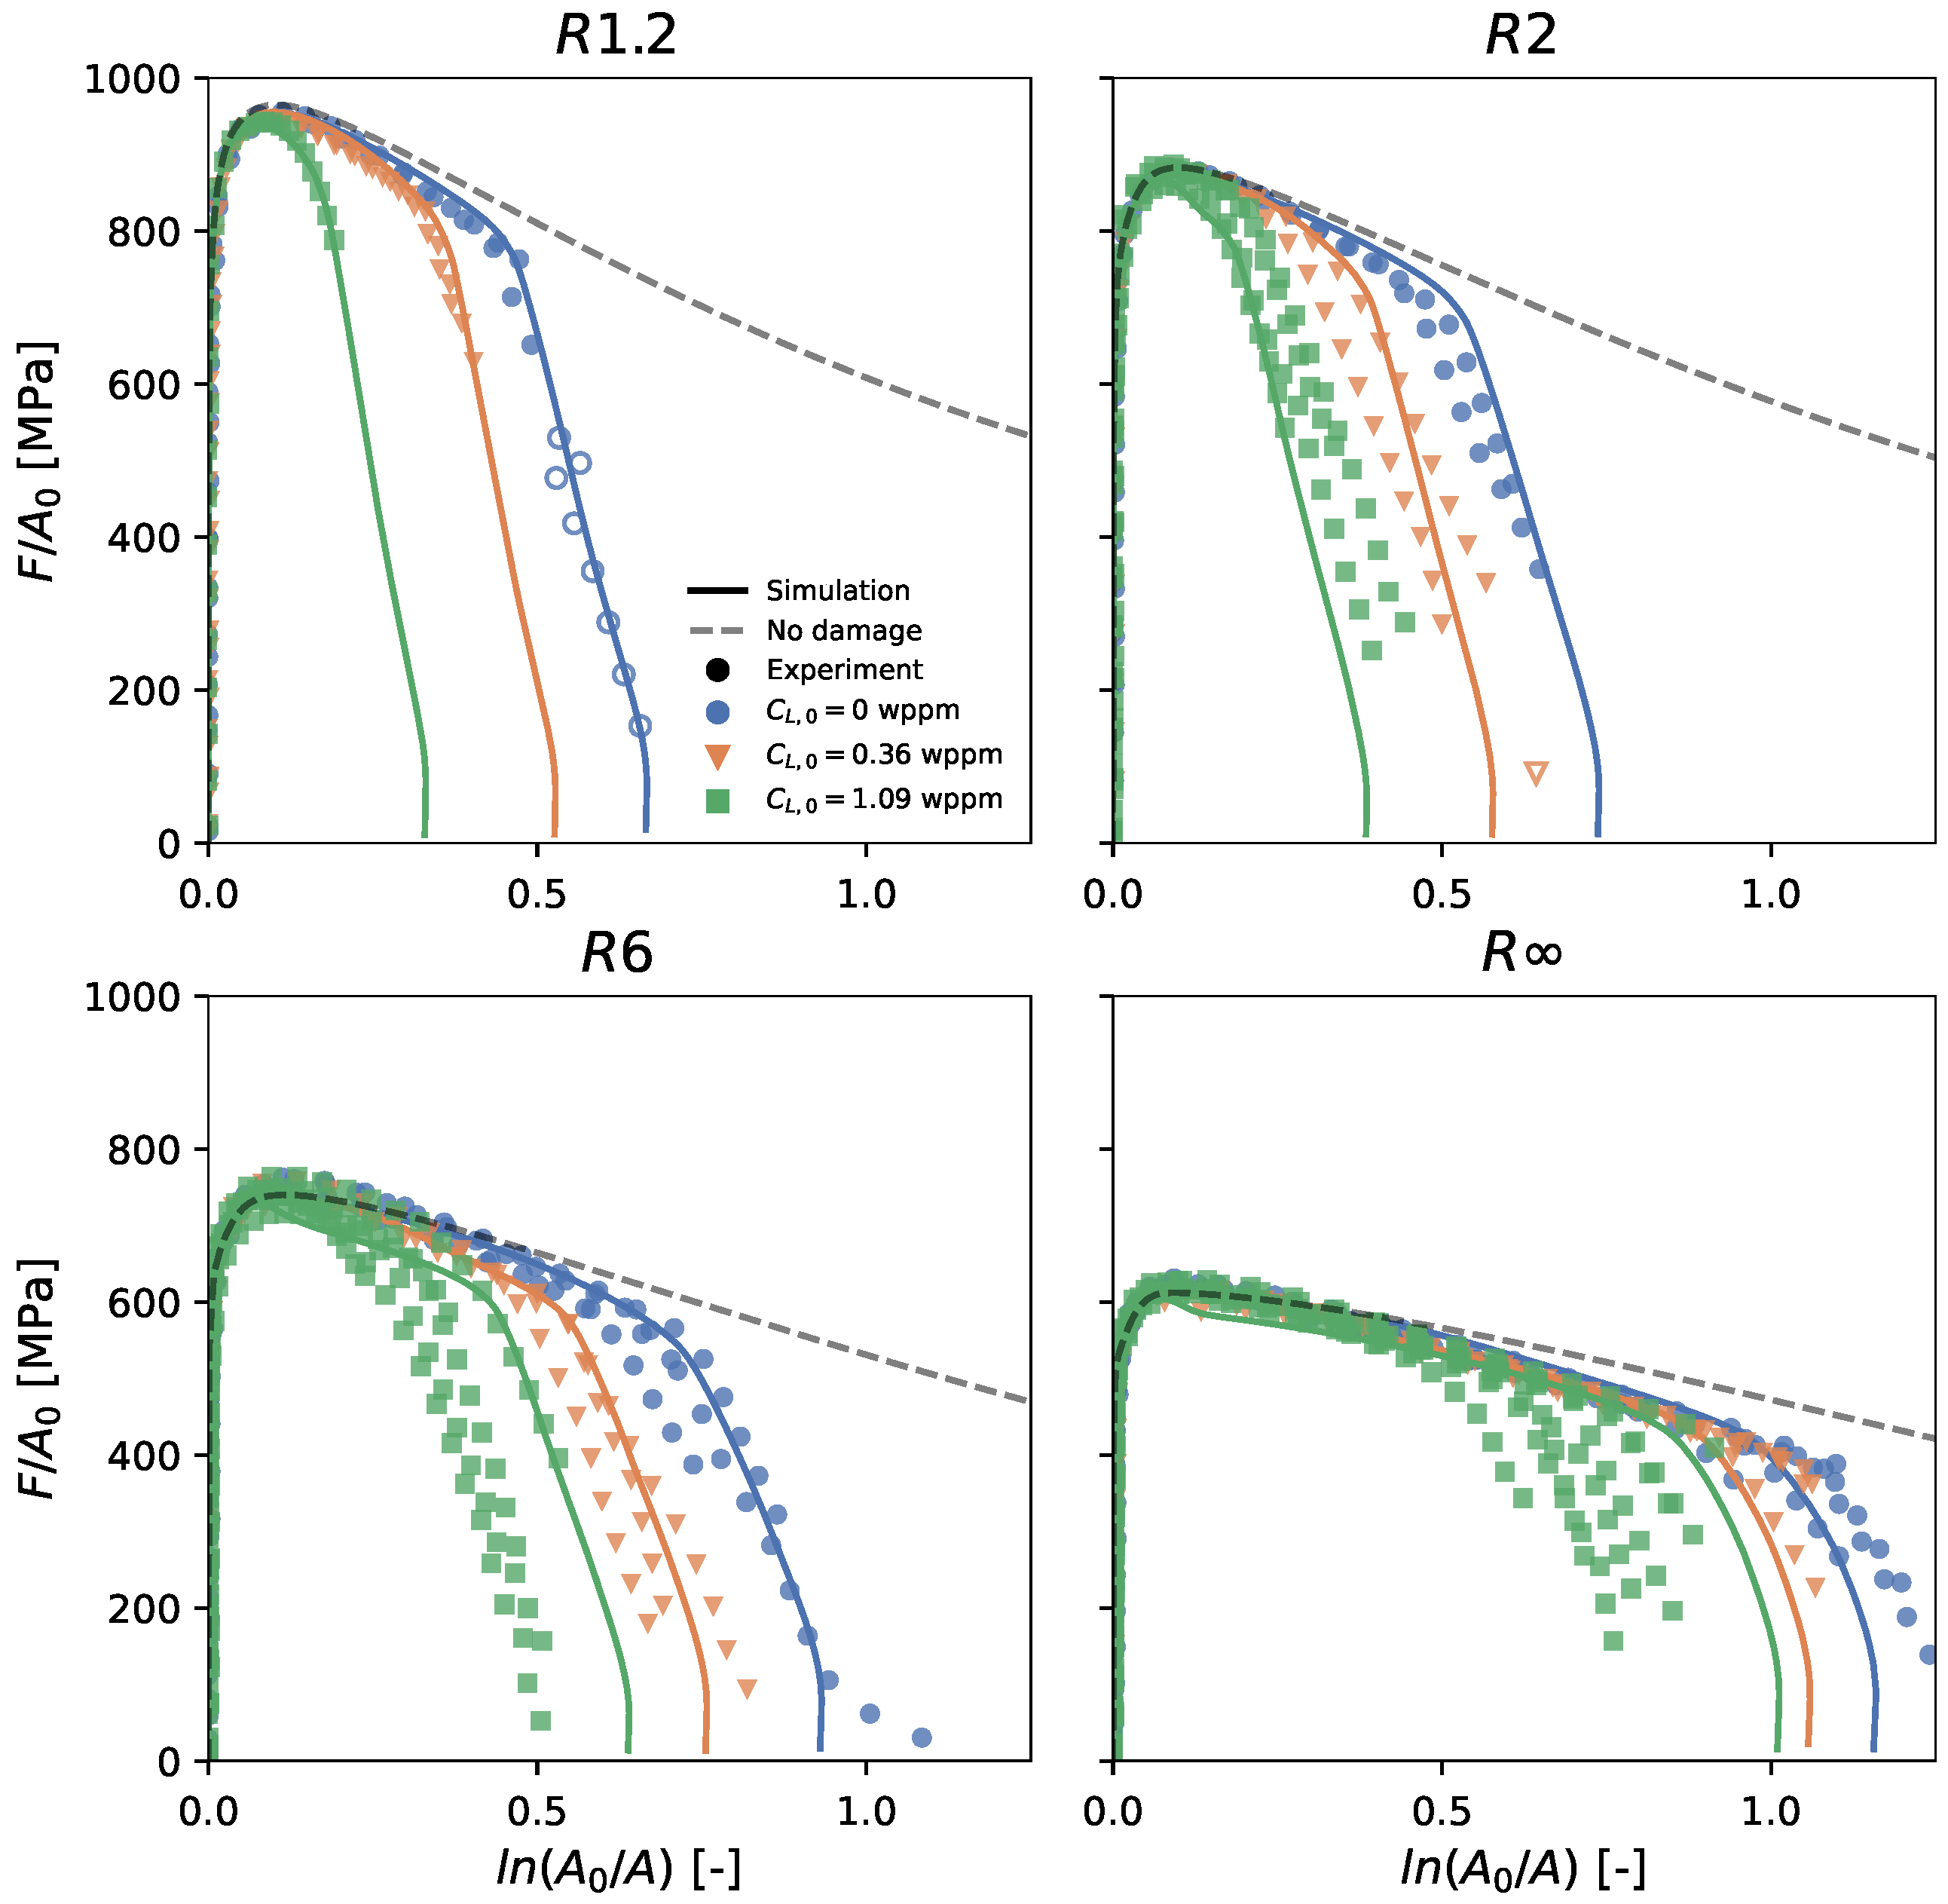
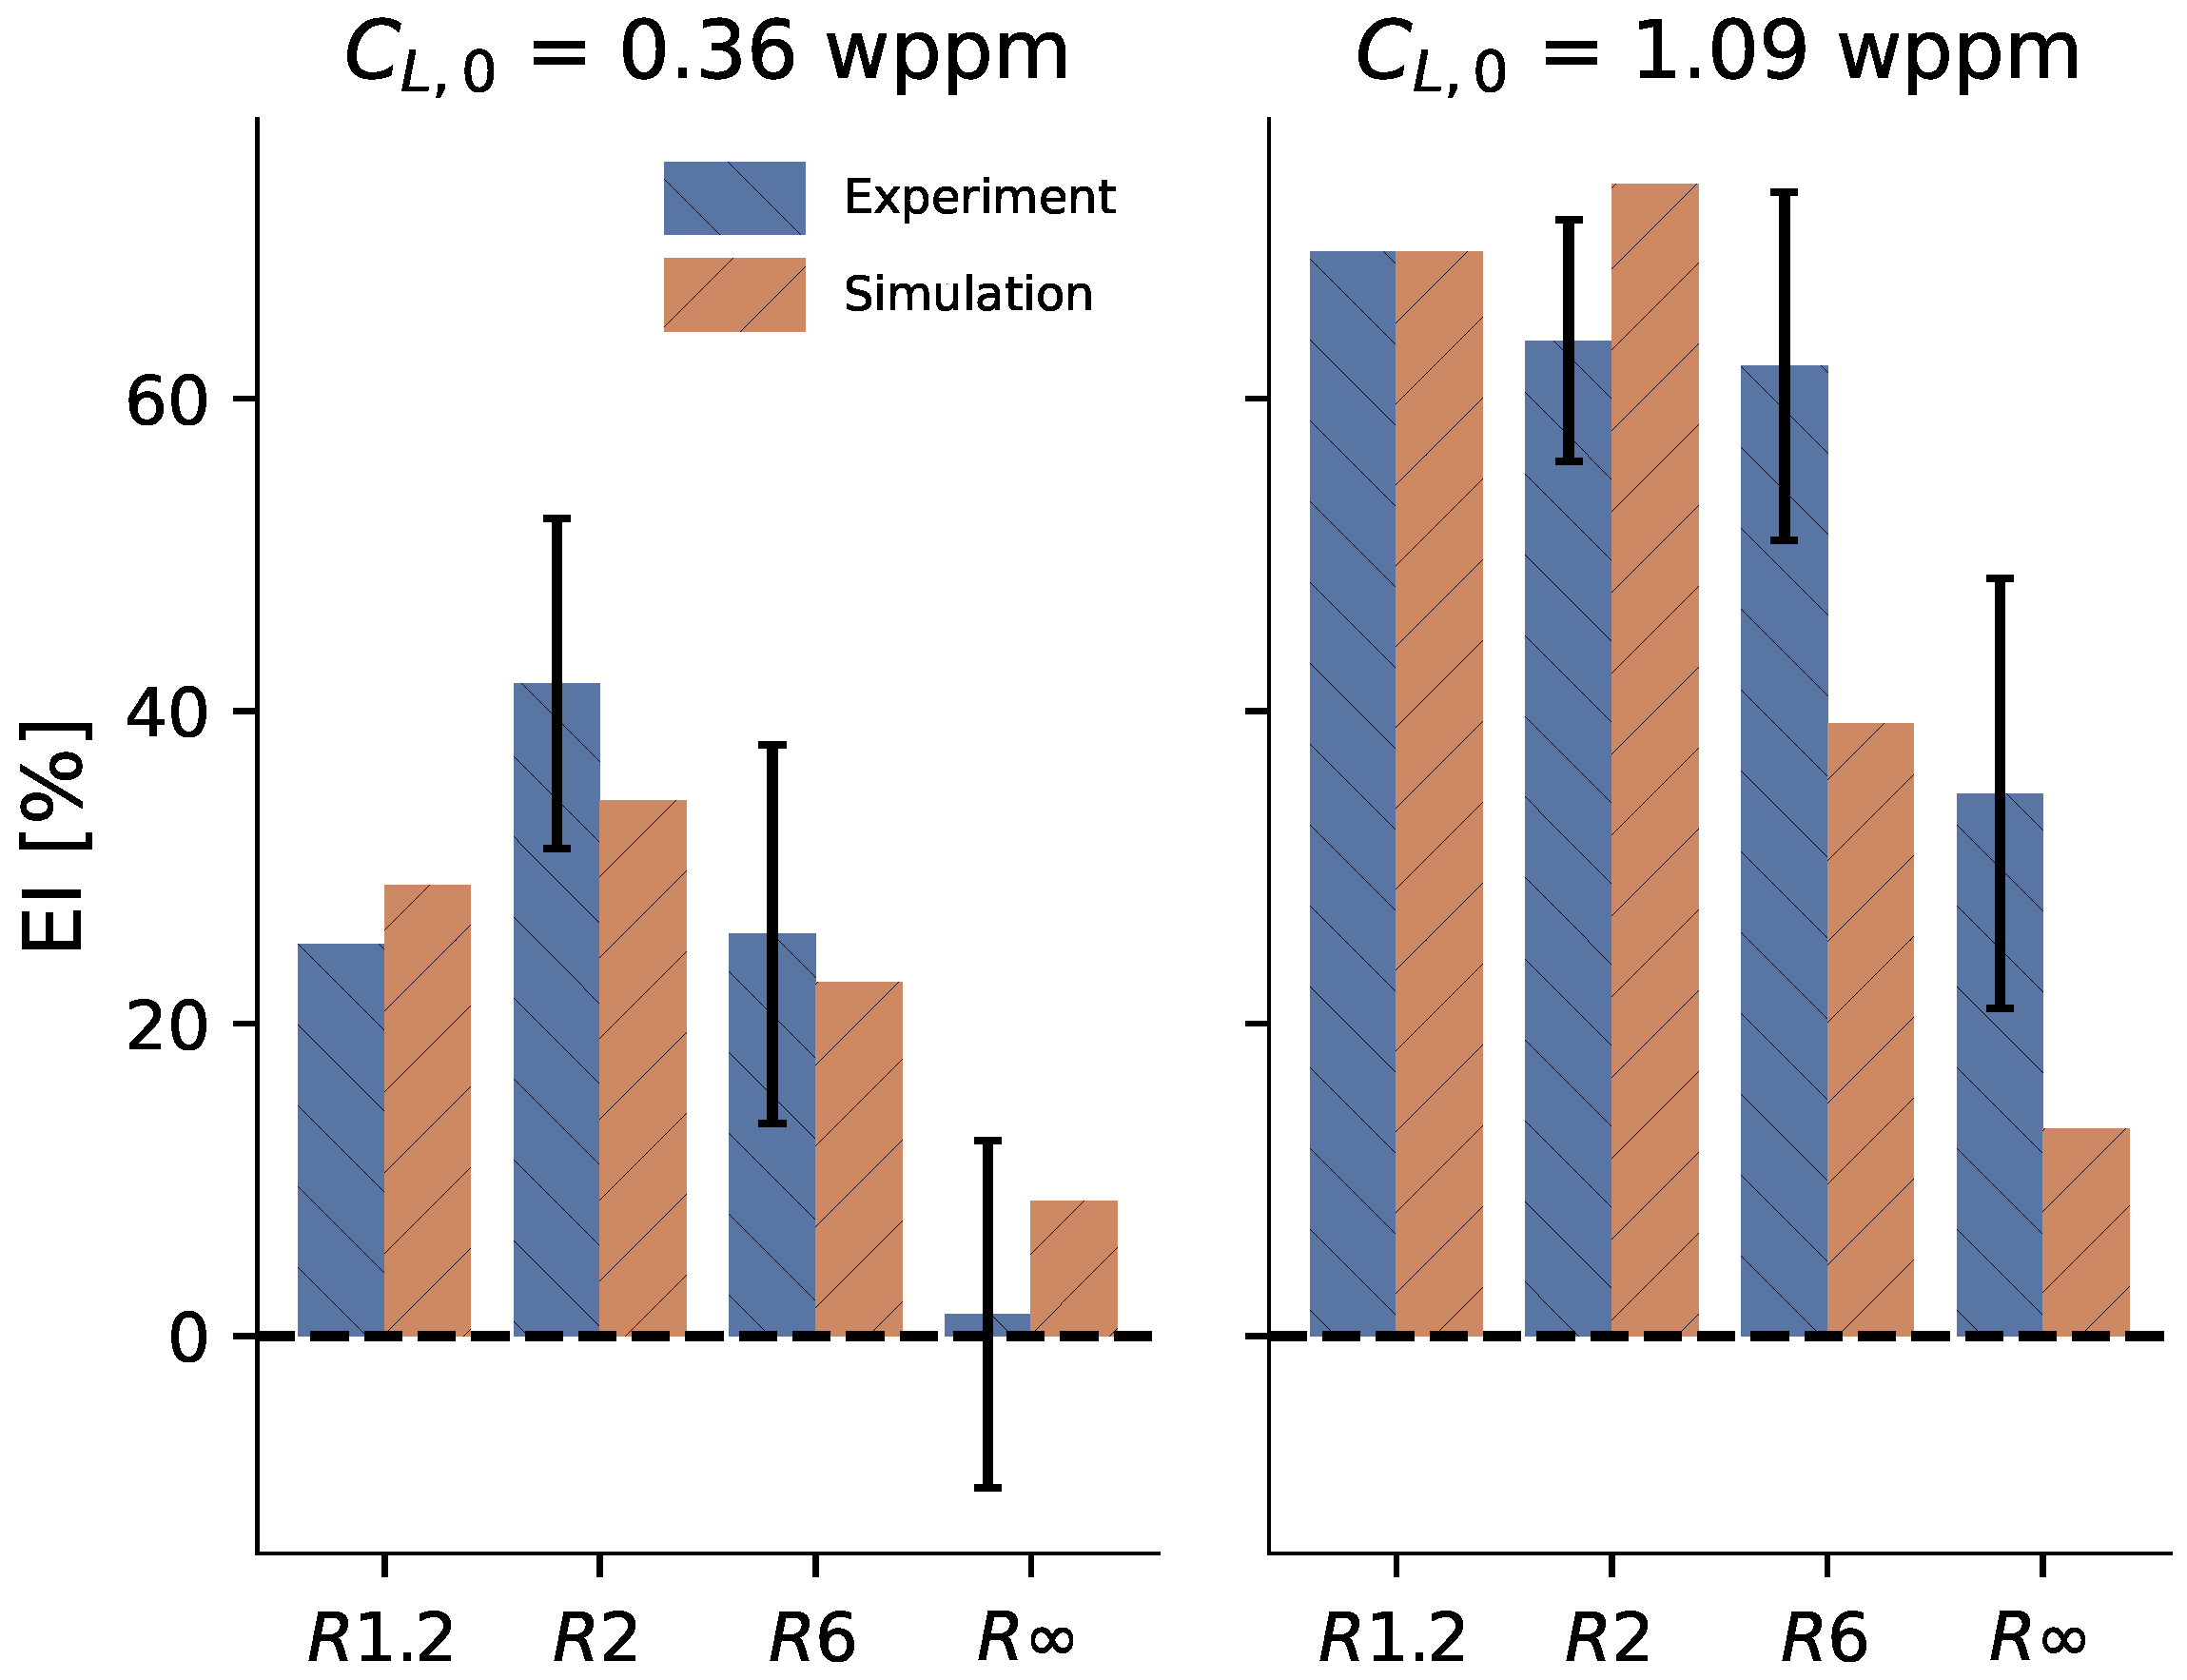
4.1. Agreement with Experiments
4.2. Fracture Locus
5. Conclusions
Author Contributions
Funding
Data Availability Statement
Acknowledgments
Conflicts of Interest
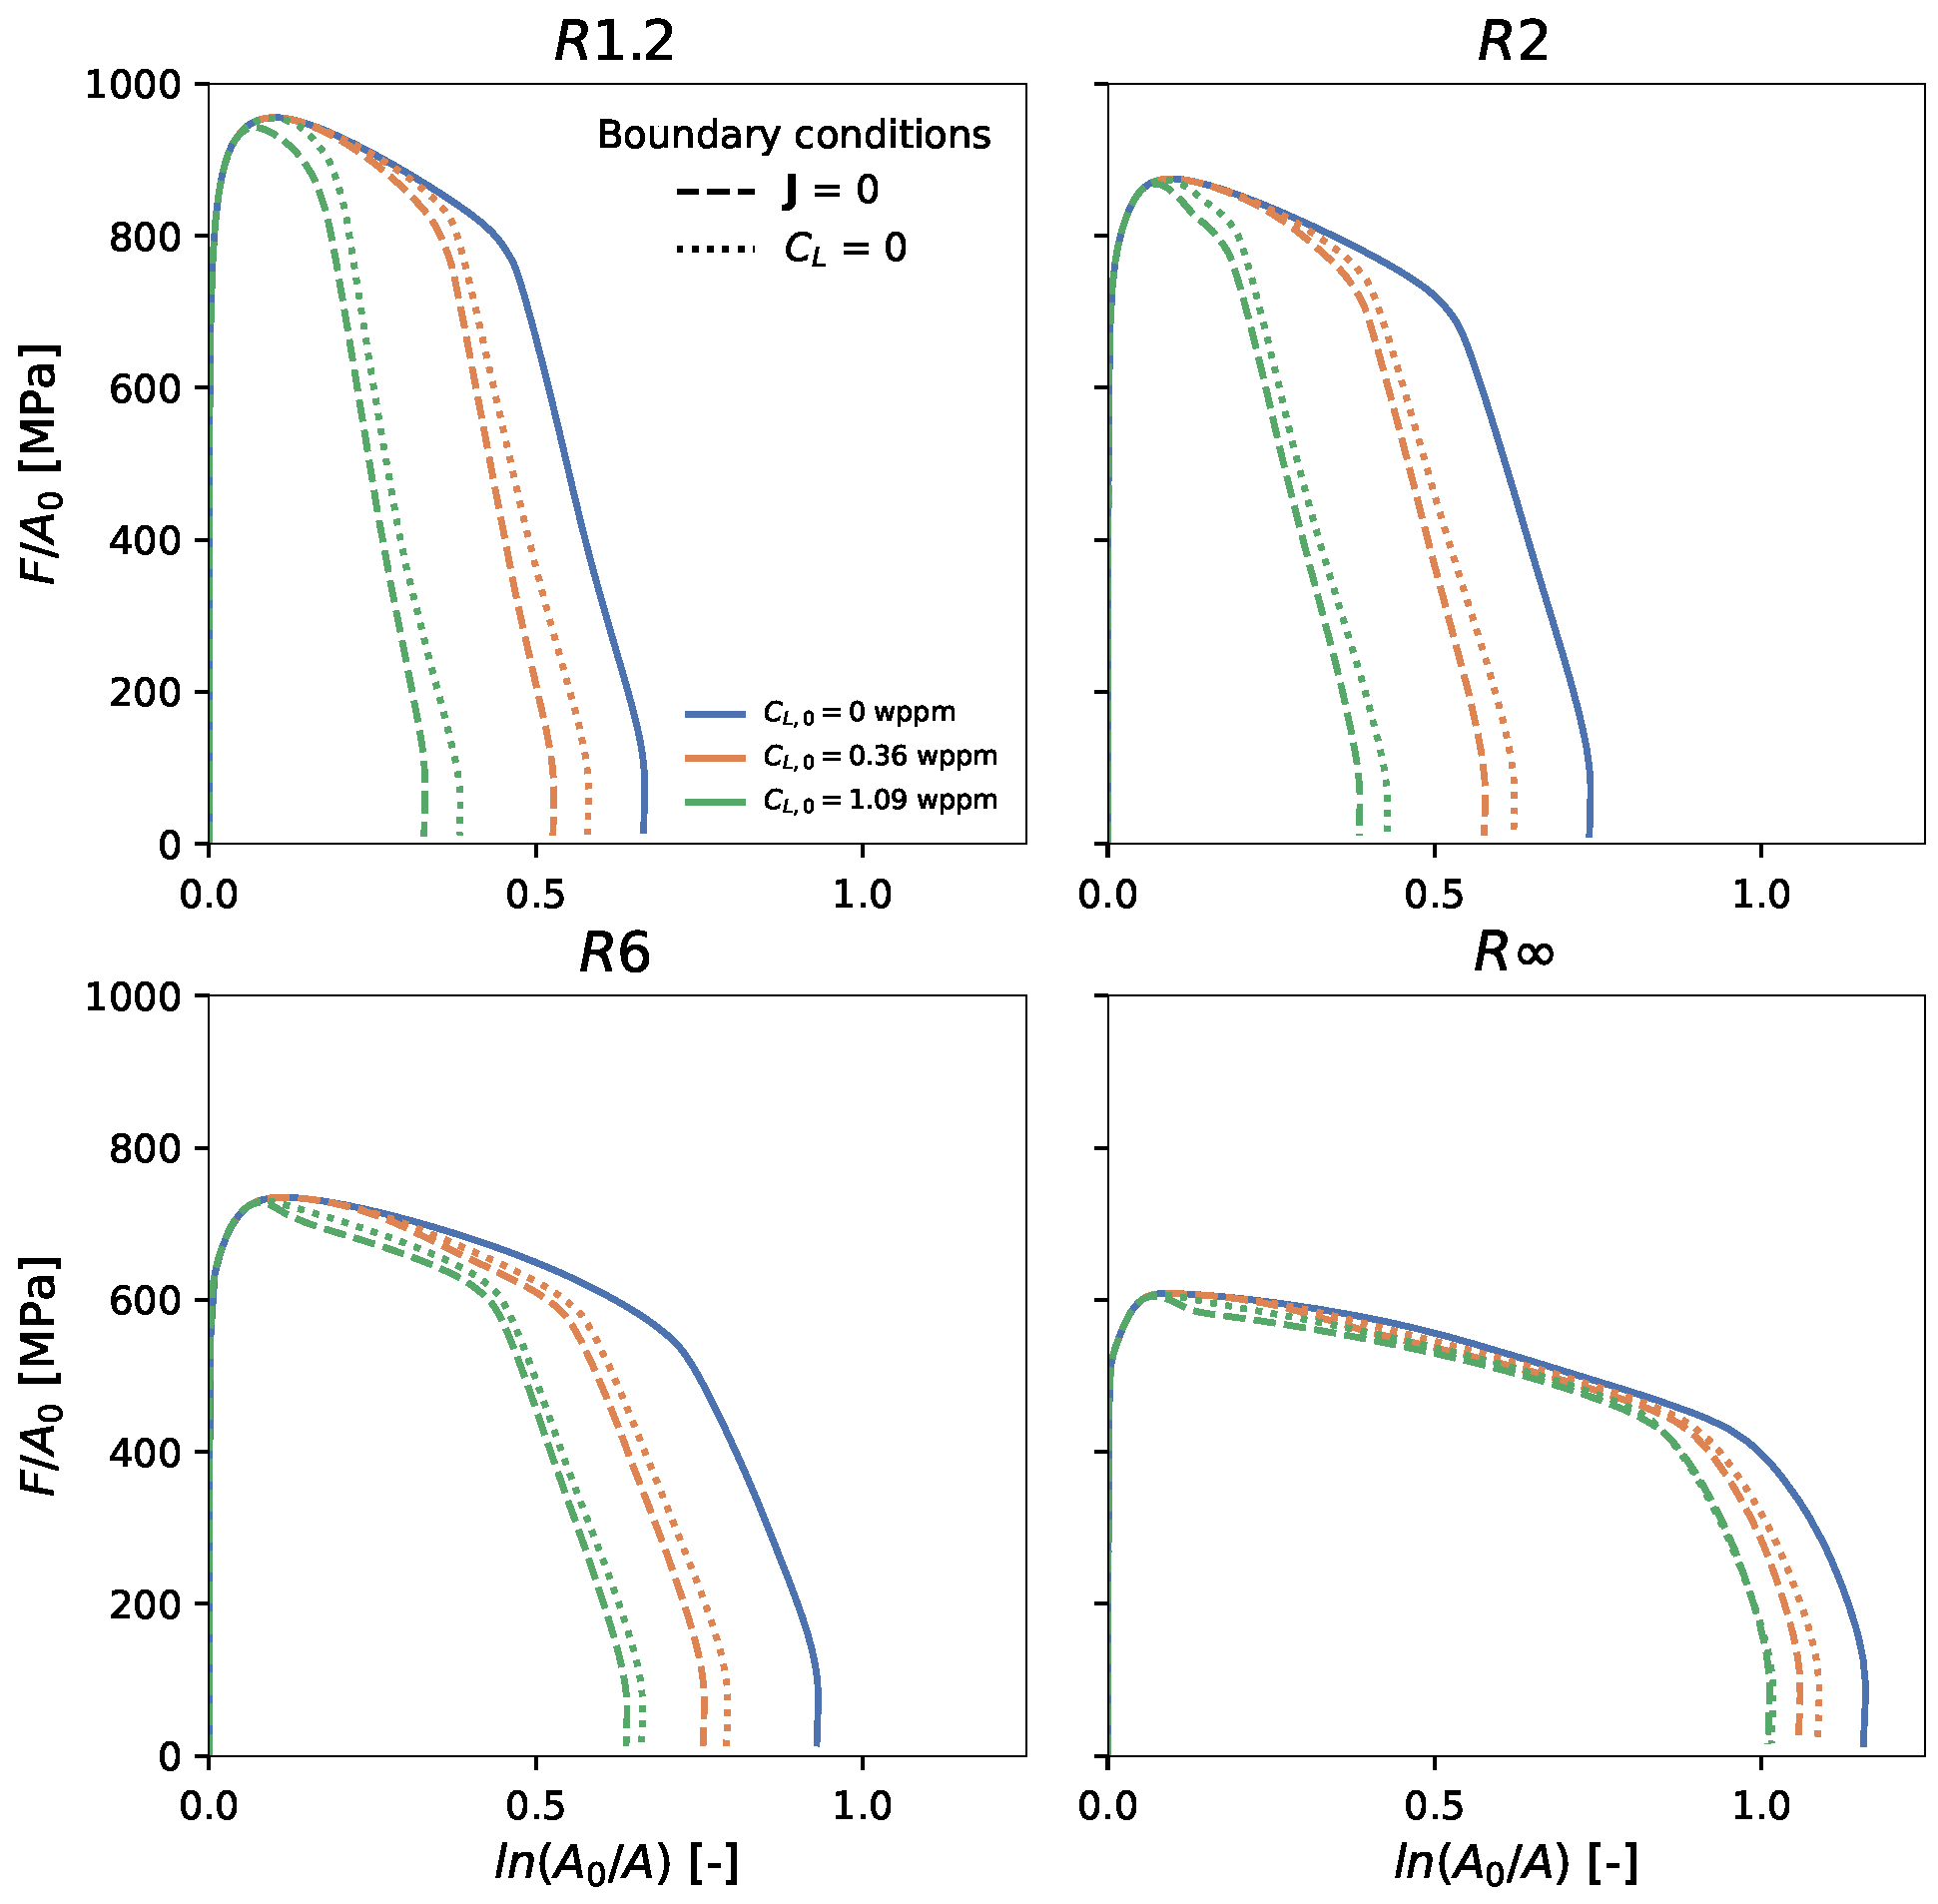
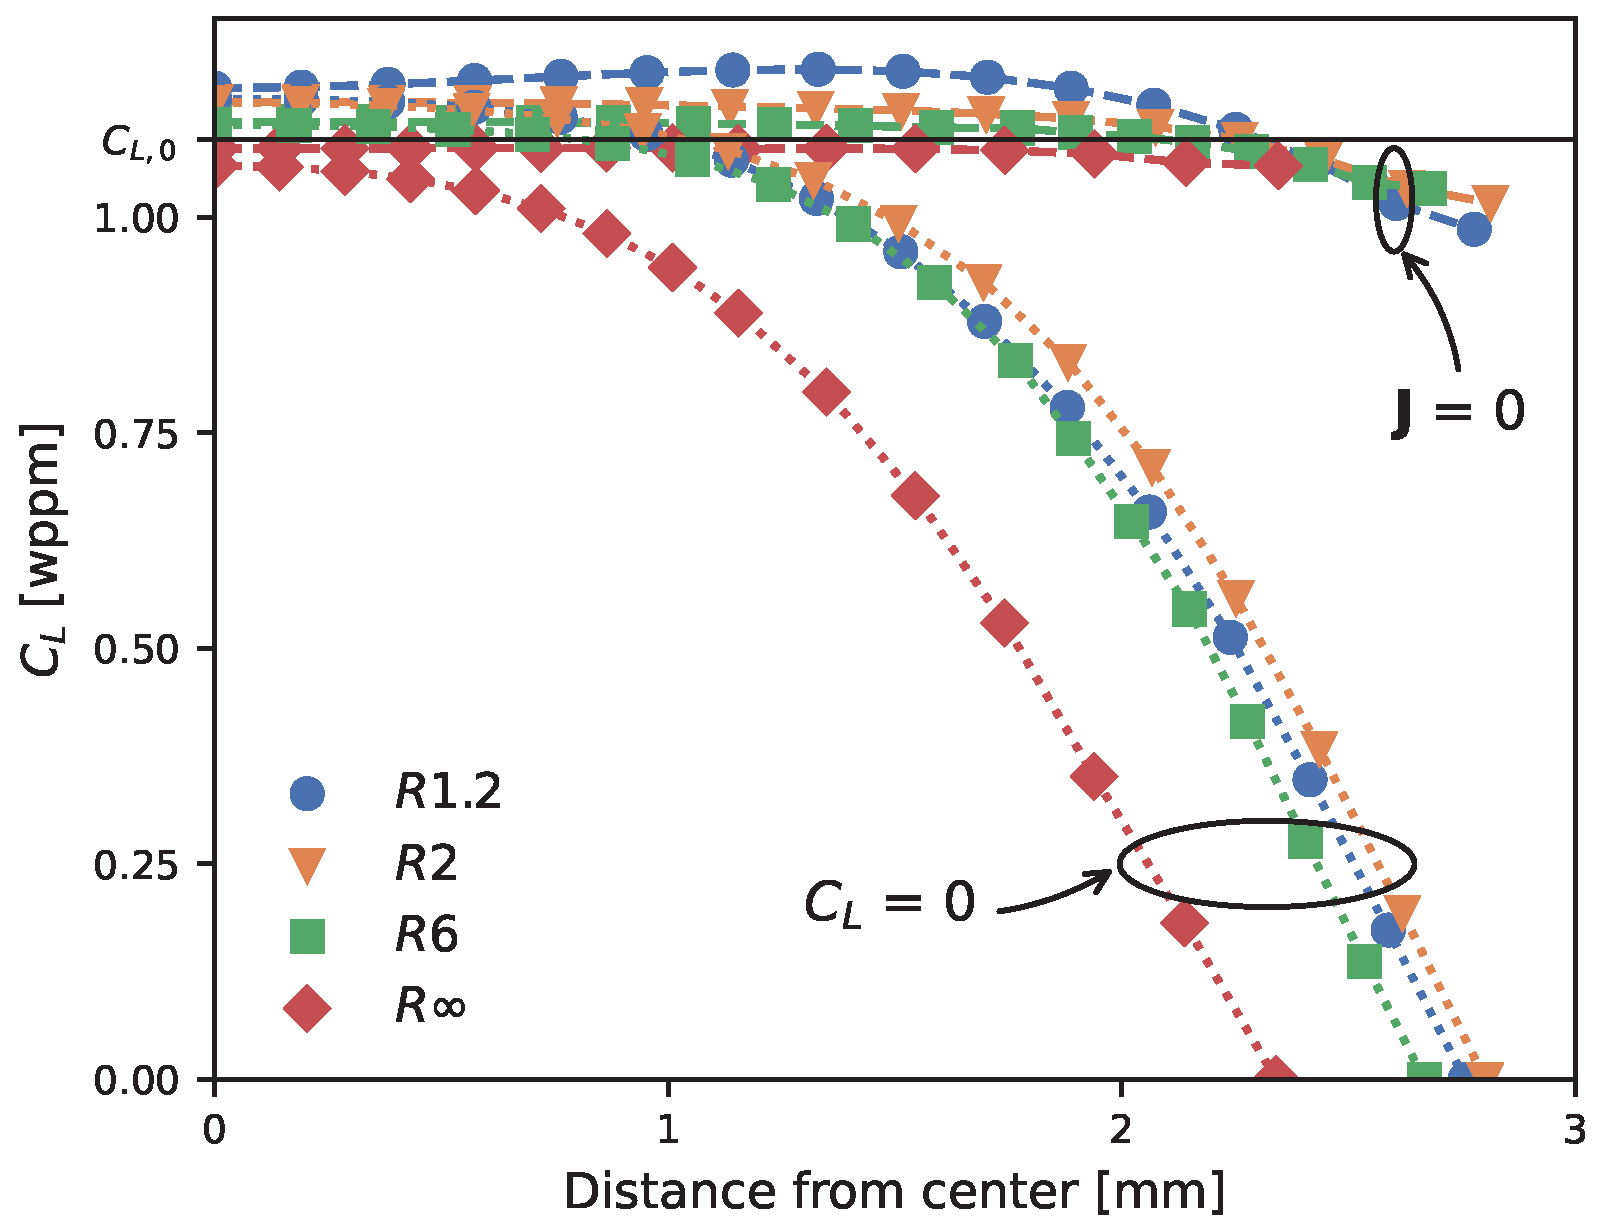
Appendix A. Effect of Hydrogen-Related Boundary Condition on Results


References
- European Commission. A Hydrogen Strategy for a Climate-Neutral Europe (52020DC0301); Technical Report; European Commission 2020. Available online: https://eur-lex.europa.eu/legal-content/EN/TXT/?uri=CELEX:52020DC0301 (accessed on 3 February 2023).
- Johnson, W. On some remarkable changes produced in iron and steel by the action of hydrogen and acids. Proc. R. Soc. Lond. 1875, 23, 168–179. Available online: https://royalsocietypublishing.org/doi/10.1098/rspl.1874.0024 (accessed on 3 February 2023).
- Laureys, A.; Depraetere, R.; Cauwels, M.; Depover, T.; Hertelé, S.; Verbeken, K. Use of existing steel pipeline infrastructure for gaseous hydrogen storage and transport: A review of factors affecting hydrogen induced degradation. J. Nat. Gas Sci. Eng. 2022, 101, 104534. [Google Scholar] [CrossRef]
- Traidia, A.; Chatzidouros, E.V.; Jouiad, M. Review of hydrogen-assisted cracking models for application to service lifetime prediction and challenges in the oil and gas industry. Corros. Rev. 2018, 36, 323–347. [Google Scholar] [CrossRef]
- Besson, J. Continuum Models of Ductile Fracture: A Review. Int. J. Damage Mech. 2010, 19, 3–52. [Google Scholar] [CrossRef] [Green Version]
- Pineau, A.; Benzerga, A.A.; Pardoen, T. Failure of metals I: Brittle and ductile fracture. Acta Mater. 2016, 107, 424–483. [Google Scholar] [CrossRef] [Green Version]
- Boyce, B.L.; Kramer, S.L.; Bosiljevac, T.R.; Corona, E.; Moore, J.A.; Elkhodary, K.; Simha, C.H.; Williams, B.W.; Cerrone, A.R.; Nonn, A.; et al. The second Sandia Fracture Challenge: Predictions of ductile failure under quasi-static and moderate-rate dynamic loading. Int. J. Fract. 2016, 198, 5–100. [Google Scholar] [CrossRef] [Green Version]
- Paredes, M.; Wierzbicki, T.; Zelenak, P. Prediction of crack initiation and propagation in X70 pipeline steels. Eng. Fract. Mech. 2016, 168, 92–111. [Google Scholar] [CrossRef]
- Nonn, A.; Kalwa, C. Simulation of ductile crack propagation in high-strength pipeline steel using damage models. Proc. Bienn. Int. Pipeline Conf. IPC 2012, 3, 597–603. [Google Scholar] [CrossRef]
- Kristensen, P.K.; Niordson, C.F.; Martínez-Pañeda, E. Applications of phase field fracture in modelling hydrogen assisted failures. Theor. Appl. Fract. Mech. 2020, 110, 102837. [Google Scholar] [CrossRef]
- Brinnel, V.; Schaffrath, S.; Münstermann, S.; Feldmann, M. Efficient, scale-bridging simulation of ductile failure in a burst test using damage mechanics. Int. J. Press. Vessel. Pip. 2020, 188, 104242. [Google Scholar] [CrossRef]
- Huang, S.; Hui, H. Predictive environmental hydrogen embrittlement on fracture toughness of commercial ferritic steels with hydrogen-modified fracture strain model. Int. J. Hydrogen Energy 2022, 47, 10777–10787. [Google Scholar] [CrossRef]
- Lynch, S.P. Hydrogen embrittlement (HE) phenomena and mechanisms. In Stress Corrosion Cracking: Theory and Practice; Woodhead Publishing Series in Metals and Surface Engineering; Woodhead Publishing: Cambridge, UK, 2011; pp. 90–130. Available online: https://www.sciencedirect.com/science/article/abs/pii/B978184569673350002X?via%3Dihub (accessed on 3 February 2023).
- Djukic, M.B.; Bakic, G.M.; Sijacki Zeravcic, V.; Sedmak, A.; Rajicic, B. The synergistic action and interplay of hydrogen embrittlement mechanisms in steels and iron: Localized plasticity and decohesion. Eng. Fract. Mech. 2019, 216, 106528. [Google Scholar] [CrossRef]
- Martin, M.L.; Dadfarnia, M.; Nagao, A.; Wang, S.; Sofronis, P. Enumeration of the hydrogen-enhanced localized plasticity mechanism for hydrogen embrittlement in structural materials. Acta Mater. 2019, 165, 734–750. [Google Scholar] [CrossRef]
- Nagumo, M.; Takai, K. The predominant role of strain-induced vacancies in hydrogen embrittlement of steels: Overview. Acta Mater. 2019, 165, 722–733. [Google Scholar] [CrossRef]
- Robertson, I.M.; Sofronis, P.; Nagao, A.; Martin, M.L.; Wang, S.; Gross, D.W.; Nygren, K.E. Hydrogen Embrittlement Understood. Metall. Mater. Trans. Process. Metall. Mater. Process. Sci. 2015, 46, 1085–1103. [Google Scholar] [CrossRef] [Green Version]
- Martínez-Pañeda, E.; Del Busto, S.; Niordson, C.F.; Betegón, C. Strain gradient plasticity modeling of hydrogen diffusion to the crack tip. Int. J. Hydrogen Energy 2016, 41, 10265–10274. [Google Scholar] [CrossRef] [Green Version]
- Huang, S.; Zhang, Y.; Yang, C.; Hu, H. Fracture strain model for hydrogen embrittlement based on hydrogen enhanced localized plasticity mechanism. Int. J. Hydrogen Energy 2020, 45, 25541–25554. [Google Scholar] [CrossRef]
- Asadipoor, M.; Kadkhodapour, J.; Pourkamali Anaraki, A.; Sharifi, S.M.; Darabi, A.C.; Barnoush, A. Experimental and Numerical Investigation of Hydrogen Embrittlement Effect on Microdamage Evolution of Advanced High-Strength Dual-Phase Steel. Met. Mater. Int. 2020, 27, 2276–2291. [Google Scholar] [CrossRef]
- Youn, G.G.; Kim, Y.J.; Kim, J.S.; Lam, P.S. A Fracture Strain Based Numerical Prediction Method for Hydrogen Effect on Fracture Toughness. Int. J. Mech. Sci. 2021, 202–203, 106492. [Google Scholar] [CrossRef]
- Pfuff, M.; Dietzel, W. Mesoscale modeling of hydrogen assisted crack growth in heterogeneous materials. In Proceedings of the 11th International Conference on Fracture 2005, ICF11, Turin, Italy, 20–25 March 2005; Volume 5, pp. 3366–3370. [Google Scholar]
- Kim, N.H.; Oh, C.S.; Kim, Y.J.; Yoon, K.B.; Ma, Y.W. Hydrogen-assisted stress corrosion cracking simulation using the stress-modified fracture strain model. J. Mech. Sci. Technol. 2012, 26, 2631–2638. [Google Scholar] [CrossRef]
- Kwon, D.I.; Asaro, R.J. Hydrogen-assisted ductile fracture in spheroidized 1518 steel. Acta Metall. Mater. 1990, 38, 1595–1606. [Google Scholar] [CrossRef]
- Cayón, A.; Gutiérrez-Solana, F.; Arroyo, B.; Álvarez, J. Hydrogen Embrittlement Processes in Microalloyed Steel Notched Tensile Samples. Theor. Appl. Fract. Mech. 2020, 112, 102878. [Google Scholar] [CrossRef]
- Nguyen, T.T.; Tak, N.; Park, J.; Nahm, S.H.; Beak, U.B. Hydrogen embrittlement susceptibility of X70 pipeline steel weld under a low partial hydrogen environment. Int. J. Hydrogen Energy 2020, 45, 23739–23753. [Google Scholar] [CrossRef]
- Bal, B.; Çetin, B.; Bayram, F.C.; Billur, E. Effect of hydrogen on fracture locus of Fe–16Mn–0.6C–2.15Al TWIP steel. Int. J. Hydrogen Energy 2020, 45, 34227–34240. [Google Scholar] [CrossRef]
- Depraetere, R.; De Waele, W.; Cauwels, M.; Depover, T.; Verbeken, K.; Boone, M.; Hertelé, S. Influence of stress triaxiality on hydrogen assisted ductile damage in an X70 pipeline steel. Mater. Sci. Eng. A 2023, 864, 144549. [Google Scholar] [CrossRef]
- Yu, H.; Olsen, J.S.; He, J.; Zhang, Z. Hydrogen-microvoid interactions at continuum scale. Int. J. Hydrogen Energy 2018, 43, 10104–10128. [Google Scholar] [CrossRef]
- Nagumo, M. Hydrogen related failure of steels - A new aspect. Mater. Sci. Technol. 2004, 20, 940–950. [Google Scholar] [CrossRef]
- Yu, H.; Olsen, J.S.; Alvaro, A.; Qiao, L.; He, J.; Zhang, Z. Hydrogen informed Gurson model for hydrogen embrittlement simulation. Eng. Fract. Mech. 2019, 217, 106542. [Google Scholar] [CrossRef]
- Depraetere, R.; De Waele, W.; Hertelé, S. Fully-coupled continuum damage model for simulation of plasticity dominated hydrogen embrittlement mechanisms. Comput. Mater. Sci. 2021, 200, 110857. [Google Scholar] [CrossRef]
- Lin, M.; Yu, H.; Ding, Y.; Wang, G.; Olden, V.; Alvaro, A.; He, J.; Zhang, Z. A predictive model unifying hydrogen enhanced plasticity and decohesion. Scr. Mater. 2022, 215, 114707. [Google Scholar] [CrossRef]
- American Petroleum Institute. API Specification 5L—Line Pipe; American Petroleum Institute: Washington, DC, USA, 2018. [Google Scholar]
- Cauwels, M.; Depraetere, R.; De Waele, W.; Hertelé, S.; Depover, T.; Verbeken, K. Influence of electrochemical hydrogenation parameters on microstructures prone to hydrogen-induced cracking. J. Nat. Gas Sci. Eng. 2022, 101, 104533. [Google Scholar] [CrossRef]
- Depraetere, R.; Cauwels, M.; de Waele, W.; Depover, T.; Verbeken, K.; Hertelé, S. Calibrating a ductile damage model for two pipeline steels: Method and challenges. Procedia Struct. Integr. 2020, 28, 2267–2276. [Google Scholar] [CrossRef]
- Shokeir, Z.; Besson, J.; Belhadj, C.; Petit, T.; Madi, Y. Edge tracing technique to study post-necking behavior and failure in Al alloys and anisotropic plasticity in line pipe steels. Fatigue Fract. Eng. Mater. Struct. 2022, 45, 2427–2442. [Google Scholar] [CrossRef]
- Basu, S.; Benzerga, A.A. On the path-dependence of the fracture locus in ductile materials: Experiments. Int. J. Solids Struct. 2015, 71, 79–90. [Google Scholar] [CrossRef]
- Krom, A.H.; Koers, R.W.; Bakker, A. Hydrogen transport near a blunting crack tip. J. Mech. Phys. Solids 1999, 47, 971–992. [Google Scholar] [CrossRef]
- Oriani, R.A. The diffusion and trapping of hydrogen in steel. Acta Metall. 1970, 18, 147–157. [Google Scholar] [CrossRef]
- Zhang, Z.L.; Thaulow, C.; Ødegård, J. Complete Gurson model approach for ductile fracture. Eng. Fract. Mech. 2000, 67, 155–168. [Google Scholar] [CrossRef]
- Chu, C.C.; Needleman, A. Void nucleation effects in biaxially stretched sheets. J. Eng. Mater. Technol. Trans. ASME 1980, 102, 249–256. [Google Scholar] [CrossRef]
- Depraetere, R.; Cauwels, M.; De Waele, W.; Depover, T.; Verbeken, K.; Hertelé, S. Single-edge notched tension testing for assessing hydrogen embrittlement: A numerical study of test parameter influences. In Proceedings of the ECCOMAS Congress 2022—8th European Congress on Computational Methods in Applied Sciences and Engineering. CIMNE, Oslo, Norway, 5–9 June 2022. [Google Scholar] [CrossRef]
- Xu, K. Hydrogen embrittlement of carbon steels and their welds. In Gaseous Hydrogen Embrittlement of Materials in Energy Technologies, Volume 1: The Problem, Its Characterisation and Effects on Particular Alloy Classes; Gangloff, R., Somerday, B., Eds.; Woodhead Publishing Limited: Sawston, UK, 2012; pp. 526–561. [Google Scholar]
- Jemblie, L.; Olden, V.; Akselsen, O.M. A coupled diffusion and cohesive zone modelling approach for numerically assessing hydrogen embrittlement of steel structures. Int. J. Hydrogen Energy 2017, 42, 11980–11995. [Google Scholar] [CrossRef] [Green Version]
- Khan, I.A.; Srivastava, A.; Needleman, A.; Benzerga, A.A. An analysis of deformation and failure in rectangular tensile bars accounting for void shape changes. Int. J. Fract. 2021, 230, 133–156. [Google Scholar] [CrossRef]
- Nguyen, V.D.; Pardoen, T.; Noels, L. A nonlocal approach of ductile failure incorporating void growth, internal necking, and shear dominated coalescence mechanisms. J. Mech. Phys. Solids 2020, 137, 103891. [Google Scholar] [CrossRef] [Green Version]
- Kumnick, A.J.; Johnson, H.H. Deep trapping states for hydrogen in deformed iron. Acta Metall. 1980, 28, 33–39. [Google Scholar] [CrossRef]
- Mirone, G. A new model for the elastoplastic characterization and the stress-strain determination on the necking section of a tensile specimen. Int. J. Solids Struct. 2004, 41, 3545–3564. [Google Scholar] [CrossRef]
- Faleskog, J.; Gao, X.; Fong Shih, C. Cell model for nonlinear fracture analysis—I. Micromechanics calibration. Int. J. Fract. 1998, 89, 355–373. [Google Scholar] [CrossRef]
- Springmann, M.; Kuna, M. Identification of material parameters of the Gurson-Tvergaard-Needleman model by combined experimental and numerical techniques. Comput. Mater. Sci. 2005, 33, 501–509. [Google Scholar] [CrossRef]
- Broggiato, G.B.; Campana, F.; Cortese, L. Identification of material damage model parameters: An inverse approach using digital image processing. Meccanica 2007, 42, 9–17. [Google Scholar] [CrossRef]
- Achouri, M.; Germain, G.; Dal Santo, P.; Saidane, D. Experimental characterization and numerical modeling of micromechanical damage under different stress states. Mater. Des. 2013, 50, 207–222. [Google Scholar] [CrossRef] [Green Version]
- Zhang, T.; Lu, K.; Mano, A.; Yamaguchi, Y.; Katsuyama, J.; Li, Y. A novel method to uniquely determine the parameters in Gurson–Tvergaard–Needleman model. Fatigue Fract. Eng. Mater. Struct. 2021, 44, 3399–3415. Available online: https://onlinelibrary.wiley.com/doi/10.1111/ffe.13568 (accessed on 3 February 2023).
- Bao, Y.; Wierzbicki, T. On fracture locus in the equivalent strain and stress triaxiality space. Int. J. Mech. Sci. 2004, 46, 81–98. [Google Scholar] [CrossRef]
- Danas, K.; Ponte Castañeda, P. Influence of the Lode parameter and the stress triaxiality on the failure of elasto-plastic porous materials. Int. J. Solids Struct. 2012, 49, 1325–1342. [Google Scholar] [CrossRef] [Green Version]
- Reis, F.J.; Malcher, L.; Pires, F.M.; De Sá, J.M. A comparison of shear mechanisms for the prediction of ductile failure under low stress triaxiality. Int. J. Struct. Integr. 2010, 1, 314–331. [Google Scholar] [CrossRef]
- Li, H.; Fu, M.W.; Lu, J.; Yang, H. Ductile fracture: Experiments and computations. Int. J. Plast. 2011, 27, 147–180. [Google Scholar] [CrossRef]
- Kiran, R.; Khandelwal, K. Gurson model parameters for ductile fracture simulation in ASTM A992 steels. Fatigue Fract. Eng. Mater. Struct. 2014, 37, 171–183. [Google Scholar] [CrossRef]
- Cao, T.S.; Mazière, M.; Danas, K.; Besson, J. A model for ductile damage prediction at low stress triaxialities incorporating void shape change and void rotation. Int. J. Solids Struct. 2015, 63, 240–263. [Google Scholar] [CrossRef]
- Nahshon, K.; Hutchinson, J.W. Modification of the Gurson Model for shear failure. Eur. J. Mech. A/Solids 2008, 27, 1–17. [Google Scholar] [CrossRef]
- Xue, L. Constitutive modeling of void shearing effect in ductile fracture of porous materials. Eng. Fract. Mech. 2008, 75, 3343–3366. [Google Scholar] [CrossRef]
- Bai, Y.; Wierzbicki, T. A new model of metal plasticity and fracture with pressure and Lode dependence. Int. J. Plast. 2008, 24, 1071–1096. [Google Scholar] [CrossRef]
- Johnson, G.R.; Cook, W.H. Fracture characteristics of three metals subjected to various strains, strain rates, temperatures and pressures. Eng. Fract. Mech. 1985, 21, 31–48. [Google Scholar] [CrossRef]
- Münstermann, S.; Schruff, C.; Lian, J.; Döbereiner, B.; Brinnel, V.; Wu, B. Predicting lower bound damage curves for high-strength low-alloy steels. Fatigue Fract. Eng. Mater. Struct. 2013, 36, 779–794. [Google Scholar] [CrossRef]
- Bergo, S.; Morin, D.; Børvik, T.; Hopperstad, O.S. Micromechanics-based identification of a ductile fracture model for three structural steels. Eng. Fract. Mech. 2020, 224, 106803. [Google Scholar] [CrossRef]
- Depraetere, R.; De Waele, W.; Cauwels, M.; Depover, T.; Verbeken, K.; Hertelé, S. Modeling of Hydrogen-Charged Notched Tensile Tests of an X70 Pipeline Steel with a Hydrogen-Informed Gurson Model [Dataset]. Available online: https://osf.io/sak3w/ (accessed on 4 July 2023).
- Tadashi, K.; Toshimitsu, A.Y.; Go, O.; Toshihito, O.; Manabu, E. Modelling of hydrogen diffusion in a weld cold cracking test: Part 1, experimental determinations of apparent diffusion coefficient and boundary condition. ISIJ Int. 2021, 61, 1245–1253. [Google Scholar] [CrossRef]


| Material | C | Mn | Si | Cr | Ni | Nb | V | Mo | Cu | S | P | Fe |
|---|---|---|---|---|---|---|---|---|---|---|---|---|
| API 5L X70 | 0.108 | 1.633 | 0.426 | 0.030 | 0.022 | 0.054 | 0.068 | 0.002 | 0.018 | 0.003 | 0.015 | Balance |
| Notch | [wppm] | Number of Tests | [MPa] | [-] | [%] |
|---|---|---|---|---|---|
| 0 | 2 * | 952 ± 6 | 0.41 | ||
| 0.36 | 2 | 944 ± 4 | 0.31 ± 0.01 | 25 | |
| 1.09 | 1 | 943 | 0.13 | 69 | |
| 0 | 2 | 879 ± 1 | 0.44 ± 0.04 | ||
| 0.36 | 2 | 876 ± 1 | 0.26 ± 0.04 | 42 ± 11 | |
| 1.09 | 4 | 876 ± 12 | 0.16 ± 0.03 | 64 ± 8 | |
| 0 | 4 | 751 ± 13 | 0.65 ± 0.06 | ||
| 0.36 | 3 | 740 ± 16 | 0.48 ± 0.06 | 26 ± 12 | |
| 1.09 | 6 | 743 ± 16 | 0.25 ± 0.07 | 62 ± 11 | |
| 0 | 6 | 622 ± 4 | 1.01 ± 0.10 | ||
| 0.36 | 5 | 612 ± 6 | 0.99 ± 0.06 | 1 ± 11 | |
| 1.09 | 8 | 619 ± 8 | 0.66 ± 0.12 | 35 ± 14 |
| [mm2/s] | [kJ/mol] | [m−3] | [m−3] | T [K] | ||
|---|---|---|---|---|---|---|
| 4.5 × 10⁻⁴ | −30 | 8.47 × 1028 | 1 | 6 | 300 |
| k | ||||||||
|---|---|---|---|---|---|---|---|---|
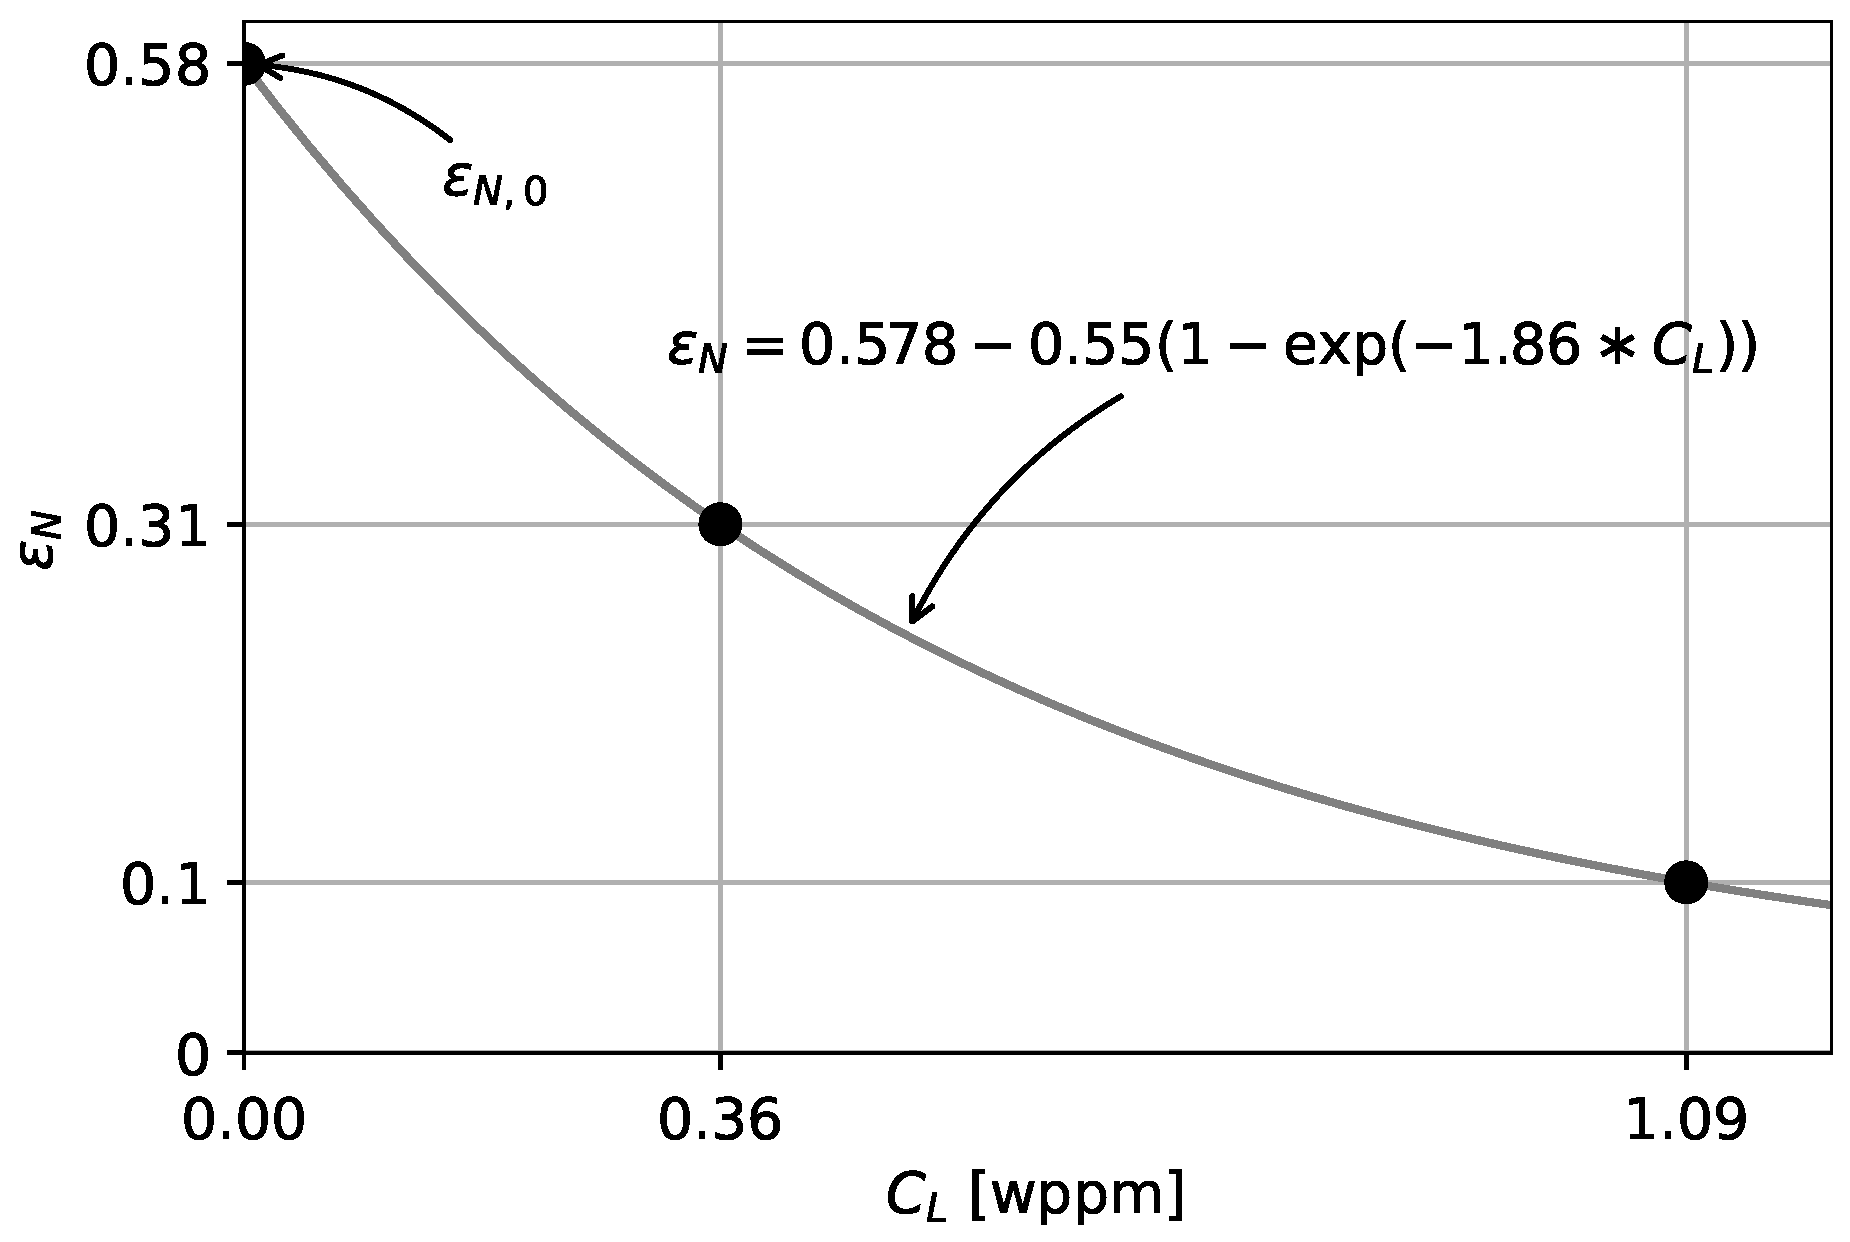
| 1.42 | 0.96 | 0.0034 | 0.031 | 0.43 | 6 | 0.578 | 0.55 | 1.86 |
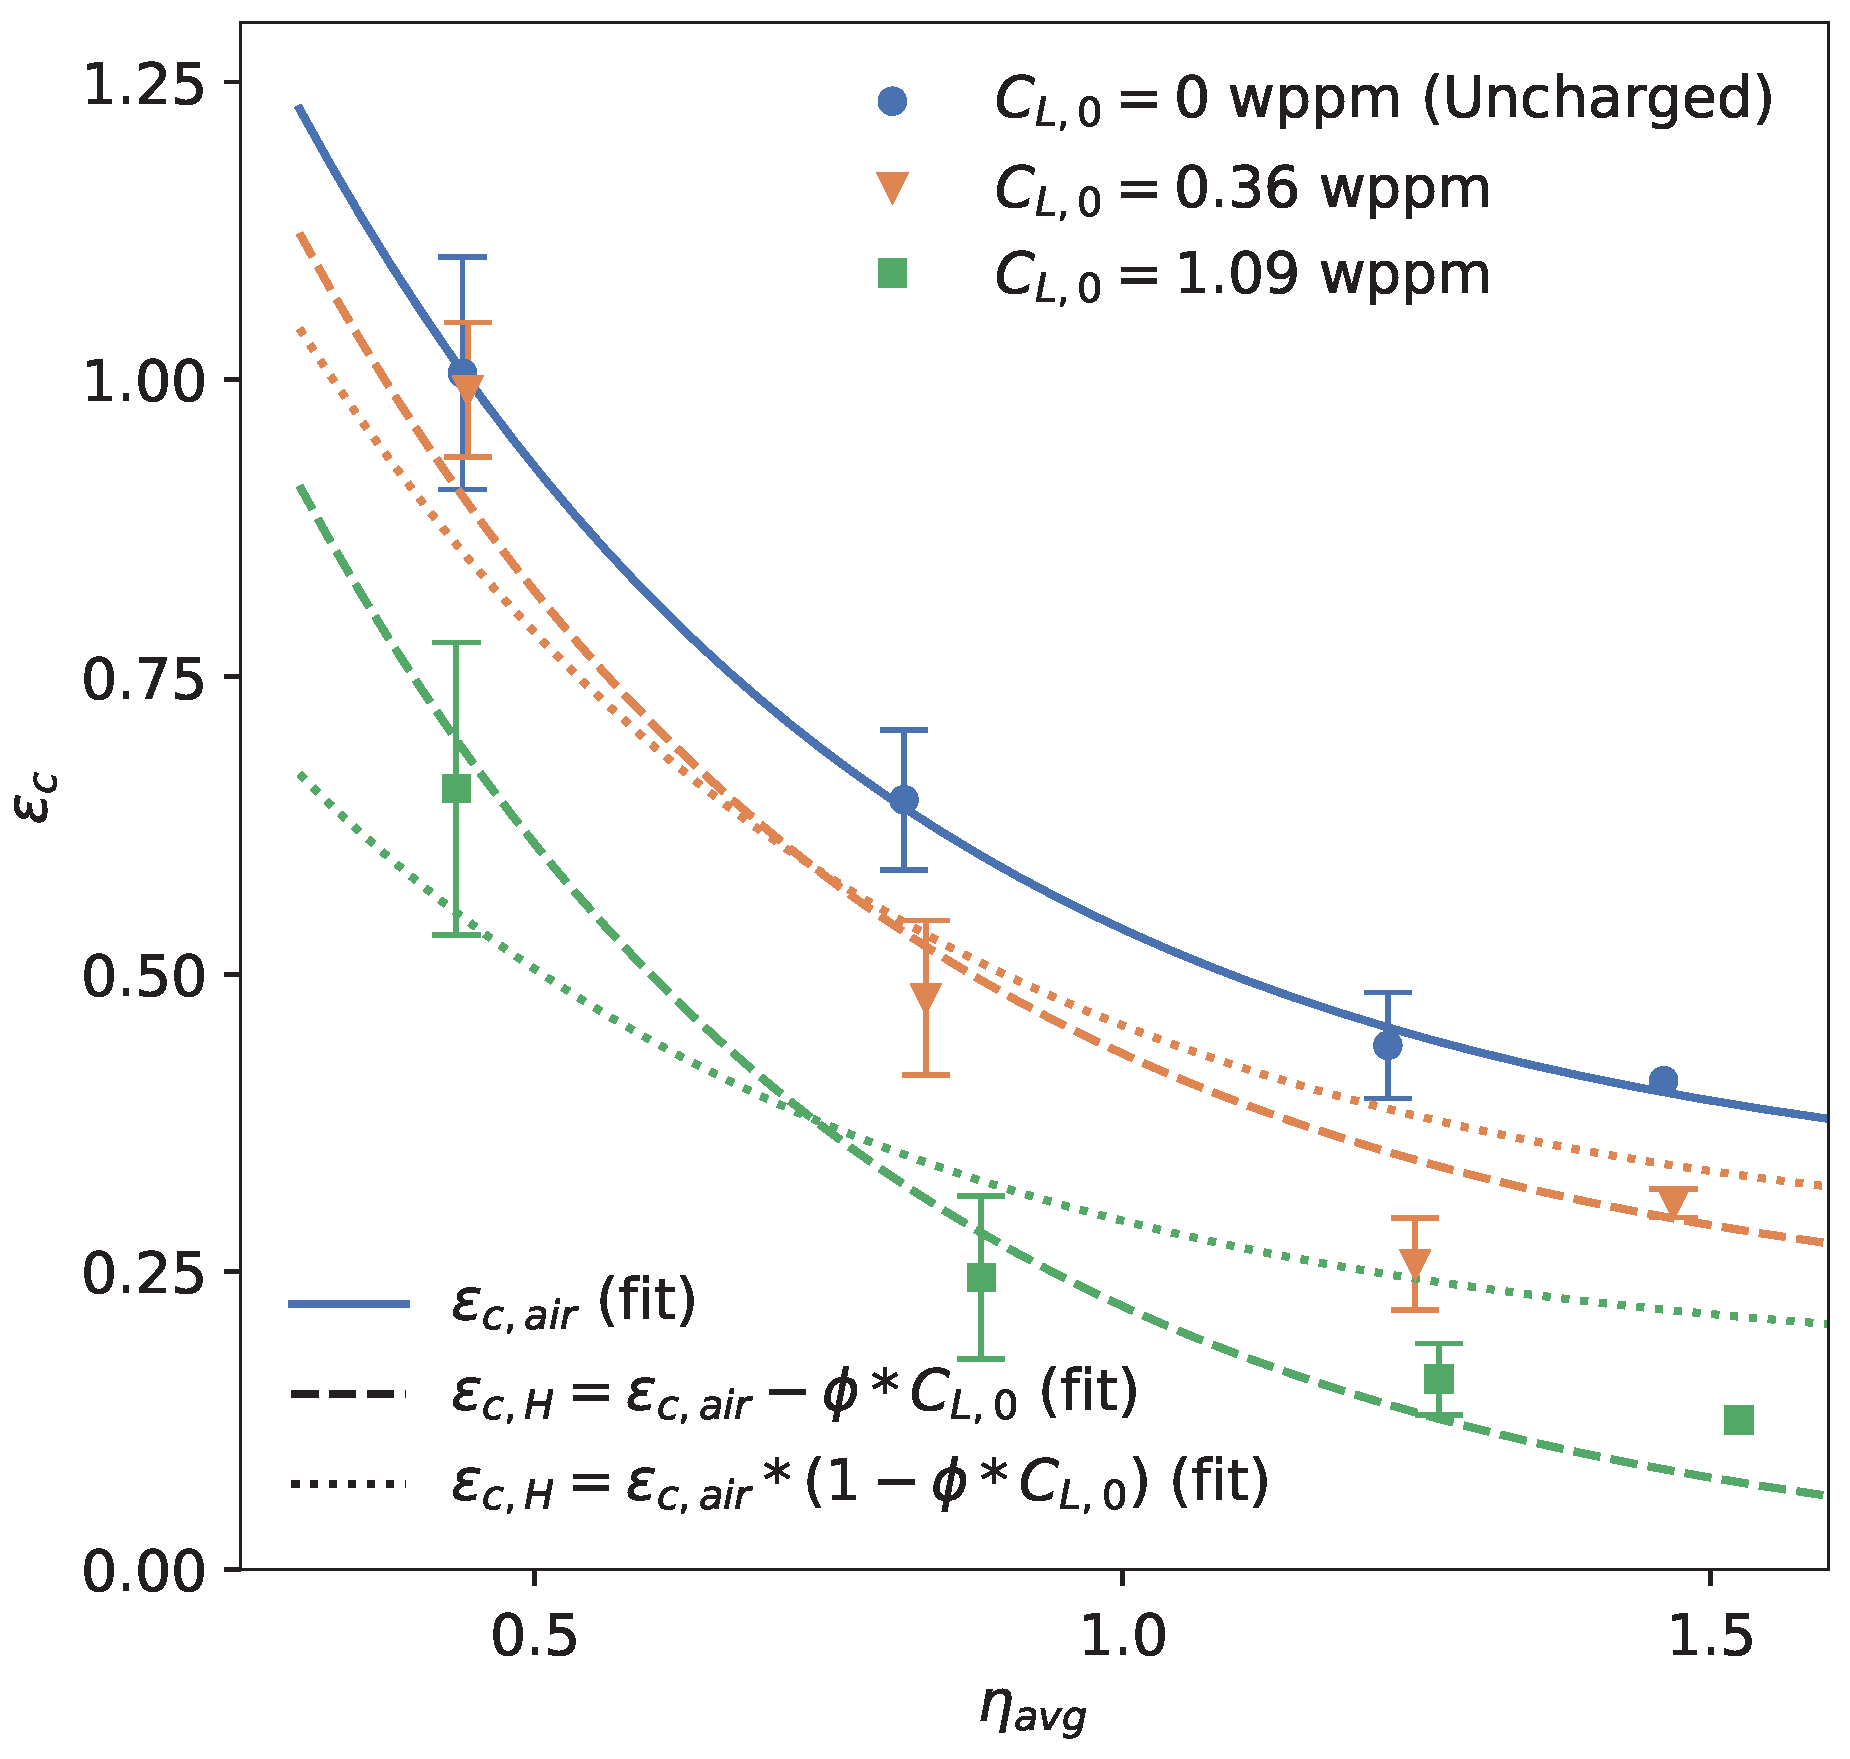
| MSE | ||
|---|---|---|
| 0.29 | 0.0032 | |
| 0.42 | 0.0089 |
Disclaimer/Publisher’s Note: The statements, opinions and data contained in all publications are solely those of the individual author(s) and contributor(s) and not of MDPI and/or the editor(s). MDPI and/or the editor(s) disclaim responsibility for any injury to people or property resulting from any ideas, methods, instructions or products referred to in the content. |
© 2023 by the authors. Licensee MDPI, Basel, Switzerland. This article is an open access article distributed under the terms and conditions of the Creative Commons Attribution (CC BY) license (https://creativecommons.org/licenses/by/4.0/).
Share and Cite
Depraetere, R.; De Waele, W.; Cauwels, M.; Depover, T.; Verbeken, K.; Hertelé, S. Modeling of Hydrogen-Charged Notched Tensile Tests of an X70 Pipeline Steel with a Hydrogen-Informed Gurson Model. Materials 2023, 16, 4839. https://doi.org/10.3390/ma16134839
Depraetere R, De Waele W, Cauwels M, Depover T, Verbeken K, Hertelé S. Modeling of Hydrogen-Charged Notched Tensile Tests of an X70 Pipeline Steel with a Hydrogen-Informed Gurson Model. Materials. 2023; 16(13):4839. https://doi.org/10.3390/ma16134839
Chicago/Turabian StyleDepraetere, Robin, Wim De Waele, Margo Cauwels, Tom Depover, Kim Verbeken, and Stijn Hertelé. 2023. "Modeling of Hydrogen-Charged Notched Tensile Tests of an X70 Pipeline Steel with a Hydrogen-Informed Gurson Model" Materials 16, no. 13: 4839. https://doi.org/10.3390/ma16134839