
Mesoscopic Mechanical Properties of Aggregate Structure in Asphalt Mixtures and Gradation Optimization
Abstract
:1. Introduction
2. Materials
2.1. Asphalt
2.2. Aggregate
3. Numerical Model
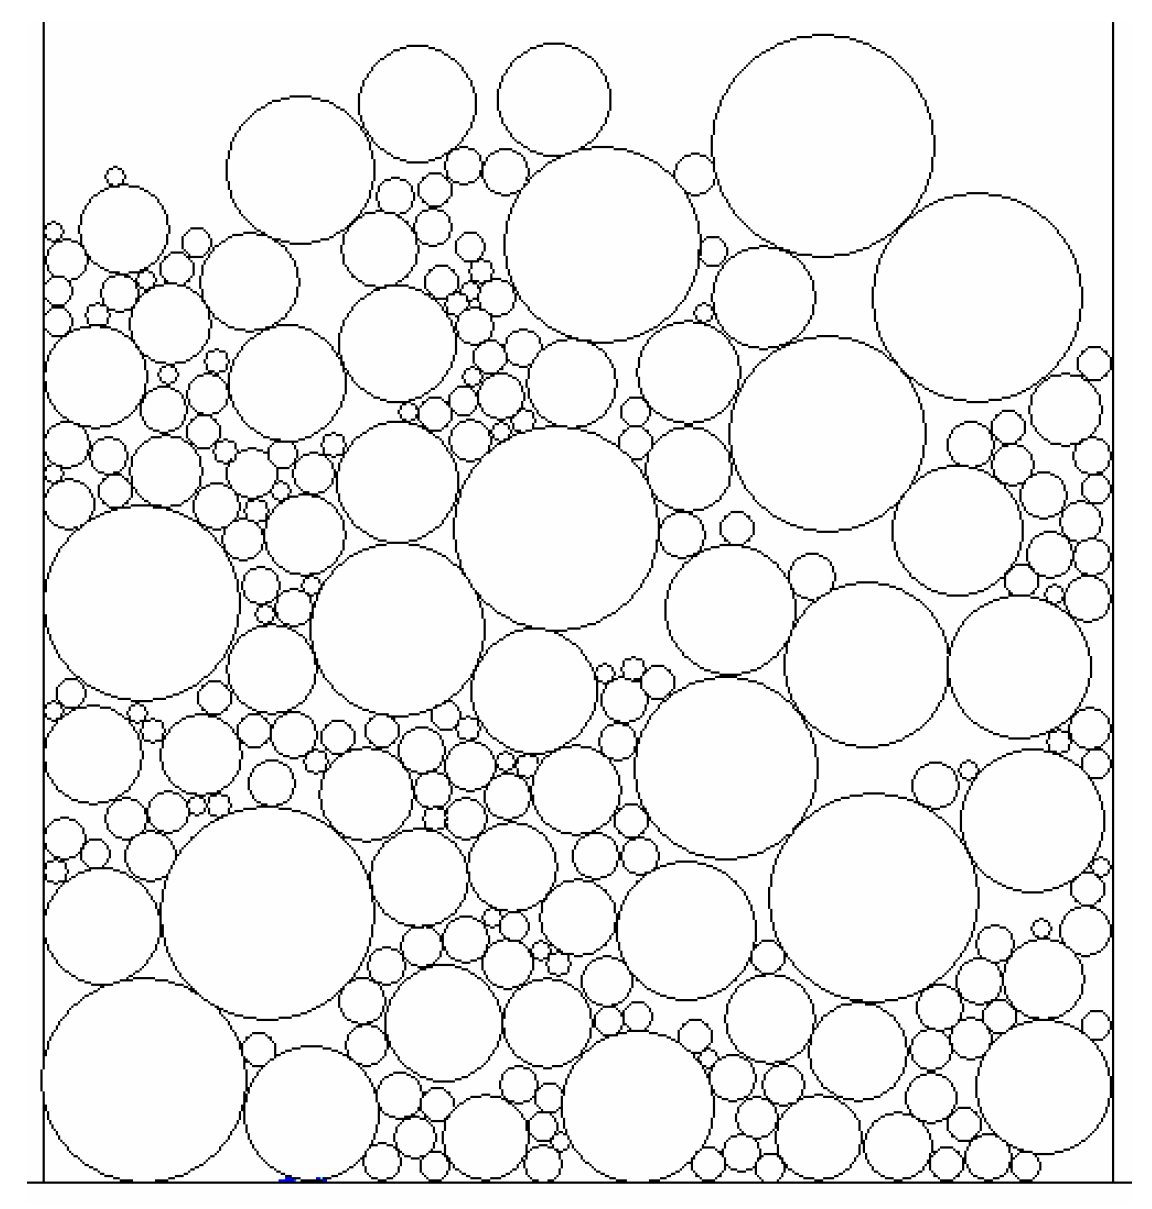
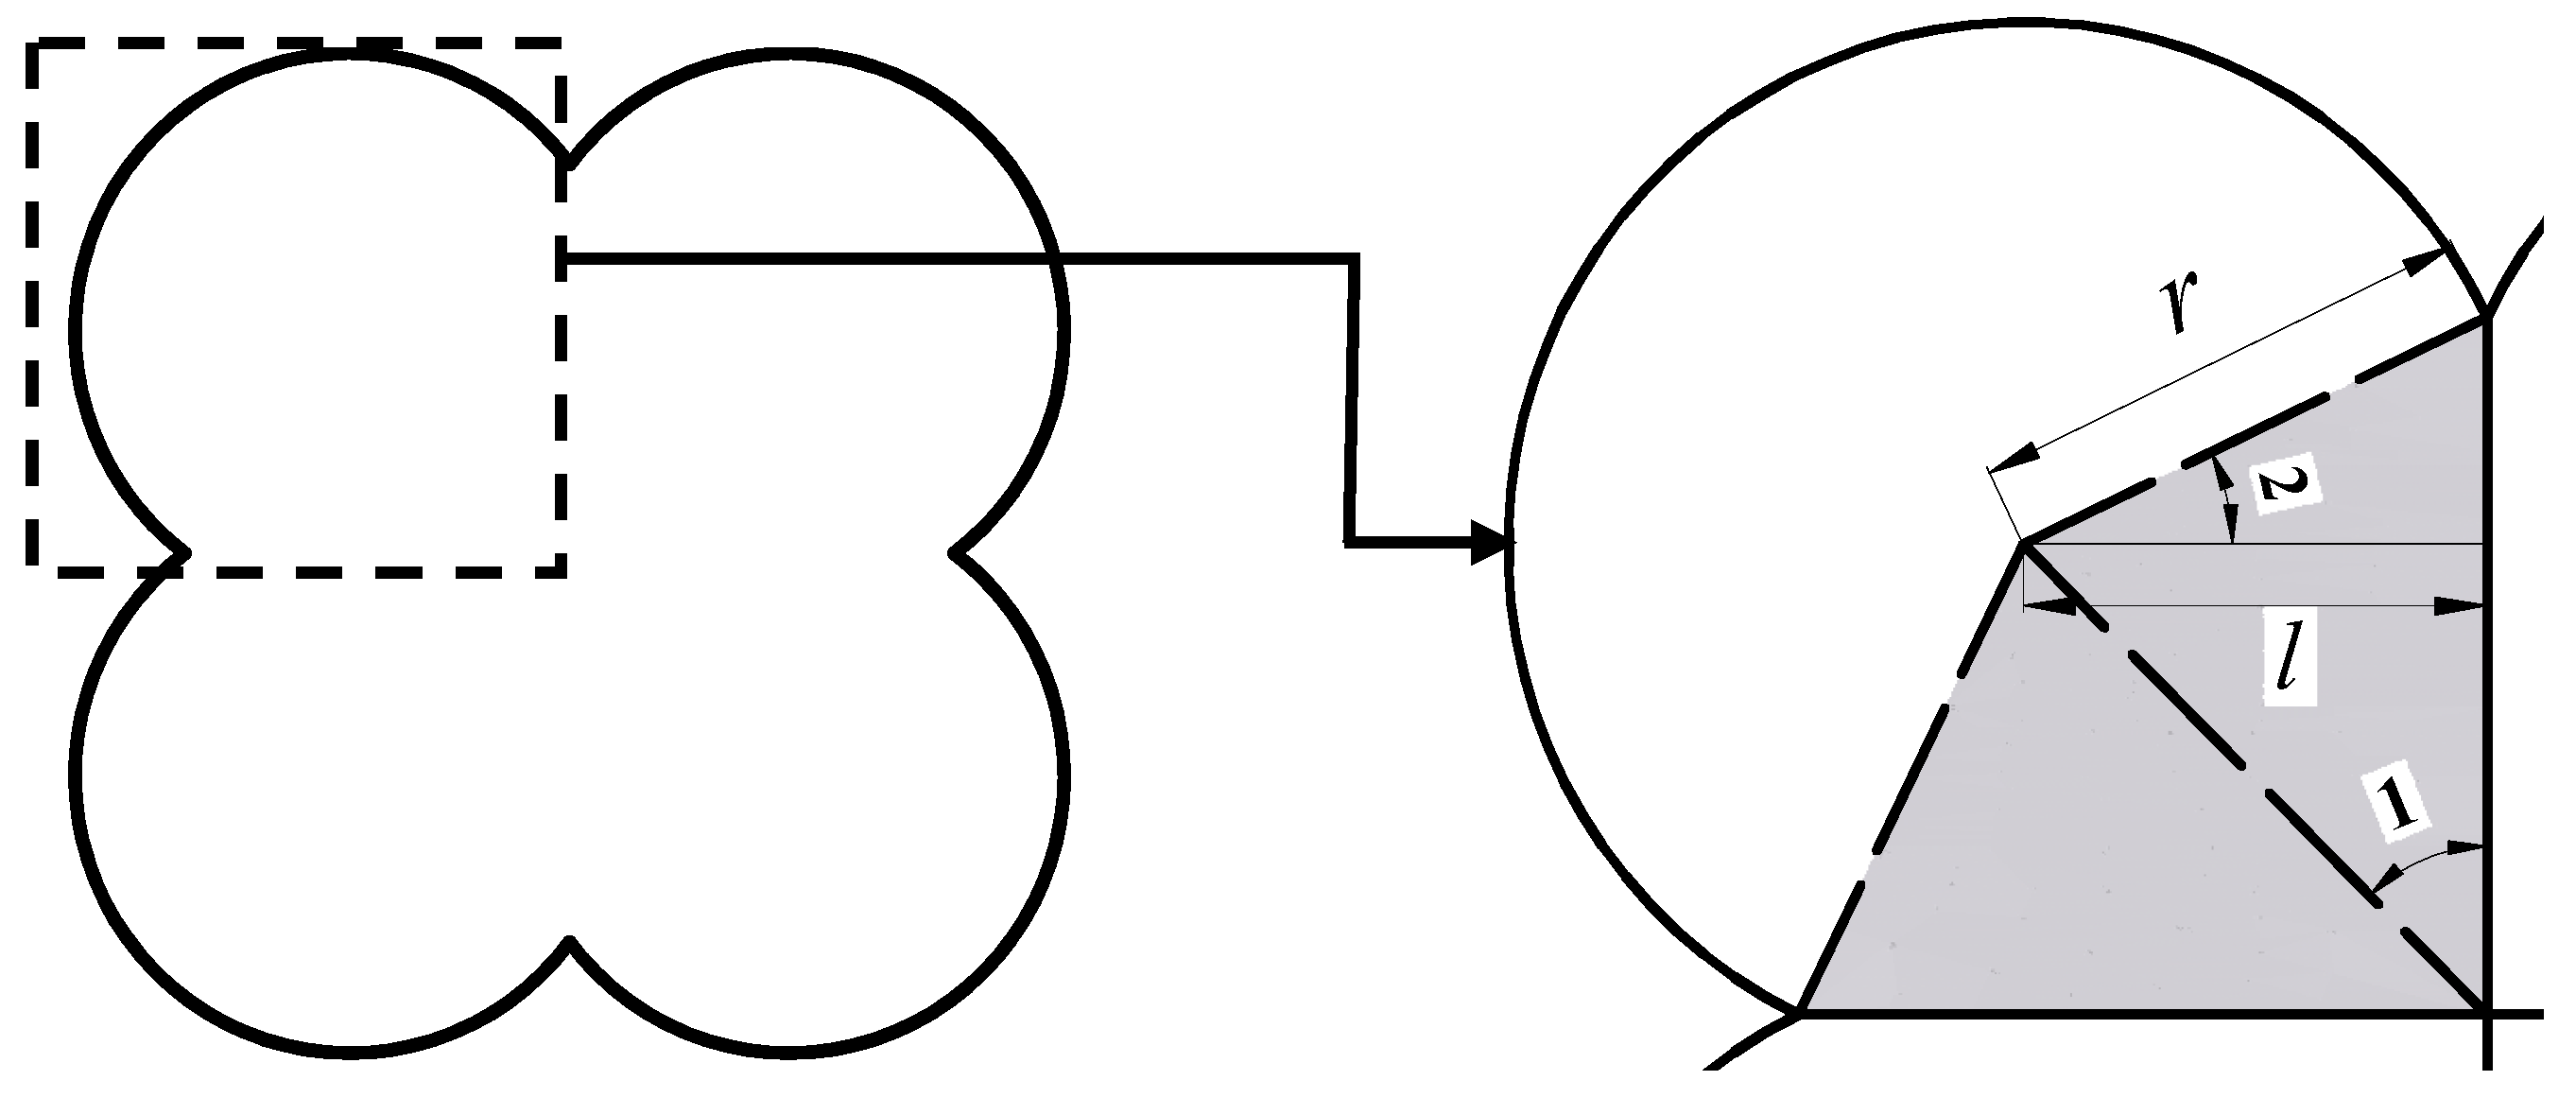
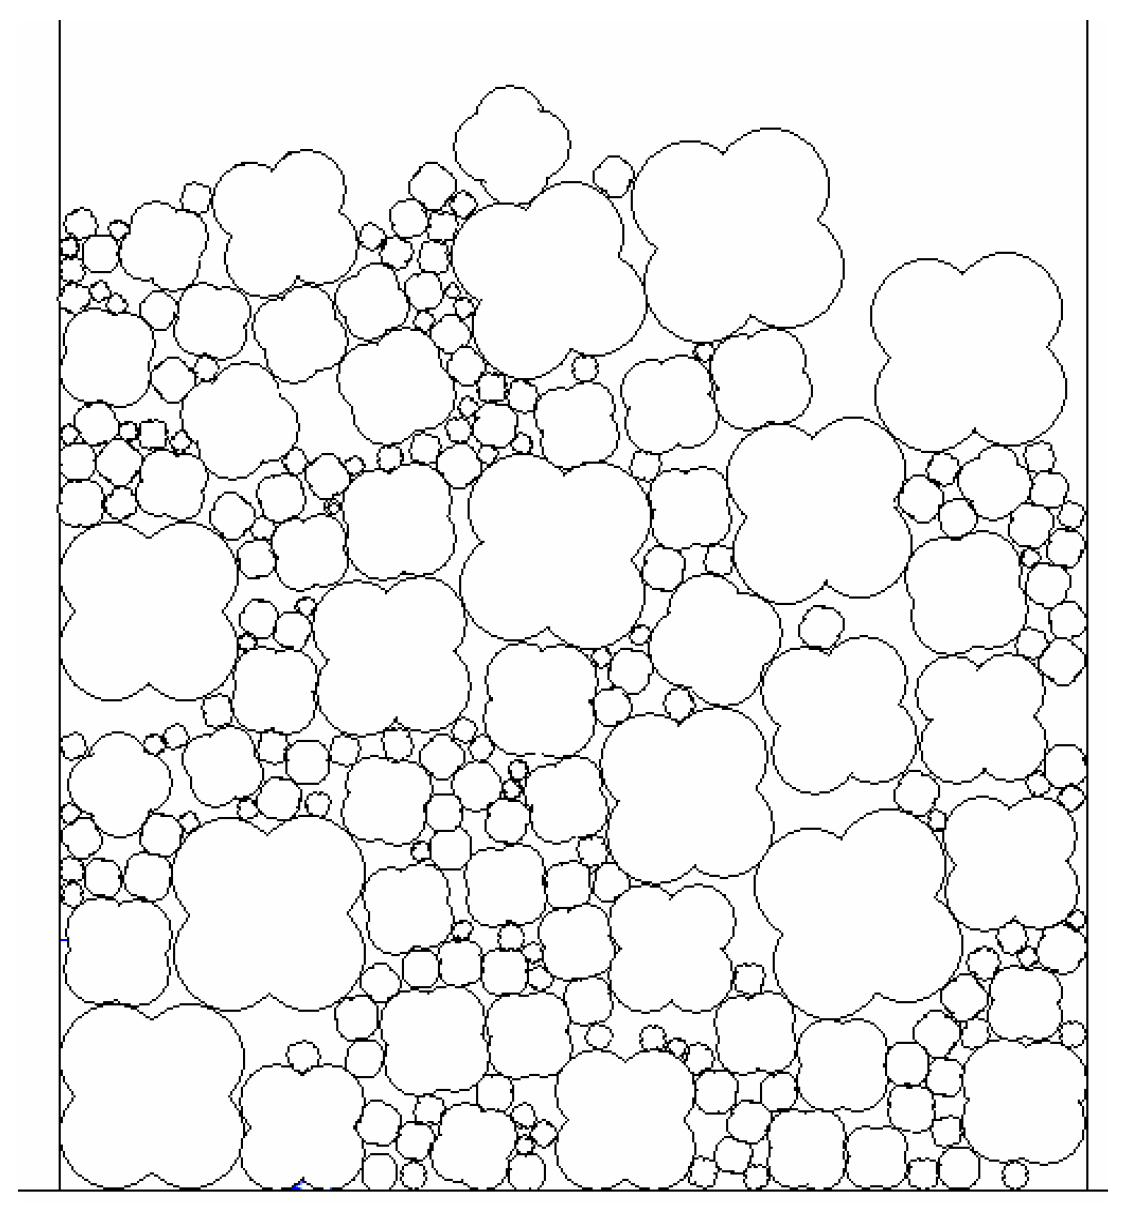
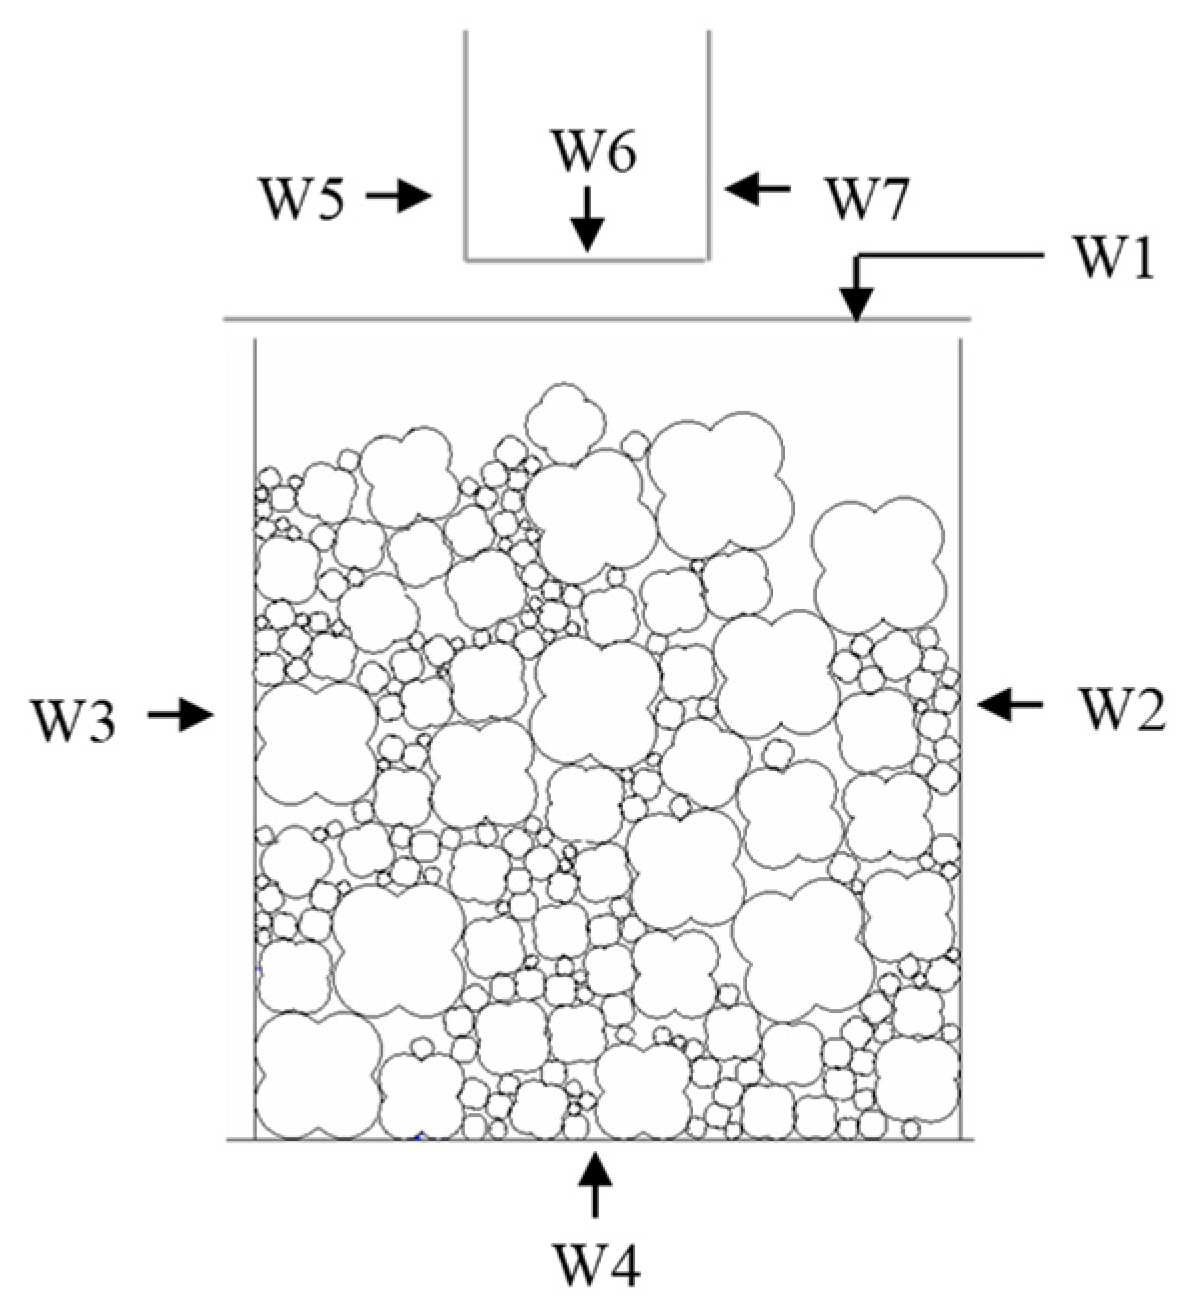
3.1. Numerical Model
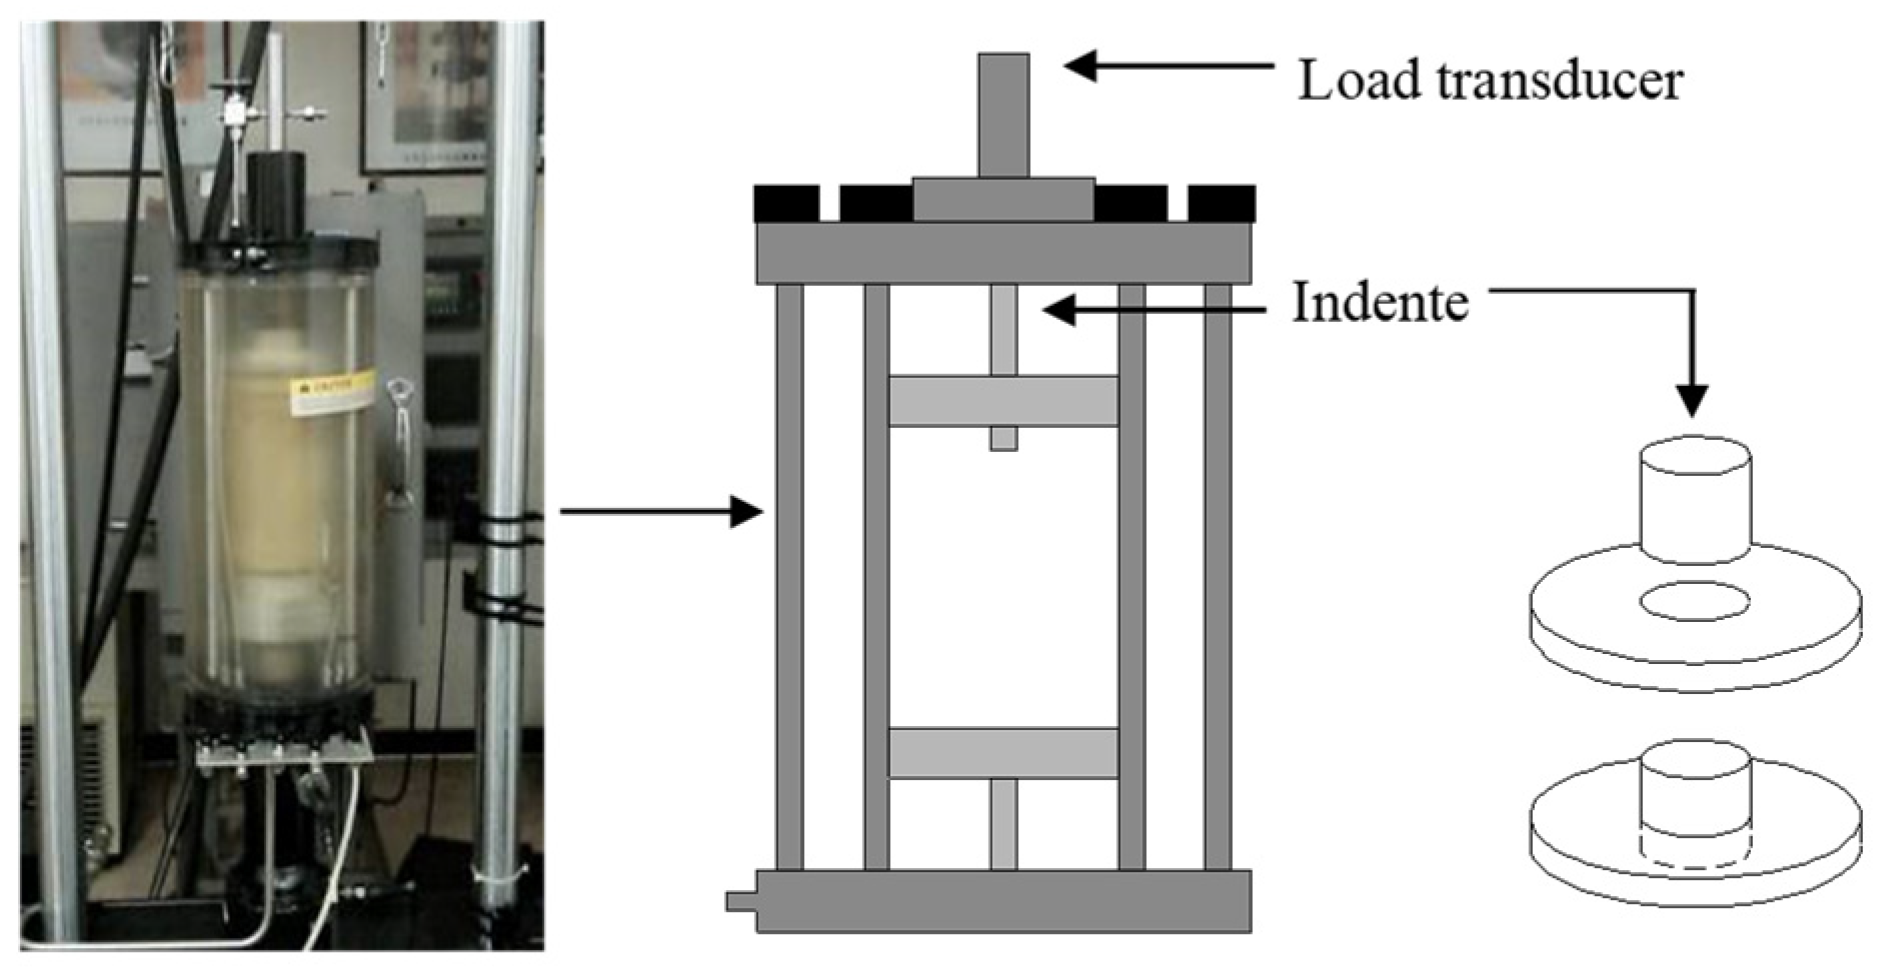
3.2. Numerical Test and Verification
3.2.1. Numerical Tests
- (1)
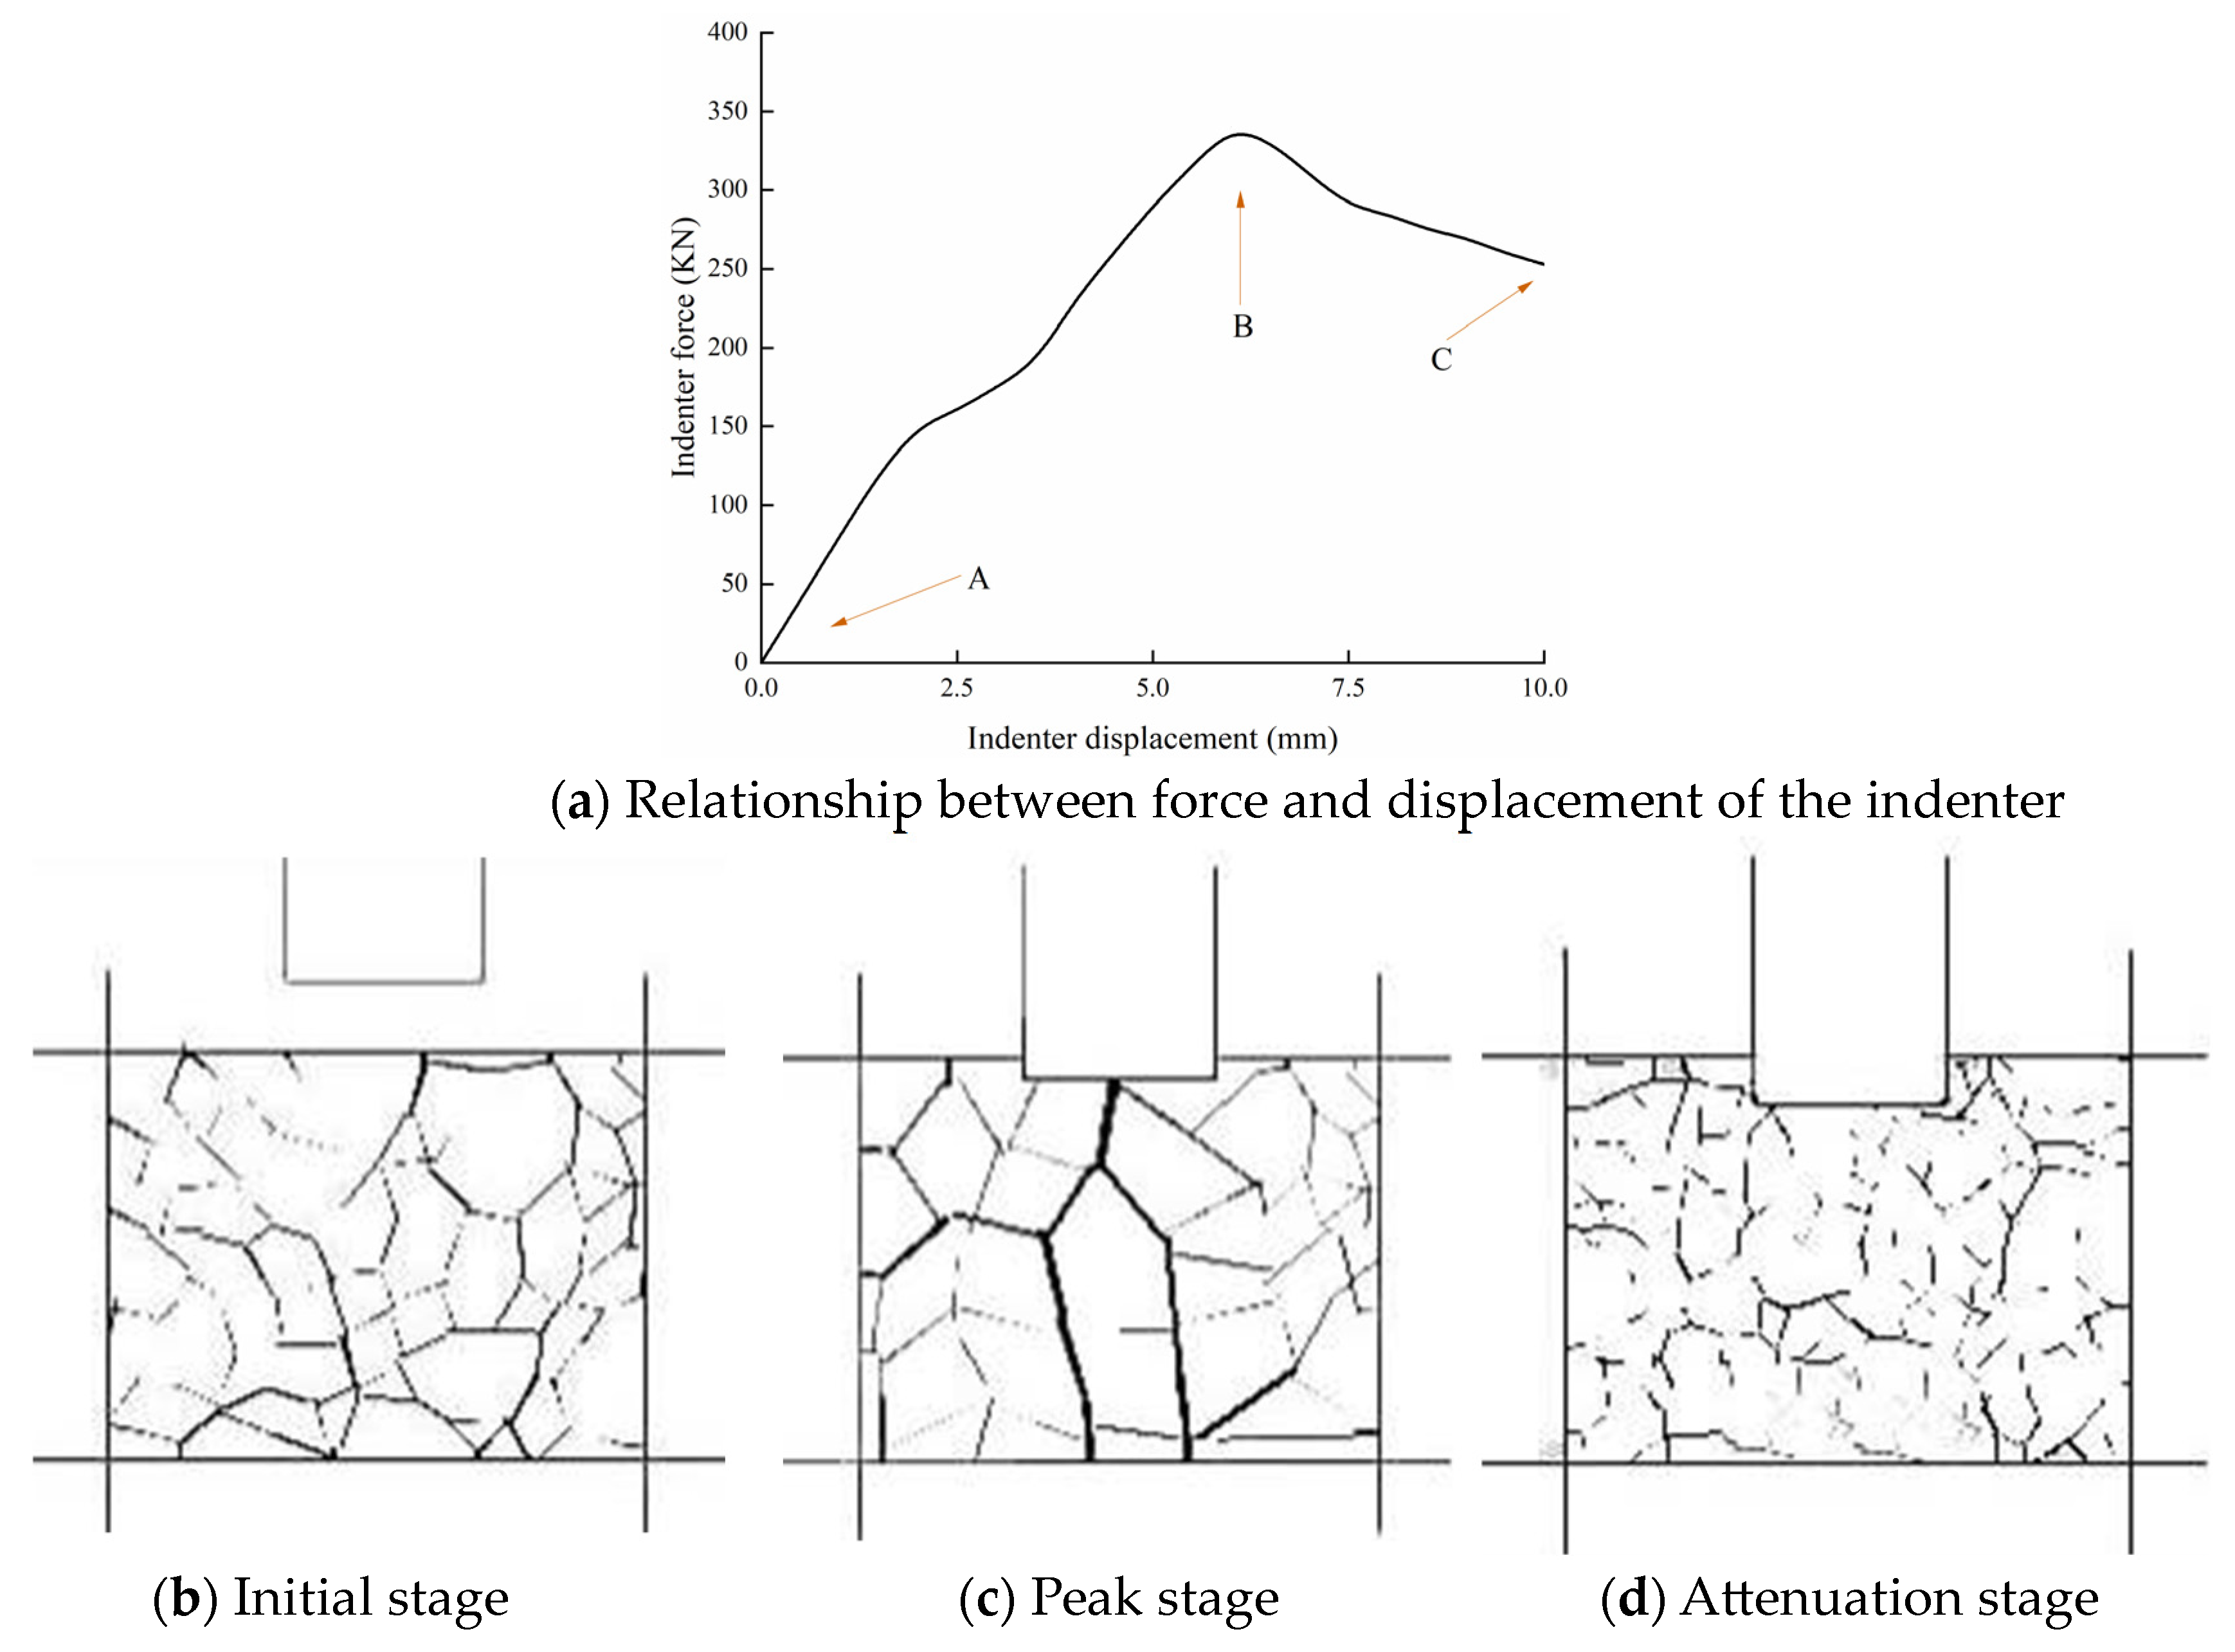
- The relationship between force and displacement of the indenter
- (2)
- Initial stage
- (3)
- Peak stage
- (4)
- Attenuation stage
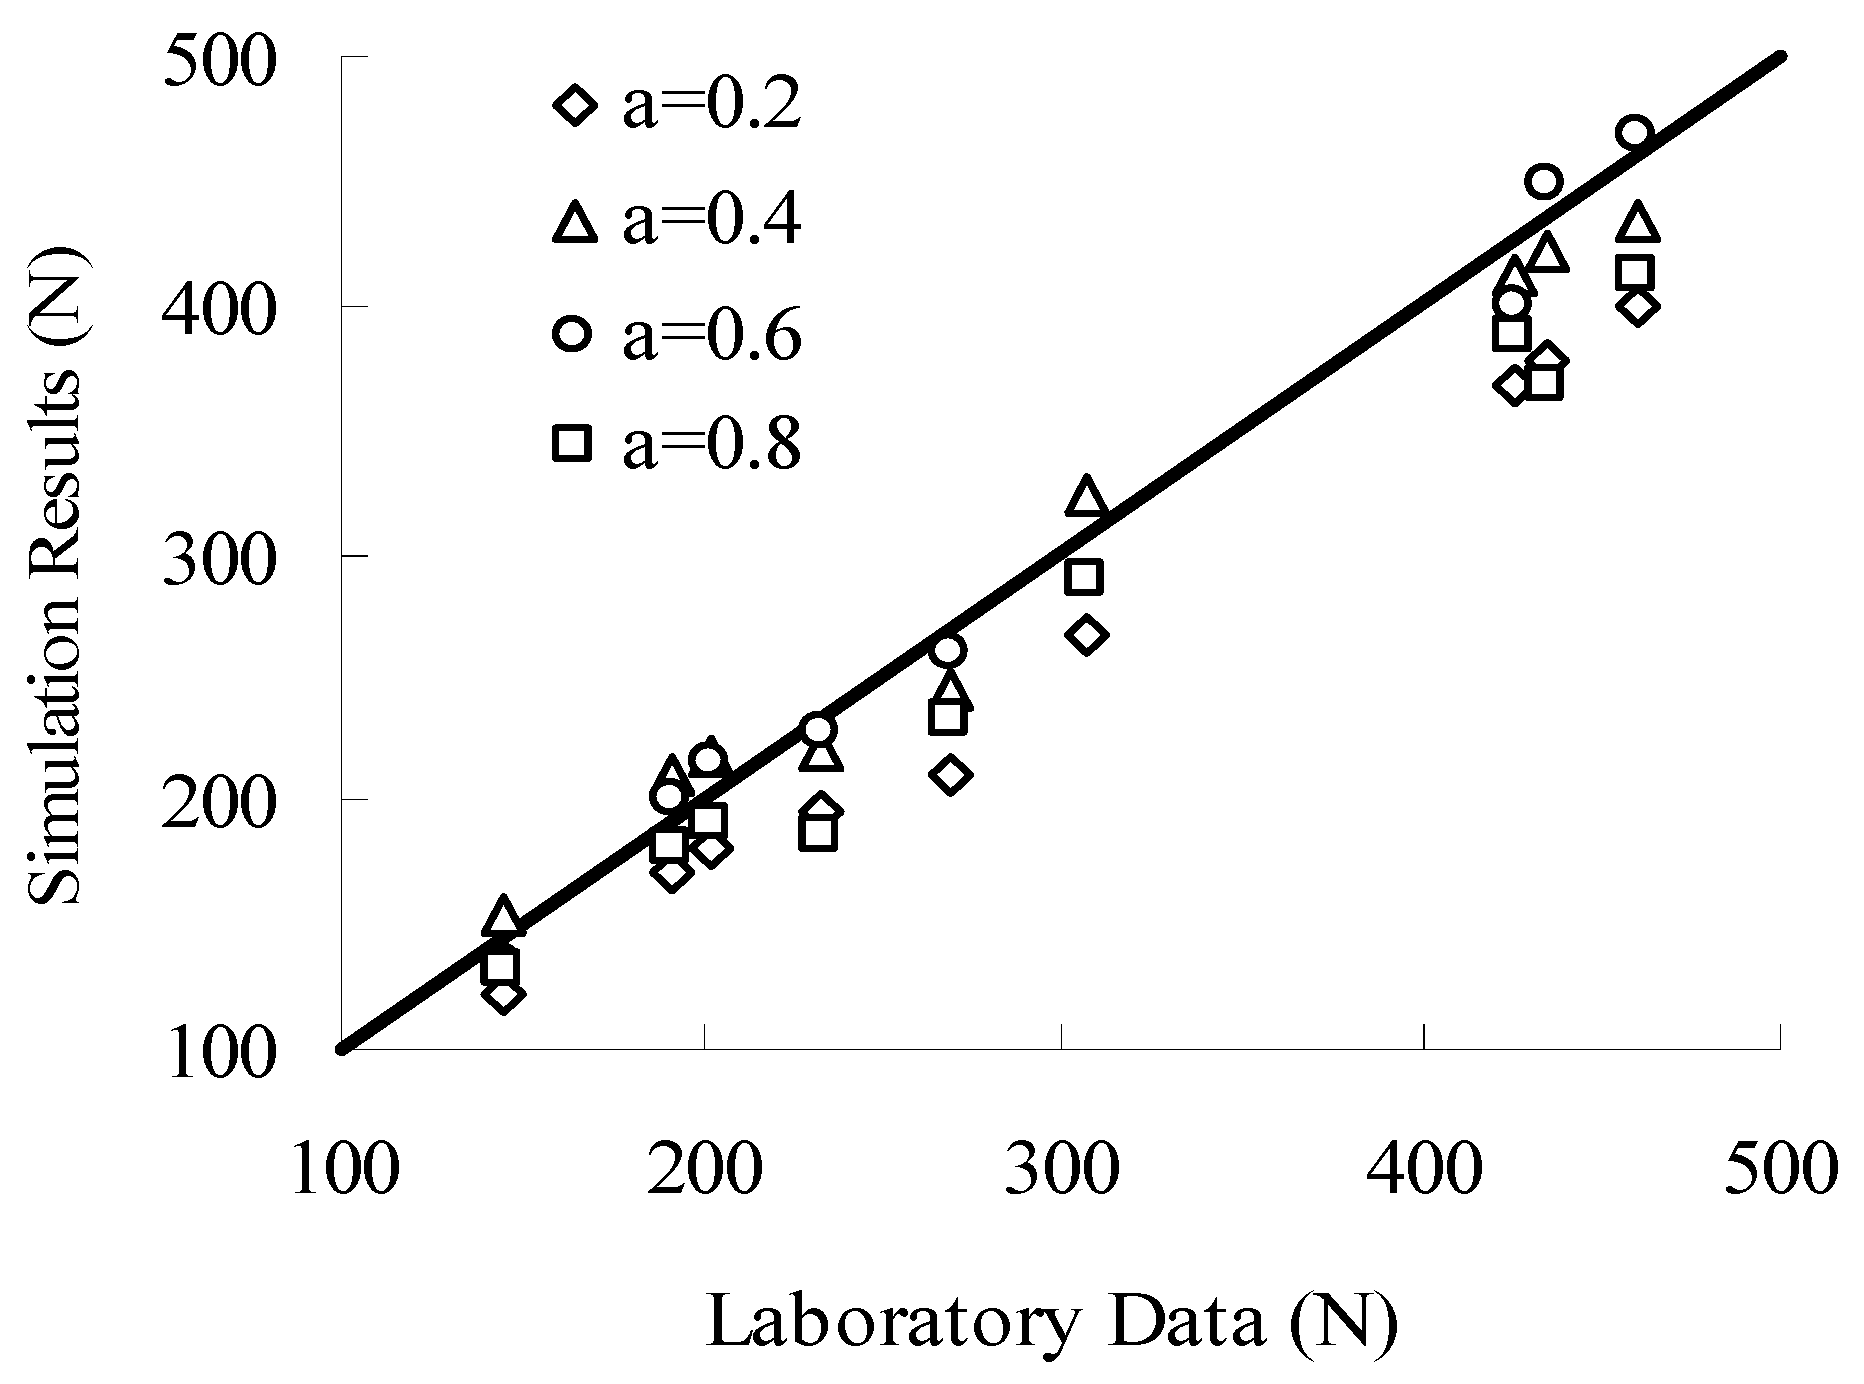
3.2.2. Results Verification
3.3. Simulation Plan
4. Results and Discussion
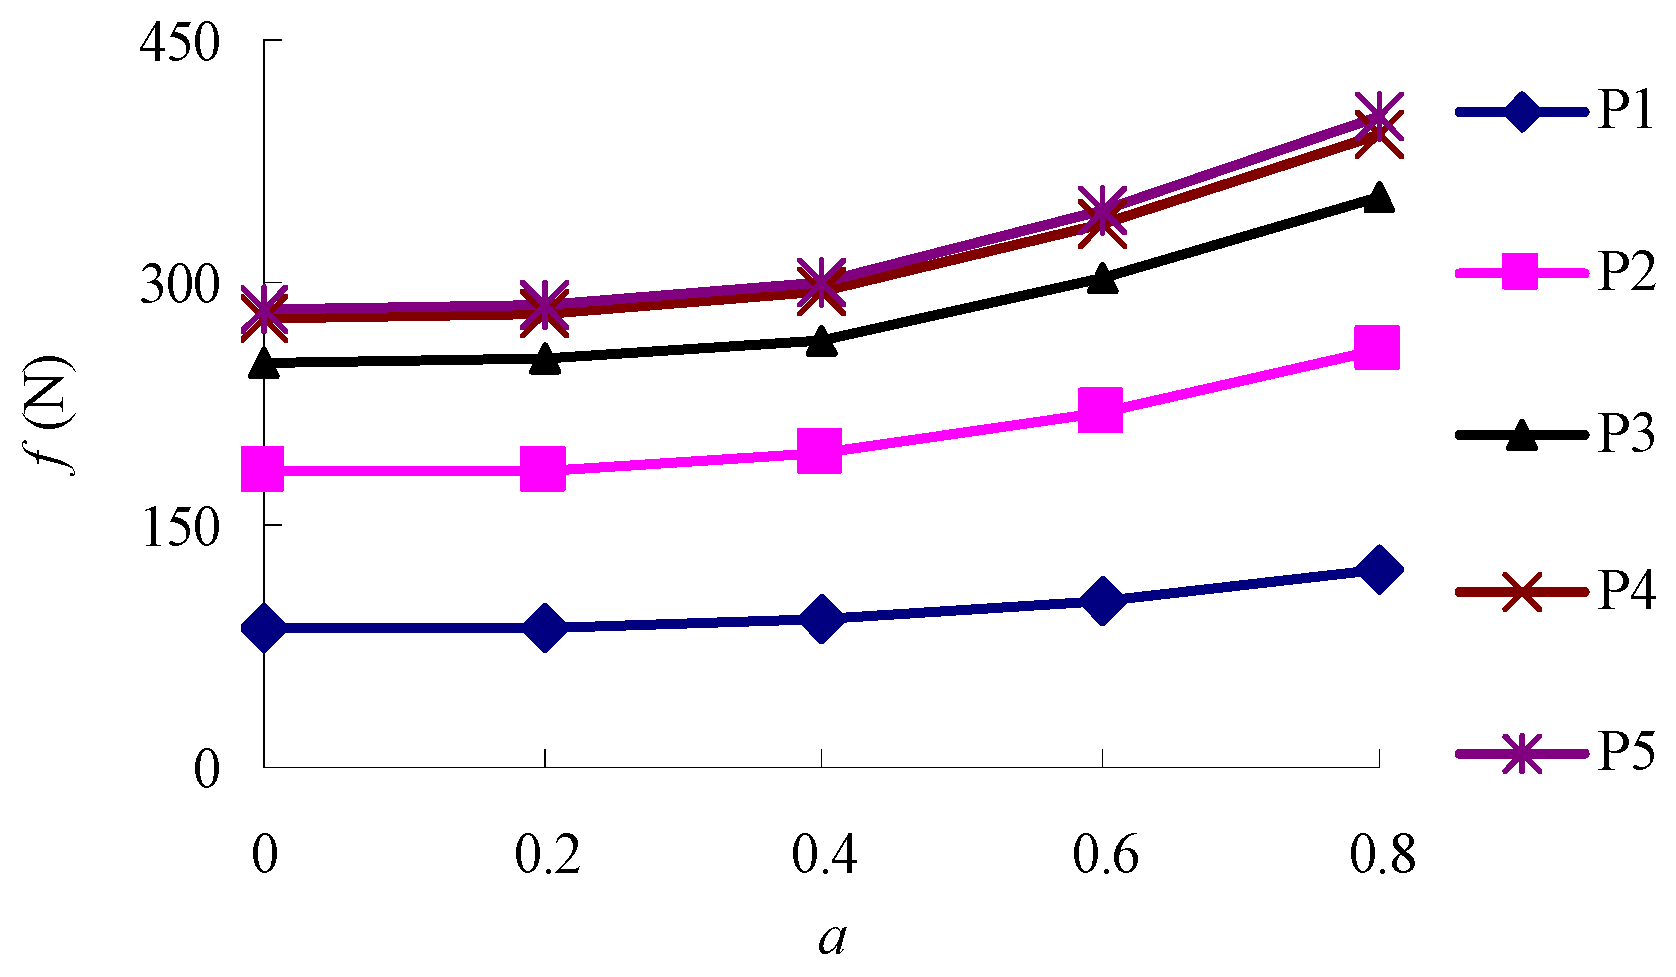
4.1. Aggregate Interlocking Forces
4.2. Aggregate Contact Forces
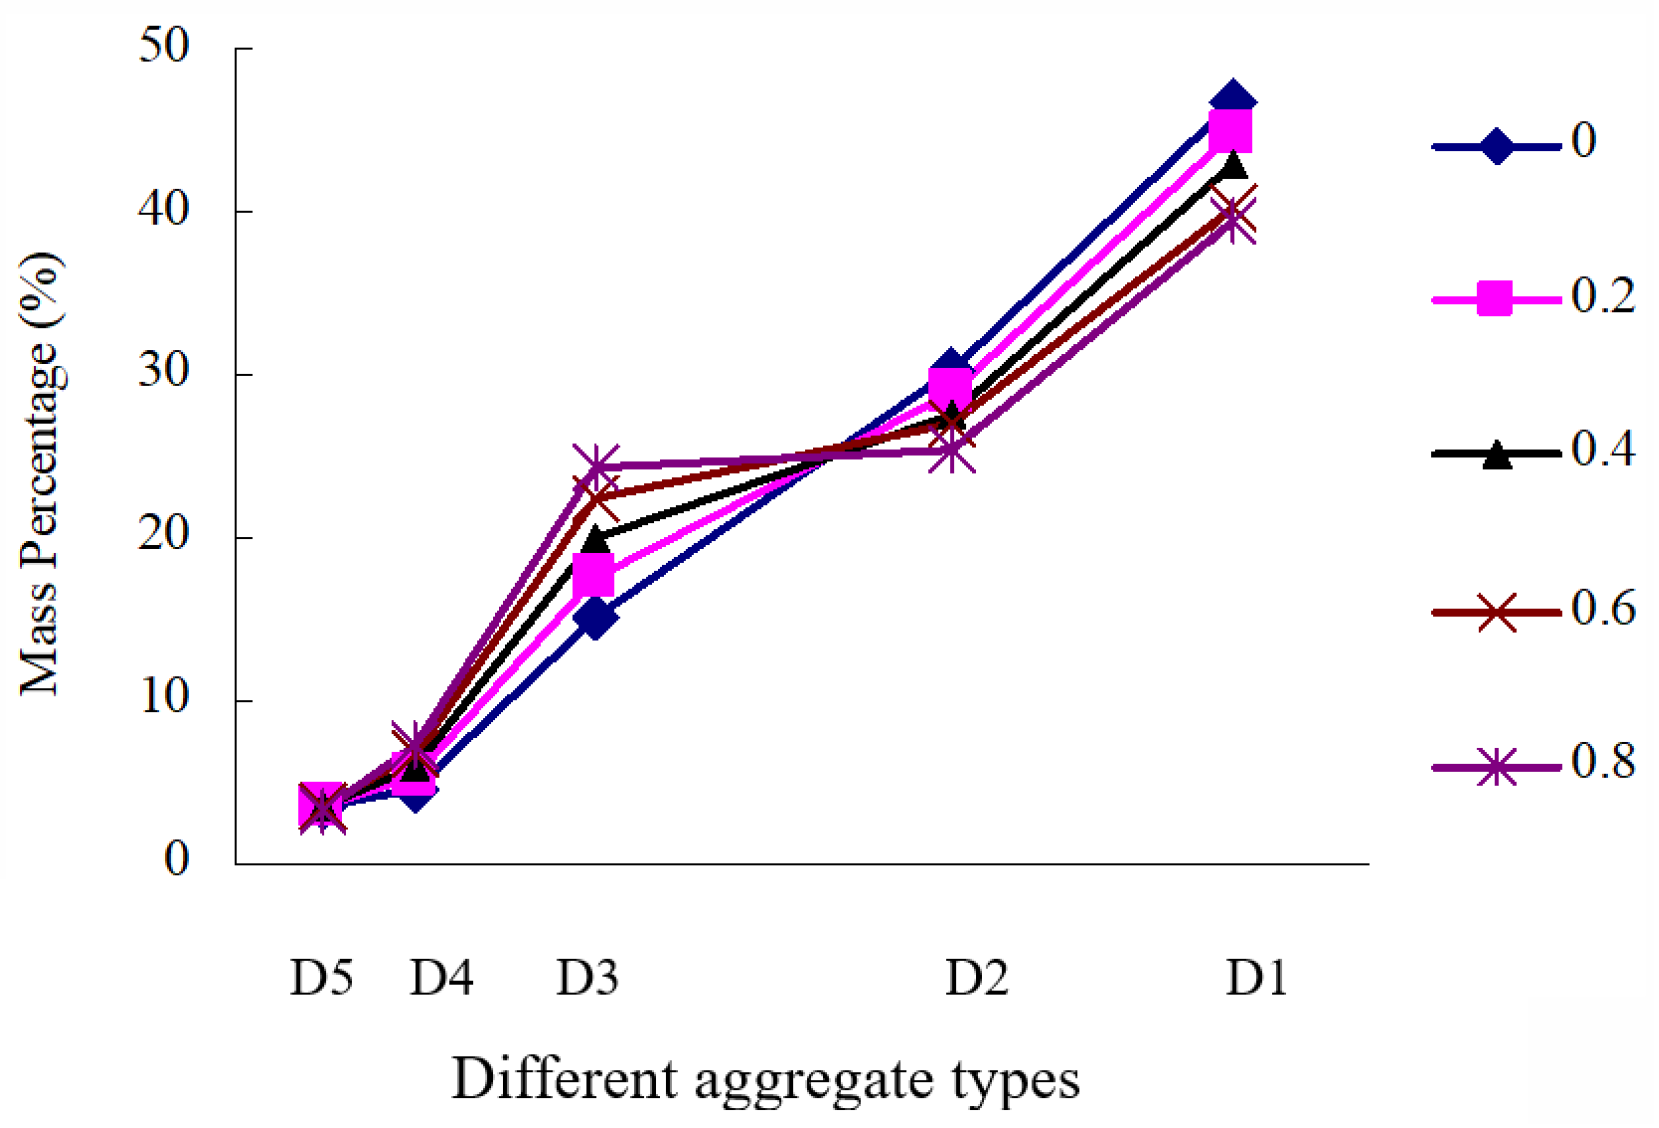
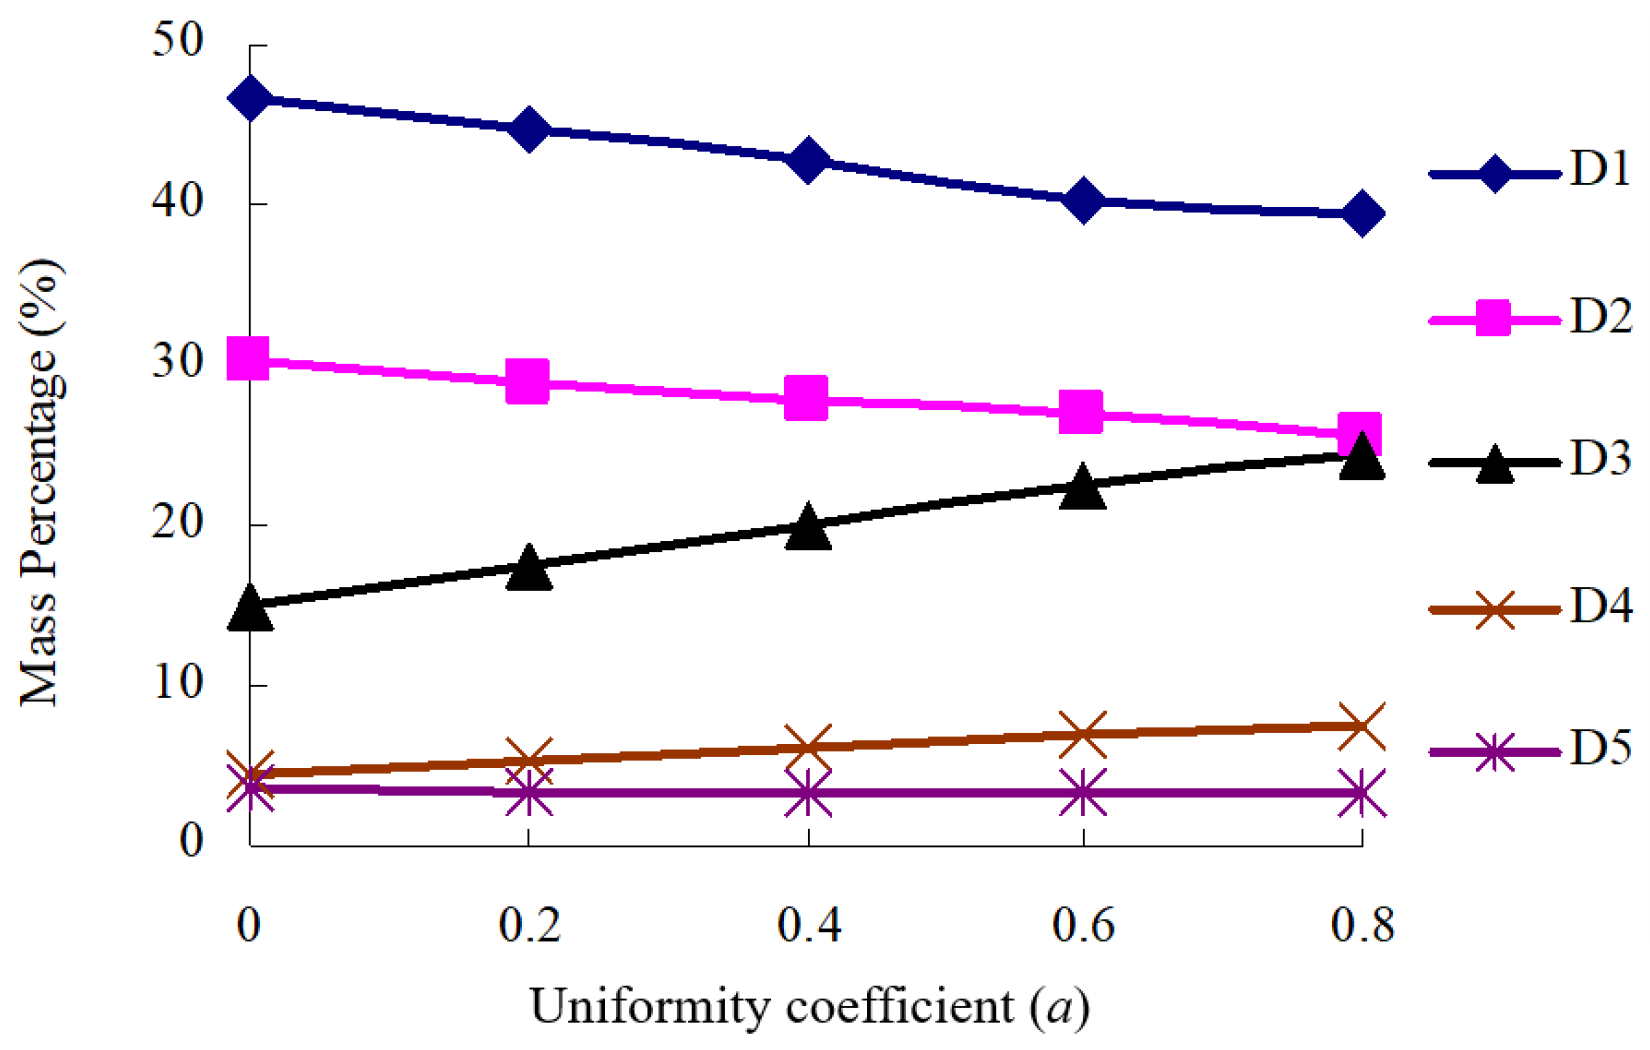
4.3. Aggregate Structure Composition
5. The Effect of Ratio of Coarse–Fine Aggregate (CF)
6. Asphalt Mixture Gradation Optimization and Test Verification
7. Conclusions
- The coarse aggregate structure can be regarded as a contact force transmission system composed of some strong and sub-strong contact forces. Moreover, the formation–evolution mechanism of coarse aggregate structure can be regarded as a process of the formation of strong and sub-strong contact forces and the transformation from sub-strong contact force to strong contact force.
- The main body of coarse aggregate consists of 4.75~19 mm aggregate, which is composed of a relatively stable structural system and is less affected by other sizes of coarse aggregate. The 2.36~4.75 mm aggregate acts as the secondary structure of the aggregate structure body, which plays the role of supporting the main structure and, at the same time, induces the secondary strong contact force provided by 4.75~19 mm aggregate to transform it into strong contact force and provide additional secondary strong contact force.
- The weak contact force is mainly provided by the aggregates with the particle size less than 2.36 mm, indicating that this aggregate contributes slightly to the formation of coarse aggregate structural bodies. From the point of view of the contribution to the formation of the aggregate structure body, 2.36 mm can be used as the dividing point of coarse and fine aggregates.
- The strength of the aggregate structure increases with the increase in the roughness of the aggregate, which is due to the transformation of sub-strong and weak contact forces to strong and sub-strong contact forces.
- In the asphalt mixture with the recommended gradation, dynamic stability increases by 30%, and fracture toughness increases by 26%, when compared to the mixtures with the standard gradation.
- The effects of other aggregate (recycled aggregate) properties and different temperatures on the aggregates are considered in our subsequent studies.
Author Contributions
Funding
Data Availability Statement
Conflicts of Interest
Abbreviations
| Si(i:1,2,3) | two-dimensional mapping area of the ith type coarse aggregate |
| mi | coarse aggregate mass of the ith type |
| W | particle formation area width |
| ρi | apparent density of the ith type coarse aggregate |
| G | shear modulus |
| U | amount of overlap between particle units |
| fn | contact force in each direction |
| Ε | Poisson’s ratio |
| vt+1/vt | target wall speed at time step t + 1 and t |
| Δσ | difference between the current pressure and the target pressure |
| A | relaxation factor |
| L | the length of target wall |
| kn | average stiffness |
| N | total number of contacts between the target wall and particles |
| Ni | aggregate contact force number of grade “i” |
| Nt | total number of aggregate contact forces |
| R | average radius of contact particles |
| Rit/rit | radius of particle and small particle at the ith type coarse aggregate |
| Xit/Yit | X and Y coordinates of particle at the ith type coarse aggregate |
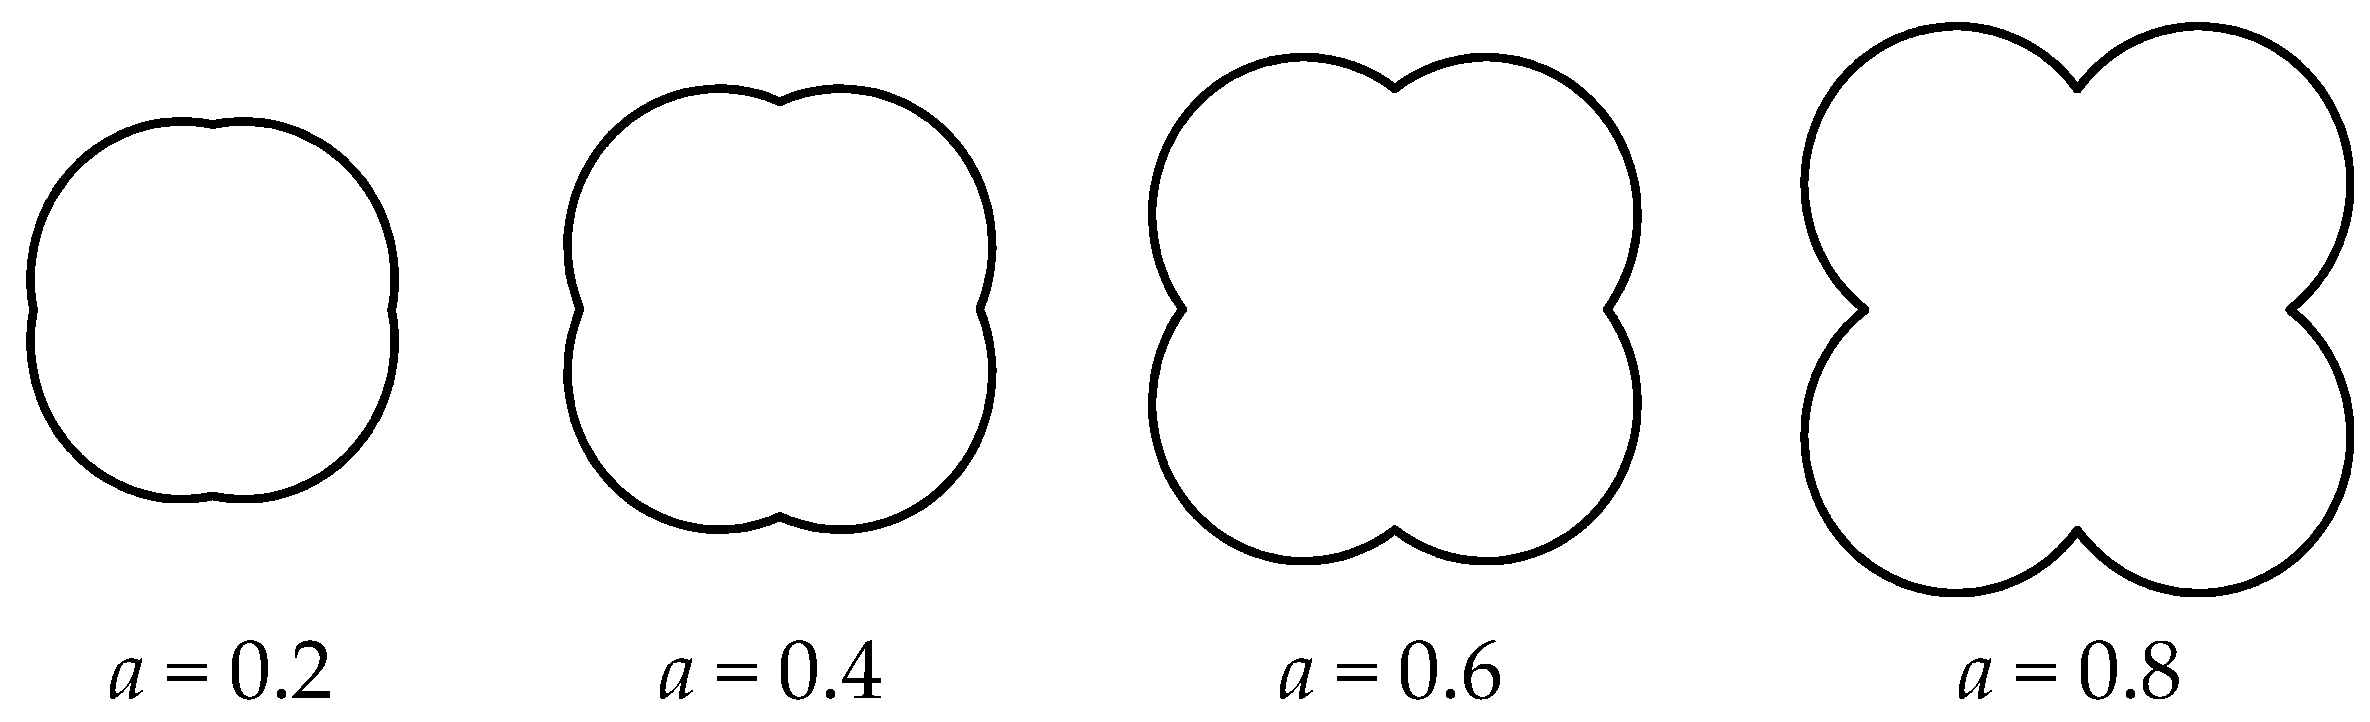
| a | uniformity coefficient |
References
- Shen, S.; Yu, H. Analysis of aggregate gradation and packing for easy estimation of hot-mix-asphalt voids in mineral aggregate. J. Mater. Civ. Eng. 2011, 23, 664–672. [Google Scholar] [CrossRef]
- Shen, S.; Yu, H. Characterize packing of aggregate particles for paving materials: Particle size impact. Constr. Build. Mater. 2011, 25, 1362–1368. [Google Scholar] [CrossRef]
- Pouranian, M.; Haddock, J. Effect of aggregate gradation on asphalt mixture compaction parameters. J. Mater. Civ. Eng. 2020, 32, 04020244. [Google Scholar] [CrossRef]
- Lira, B.; Ekblad, J.; Lundström, R. Evaluation of asphalt rutting based on mixture aggregate gradation. Road Mater. Pavement Des. 2021, 22, 1160–1177. [Google Scholar] [CrossRef] [Green Version]
- Shashidhar, N.; Gopalakrishnan, K. Evaluating the aggregate structure in hot-mix asphalt using three-dimensional computer modeling and particle packing simulation. Can. J. Civ. Eng. 2006, 33, 945–954. [Google Scholar] [CrossRef]
- Sun, Z.; Qi, H.; Li, S.; Tan, Y.; Yue, Z.; Lv, H. Estimating the effect of coarse aggregate meso-structure on the thermal contraction of asphalt mixture by a hierarchical prediction approach. Constr. Build. Mater. 2022, 342 Pt A, 128048. [Google Scholar] [CrossRef]
- You, Z.; Buttlar, W. Discrete element modeling to predict the modulus of asphalt concrete mixtures. J. Mater. Civ. Eng. 2004, 16, 140–146. [Google Scholar] [CrossRef]
- You, Z.; Adhikari, S.; Dai, Q. Three-dimensional discrete element models for asphalt mixtures. J. Eng. Mech. 2008, 134, 1053–1063. [Google Scholar] [CrossRef]
- Ren, J.; Sun, L. Characterizing air void effect on fracture of asphalt concrete at low-temperature using discrete element method. Eng. Fract. Mech. 2016, 170, 23–43. [Google Scholar] [CrossRef]
- Sun, L.; Ren, J.; Zhang, S. Fracture characteristics of asphalt concrete in mixed-loading mode at low-temperature based on discrete-element method. J. Mater. Civ. Eng. 2018, 30, 04018321. [Google Scholar] [CrossRef]
- Liu, W.; Gao, Y.; Huang, X. Effects of aggregate size and specimen scale on asphalt mixture cracking using a micromechanical simulation approach. J. Wuhan Univ. Technol.-Mater. Sci. Ed. 2017, 32, 1503–1510. [Google Scholar] [CrossRef]
- Wang, H.; Zhou, Z.; Huang, W.; Dong, X. Investigation of asphalt mixture permanent deformation based on three-dimensional discrete element method. Constr. Build. Mater. 2021, 272, 121808. [Google Scholar] [CrossRef]
- Cai, X.; Chen, L.; Zhang, R.; Huang, W.; Ye, X. Estimation of shear modulus of asphalt mixture based on the shear strength of the aggregate interface. Constr. Build. Mater. 2020, 248, 118695. [Google Scholar] [CrossRef]
- Chen, J.; Li, H.; Wang, L.; Wu, J.; Huang, X. Micromechanical characteristics of aggregate particles in asphalt mixtures. Constr. Build. Mater. 2015, 91, 80–85. [Google Scholar] [CrossRef]
- Pouranian, M.R.; Haddock, J.E. A new framework for understanding aggregate structure in asphalt mixtures. Int. J. Pavement Eng. 2019, 22, 1090–1106. [Google Scholar] [CrossRef]
- JTC E-20-2011; Highway Engineering Asphalt and Asphalt Mixture Test Procedures. Ministry of Transport of the People’s Public of China: Beijing, China, 2011.
- JTC B42-2005; Highway Engineering Aggregate Test Procedure. Ministry of Transport of the People’s Public of China: Beijing, China, 2005.
- Xue, B.; Pei, J.; Zhou, B.; Zhang, J.; Li, R.; Guo, F. Using random heterogeneous dem model to simulate the SCB fracture behavior of asphalt concrete. Constr. Build. Mater. 2020, 236, 117580. [Google Scholar] [CrossRef]
- Yang, X.; You, Z.; Jin, C.; Diab, A.; Hasan, M. Aggregate morphology and internal structure for asphalt concrete: Prestep of computer-generated microstructural models. Int. J. Geomech. 2018, 18, 06018024. [Google Scholar] [CrossRef]
- Wei, H.; Li, J.; Wang, F.; Zheng, J.; Tao, Y.; Zhang, Y. Numerical investigation on fracture evolution of asphalt mixture compared with acoustic emission. Int. J. Pavement Eng. 2021, 23, 3481–3491. [Google Scholar] [CrossRef]
- Azéma, E.; Estrada, N.; Radjai, F. Nonlinear Effects of particle shape angularity in sheared granular media. Phys. Rev. E 2012, 86, 1115. [Google Scholar] [CrossRef] [Green Version]
- Visseq, V.; Martin, A.; Iceta, D.; Azema, E.; Dureisseix, D.; Alart, P. Dense granular dynamics analysis by a domain decomposition approach. Comput. Mech. 2012, 49, 709–723. [Google Scholar] [CrossRef] [Green Version]
- JTC 3430-2020; Test Methods of Soils for Highway Engineering. Ministry of Transport of the People’s Public of China: Beijing, China, 2020.
- Le, J.-L.; Hendrickson, R.; Marasteanu, M.O.; Turos, M. Use of fine aggregate matrix for computational modeling of low temperature fracture of asphalt concrete. Mater. Struct. 2018, 51, 152.1–152.13. [Google Scholar] [CrossRef]
- Ma, T.; Zhang, Y.; Wang, H.; Huang, X.; Zhao, Y. Influences by air voids on the low-temperature cracking property of dense-graded asphalt concrete based on micromechanical modeling. Adv. Mater. Sci. Eng. 2016, 2016, 6942696. [Google Scholar] [CrossRef] [Green Version]
- Zhang, H.; Liu, H.; You, W. Microstructural behavior of the low-temperature cracking and self-healing of asphalt mixtures based on the discrete element method. Mater. Struct. 2022, 55, 18. [Google Scholar] [CrossRef]
- Sun, Q.; Jing, F.; Wang, G.; Zhang, G. Force chains in a uniaxially compressed static granular matter in 2D. Acta Phys. Sin. 2010, 59, 30–37. [Google Scholar]


| Test Project | Results | Technical Specifications | |
|---|---|---|---|
| Needle penetration (25 °C, 100 g, 5 s)/0.1 mm | 65.2 | 60~80 | |
| Softening point (Universal method)/°C | 51.9 | ≥45 | |
| Ductility(5 cm/min, 10 °C)/cm | 21.4 | ≥15 | |
| Needle penetration index | −0.818 | −1.5~+1.0 | |
| 60 °C power viscosity/(/Pa·s) | 411 | ≥180 | |
| Density (25 °C)/(g/cm3) | 1.01 | - | |
| Wax content (%) | 1.55 | <2.2 | |
| After RTFOT | Mass loss (%) | 0.33 | −1%~1 |
| Needle penetration ratio (%) | 62.1 | ≥61 | |
| Ductility (5 cm/min, 10 °C)/cm | 6.71 | ≥6 | |
| Properties | Index | Requirements | Test Value | Test Method | |
|---|---|---|---|---|---|
| Coarse aggregate | Robustness (%) | ≤12 | 7.7 | T 0314 | |
| Stone crushing value (%) | ≤26 | 12.1 | T 0316 | ||
| Los Angeles abrasion loss (%) | ≤28 | 14.4 | T 0317 | ||
| Water absorption rate (%) | ≤2.0 | 1.2 | T 0304 | ||
| Fine aggregate | Angularity | ≥30 | 45 | T 0345 | |
| sand equivalent (%) | ≥60 | 79 | T 0334 | ||
| Robustness (%) | ≥12 | 15.4 | T 0340 | ||
| Mineral powder | Hydrophilic coefficient | <1 | 0.51 | T 0353 | |
| Moisture content (%) | ≤1 | 0.44 | T 0103 | ||
| Particle size (%) | <0.6 mm | 100 | 100 | T 0351 | |
| <0.15 mm | 90~100 | 94.3 | |||
| <0.075 mm | 75~100 | 86.7 | |||
| Packing | Index | Grade 1: (Double {F}, +∞) | Grade 2: ({F}, Double {F}) | Grade 3: (0, <{F}) |
|---|---|---|---|---|
| P3 | P(f)/% | 17.97 | 36.94 | 45.09 |
| Ni | 108 | 222 | 271 | |
| P4 | P(f)/% | 14.04 | 33.24 | 52.72 |
| Ni | 155 | 367 | 582 | |
| P5 | P(f)/% | 9.93 | 24.17 | 65.87 |
| Ni | 162 | 393 | 1071 |
| a | Index | Grade 1: (Double {F}, +∞) | Grade 2: ({F}, Double {F}) | Grade 3: (0, <{F}) |
|---|---|---|---|---|
| 0 | P(f)/% | 7.13 | 21.57 | 71.30 |
| Ni | 119 | 360 | 1190 | |
| 0.2 | P(f)/% | 7.73 | 22.69 | 69.59 |
| Ni | 127 | 373 | 1144 | |
| 0.4 | P(f)/% | 8.62 | 23.51 | 67.87 |
| Ni | 139 | 379 | 1094 | |
| 0.6 | P(f)/% | 9.93 | 24.17 | 65.87 |
| Ni | 162 | 393 | 1071 | |
| 0.8 | P(f)/% | 11.65 | 24.49 | 63.85 |
| Ni | 196 | 412 | 1074 |
| a | D1:D2:D3:D4 | Coarse Aggregate Ratio | Sieve Passing Rate (%) | ||||
|---|---|---|---|---|---|---|---|
| 19 mm | 13.2 mm | 9.5 mm | 4.75 mm | 2.36 mm | |||
| 0.4 | 42.30:27.64:20.00:6.08 | 60~90 | 100 | 60.4~73.6 | 34.5~56.3 | 15.7~43.8 | 10~40 |
| 0.6 | 40.40:26.93:22.44:6.82 | 100 | 62.4~74.9 | 37.3~58.2 | 16.4~44.2 | 10~40 | |
| 0.8 | 39.48:25.46:24.38:7.41 | 100 | 63.3~75.5 | 39.6~59.7 | 16.9~44.6 | 10~40 | |
| CF Aggregate Ratio | Sieve Passing Rate (%) | |||||||||
|---|---|---|---|---|---|---|---|---|---|---|
| 19 mm | 13.2 mm | 9.5 mm | 4.75 mm | 2.36 mm | 1.18 mm | 0.6 mm | 0.3 mm | 0.15 mm | 0.075 mm | |
| 90:10 | 100 | 62.0 | 37.1 | 16.3 | 10 | 7.30 | 5.58 | 4.43 | 3.68 | 3.24 |
| 85:15 | 100 | 64.1 | 40.6 | 21.0 | 15 | 10.96 | 8.38 | 6.65 | 5.53 | 4.86 |
| 80:20 | 100 | 66.2 | 44.1 | 25.6 | 20 | 14.61 | 11.17 | 8.87 | 7.37 | 6.48 |
| 75:25 | 100 | 68.3 | 47.6 | 30.3 | 25 | 18.26 | 13.96 | 11.08 | 9.21 | 8.11 |
| 70:30 | 100 | 70.5 | 51.1 | 34.9 | 30 | 21.91 | 16.75 | 13.30 | 11.05 | 9.73 |
| 65:35 | 100 | 72.6 | 54.6 | 40.0 | 35 | 25.56 | 19.55 | 15.52 | 12.89 | 11.35 |
| 60:40 | 100 | 74.7 | 58.1 | 44.2 | 40 | 29.22 | 22.34 | 17.73 | 14.74 | 12.97 |
| CF Ratio | Dynamic Stability | Fracture Toughness |
|---|---|---|
| 90:10 | 848 | 0.94 |
| 85:15 | 1190 | 1.14 |
| 80:20 | 1336 | 1.26 |
| 75:25 | 1446 | 1.41 |
| 70:30 | 1125 | 1.09 |
| 65:35 | 834 | 0.79 |
| 60:40 | 768 | 0.88 |
| Gradation | Sieve Passing Rate (%) | |||||||||
|---|---|---|---|---|---|---|---|---|---|---|
| 19 mm | 13.2 mm | 9.5 mm | 4.75 mm | 2.36 mm | 1.18 mm | 0.6 mm | 0.3 mm | 0.15 mm | 0.075 mm | |
| RG | 100 | 64~70 | 42~49 | 25~31 | 20~25 | 14~18 | 11~14 | 9~12 | 7~10 | 6~9 |
| SG | 100 | 70~92 | 60~80 | 34~62 | 20~48 | 13~36 | 9~26 | 7~18 | 5~14 | 4~8 |
| Technical Properties | RG | SG | Performance Ratio |
|---|---|---|---|
| Dynamic stability (KN) | 3187 | 2451 | 1.30 |
| Fracture toughness (Mpa·m0.5) | 1.122 | 0.893 | 1.26 |
Disclaimer/Publisher’s Note: The statements, opinions and data contained in all publications are solely those of the individual author(s) and contributor(s) and not of MDPI and/or the editor(s). MDPI and/or the editor(s) disclaim responsibility for any injury to people or property resulting from any ideas, methods, instructions or products referred to in the content. |
© 2023 by the authors. Licensee MDPI, Basel, Switzerland. This article is an open access article distributed under the terms and conditions of the Creative Commons Attribution (CC BY) license (https://creativecommons.org/licenses/by/4.0/).
Share and Cite
Chen, J.; Wang, J.; Li, M.; Zhao, Z.; Ren, J. Mesoscopic Mechanical Properties of Aggregate Structure in Asphalt Mixtures and Gradation Optimization. Materials 2023, 16, 4709. https://doi.org/10.3390/ma16134709
Chen J, Wang J, Li M, Zhao Z, Ren J. Mesoscopic Mechanical Properties of Aggregate Structure in Asphalt Mixtures and Gradation Optimization. Materials. 2023; 16(13):4709. https://doi.org/10.3390/ma16134709
Chicago/Turabian StyleChen, Jingchun, Jian Wang, Min Li, Zedong Zhao, and Jiaolong Ren. 2023. "Mesoscopic Mechanical Properties of Aggregate Structure in Asphalt Mixtures and Gradation Optimization" Materials 16, no. 13: 4709. https://doi.org/10.3390/ma16134709