
Reproducibility Study of the Thermoplastic Resin Transfer Molding Process for Glass Fiber Reinforced Polyamide 6 Composites †
 , , , and
Abstract
:1. Introduction
2. Materials and Methods
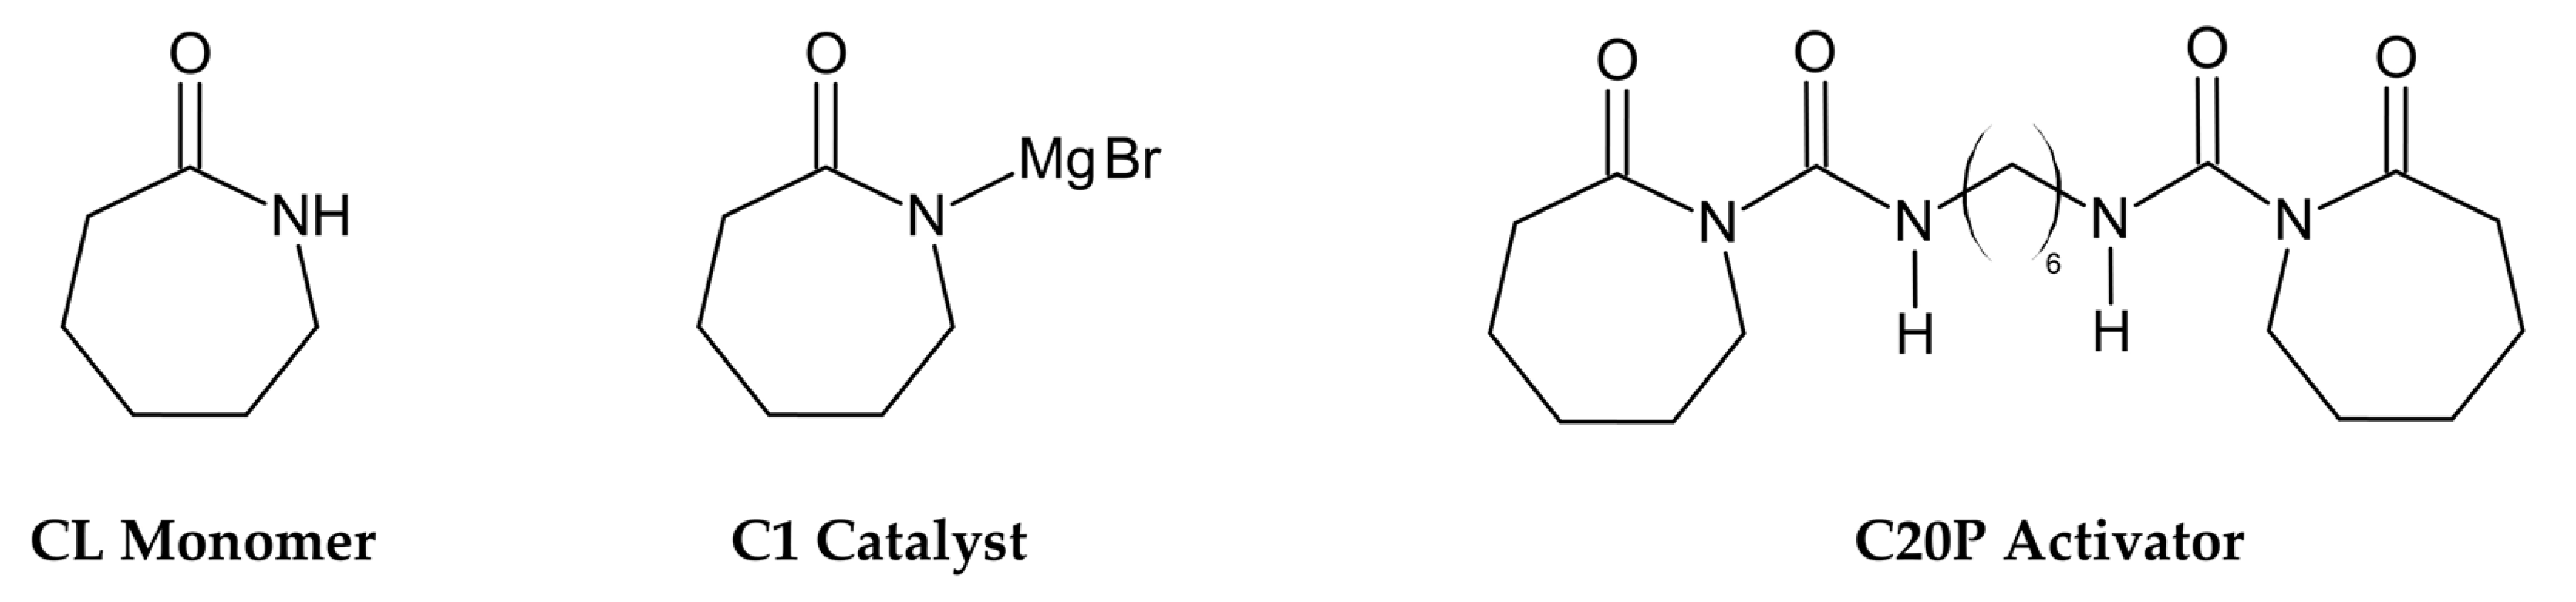
2.1. Materials
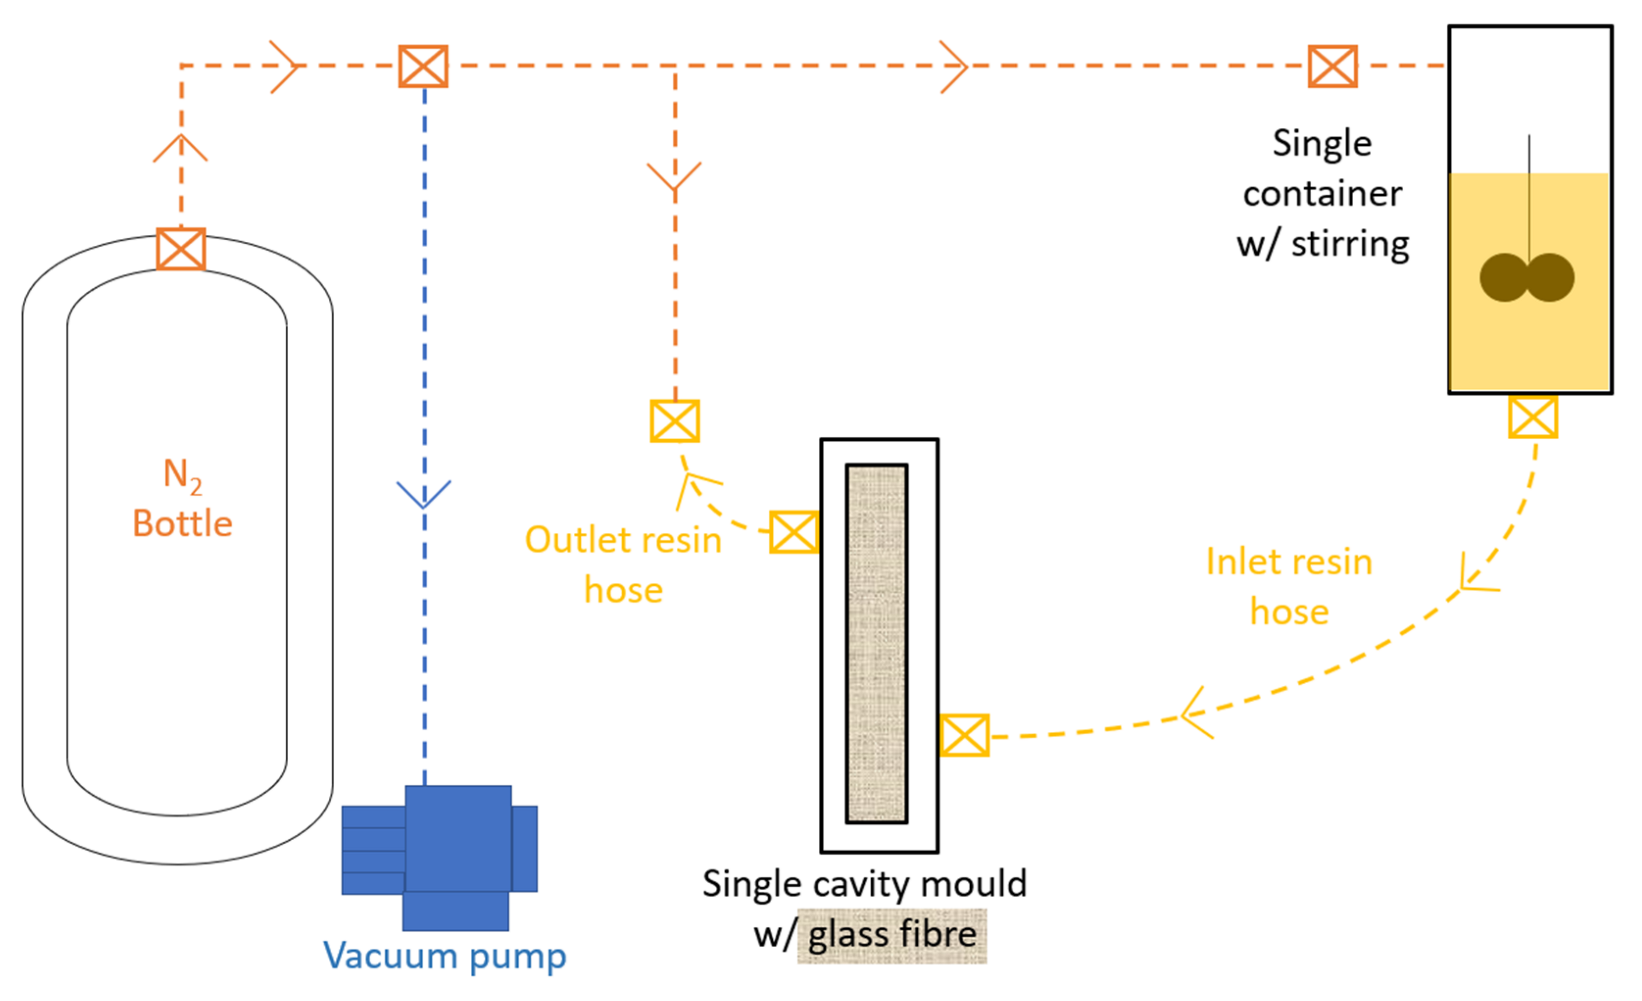
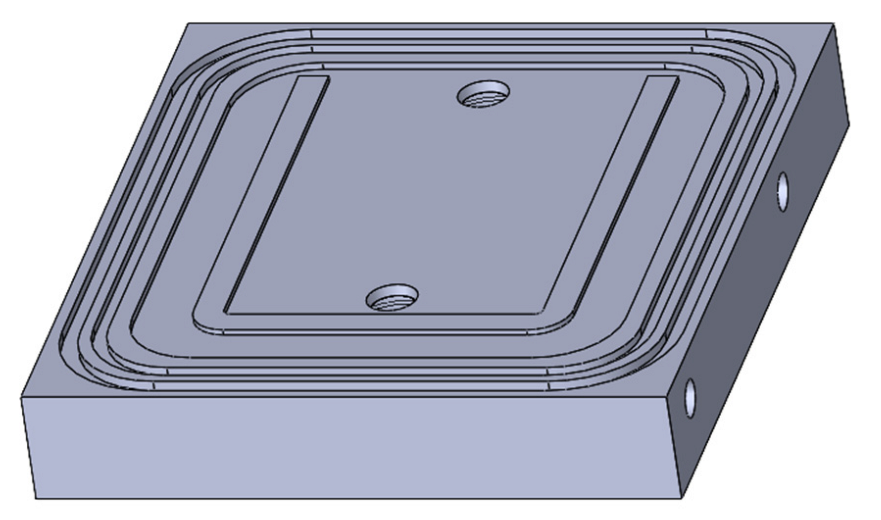
2.2. T-RTM Prototype Equipment and Processing
2.3. Materials Characterization
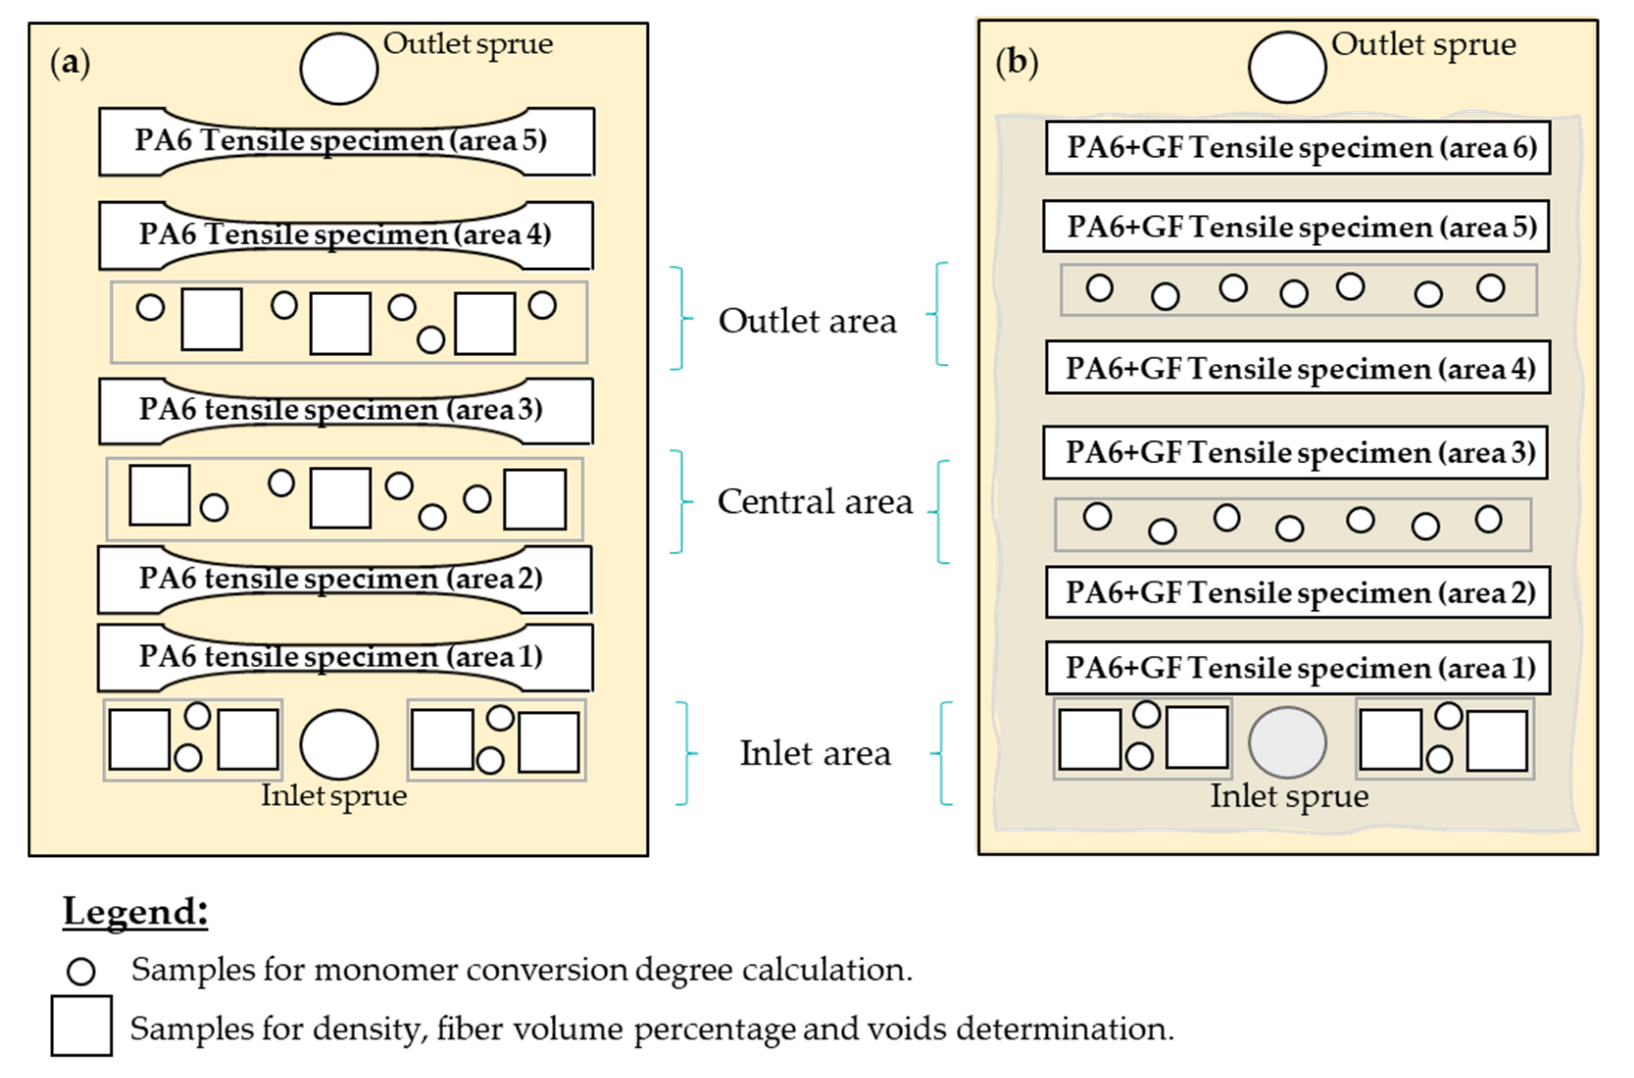
2.3.1. Mechanical Analysis
2.3.2. Monomer Conversion Degree
2.3.3. Density, Fiber Volume Content and Void Volume Content
3. Results and Discussion
3.1. Mechanical Analysis
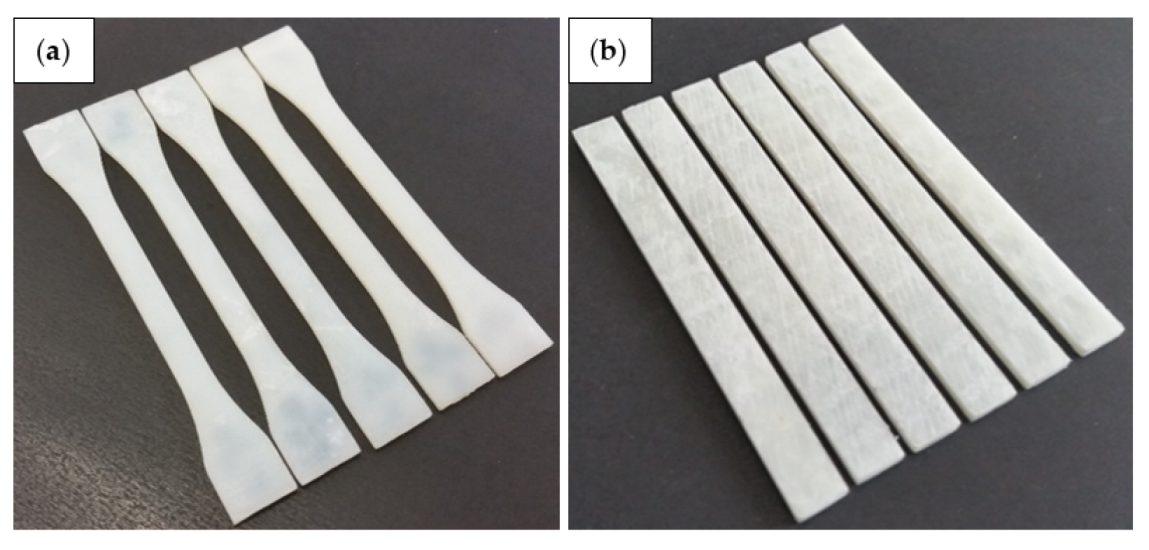
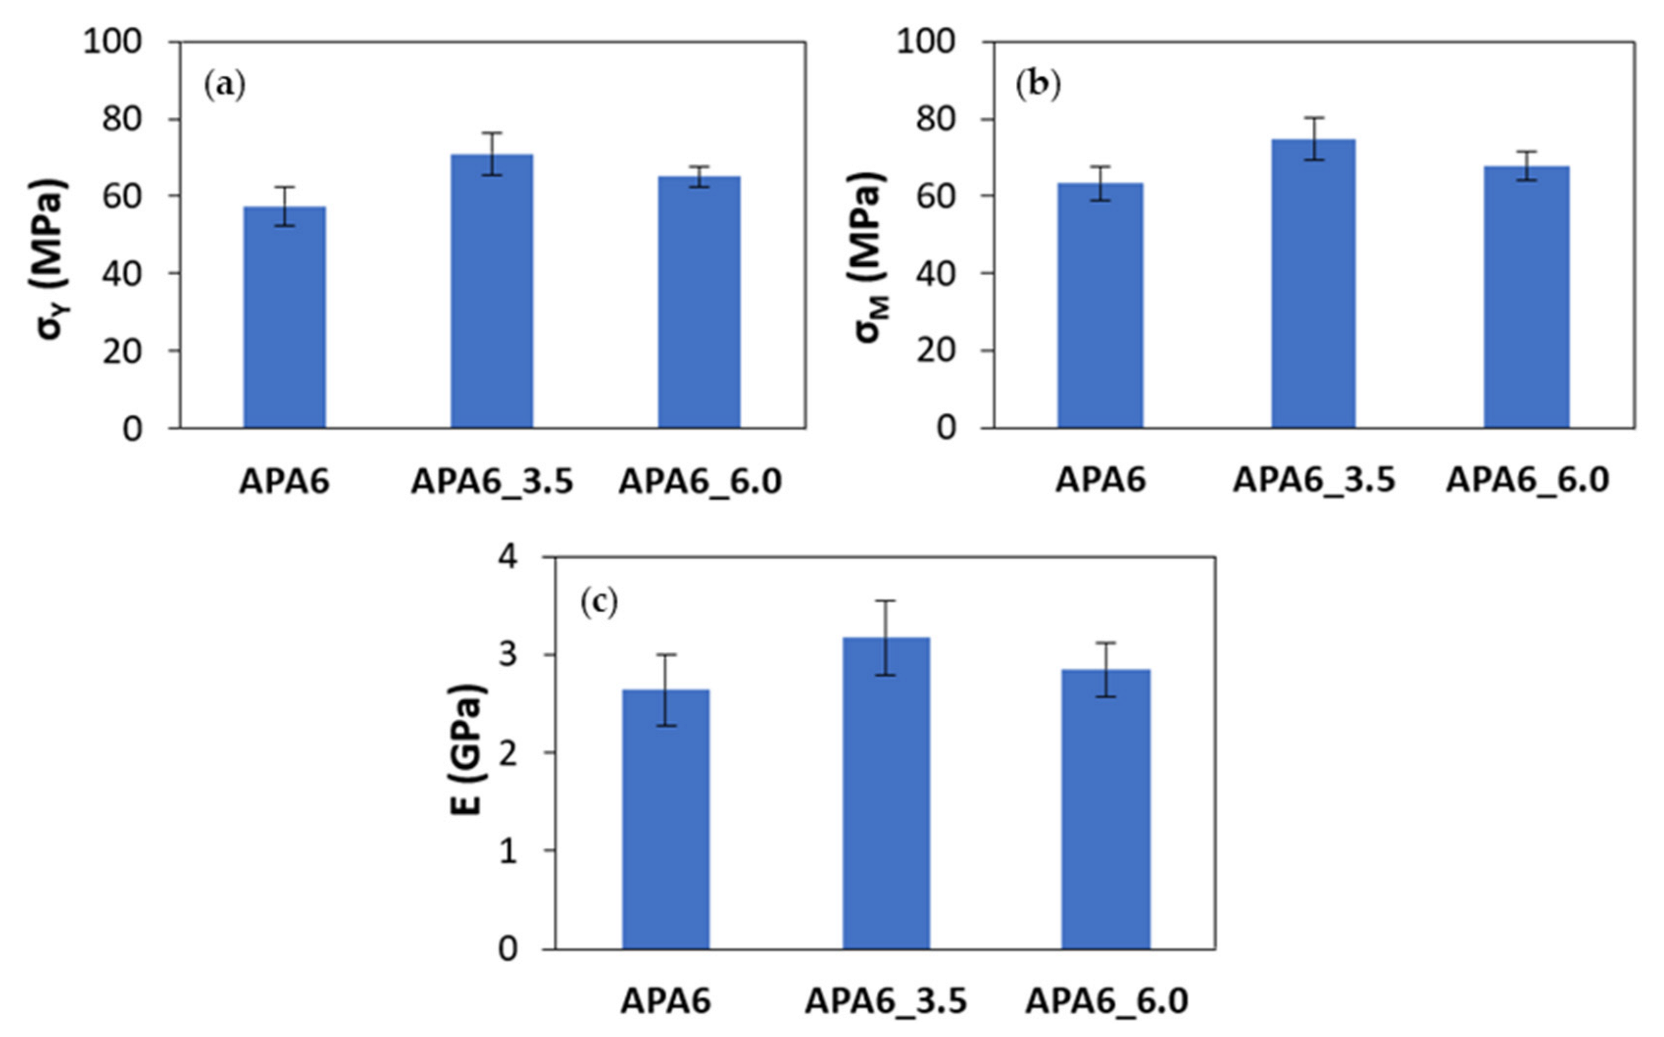
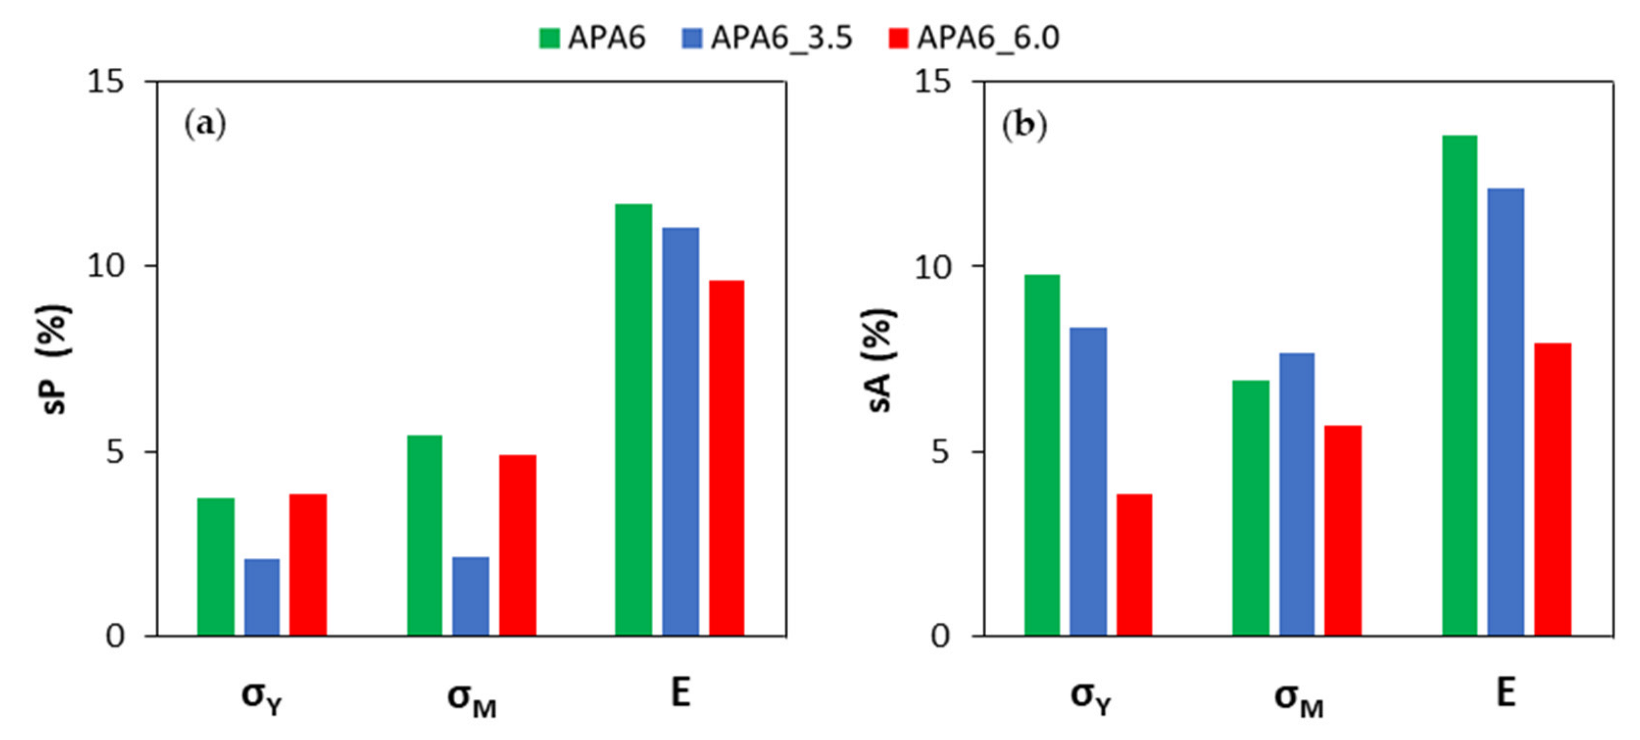
3.1.1. Neat Polymer Parts
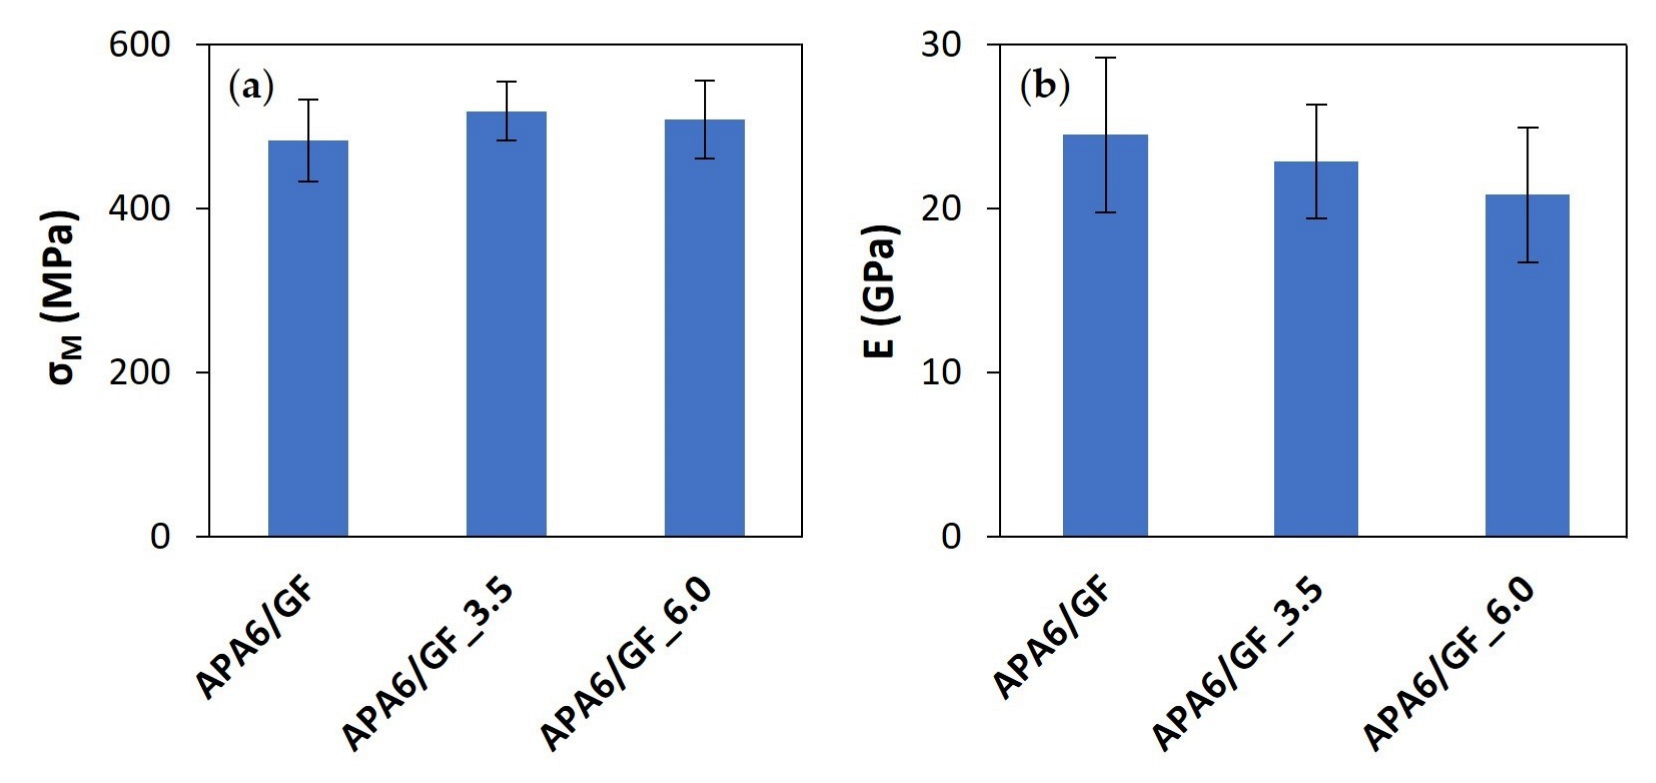
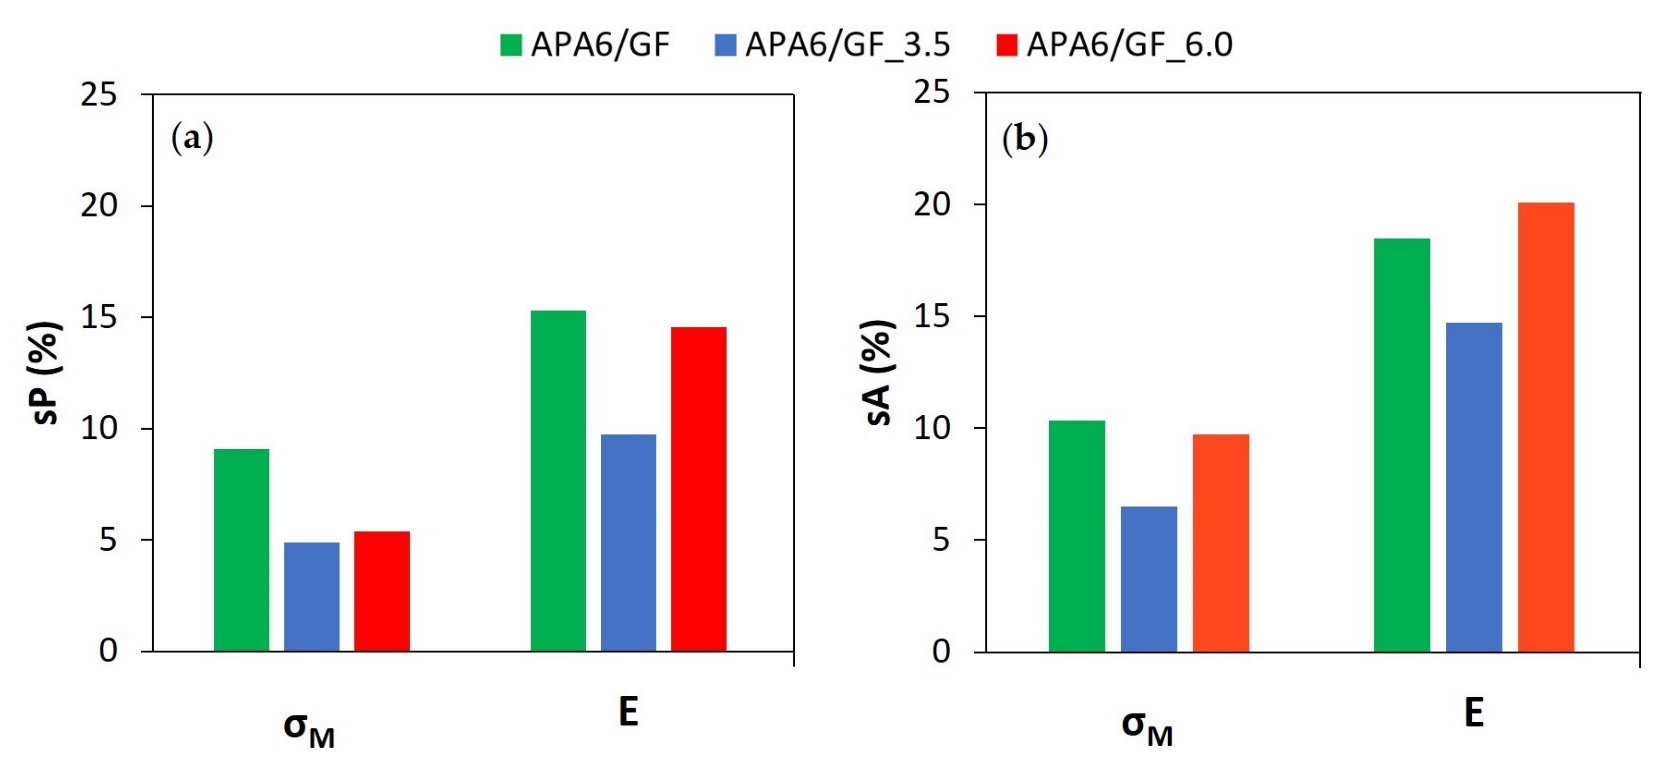
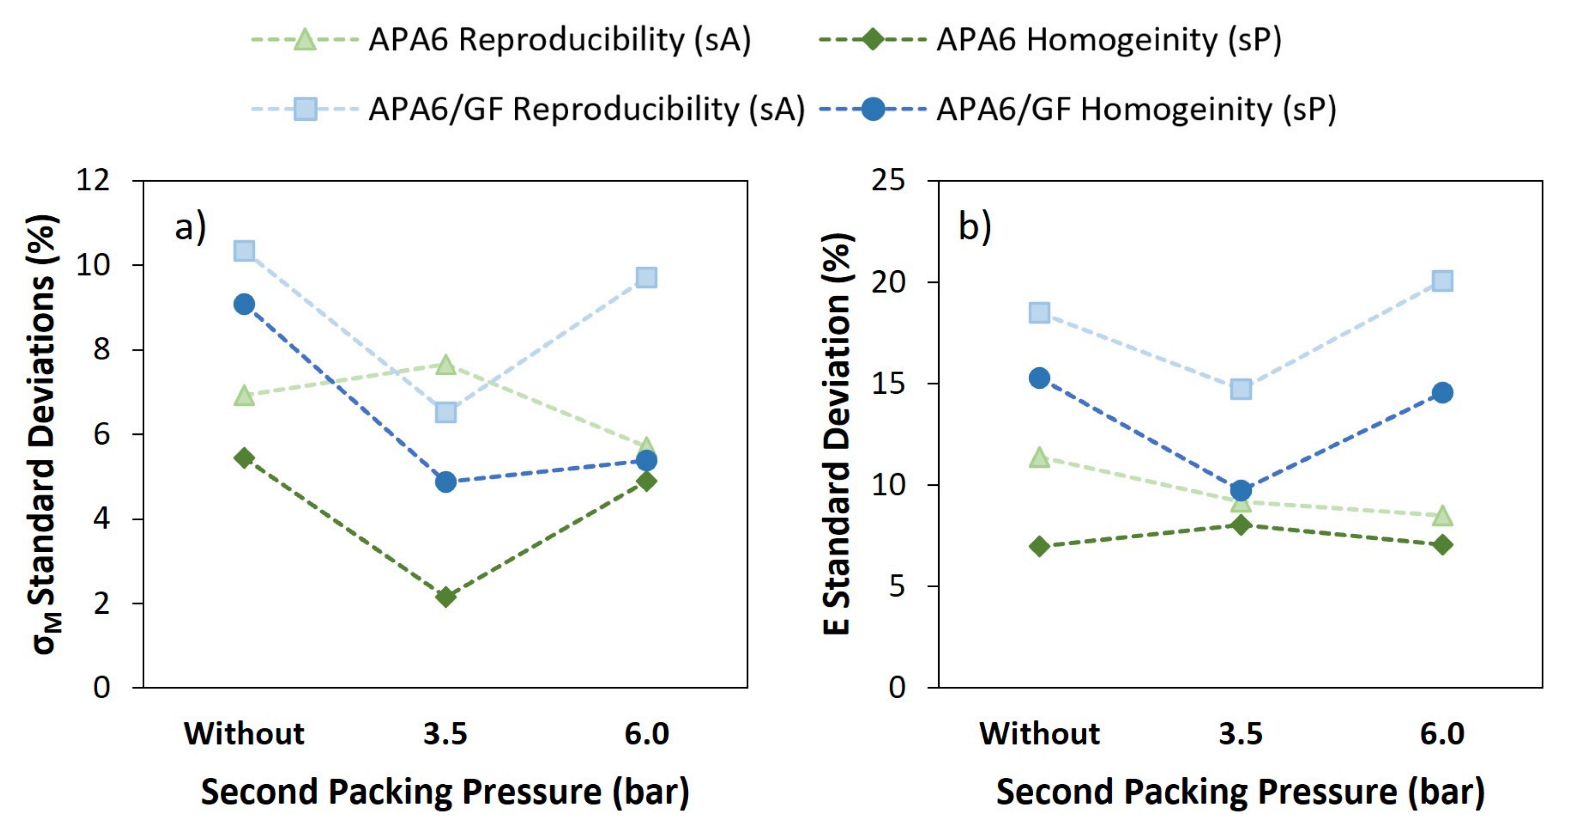
3.1.2. Composite Parts
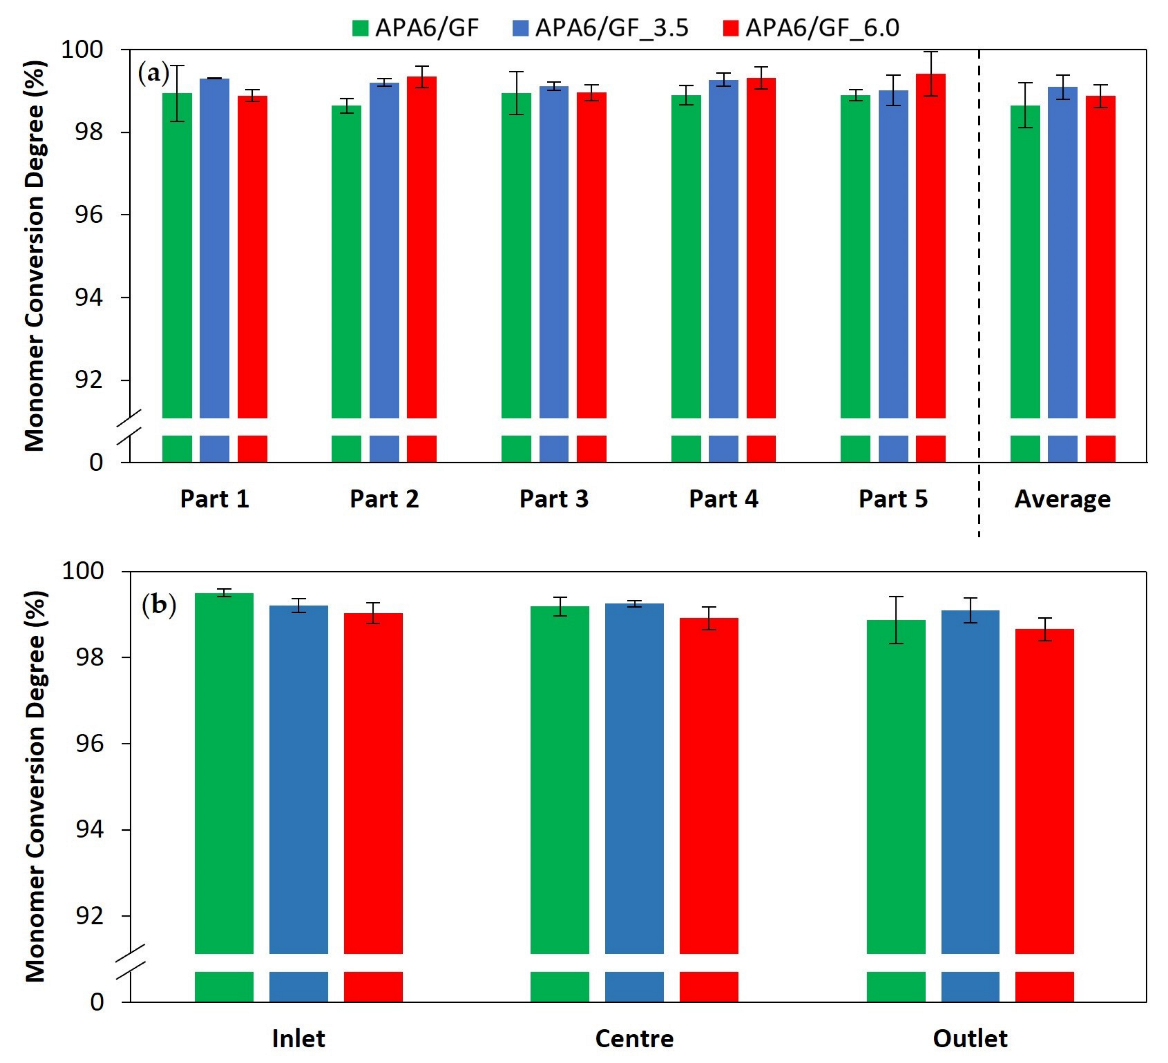
3.2. Monomer Conversion Degree
3.2.1. Neat Polymer Parts’ Monomer Conversion Degree
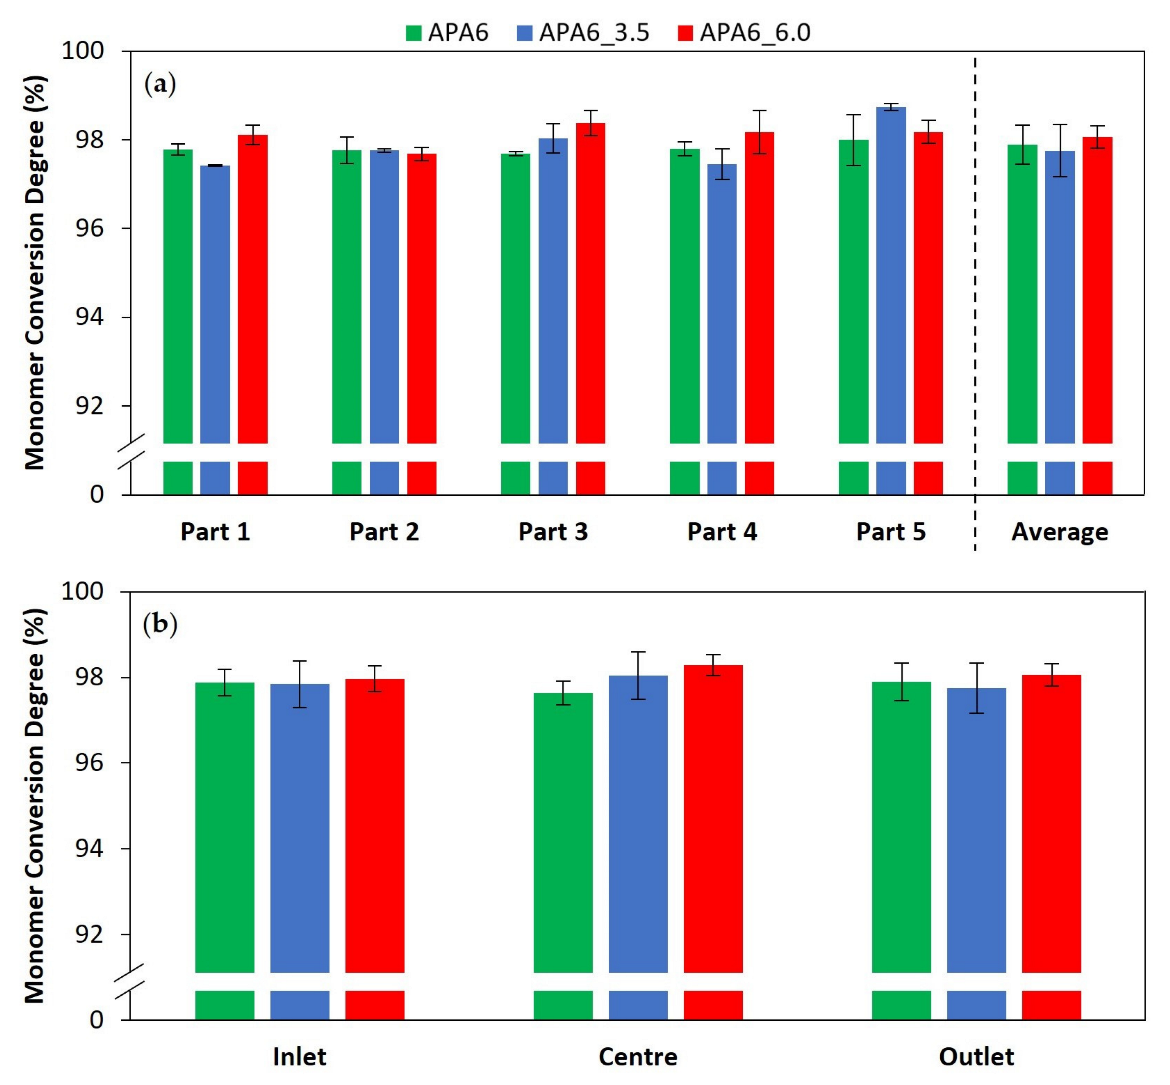
3.2.2. Composite Parts’ Monomer Conversion Degree
3.3. Density, FVC and VVC
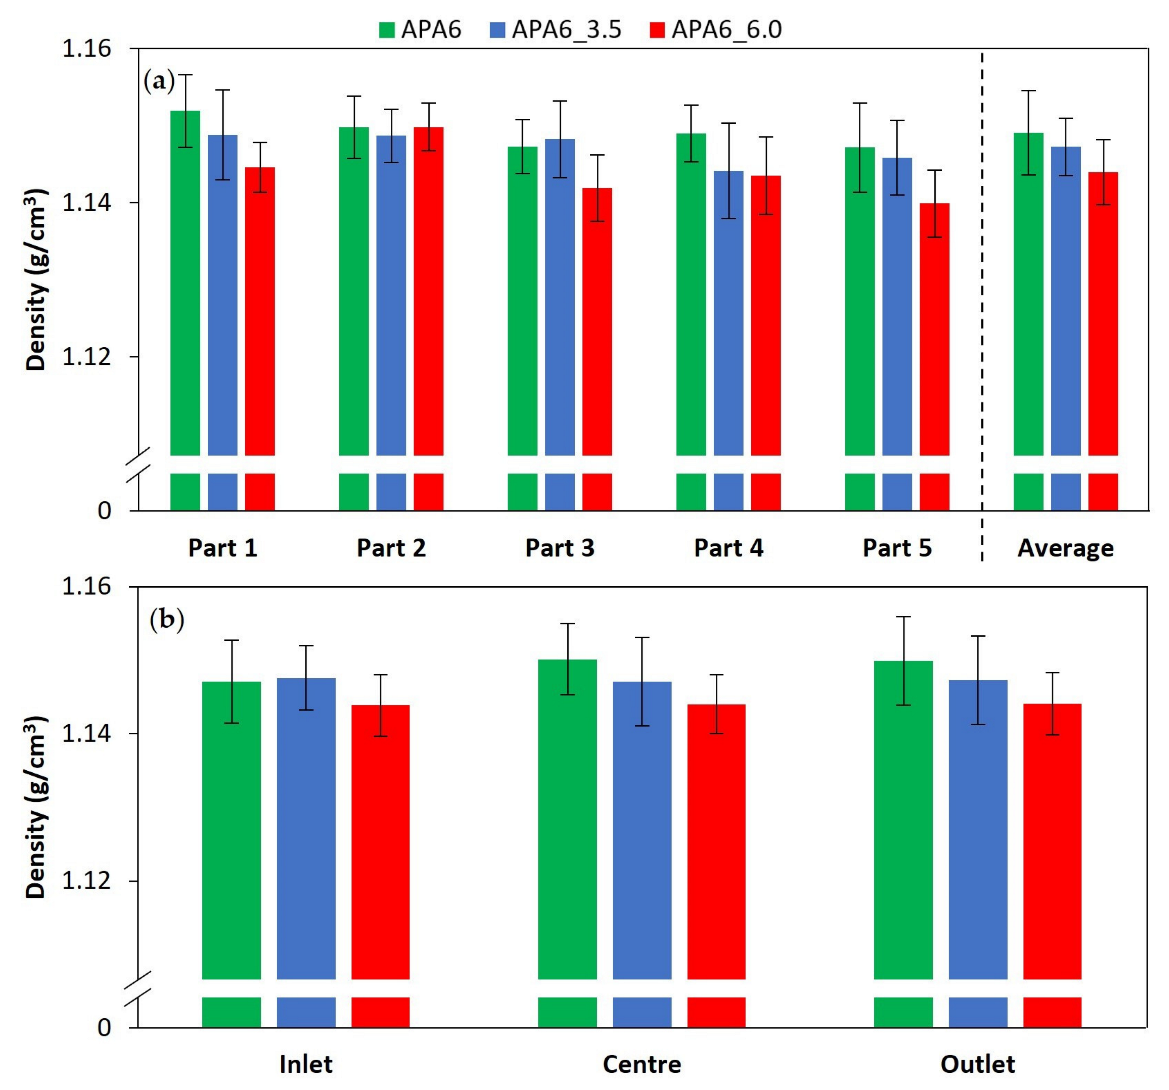
3.3.1. Neat Polymer Parts’ Density and VVC
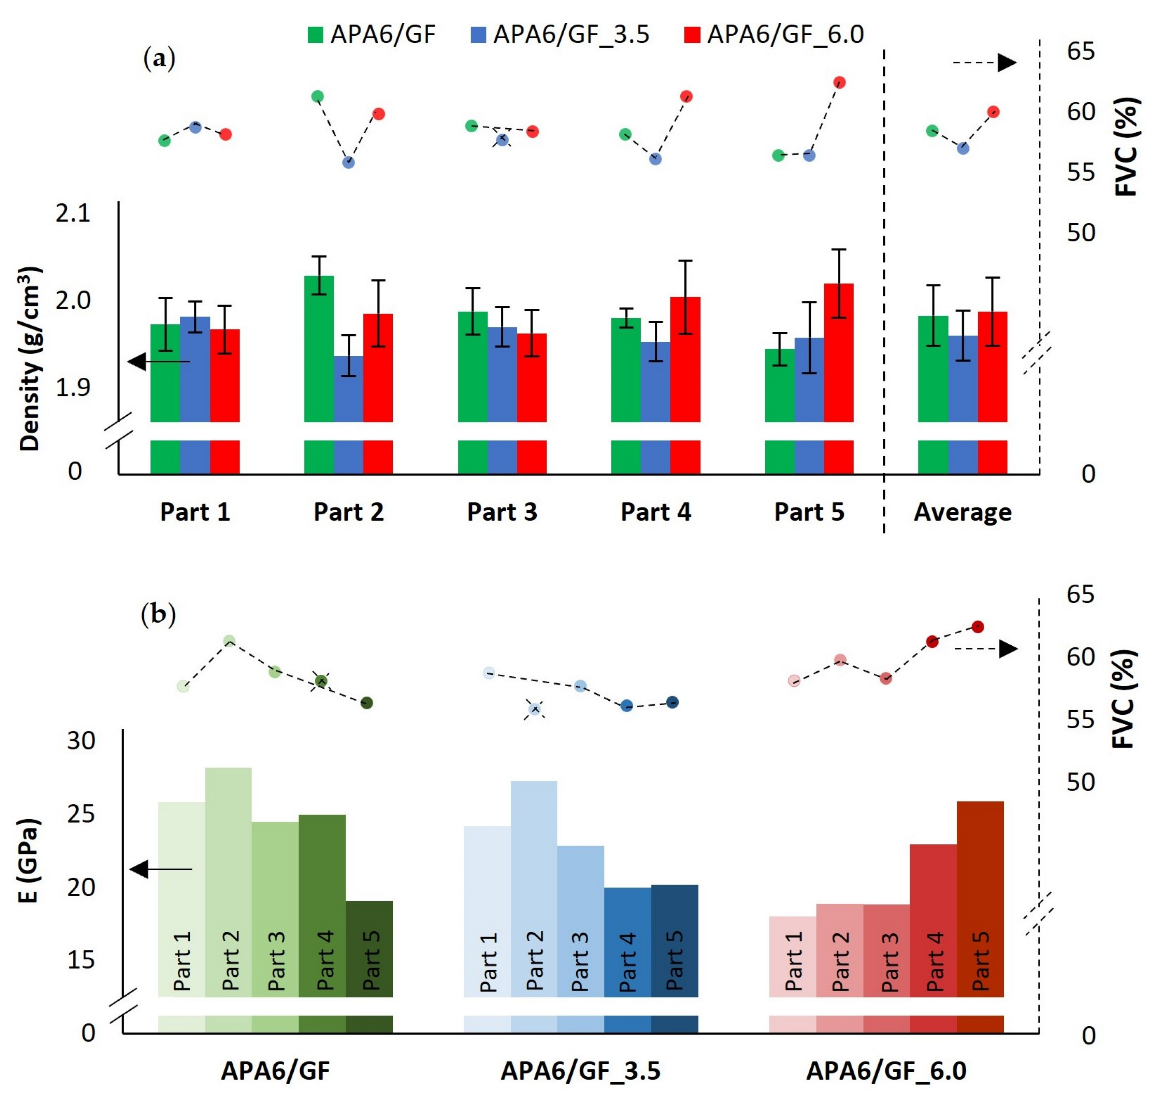
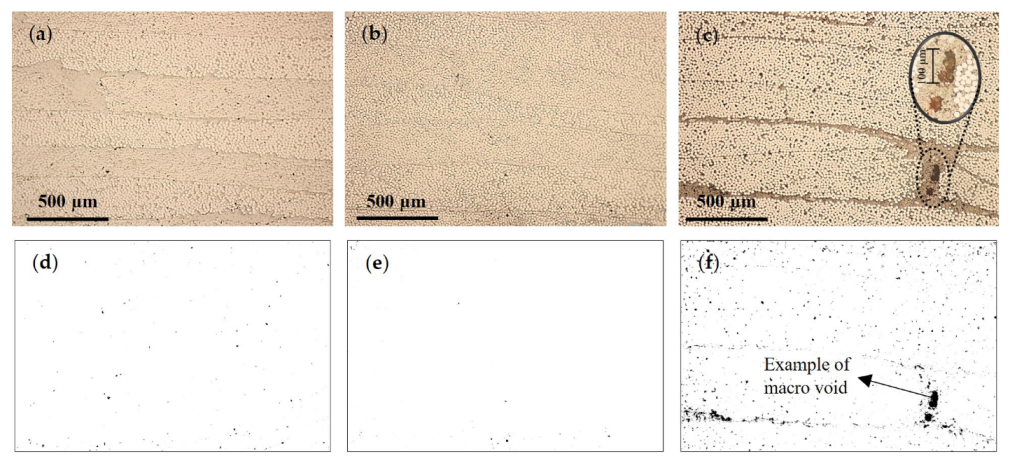
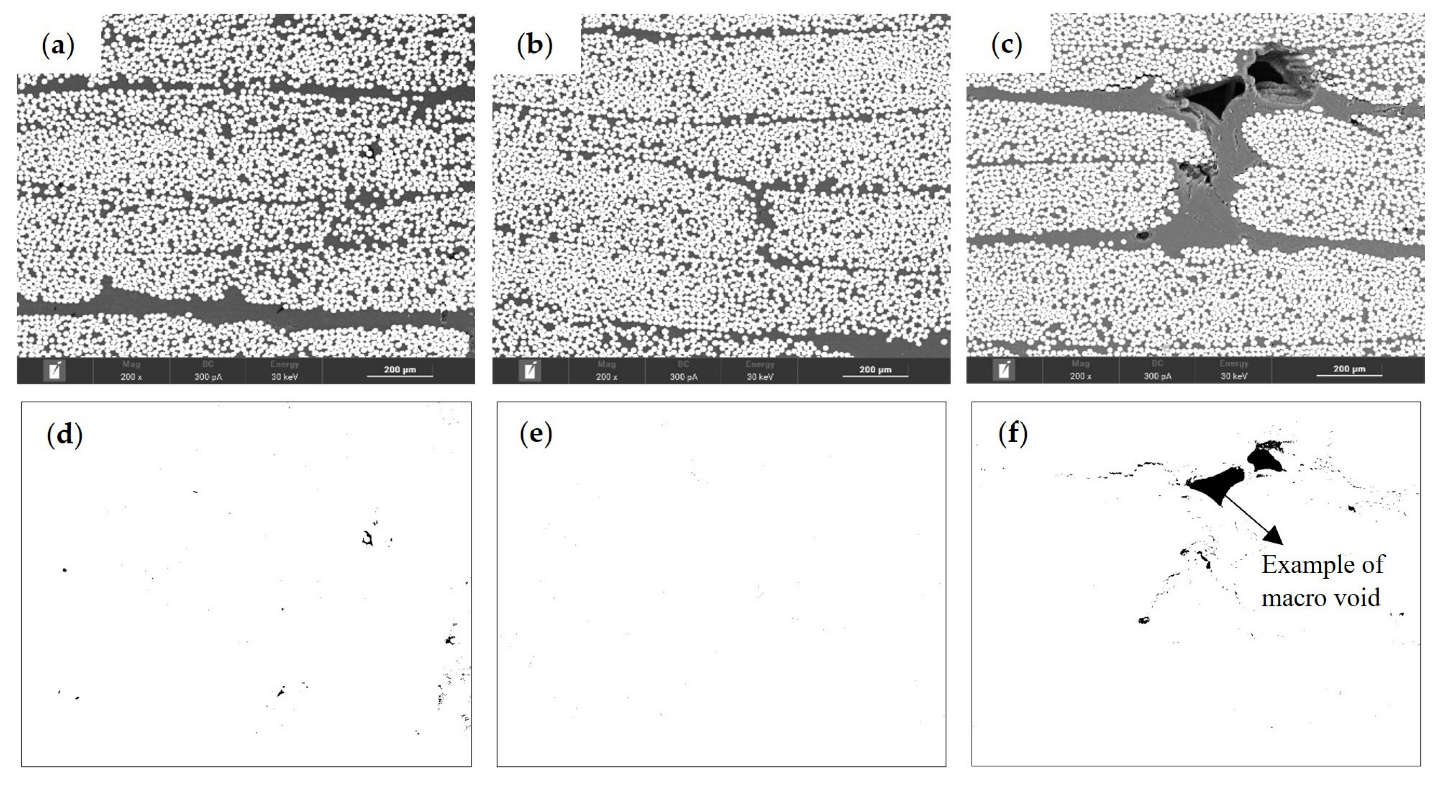
3.3.2. Composite Parts’ Density, FVC and VVC
4. Conclusions and Future Work
Author Contributions
Funding
Institutional Review Board Statement
Informed Consent Statement
Data Availability Statement
Acknowledgments
Conflicts of Interest
References
- Rhodium Group. Preliminary 2020 Global Greenhouse Gas Emissions Estimates. Available online: https://rhg.com/research/preliminary-2020-global-greenhouse-gas-emissions-estimates/ (accessed on 26 October 2022).
- Maazouz, A.; Lamnawar, K.; Dkier, M. Chemorheological study and in-situ monitoring of PA6 anionic-ring polymerization for RTM processing control. Compos. Part A Appl. Sci. Manuf. 2018, 107, 235–247. [Google Scholar] [CrossRef]
- Murray, J.J.; Robert, C.; Gleich, K.; McCarthy, E.D.; Brádaigh, C.M.Ó. Manufacturing of unidirectional stitched glass fabric reinforced polyamide 6 by thermoplastic resin transfer moulding. Mater. Des. 2020, 189, 108512. [Google Scholar] [CrossRef]
- Davies, G. Materials for Automobile Bodies, 2nd ed.; Butterworth-Heinemann: Oxford, UK, 2012; ISBN 9780080969794. [Google Scholar]
- Cischino, E.; Di Paolo, F.; Mangino, E.; Pullini, D.; Elizetxea, C.; Maestro, C.; Alcalde, E.; Christiansen, J.D. An Advanced Technological Lightweighted Solution for a Body in White. Transp. Res. Procedia 2016, 14, 1021–1030. [Google Scholar] [CrossRef] [Green Version]
- Kobayashi, S.; Plotkin, S.; Ribeiro, S.K. Energy efficiency technologies for road vehicles. Energy Effic. 2009, 2, 125–137. [Google Scholar] [CrossRef]
- Mallick, P.K. Materials, Design and Manufacturing for Lightweight Vehicles; Woodhead Publishing: Sawston, UK, 2010; ISBN 9781845694630. [Google Scholar]
- Henriksson, F. Introducing New Materials in the Automotive Industry; Linköping University: Linköping, Sweden, 2017. [Google Scholar]
- Ji, J. Lightweight Design of Vehicle Side Door; Politecnico di Torino: Turin, Italy, 2018. [Google Scholar]
- Höhne, C.; Wendel, R.; Käbisch, B.; Anders, T.; Henning, F.; Kroke, E. Hexaphenoxycyclotriphosphazene as FR for CFR anionic PA6 via T-RTM: A study of mechanical and thermal properties. Fire Mater. 2016, 41, 291–306. [Google Scholar] [CrossRef]
- Miranda Campos, B.; Bourbigot, S.; Fontaine, G.; Bonnet, F. Thermoplastic matrix-based composites produced by resin transfer molding: A review. Polym. Compos. 2022, 43, 2485–2506. [Google Scholar] [CrossRef]
- van Rijswijk, K.; Bersee, H.E.N. Reactive processing of textile fiber-reinforced thermoplastic composites—An overview. Compos. Part A Appl. Sci. Manuf. 2006, 38, 666–681. [Google Scholar] [CrossRef]
- Ageyeva, T.; Sibikin, I.; Kovács, J.G. A Review of Thermoplastic Resin Transfer Molding: Process Modeling and Simulation. Polymers 2019, 11, 1555. [Google Scholar] [CrossRef] [Green Version]
- Kovács, Z.; Pomázi, Á.; Toldy, A. The flame retardancy of polyamide 6—Prepared by in situ polymerisation of ε-caprolactam—For T-RTM applications. Polym. Degrad. Stab. 2022, 195, 109797. [Google Scholar] [CrossRef]
- Wilhelm, M.; Wendel, R.; Aust, M.; Rosenberg, P.; Henning, F. Compensation of Water Influence on Anionic Polymerization of ε-Caprolactam: 1. Chemistry and Experiments. J. Compos. Sci. 2020, 4, 7. [Google Scholar] [CrossRef] [Green Version]
- Herzog, J.; Wendel, R.; Weidler, P.G.; Wilhelm, M.; Rosenberg, P.; Henning, F. Moisture adsorption and desorption behavior of raw materials for the t-rtm process. J. Compos. Sci. 2021, 5, 12. [Google Scholar] [CrossRef]
- Wendel, R.; Thoma, B.; Henning, F. Influence of Water During Manufacturing of APA6 in the Thermoplastic RTM Process. In Proceedings of the 33rd International Conference of the Polymer Processing Society, Cancún, Mexico, 10–14 December 2017. [Google Scholar]
- van Rijswijk, K.; Bersee, H.E.N.; Beukers, A.; Picken, S.J.; Geenen, A.A. Van Optimisation of anionic polyamide-6 for vacuum infusion of thermoplastic composites: Influence of polymerisation temperature on matrix properties. Polym. Test. 2006, 25, 392–404. [Google Scholar] [CrossRef]
- Teuwen, J.J.E.; Van Geenen, A.A.; Bersee, H.E.N. Temperature evolution during processing of thick-walled anionic polyamide 6 composites: Experiment and simulation. Macromol. Mater. Eng. 2013, 298, 722–729. [Google Scholar] [CrossRef]
- Nagy, J.; Reith, L.; Fischlschweiger, M.; Steinbichler, G. Modeling the influence of flow phenomena on the polymerization of ϵ-Caprolactam. Chem. Eng. Sci. 2014, 111, 85–93. [Google Scholar] [CrossRef]
- Dong, X.; Chen, K.; Xue, P.; Zhang, R.; Jia, M. Effect of infusion strategy on vacuum bagging process and properties of polyamide 6 composites. J. Polym. Res. 2023, 30, 137. [Google Scholar] [CrossRef]
- Teuwen, J.J.E.; van Rijswijk, K.; Bersee, H.E.N.; Beukers, A. Effect of fibre textile reinforcement on anionic polyamide-6 composite properties. In Proceedings of the ICCM 16th International Conference on Composite Materials, Tokyo, Japan, 8–13 July 2007. [Google Scholar]
- Teuwen, J.J.E.; Bersee, H.E.N. Process optimisation for vacuum infused anionic polyamide-6 composites. In Proceedings of the 9th International Conference on Flow Processes in Composite, Montréal, QC, Canada, 8–10 July 2008. [Google Scholar]
- Kim, D.B.; Witherell, P.; Lu, Y.; Feng, S. Toward a Digital Thread and Data Package for Metals-Additive Manufacturing. Smart Sustain. Manuf. Syst. 2017, 1, 75–99. [Google Scholar] [CrossRef] [Green Version]
- Ross, S. Introduction to Probability and Statistics for Engineers and Scientists, 4th ed.; Elsevier Academic Press: London, UK, 2009; ISBN 978-0-12-3704-83-2. [Google Scholar]
- Semperger, O.V.; Suplicz, A. The Effect of the Parameters of T-RTM on the Properties of Polyamide 6 Prepared by in Situ Polymerization. Materials 2020, 13, 4. [Google Scholar] [CrossRef] [PubMed] [Green Version]
- Murray, J.J.; Gleich, K.; McCarthy, E.D.; Brádaigh, C.Ó. Properties of polyamide-6 composites using a low-cost thermoplastic resin transfer moulding system. In Proceedings of the Twenty-Second International Conference on Composite Materials (ICCM22), Melbourne, Australia, 11–16 August 2019. [Google Scholar]
- Granta Design Limited. CES Edupack; Granta Design Limited: Cambridge, UK, 2019. [Google Scholar]
- Callister, W.D. Materials Science and Engineering—An Introduction, 7th ed.; John Wiley & Sons, Inc.: Hoboken, NJ, USA, 2007; ISBN 9780471736967. [Google Scholar]
- Zaldua, N.; Maiz, J.; de la Calle, A.; García-Arrieta, S.; Elizetxea, C.; Harismendy, I.; Tercjak, A.; Müller, A.J. Nucleation and crystallization of PA6 composites prepared by T-RTM: Effects of carbon and glass fiber loading. Polymers 2019, 11, 1680. [Google Scholar] [CrossRef] [Green Version]
- van Rijswijk, K.; Lindstedt, S.; Bersee, H.E.N.; Gleich, K.F.; Titzschkau, K.; McDade, E.J. Reactively processed polyamide-6 structural composites for automotive applications. In Proceedings of the 6th Annual Automotive Conference and Exhibition, Troy, MI, USA, 12–14 September 2006; Volume 2, pp. 435–442. [Google Scholar]
- van Rijswijk, K.; Bersee, H.E.N.; Jager, W.F.; Picken, S.J. Optimisation of anionic polyamide-6 for vacuum infusion of thermoplastic composites: Choice of activator and initiator. Compos. Part A 2006, 37, 949–956. [Google Scholar] [CrossRef]
- Teuwen, J.J.E.; Ang, H.S.A.; Bersee, H.E.N. Post-processing of anionic polyamide-6 composites. In Proceedings of the SAMPE 2010, Seattle, WA, USA, 17–20 May 2010. [Google Scholar]
- Kohan, M.I. Nylon Plastic Handbook; Hanser Gardner Publications: Munich, Germany, 1995; ISBN 1-56990-189-9. [Google Scholar]
- Basumatary, K.K.; Mohanta, N.; Acharya, S.K. Effect of fiber loading on abrasive wear behaviour of Ipomoea carnea reinforced epoxy composite. Int. J. Plast. Technol. 2014, 18, 64–74. [Google Scholar] [CrossRef]
- Qiao, J.; Zhang, Q.; Wu, C.; Wu, G.; Li, L. Effects of Fiber Volume Fraction and Length on the Mechanical Properties of Milled Glass Fiber/Polyurea Composites. Polymers 2022, 14, 3080. [Google Scholar] [CrossRef] [PubMed]


| Nomenclature | Reinforcement Phase | First Packing Pressure (bar) | Second Packing Pressure (bar) |
|---|---|---|---|
| APA6 | - | 3.0 | - |
| APA6/GF | GF | 3.0 | - |
| APA6_3.5 | - | 3.0 | 3.5 |
| APA6/GF_3.5 | GF | 3.0 | 3.5 |
| APA6_6.0 | - | 3.0 | 6.0 |
| APA6/GF_6.0 | GF | 3.0 | 6.0 |
| Parts | VVC (%) |
|---|---|
| APA6/GF | 1.0 ± 0.6 |
| APA6/GF_3.5 | 1.0 ± 0.5 |
| APA6/GF_6.0 | 1.8 ± 0.3 |
Disclaimer/Publisher’s Note: The statements, opinions and data contained in all publications are solely those of the individual author(s) and contributor(s) and not of MDPI and/or the editor(s). MDPI and/or the editor(s) disclaim responsibility for any injury to people or property resulting from any ideas, methods, instructions or products referred to in the content. |
© 2023 by the authors. Licensee MDPI, Basel, Switzerland. This article is an open access article distributed under the terms and conditions of the Creative Commons Attribution (CC BY) license (https://creativecommons.org/licenses/by/4.0/).
Share and Cite
Martins, F.P.; Santos, L.; Torcato, R.; Lima, P.S.; Oliveira, J.M. Reproducibility Study of the Thermoplastic Resin Transfer Molding Process for Glass Fiber Reinforced Polyamide 6 Composites. Materials 2023, 16, 4652. https://doi.org/10.3390/ma16134652
Martins FP, Santos L, Torcato R, Lima PS, Oliveira JM. Reproducibility Study of the Thermoplastic Resin Transfer Molding Process for Glass Fiber Reinforced Polyamide 6 Composites. Materials. 2023; 16(13):4652. https://doi.org/10.3390/ma16134652
Chicago/Turabian StyleMartins, Filipe P., Laura Santos, Ricardo Torcato, Paulo S. Lima, and José M. Oliveira. 2023. "Reproducibility Study of the Thermoplastic Resin Transfer Molding Process for Glass Fiber Reinforced Polyamide 6 Composites" Materials 16, no. 13: 4652. https://doi.org/10.3390/ma16134652