
New Plastic Crack-Tip Opening Displacement Tool Based on Digital Image Correlation for Estimating the Fatigue-Crack-Growth Law on 316L Stainless Steel

Abstract
:1. Introduction
2. Materials and Methods
2.1. Description of the Fatigue Tests
2.2. Digital Image Correlation Technique
3. Post-Processing Strategy
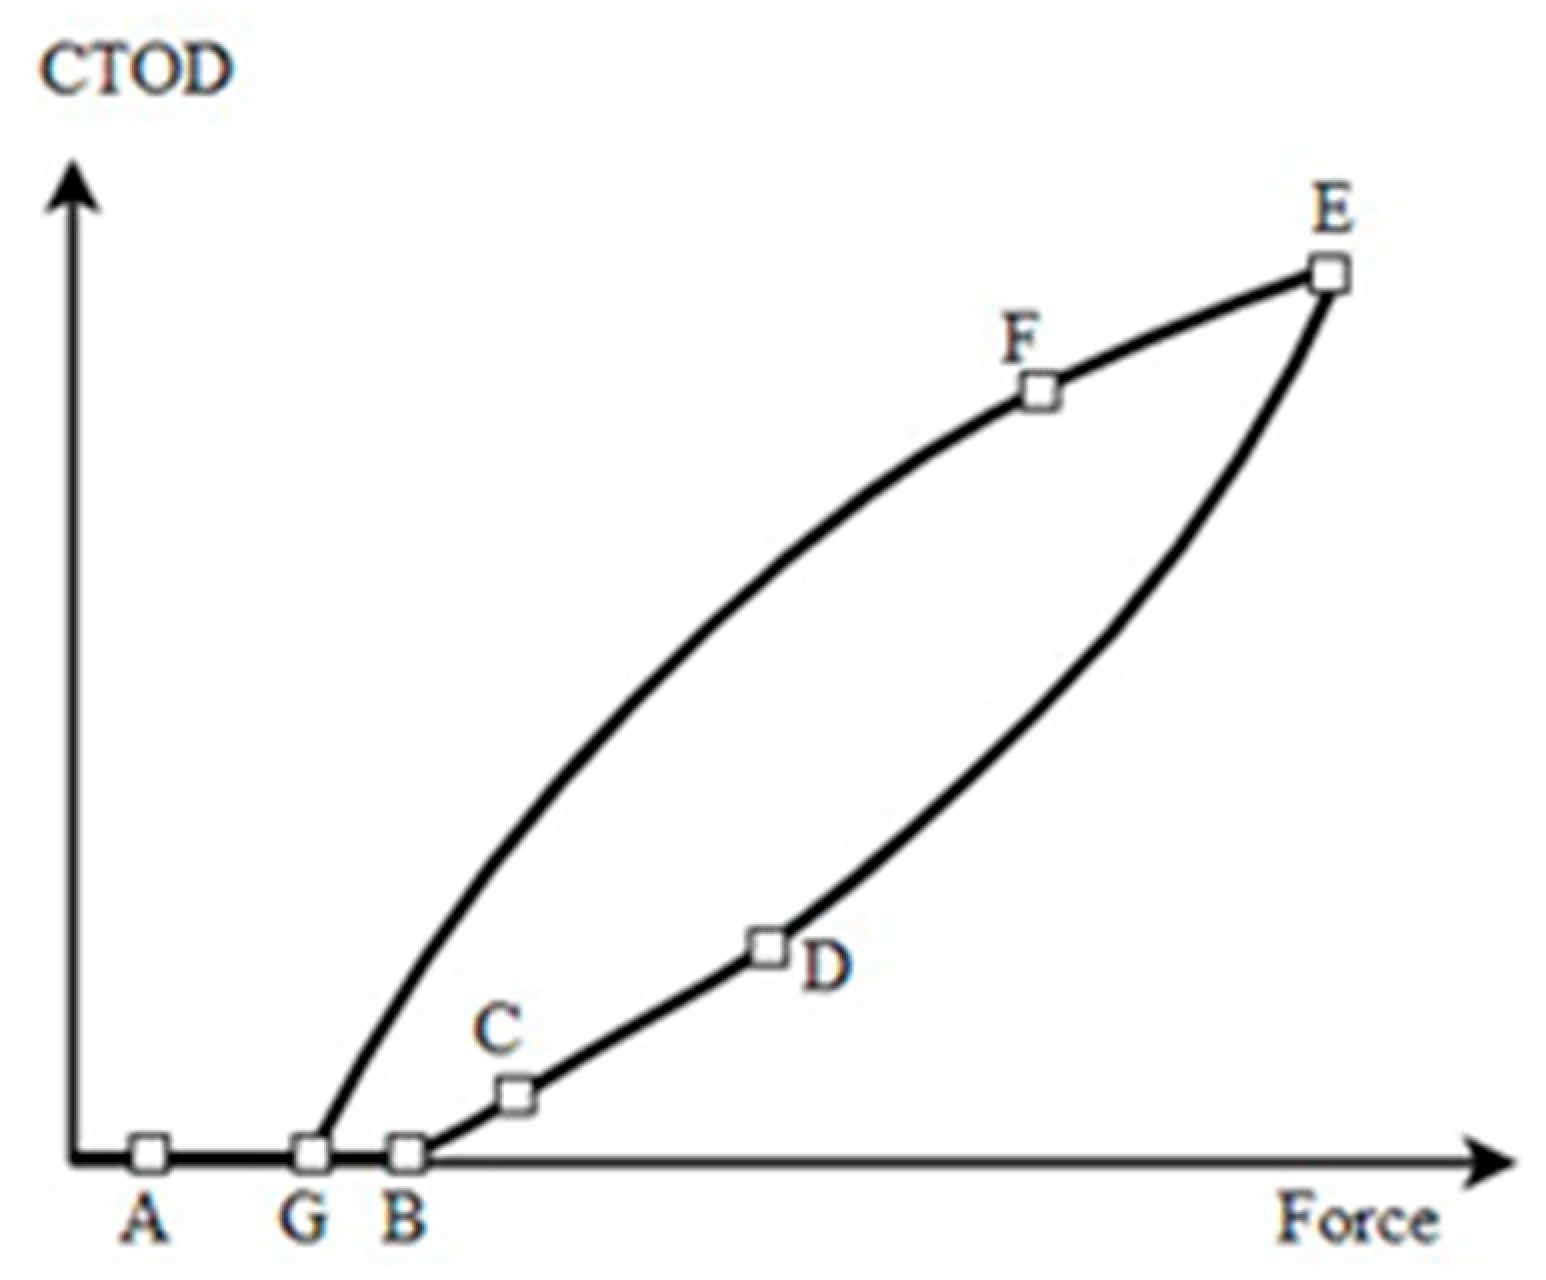
3.1. Identification of the Displacement of the Crack-Tip Opening
3.2. Algorithm to Obtain Measurement Parameters
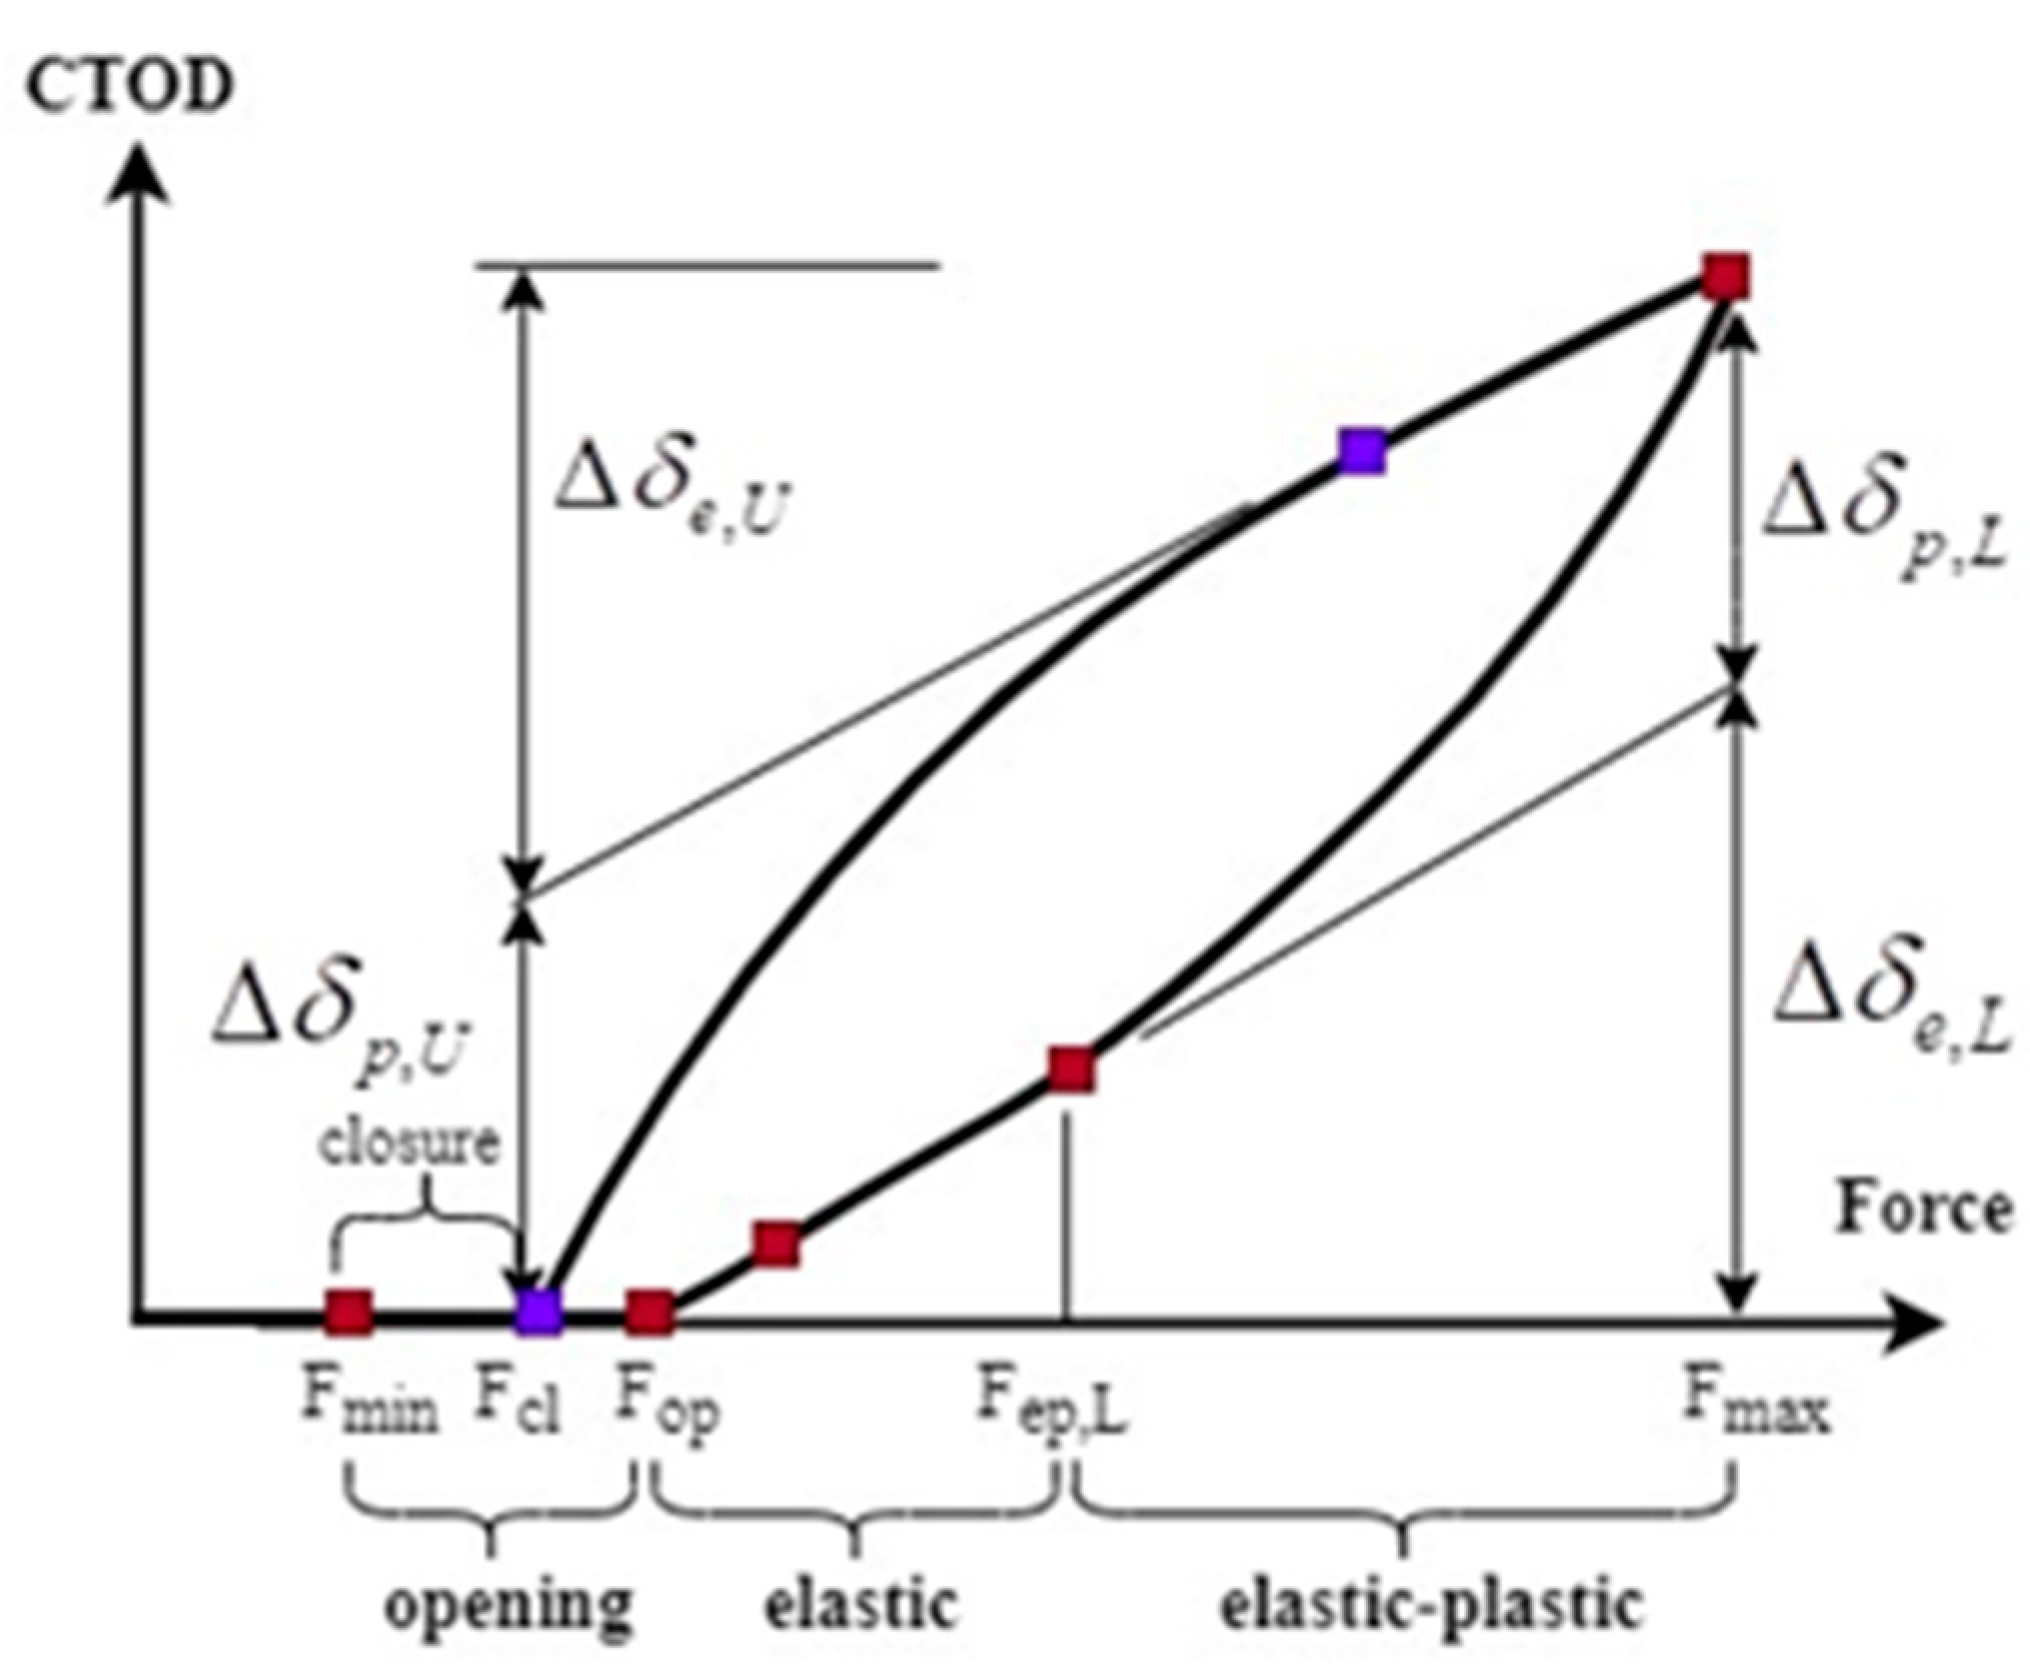
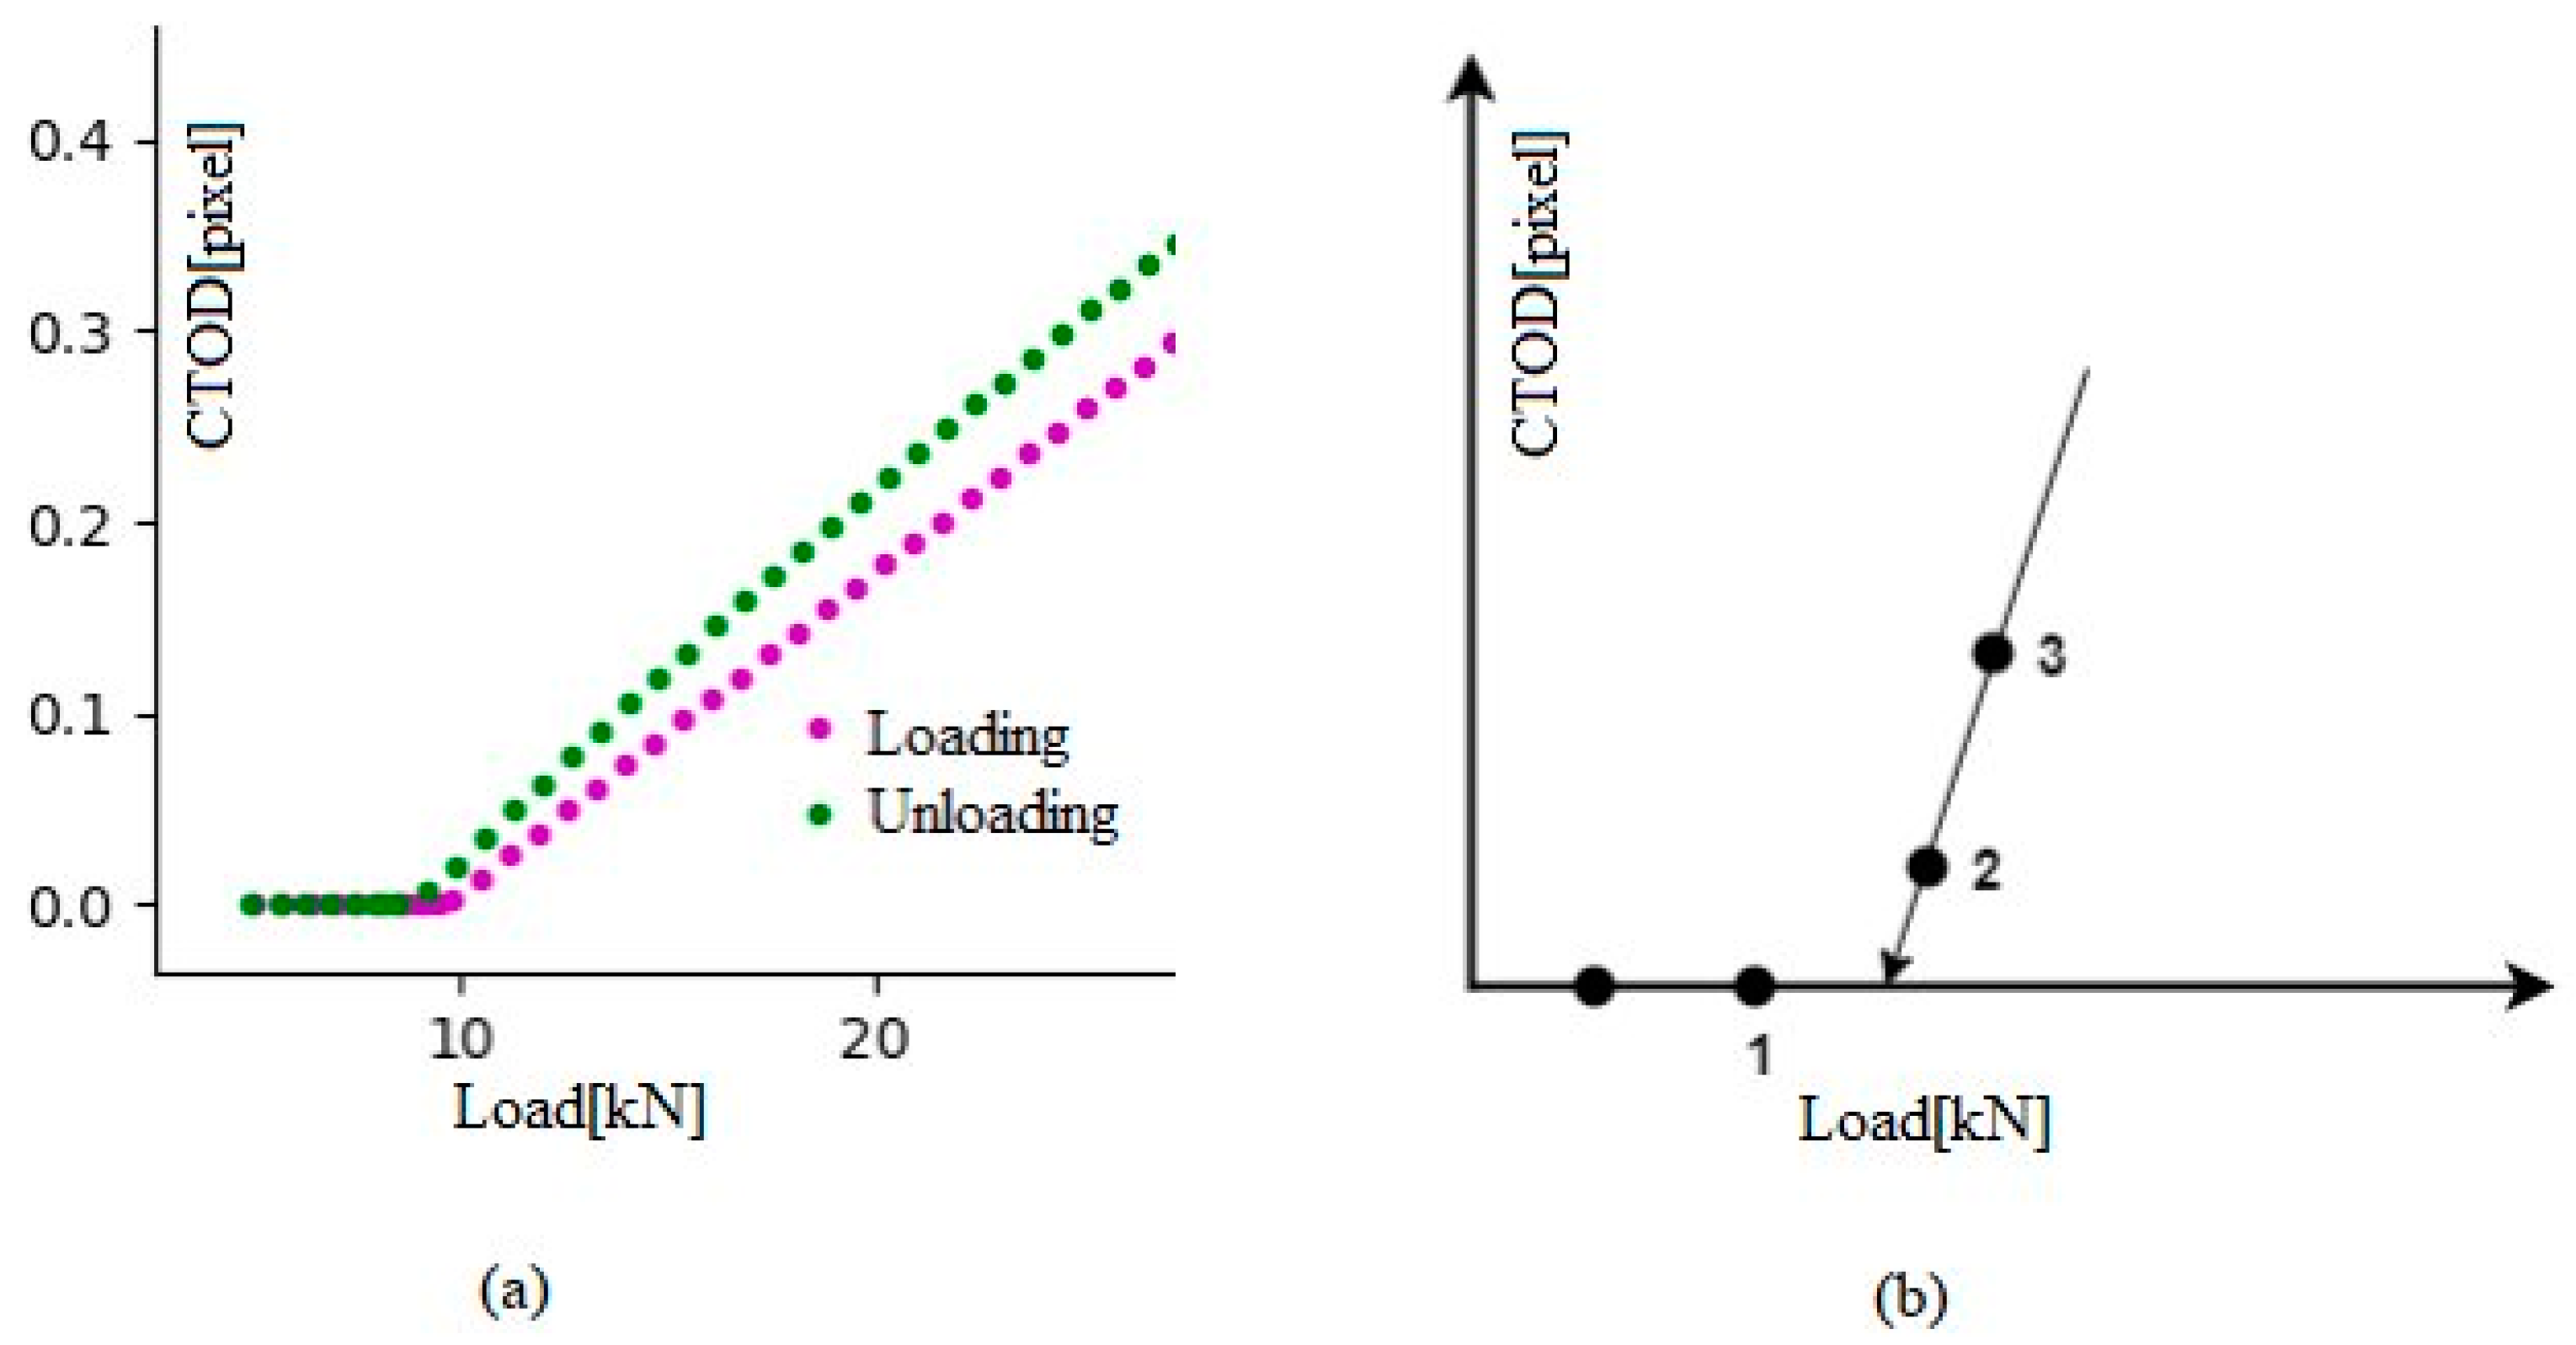
3.2.1. Determination of Crack Opening and Crack Closure
3.2.2. The Elastic Regime System Slope (SeU) While Unloading
3.2.3. The Ranges of Plastic and Elastic Crack-Tip Opening Displacement during Unloading
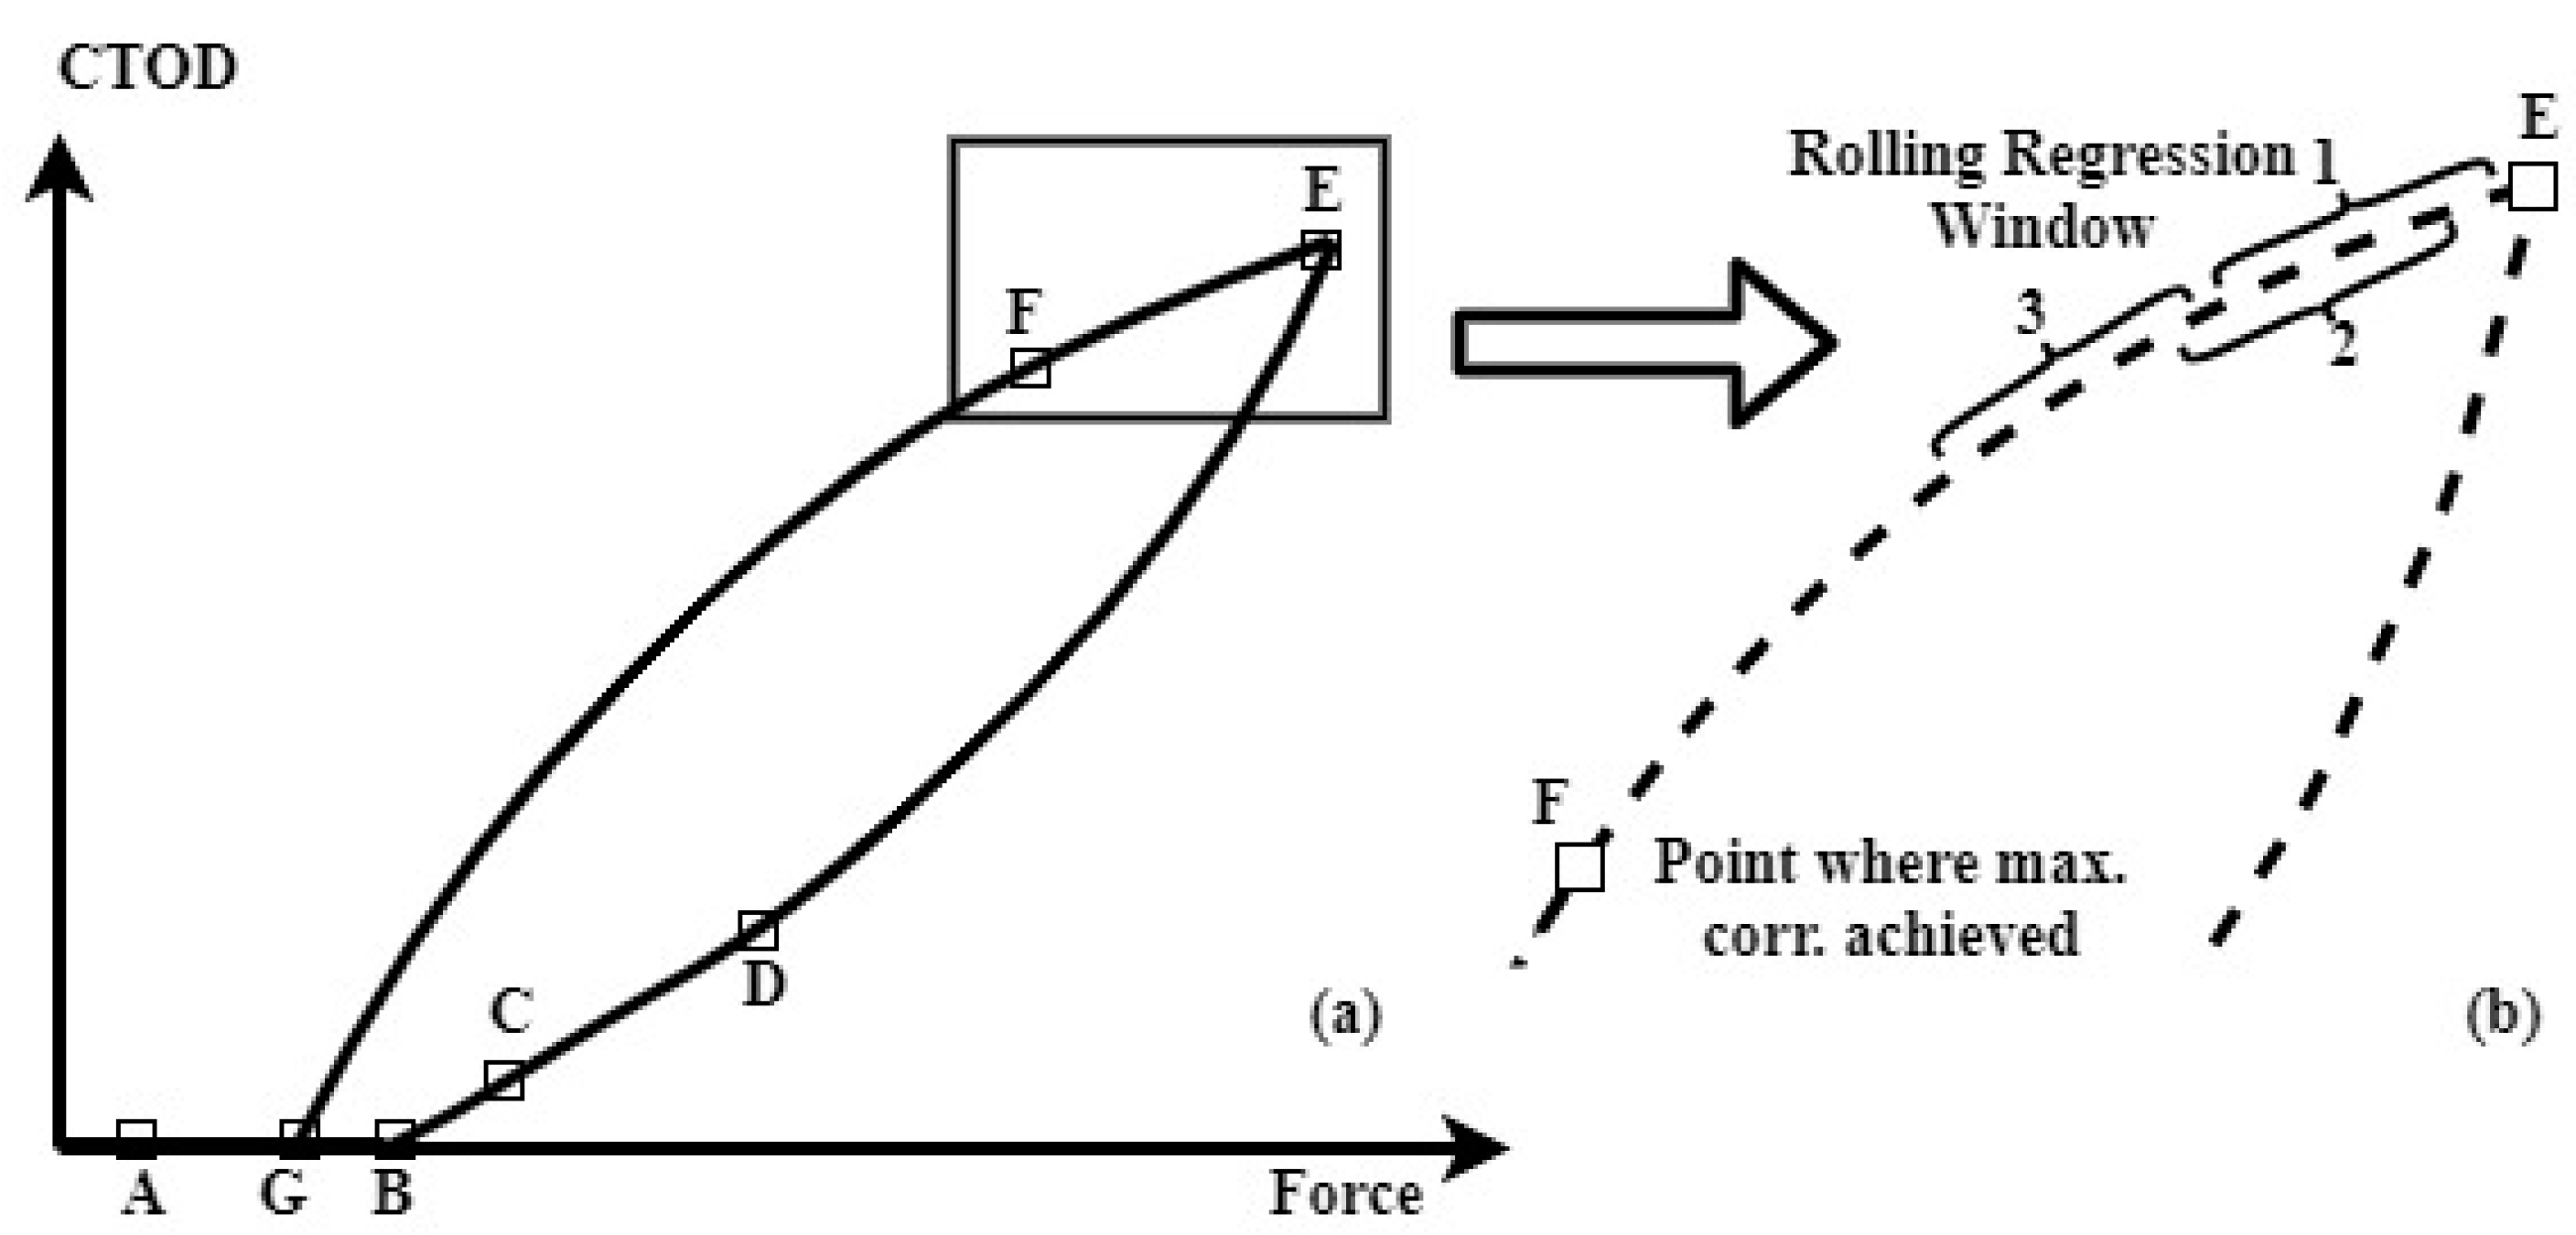
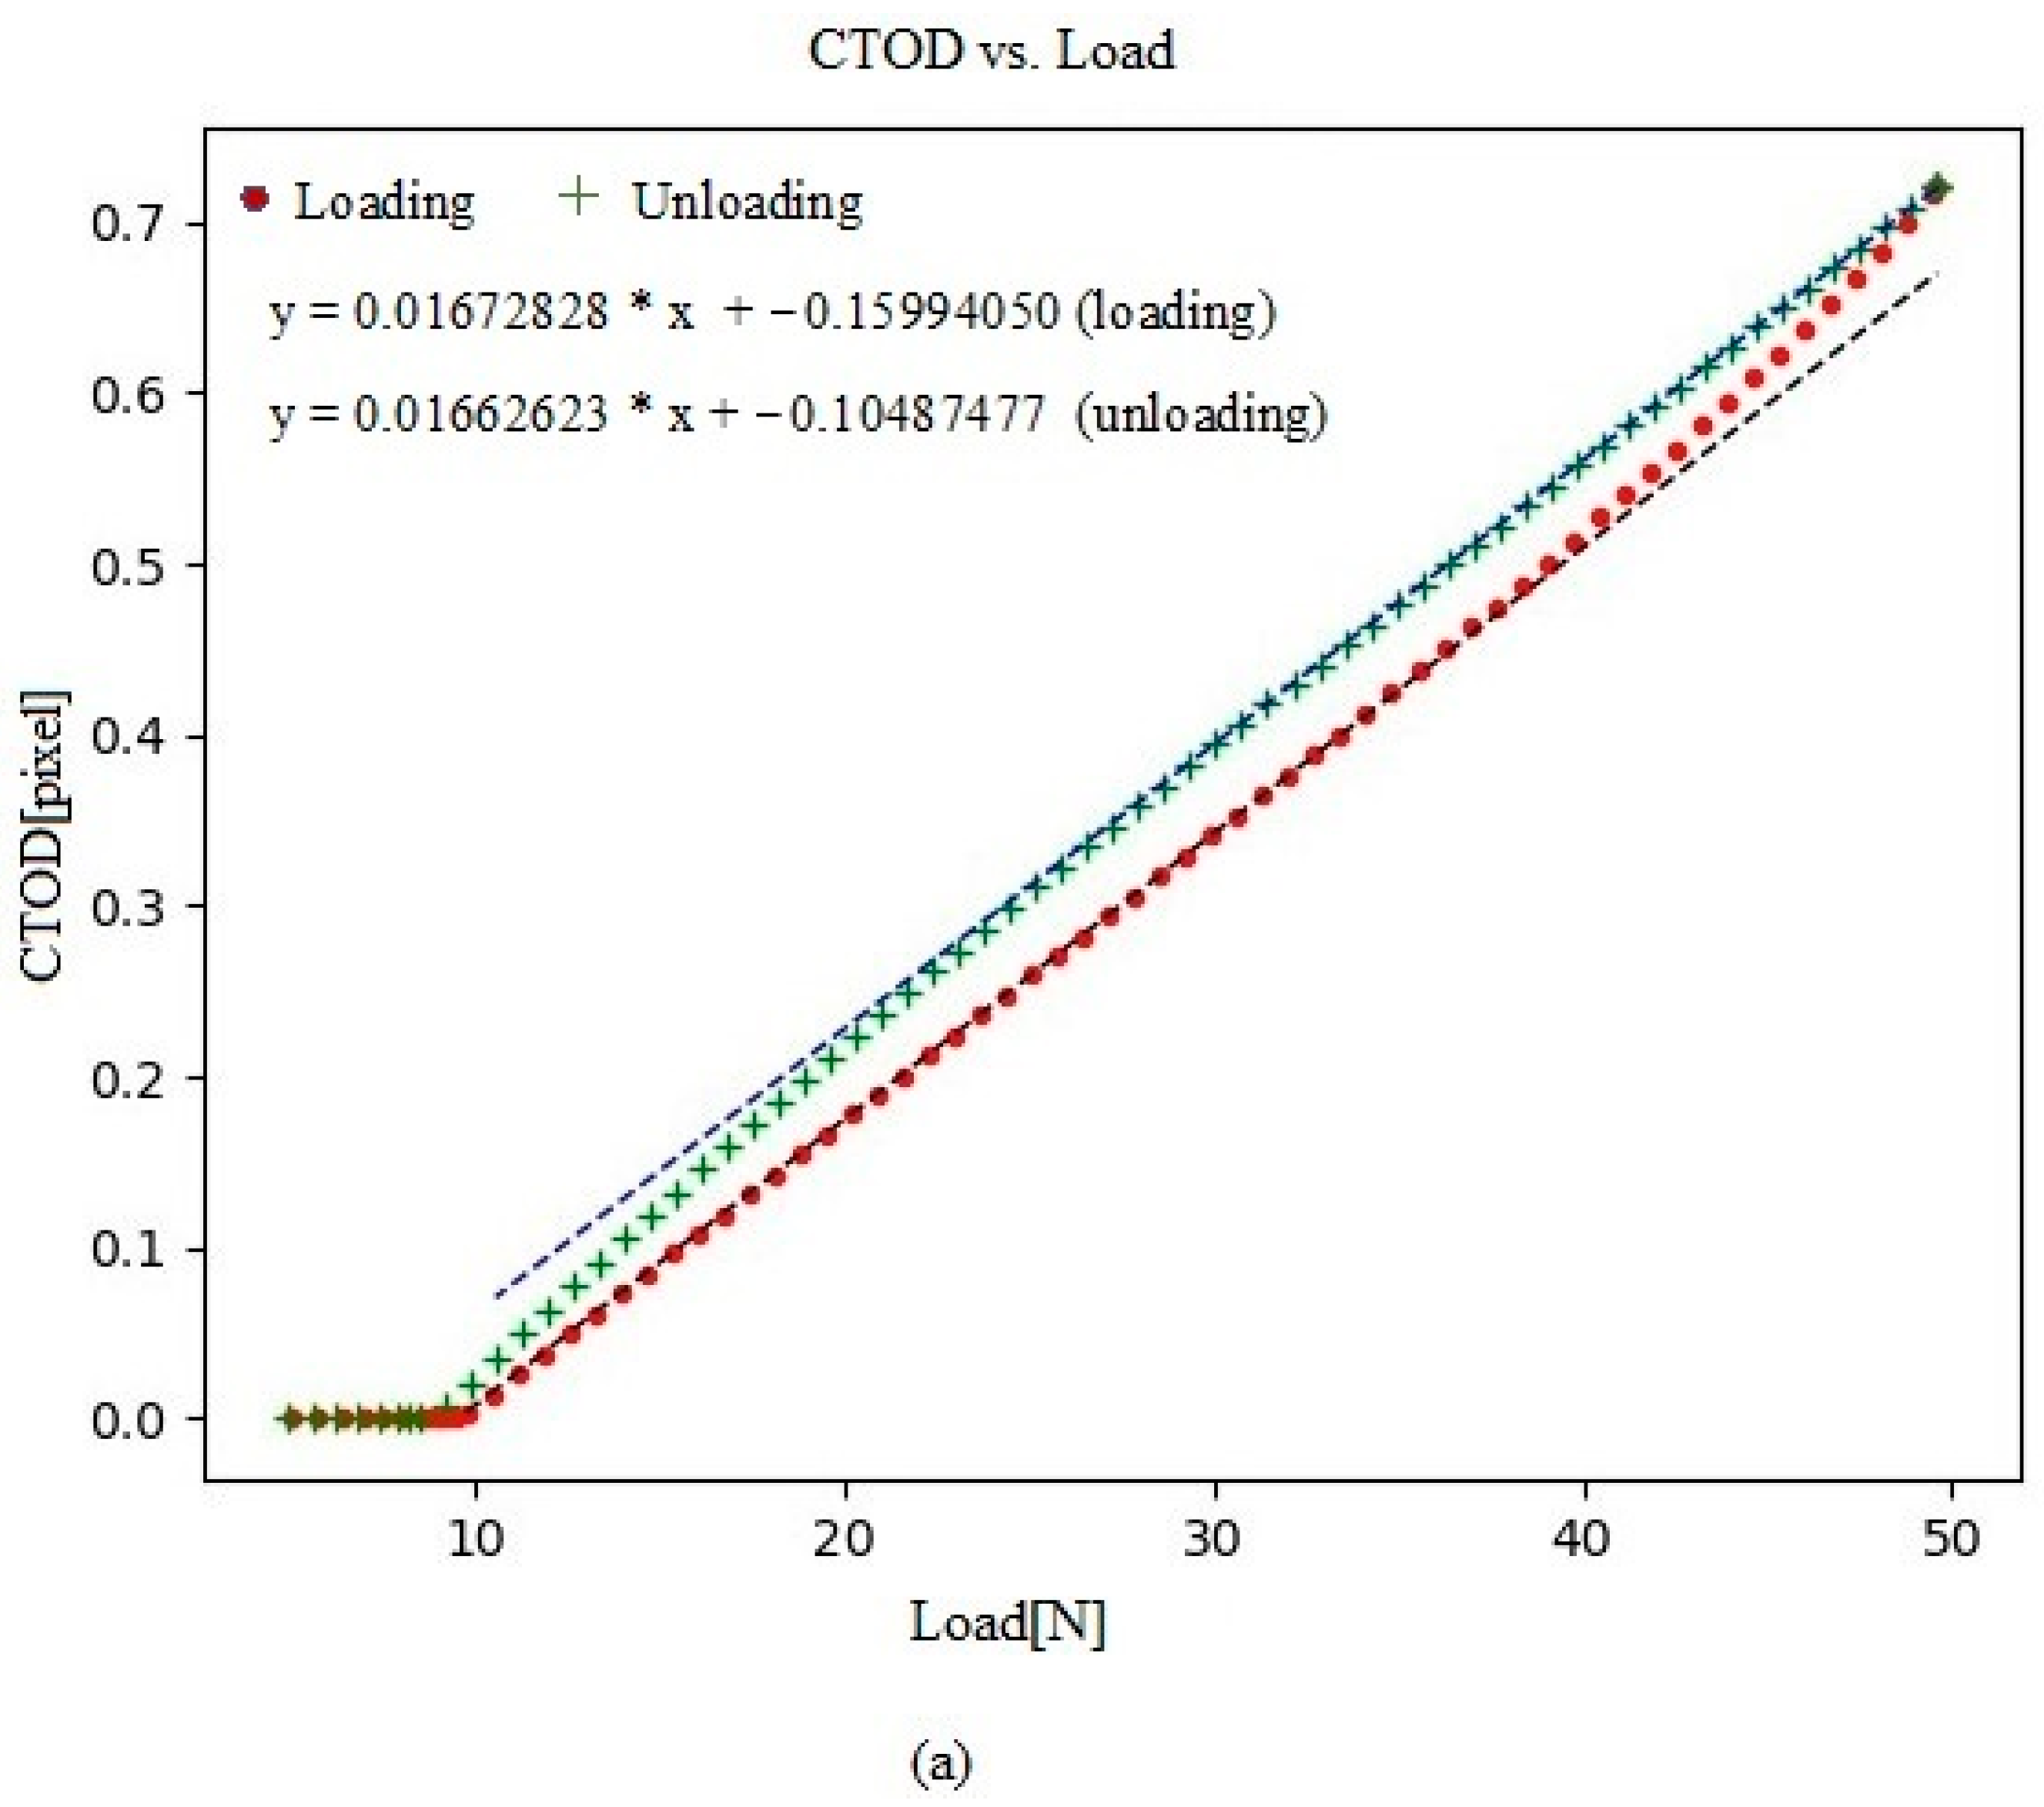
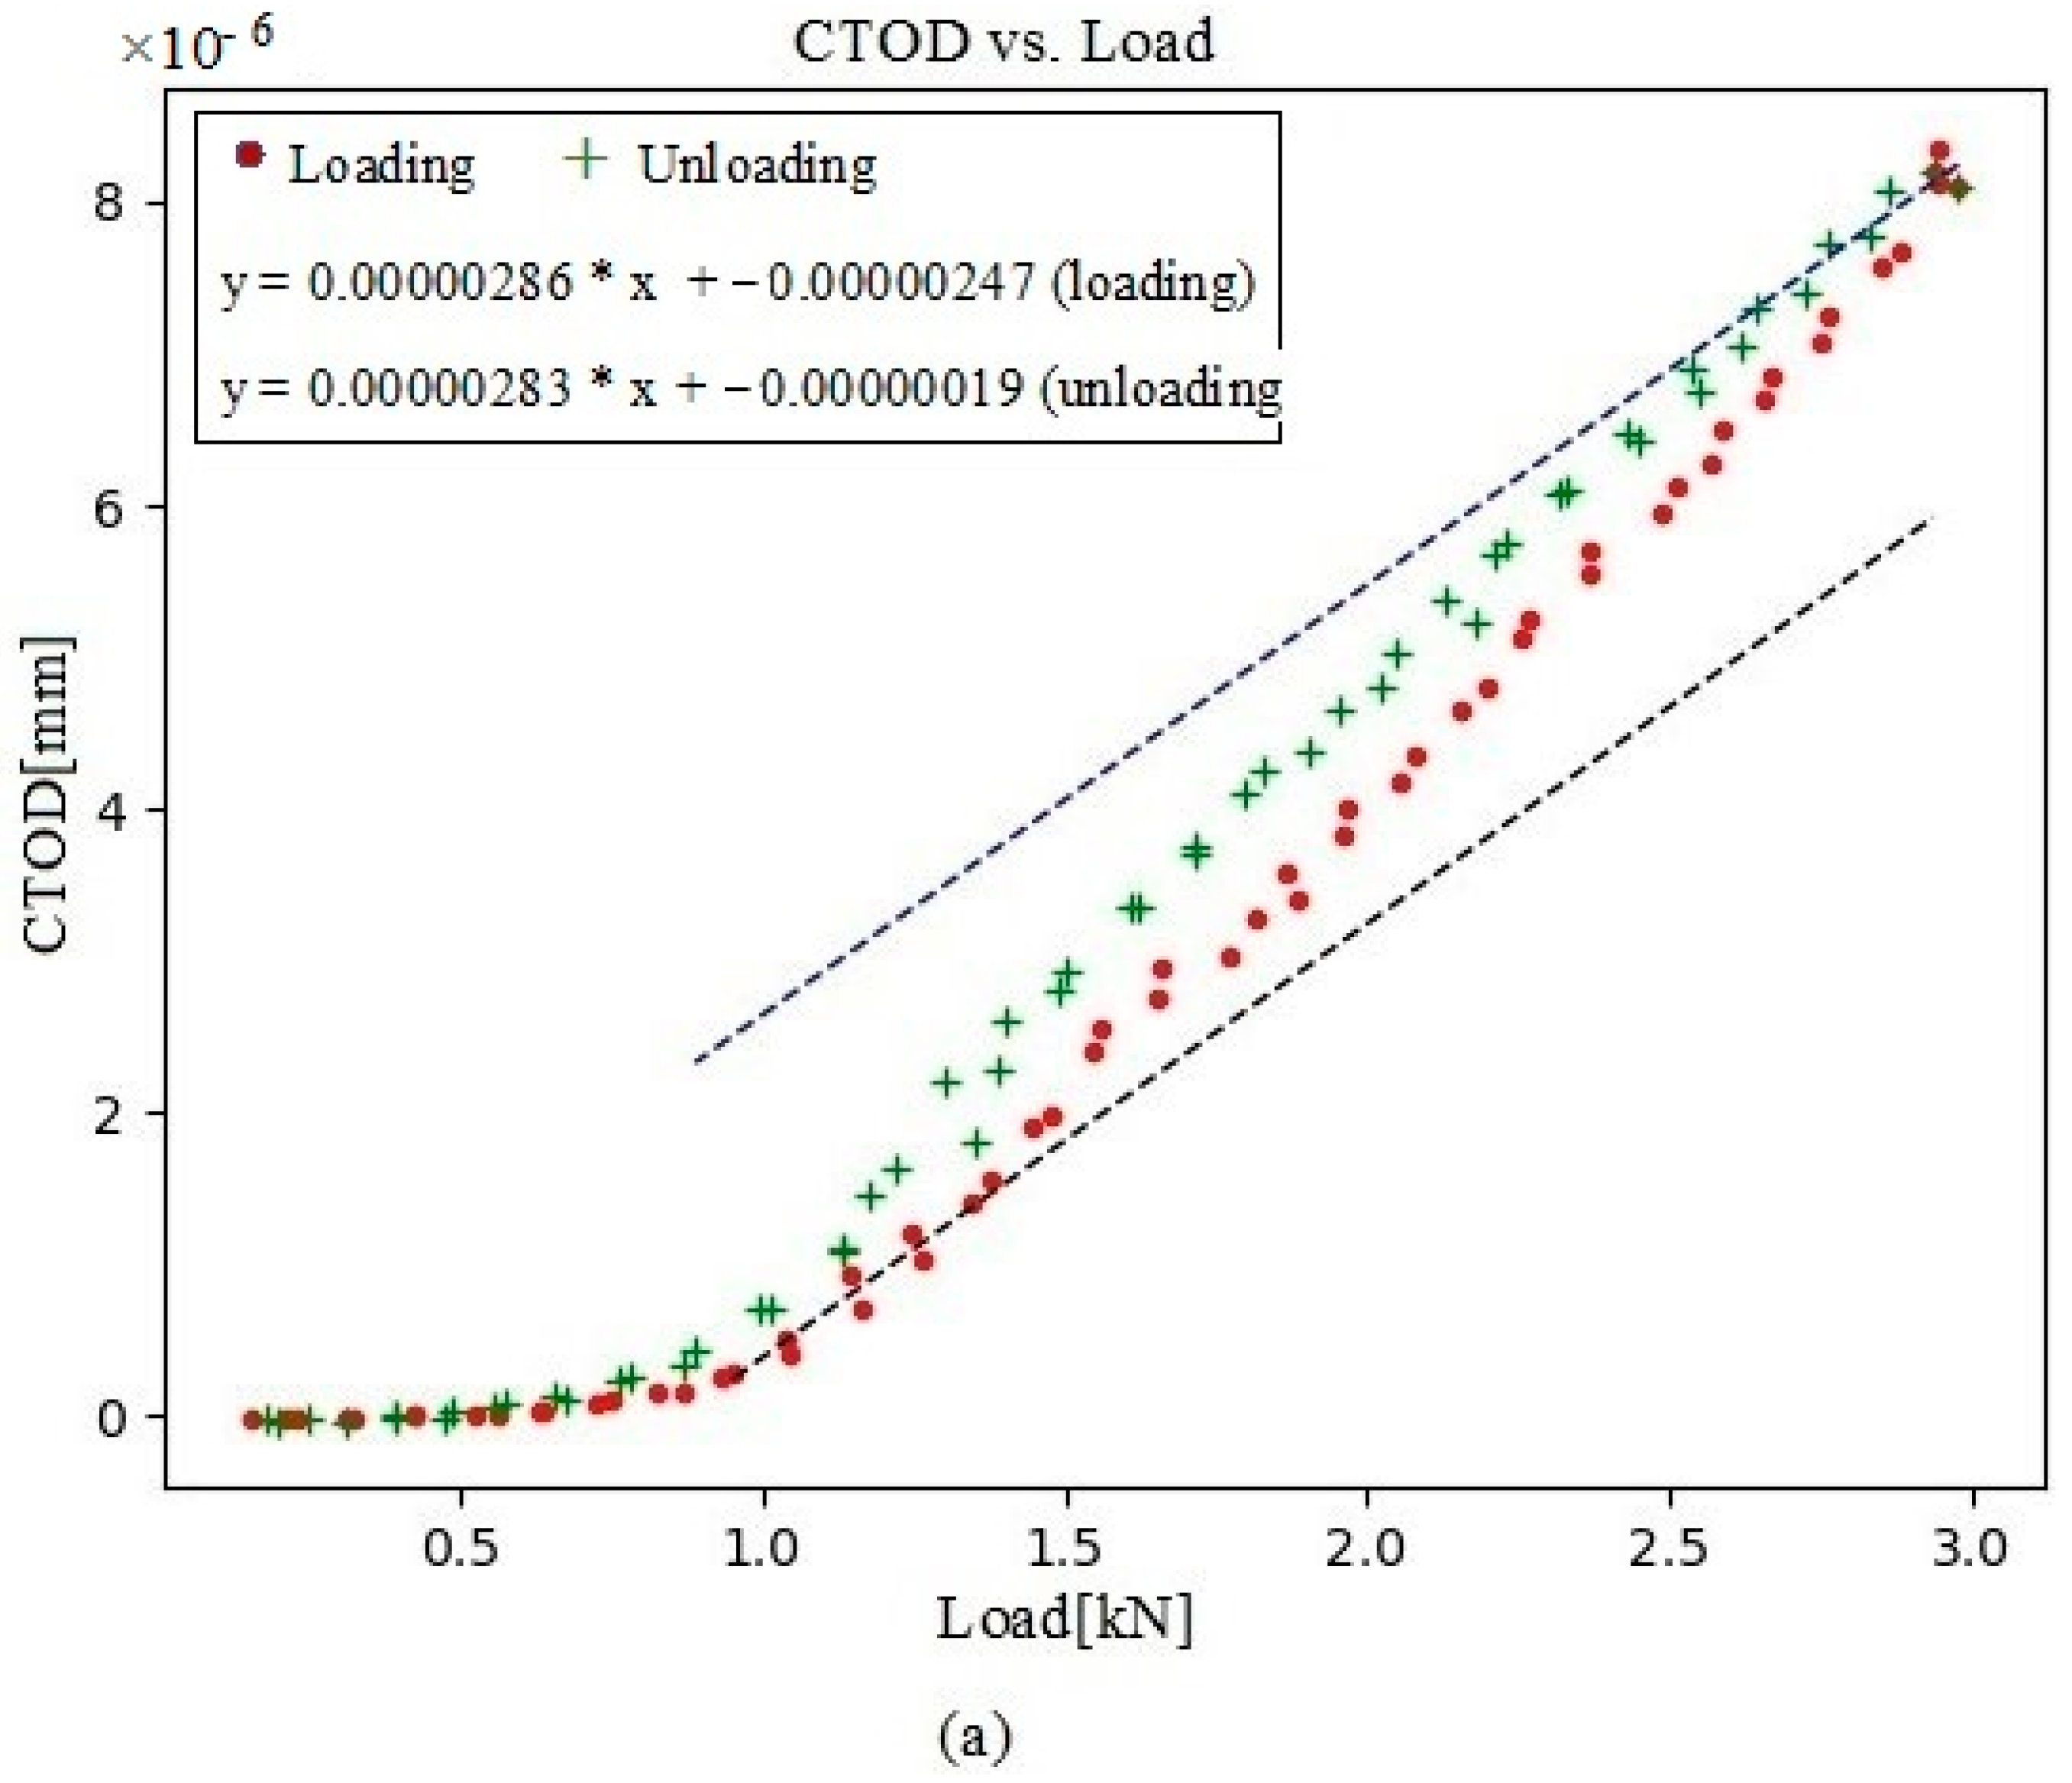
3.2.4. Analysis of the Slope during Loading Portion of the Cycle (Se,L)
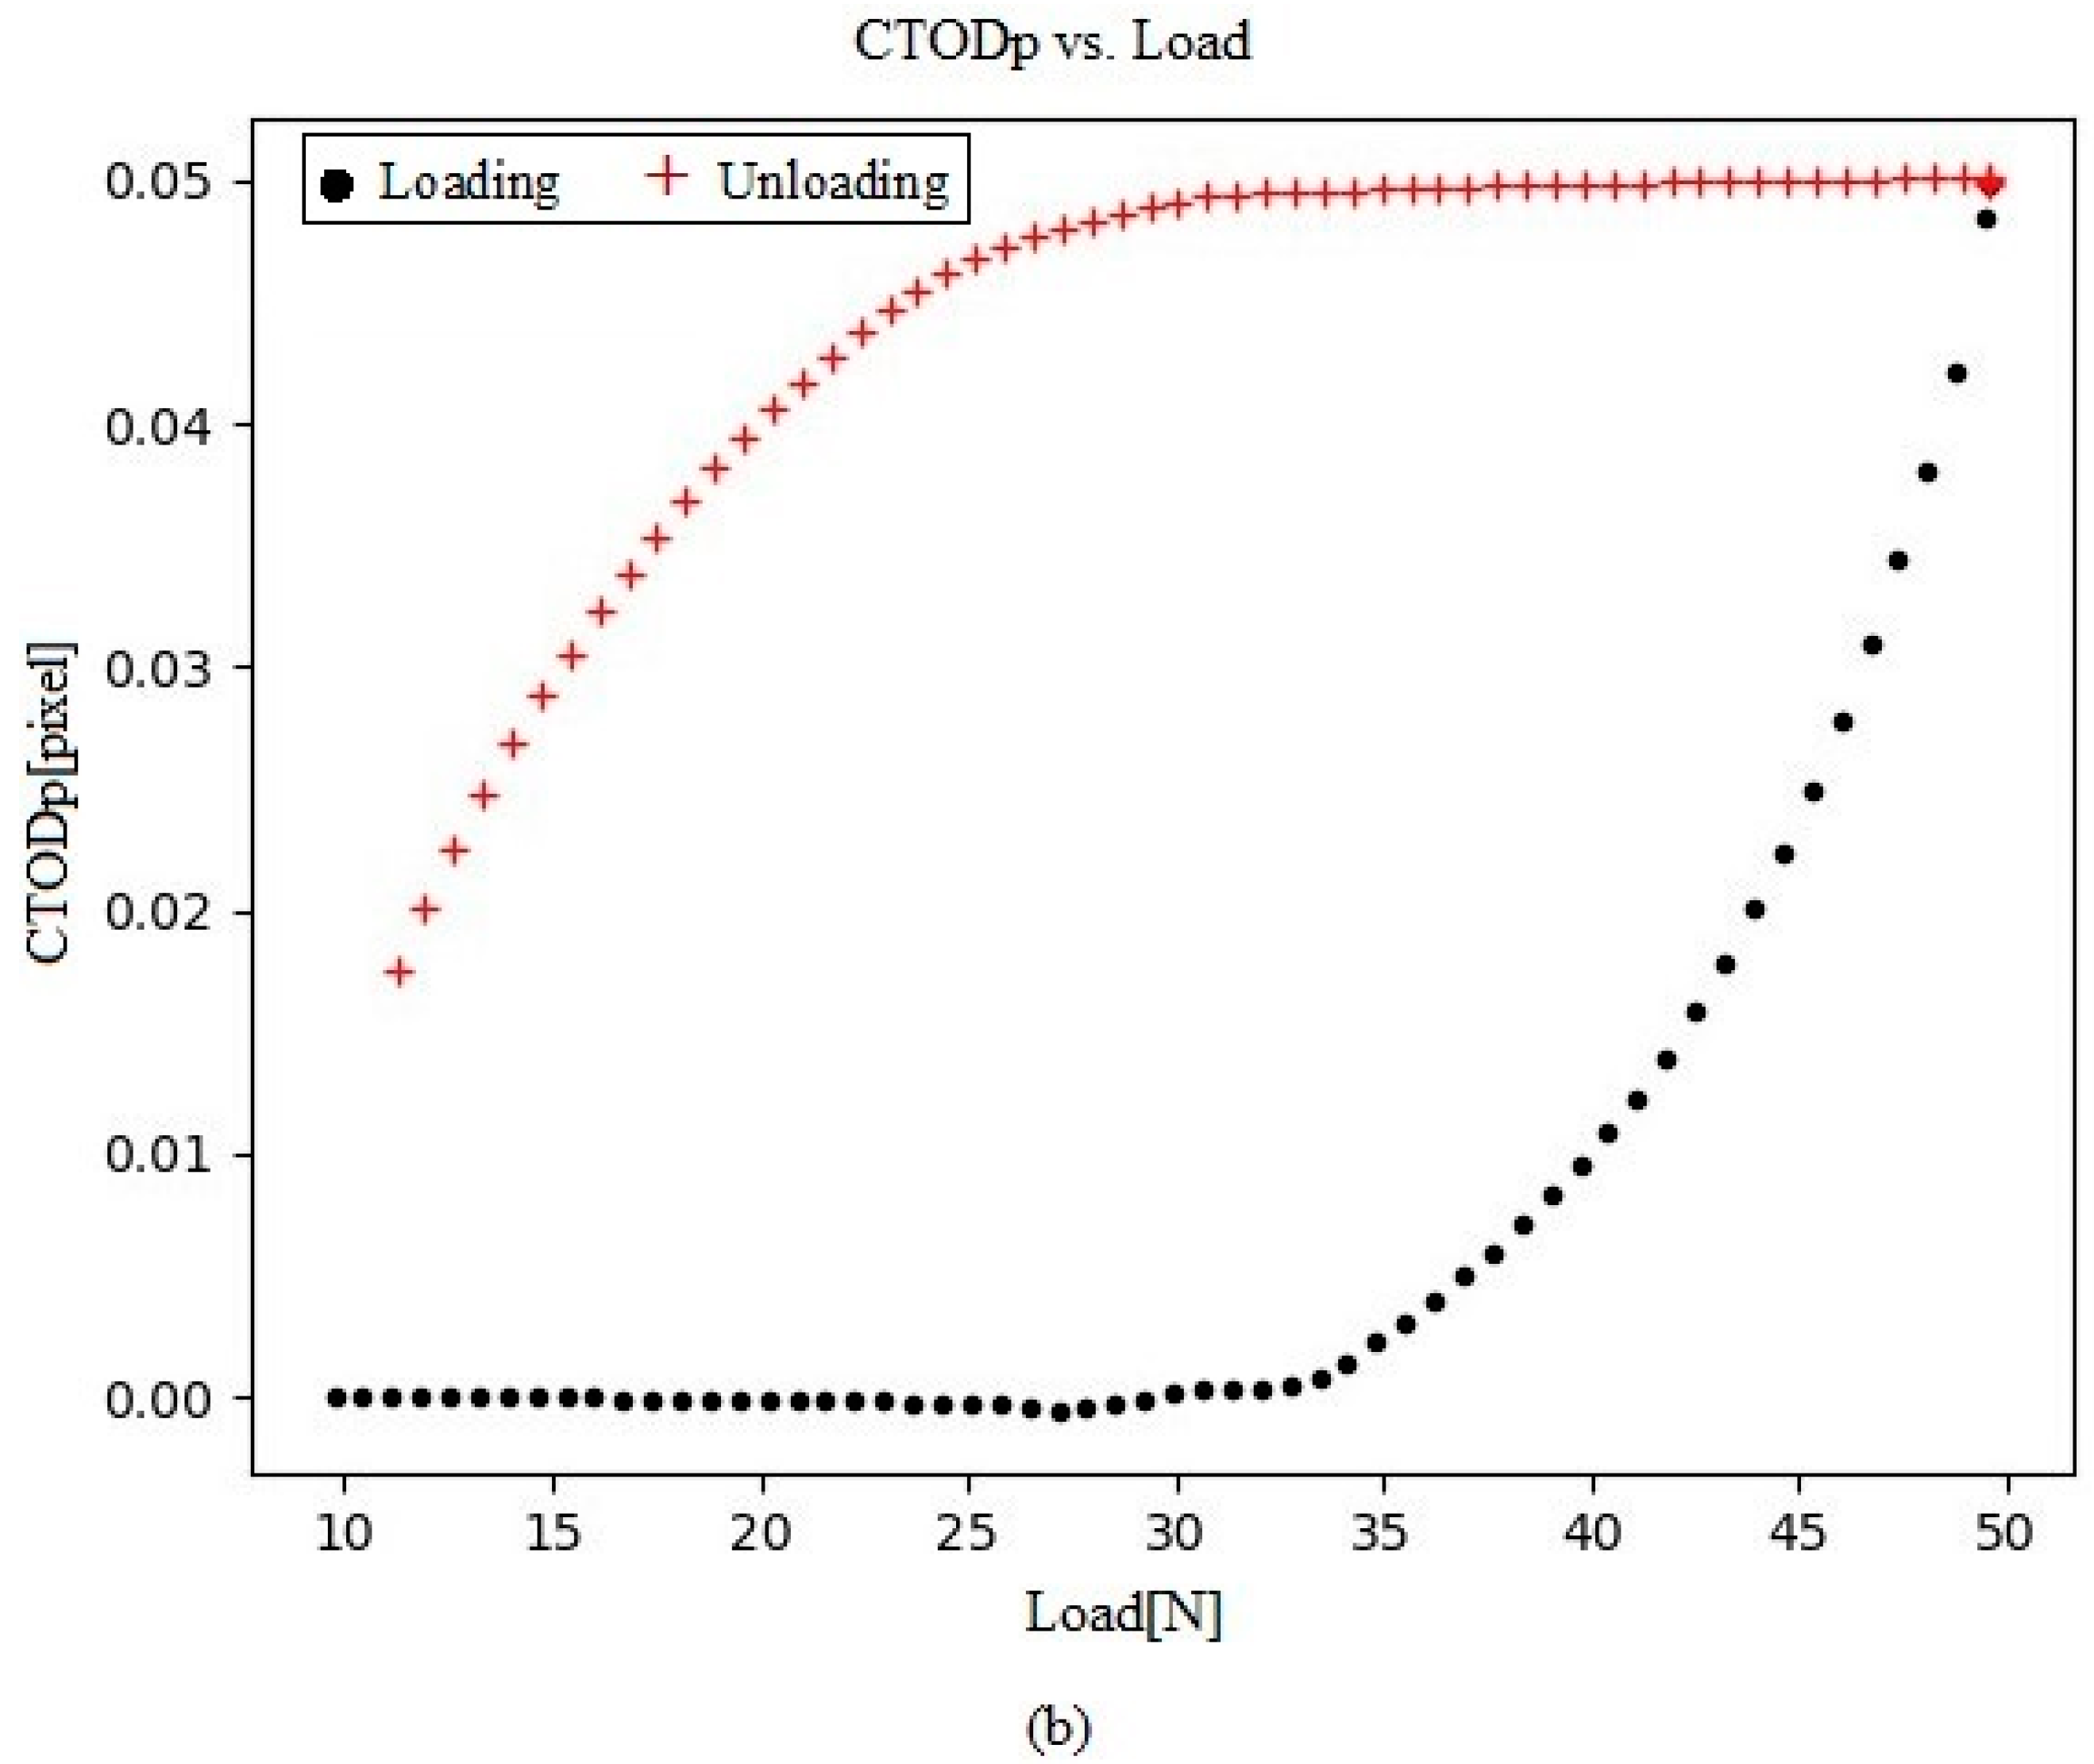
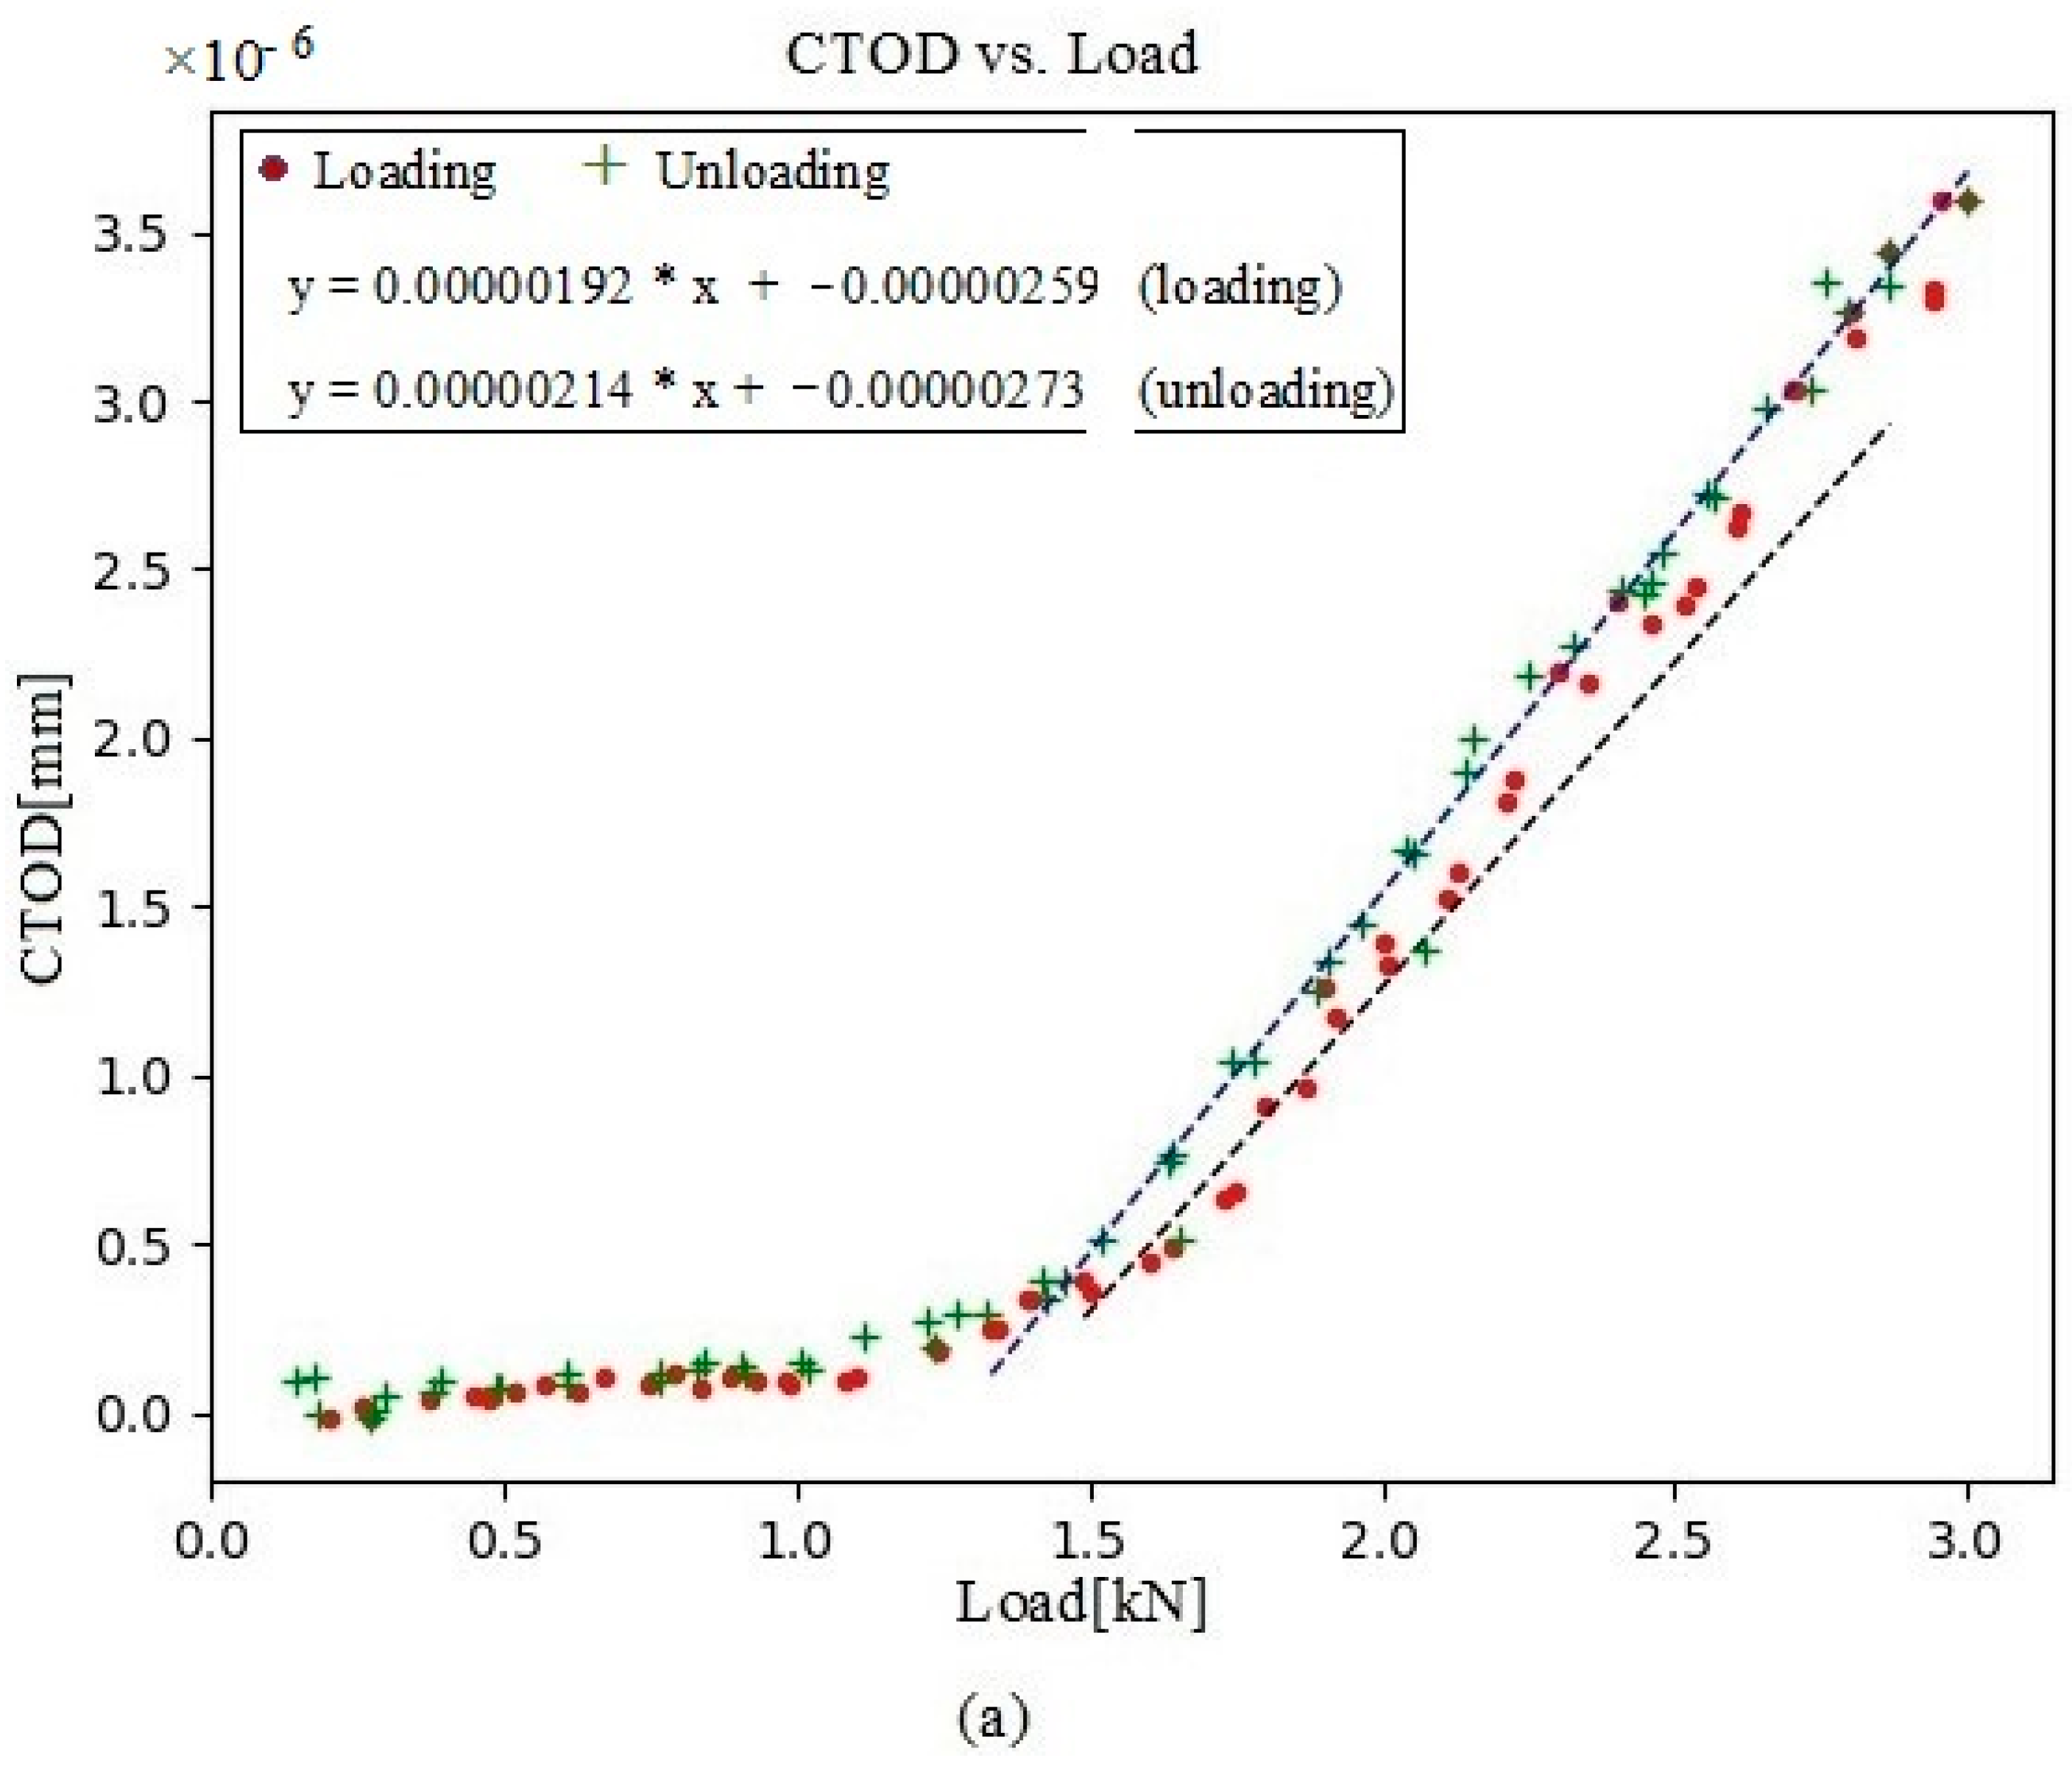
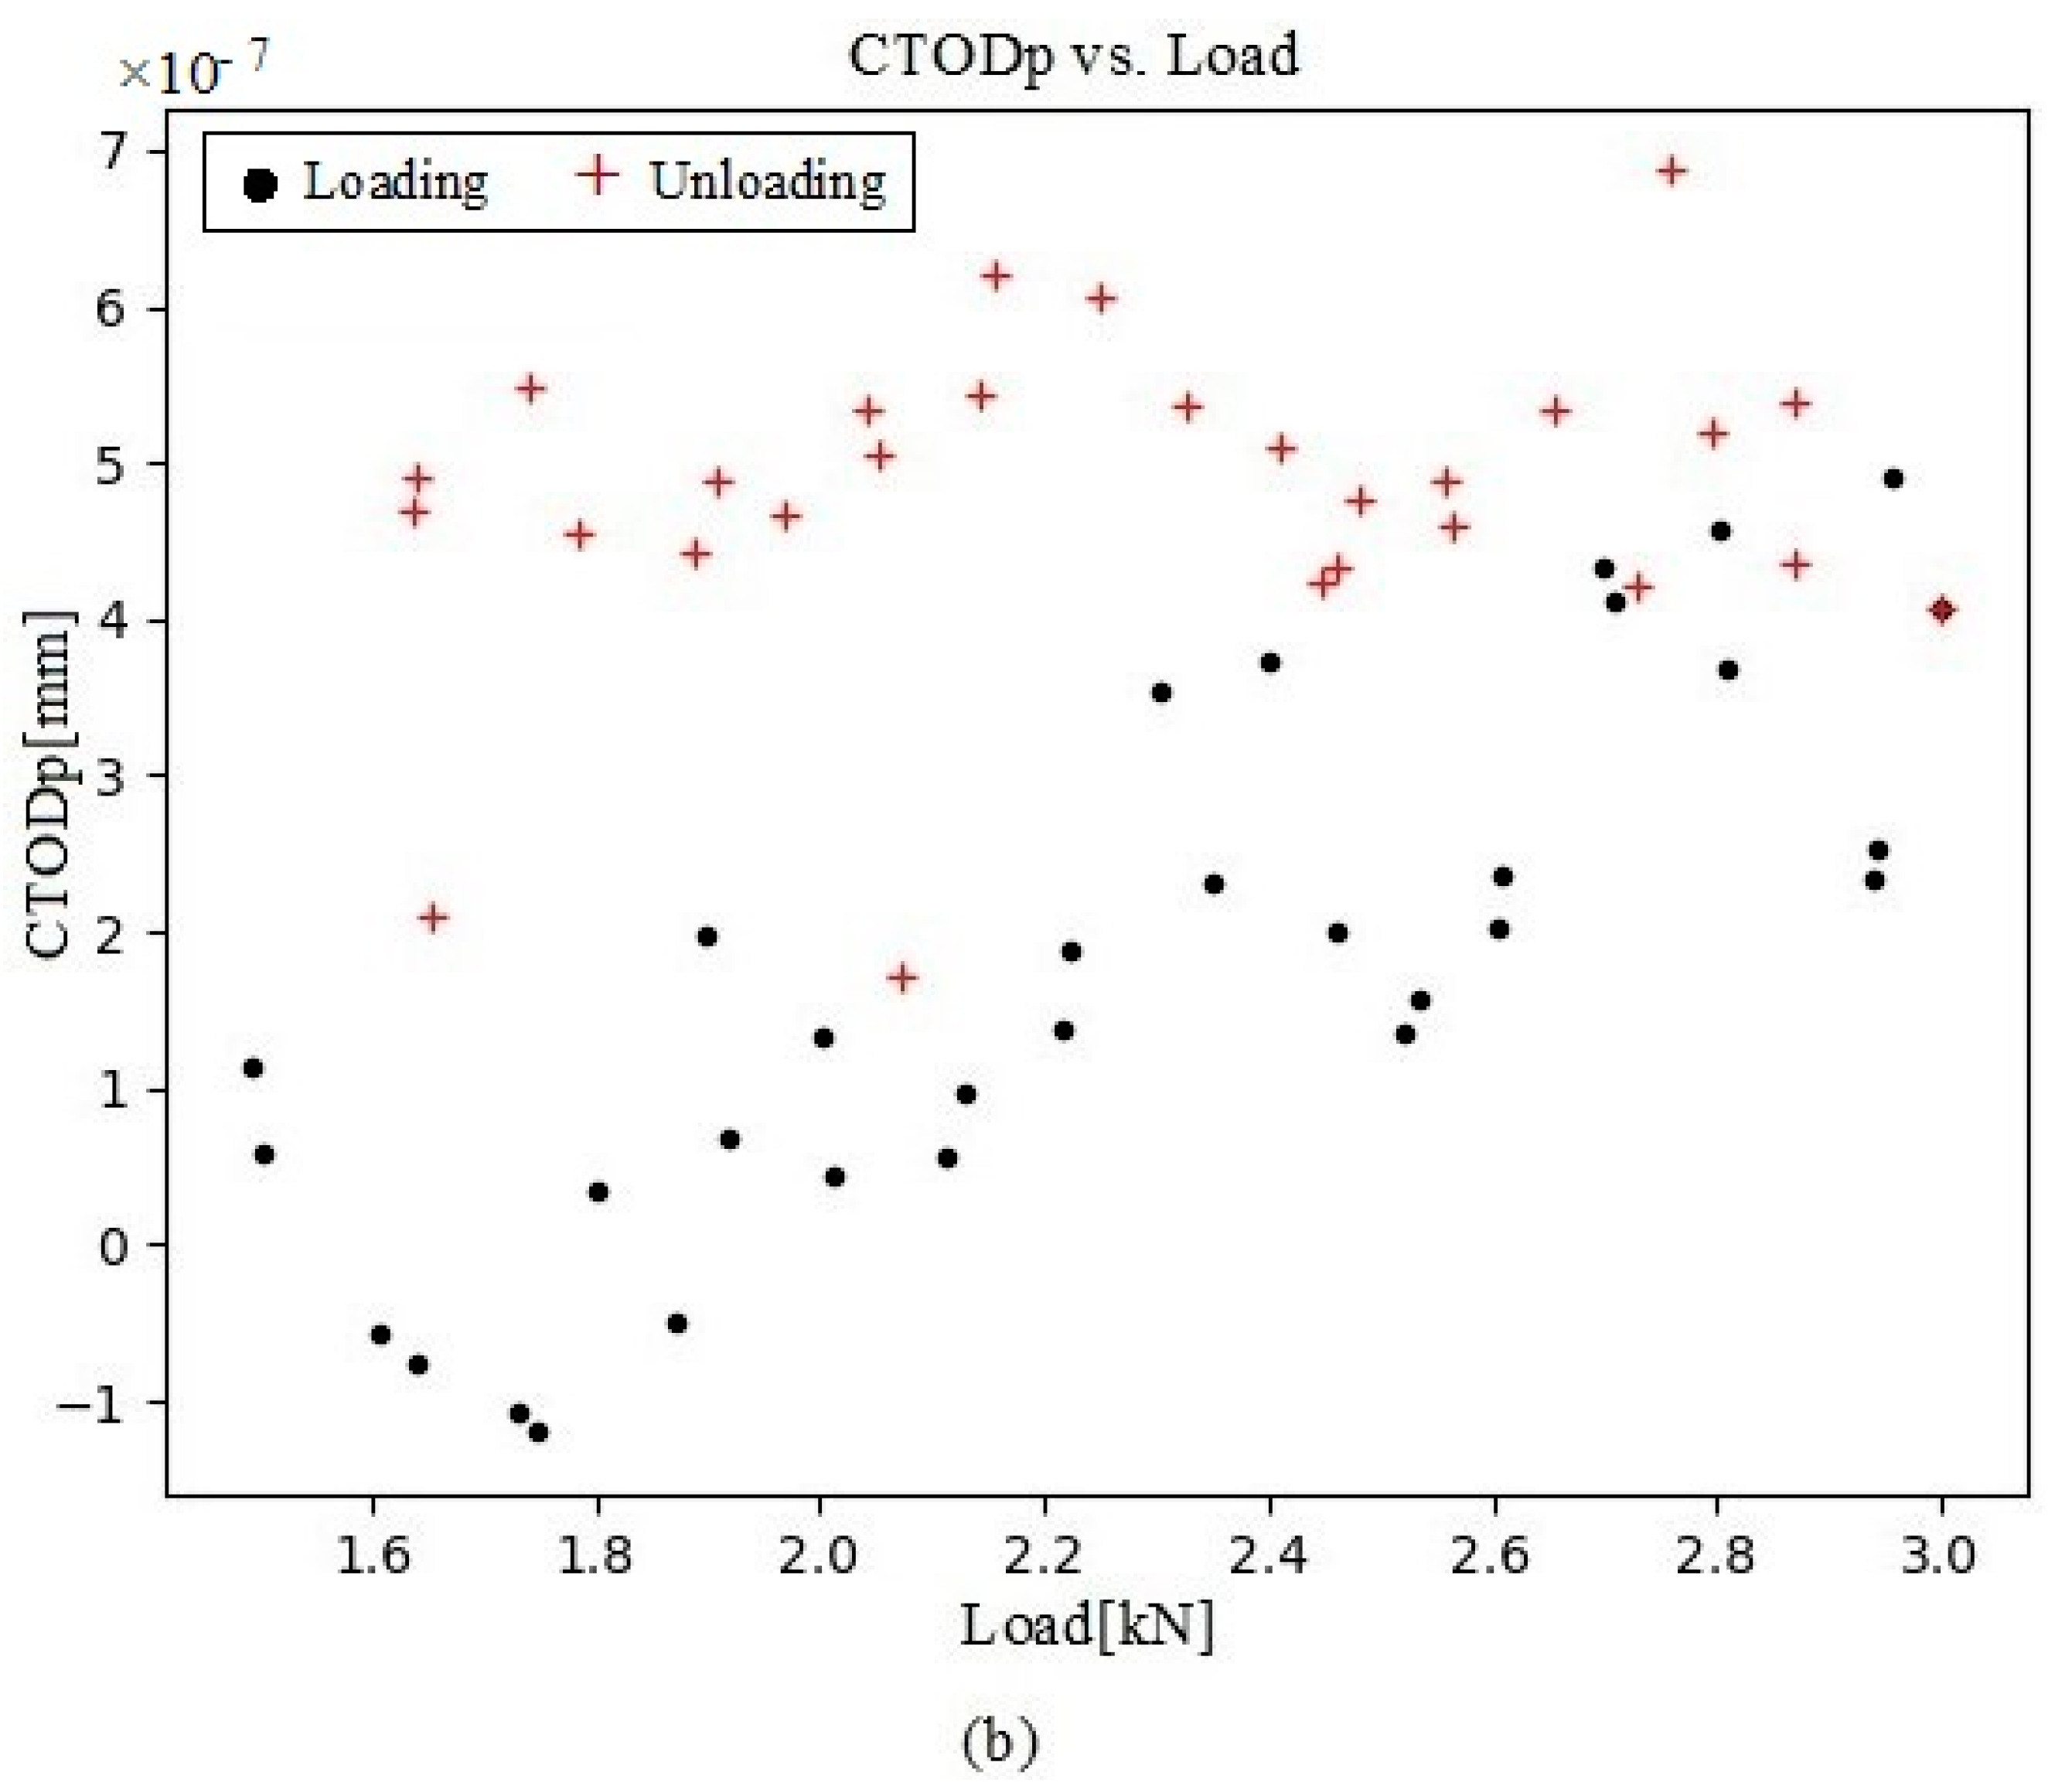
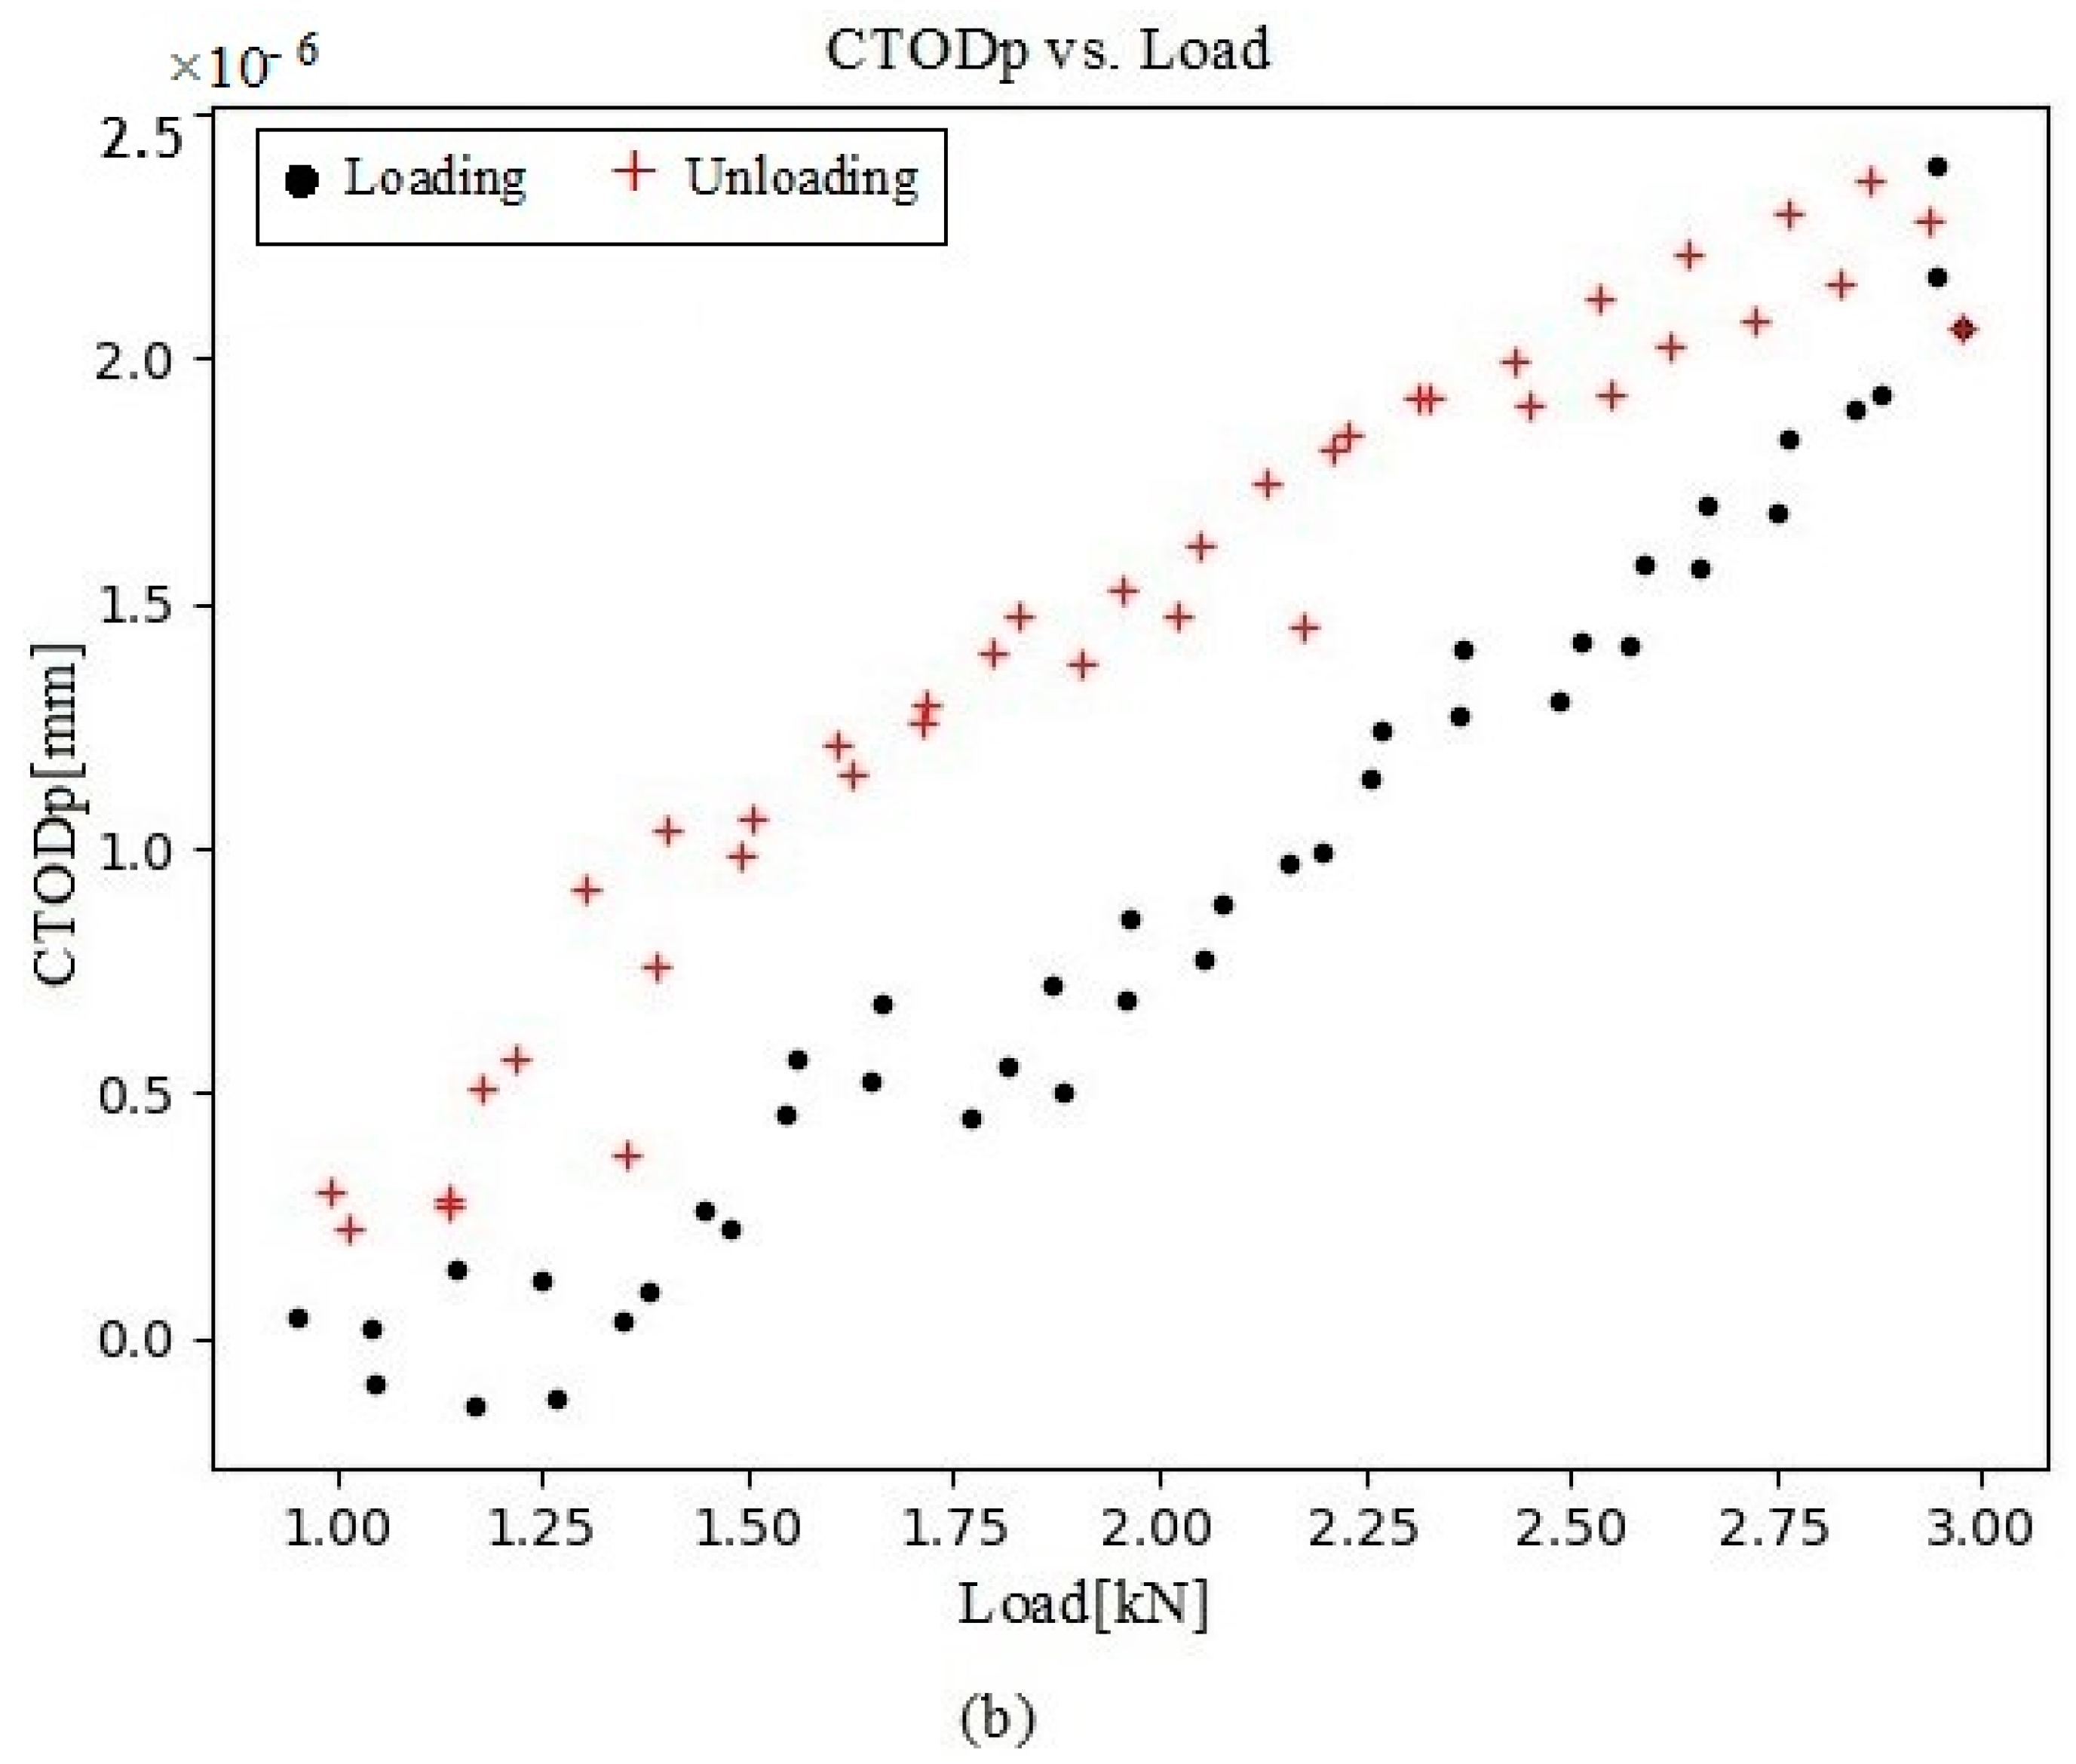
3.2.5. Elastic and Plastic Crack-Tip Opening Displacement throughout Loading
4. Results and Discussion
5. Conclusions
Author Contributions
Funding
Informed Consent Statement
Data Availability Statement
Acknowledgments
Conflicts of Interest
Nomenclature
| Fcl | closure load |
| Fep,L | ela stic–plastic transition load |
| Fmax | maximum load |
| Fmin | minimum load |
| Fop | opening load |
| FU | force applied during unloading |
| Se,L | loading slope (elastic contribution) |
| Se,U | unloading slope (elastic contribution) |
| ∆δe,L, ∆δp,L | range of CTOD elastic and plastic contributions during loading |
| ∆δe,U, ∆δp,U | range of CTOD elastic and plastic contributions during unloading |
| Uop | crack-opening level |
| Ucl | crack-closure level |
References
- Nishida, S. Failure analysis in engineering applications. Mater. Des. 1992, 13, 121. [Google Scholar]
- Burstow, M.C.; Howard, I.C. Damage mechanics models of ductile crack growth in welded specimens. Fatigue Fract. Eng. Mater. Struct. 2000, 23, 691–708. [Google Scholar] [CrossRef]
- Findlay, S.J.; Harrison, N.D. Why aircraft fail. Mater. Today 2002, 5, 18–25. [Google Scholar] [CrossRef]
- Schütz, W. A history of fatigue. Eng. Fract. Mech. 1996, 54, 263–300. [Google Scholar] [CrossRef]
- Newman, J.C.; Phillips, E.P.; Swain, M.H. Fatigue-life prediction methodology using small-crack theory. Int. J. Fatigue 1999, 21, 109–119. [Google Scholar] [CrossRef]
- Correia, J.A.; Blasón, S.; De Jesus, A.M.; Canteli, A.F.; Moreira, P.M.; Tavares, P.J. Fatigue life prediction based on an equivalent initial fl aw size approach and a new normalized fatigue crack growth model. Eng. Fail. Anal. 2016, 69, 15–28. [Google Scholar] [CrossRef]
- Forman, R.G.; Mettu, S.R. Behavior of Surface and Corner Cracks Subjected to Tensile and Bending Loads in Ti-6Al-4V Alloy; NASA: Washington, DC, USA, 1990.
- Paris, P.; Erdogan, F. A critical analysis of crack propagation laws. J. Fluids Eng. 1963, 85, 528–533. [Google Scholar] [CrossRef]
- Murakami, Y. Stress Intensity Factors Handbook; Pergamon Press: Oxford, UK, 1987. [Google Scholar]
- Carpinteri, A. Handbook of Fatigue Crack: Propagation in Metallic Structures; Elsevier: Amsterdam, The Netherlands, 1994. [Google Scholar]
- Tada, H.; Paris, P.C.; Irwin, G.R. The Stress Analysis of Cracks Handbook, 3rd ed.; ASME Press: New York, NY, USA, 2010. [Google Scholar]
- Rice, J.R. Mechanics of crack tip deformation and extension by fatigue. In Fatigue Crack Propagation; ASTM: West Conshohocken, PA, USA, 1967; pp. 247–311. [Google Scholar] [CrossRef]
- Lim, J.-Y.; Hong, S.-G.; Lee, S.-B. Application of local stress–strain approaches in the prediction of fatigue crack initiation life for cyclically non-stabilized and non-Masing steel. Int. J. Fatigue 2005, 27, 1653–1660. [Google Scholar] [CrossRef]
- Correia, J.; Blasón, S.; Arcari, A.; Calvente, M.; Apetre, N.; Moreira, P.; De Jesus, A.; Canteli, A. Modified CCS fatigue crack growth model for the AA2019-T851 based on plasticity-induced crack-closure. Theor. Appl. Fract. Mech. 2016, 85, 26–36. [Google Scholar] [CrossRef]
- Liu, Y.; Mahadevan, S. Probabilistic fatigue life prediction using an equivalent initial flaw size distribution. Int. J. Fatigue 2009, 31, 476–487. [Google Scholar] [CrossRef]
- Antunes, F.V.; Ferreira, M.S.C.; Branco, R.; Prates, P.; Gardin, C.; Sarrazin-Baudoux, C. Fatigue crack growth versus plastic CTOD in the 304L stainless steel. Eng. Fract. Mech. 2019, 214, 487–503. [Google Scholar] [CrossRef]
- Elber, W. The Significance of Fatigue Crack Closure; American Society for Testing and Materials: West Conshohocken, PA, USA, 1971; pp. 230–242. [Google Scholar]
- Rao, K.T.V.; Yu, W.; Ritchie, R.O. On the behavior of small fatigue cracks in commercial aluminum-lithium alloys. Eng. Fract. Mech. 1988, 31, 623–635. [Google Scholar] [CrossRef]
- Blom, A.F.; Holm, D.K. An experimental and numerical study of crack closure. Eng. Fract. Mech. 1985, 22, 997–1011. [Google Scholar] [CrossRef]
- Bao, H.; McEvily, A.J. On plane stress–plane strain interactions in fatigue crack growth. Int. J. Fatigue 1998, 20, 441–448. [Google Scholar] [CrossRef]
- Costa, J.D.M.; Ferreira, J.A.M. Effect of stress ratio and specimen thickness on fatigue crack growth of CK45 steel. Theor. Appl. Fract. Mech. 1998, 30, 65–73. [Google Scholar] [CrossRef]
- Borrego, L.P.; Ferreira, J.M.; Costa, J.M. Fatigue crack growth and crack closure in an AlMgSi alloy. Fatigue Fract. Eng. Mater. Struct. 2001, 24, 255–265. [Google Scholar] [CrossRef]
- Vasudevan, A.K.; Sadananda, K.; Louat, N. Reconsideration of fatigue crack closure. Scr. Metall. Mater. 1992, 27, 1673–1678. [Google Scholar] [CrossRef]
- Donald, K.; Paris, P.C. An evaluation of ΔKeff estimation procedures on 6061-T6 and 2024-T3 aluminum alloys. Int. J. Fatigue 1999, 21, S47–S57. [Google Scholar] [CrossRef]
- Kujawski, D. Enhanced model of partial crack closure for correlation of R-ratio effects in aluminum alloys. Int. J. Fatigue 2001, 23, 95–102. [Google Scholar] [CrossRef]
- Endo, K.; Okada, T.; Komai, K.; Kiyota, M. Fatigue crack propagation of steel in oil. Bull. JSME 1972, 15, 1316–1323. [Google Scholar] [CrossRef]
- Pineau, A.G.; Pelloux, R.M. Influence of strain-induced martensitic transformations on fatigue crack growth rates in stainless steels. Metall. Mater. Trans. B 1974, 5, 1103–1112. [Google Scholar] [CrossRef]
- Suresh, S.; Zamiski, G.F.; Ritchie, D.R.O. Oxide-Induced Crack Closure: An Explanation for Near-Threshold Corrosion Fatigue Crack Growth Behavior. Metall. Mater. Trans. A 1981, 12A, 1435–1443. [Google Scholar] [CrossRef]
- Walker, N.; Beevers, C.J. Fatigue crack closure mechanism in titanium. Fatigue Fract. Eng. Mater. Struct. 1979, 1, 135–148. [Google Scholar] [CrossRef]
- Kujawski, D. A new (ΔK+Kmax)0.5 driving force parameter for crack growth in aluminum alloys. Int. J. Fatigue 2001, 23, 733–740. [Google Scholar] [CrossRef]
- Noroozi, A.H.; Glinka, G.; Lambert, S. A two parameter driving force for fatigue crack growth analysis. Int. J. Fatigue 2005, 27, 1277–1296. [Google Scholar] [CrossRef]
- Christopher, C.J.; James, M.N.; Patterson, E.A.; Tee, K.F. Towards a new model of crack tip stress fields. Int. J. Fract. 2007, 148, 361–371. [Google Scholar] [CrossRef]
- Christopher, C.J.; James, M.N.; Patterson, E.A.; Tee, K.F. A quantitative evaluation of fatigue crack shielding forces using photoelasticity. Eng. Fract. Mech. 2008, 75, 4190–4199. [Google Scholar] [CrossRef]
- Lugo, M.; Daniewicz, S.R. The influence of T-stress on plasticity induced crack closure under plane strain conditions. Int. J. Fatigue 2011, 33, 176–185. [Google Scholar] [CrossRef]
- Larsson, S.G.; Carlsson, A.J. Influence of non-singular stress terms and specimen geometry on small-scale yielding at crack tips in elastic-plastic materials. J. Mech. Phys. Solids 1973, 21, 263–277. [Google Scholar] [CrossRef]
- Miarka, P.; Cruces, A.S.; Seitl, S.; Malíková, L.; Lopez-Crespo, P. Evaluation of the SIF and T-stress values of the Brazilian disc with a central notch by hybrid method. Int. J. Fatigue 2020, 135, 105562. [Google Scholar] [CrossRef]
- Miarka, P.; Cruces, A.S.; Seitl, S.; Malíková, L.; Lopez-Crespo, P. Influence of the constraint effect on the fatigue crack growth rate in S355 J2 steel using digital image correlation. Fatigue Fract. Eng. Mater. Struct. 2020, 43, 1703–1718. [Google Scholar] [CrossRef]
- Hosseini, Z.S.; Dadfarnia, M.; Somerday, B.P.; Sofronis, P.; Ritchie, R.O. On the theoretical modeling of fatigue crack growth. J. Mech. Phys. Solids 2018, 121, 341–362. [Google Scholar] [CrossRef]
- Zheng, X.; Cui, H.; Su, X.; Engler-Pinto, C.C.; Wen, W. Numerical modeling of fatigue crack propagation based on the theory of critical distances. Eng. Fract. Mech. 2013, 114, 151–165. [Google Scholar] [CrossRef]
- Pokluda, J. Dislocation-based model of plasticity and roughness-induced crack closure. Int. J. Fatigue 2013, 46, 35–40. [Google Scholar] [CrossRef]
- Chen, H.; Chen, W.; Li, T.; Ure, J. Effect of circular holes on the ratchet limit and crack tip plastic strain range in a centre cracked plate. Eng. Fract. Mech. 2011, 78, 2310–2324. [Google Scholar] [CrossRef]
- Park, H.B.; Kim, K.M.; Lee, B.W. Plastic zone size in fatigue cracking. Int. J. Press. Vessel. Pip. 1996, 68, 279–285. [Google Scholar] [CrossRef]
- Zhang, J.; He, X.D.; Du, S.Y. Analyses of the fatigue crack propagation process and stress ratio effects using the two parameter method. Int. J. Fatigue 2005, 27, 1314–1318. [Google Scholar] [CrossRef]
- Torabi, A.R.; Alaei, M. Mixed-mode ductile failure analysis of V-notched Al 7075-T6 thin sheets. Eng. Fract. Mech. 2015, 150, 70–95. [Google Scholar] [CrossRef]
- Torabi, A.R.; Keshavarzian, M. Evaluation of the load-carrying capacity of notched ductile plates under mixed mode loading. Theor. Appl. Fract. Mech. 2016, 85, 375–386. [Google Scholar] [CrossRef]
- Pelloux, R.M.N. Crack extension by alternating shear. Eng. Fract. Mech. 1970, 1, 170–174. [Google Scholar] [CrossRef]
- Garrett, G.G.; Knott, J.F. On the influence of cyclic hardening and crack opening displacement (COD) on crack advance during fatigue. Metall. Trans. A 1976, 7, 884–887. [Google Scholar] [CrossRef]
- Glinka, G. A notch stress-strain analysis approach to fatigue crack growth. Eng. Fract. Mech. 1985, 21, 245–261. [Google Scholar] [CrossRef]
- Hafezi, M.H.; Abdullah, N.N.; Correia, J.F.O.; De Jesus, A.M.P. An assessment of a strain-life approach for fatigue crack growth. Int. J. Struct. Integr. 2012, 3, 344–376. [Google Scholar] [CrossRef]
- De Jesus, A.M.P.; Correia, J.A.F.O. Critical Assessment of a Local Strain-Based Fatigue Crack Growth Model Using Experimental Data Available for the P355NL1 Steel. J. Press. Vessel Technol. 2012, 135, 011404. [Google Scholar] [CrossRef]
- Zhang, W.; Liu, H.; Wang, Q.; He, J. A fatigue life prediction method based on strain intensity factor. Materials 2017, 10, 689. [Google Scholar] [CrossRef]
- Shahani, A.R.; Kashani, M.H.; Rastegar, M.; Dehkordi, B.M. A unified model for the fatigue crack growth rate in variable stress ratio. Fatigue Fract. Eng. Mater. Struct. 2009, 32, 105–118. [Google Scholar] [CrossRef]
- Wells, A.A. Unstable Crack Propagation in Metals: Cleavage and Fast Fracture. Proc. Crack Propag. Symp. 1961, 1, 84. [Google Scholar]
- Laird, C.; Smith, G.C. Crack propagation in high stress fatigue. Philos. Mag. 1962, 77, 847–857. [Google Scholar] [CrossRef]
- Laird, C. The influence of metallurgical structure on the mechanisms of fatigue crack propagation. In Fatigue Crack Propagation, ASTM STP NO 415; ASTM: West Conshohocken, PA, USA, 1967; pp. 170–174. [Google Scholar]
- Nicholls, D.J. The relation between crack blunting and fatigue crack growth rates. Fatigue Fract. Eng. Mater. Struct. 1994, 17, 459–467. [Google Scholar] [CrossRef]
- Tvergaard, V. On fatigue crack growth in ductile materials by crack-tip blunting. J. Mech. Phys. Solids 2004, 52, 2149–2166. [Google Scholar] [CrossRef]
- Pippan, R.; Grosinger, W. Fatigue crack closure: From LCF to small scale yielding. Int. J. Fatigue 2013, 46, 41–48. [Google Scholar] [CrossRef]
- Dong, Q.; Yang, P.; Xu, G.; Deng, J. Mechanisms and modeling of low cycle fatigue crack propagation in a pressure vessel steel Q345. Int. J. Fatigue 2016, 89, 2–10. [Google Scholar] [CrossRef]
- Ktari, A.; Baccar, M.; Shah, M.; Haddar, N.; Ayedi, H.F.; Rezai-Aria, F. A crack propagation criterion based on ΔCTOD measured with 2D-digital image correlation technique. Fatigue Fract. Eng. Mater. Struct. 2014, 37, 682–694. [Google Scholar] [CrossRef]
- Deng, J.; Yang, P.; Dong, Q.; Wang, D. Research on CTOD for low-cycle fatigue analysis of central-through cracked plates considering accumulative plastic strain. Eng. Fract. Mech. 2016, 154, 128–139. [Google Scholar] [CrossRef]
- Sutton, M.A.; McNeill, S.R.; Helm, J.D.; Boone, M.L. Measurement of crack tip opening displacement and full-field deformations during fracture of aerospace materials using 2D and 3D image correlation methods. In Iutam Symposium on Advanced Optical Methods and Applications in Solid Mechanics; Springer: Berlin/Heidelberg, Germany, 2000; Volume 82, pp. 571–580. [Google Scholar]
- Nowell, D.; De Matos, P.F.P. Application of digital image correlation to the investigation of crack closure following overloads. Procedia Eng. 2010, 2, 1035–1043. [Google Scholar] [CrossRef]
- Yusof, F.; Lopez-Crespo, P.; Withers, P.J. Effect of overload on crack closure in thick and thin specimens via digital image correlation. Int. J. Fatigue 2013, 56, 17–24. [Google Scholar] [CrossRef]
- Lopez-Crespo, P.; Shterenlikht, A.; Yates, J.R.; Patterson, E.A.; Withers, P.J. Some experimental observations on crack closure and crack-tip plasticity. Fatigue Fract. Eng. Mater. Struct. 2009, 32, 418–429. [Google Scholar] [CrossRef]
- Shterenlikht, A.; Garrido, F.A.D.; Lopez-Crespo, P.; Withers, P.J.; Patterson, E.A. Mixed Mode (KI+KII) Stress Intensity Factor Measurement by Electronic Speckle Pattern Interferometry and Image Correlation. Appl. Mech. Mater. 2004, 1, 107–112. [Google Scholar] [CrossRef]
- López-Crespo, P.; Burguete, R.L.; Patterson, E.A.; Shterenlikht, A.; Withers, P.J.; Yates, J.R. Study of a Crack at a Fastener Hole by Digital Image Correlation. Exp. Mech. 2008, 49, 551–559. [Google Scholar] [CrossRef]
- Antunes, F.V.; Rodrigues, S.M.; Branco, R.; Camas, D. A numerical analysis of CTOD in constant amplitude fatigue crack growth. Theor. Appl. Fract. Mech. 2016, 85, 45–55. [Google Scholar] [CrossRef]
- Antunes, F.V.; Branco, R.; Prates, P.A.; Borrego, L. Fatigue crack growth modelling based on CTOD for the 7050-T6 alloy. Fatigue Fract. Eng. Mater. Struct. 2017, 40, 1309–1320. [Google Scholar] [CrossRef]
- Antunes, F.V.; Serrano, S.; Branco, R.; Prates, P. Fatigue crack growth in the 2050-T8 aluminium alloy. Int. J. Fatigue 2018, 115, 79–88. [Google Scholar] [CrossRef]
- Marques, B.; Borges, M.F.; Antunes, F.V.; Vasco-Olmo, J.M.; Díaz, F.A.; James, M.N. Limitations of small-scale yielding for fatigue crack growth. Eng. Fract. Mech. 2021, 252, 107806. [Google Scholar] [CrossRef]
- O’Sullivan, J. Use of Nickel and 316 L Stainless Steel Filter Assemblies in High Purity Corrosive Gas Distribution Systems. 2017. Available online: https://www.pall.com/content/dam/pall/microelectronics/literature-library/non-gated/Use%20of%20Nickel%20and%20316L%20Stainless%20Steel%20Filter%20Assemblies%20in%20High%20Purity%20Corrosive%20Gas%20Distribution%20Systems%20.pdf (accessed on 18 January 2023).
- ASTM E647−13; Standard Test Method for Measurement of Fatigue Crack Growth Rates. ASTM: West Conshohocken, PA, USA, 2014.
- GmbH, L.V. PIV Software Manual. 1999. Available online: https://www.lavision.de/de/downloads/manuals/systems.php (accessed on 18 January 2023).
- Yusof, F.; Withers, P.J. Real-time acquisition of fatigue crack images for monitoring crack-tip stress intensity variations within fatigue cycles. J. Strain Anal. Eng. Des. 2009, 44, 149–158. [Google Scholar] [CrossRef]
- Lopez-Crespo, P.; Withers, P.J.; Yusof, F.; Dai, H.; Steuwer, A.; Kelleher, J.F.; Buslaps, T. Overload effects on fatigue crack-tip fields under plane stress conditions: Surface and bulk analysis. Fatigue Fract. Eng. Mater. Struct. 2013, 36, 75–84. [Google Scholar] [CrossRef]
- Sutton, M.A.; Zhao, W.; McNeill, S.R.; Helm, J.D.; Piascik, R.S.; Riddell, W.T. Local crack closure measurements: Development of a measurement system using computer vision and a far-field microscope. In Advances in Fatigue Crack Closure Measurement and Analysis, 2nd Volume; McClung, R.C., Newman, J.C., Eds.; ASTM STP, 1343; ASTM: West Conshohocken, PA, USA, 1999; pp. 145–156. [Google Scholar]
- Nicoletto, G. Plastic zones about fatigue cracks in metals. Int. J. Fatigue 1989, 11, 107–115. [Google Scholar] [CrossRef]
- Lopez-Crespo, P.; Shterenlikht, A.; Patterson, E.A.; Yates, J.R.; Withers, P.J. The stress intensity of mixed mode cracks determined by digital image correlation. J. Strain Anal. Eng. Des. 2008, 43, 769–780. [Google Scholar] [CrossRef]
- Vasco-Olmo, J.M.; Díaz, F.A.; Antunes, F.V.; James, M.N. Experimental evaluation of CTOD in constant amplitude fatigue crack growth from crack tip displacement fields. Frat. Integrita Strutt. 2017, 11, 157–165. [Google Scholar] [CrossRef]
- Cruces, A.S.; Mokhtarishirazabad, M.; Moreno, B.; Zanganeh, M.; Lopez-Crespo, P. Study of the biaxial fatigue behaviour and overloads on S355 low carbon steel. Int. J. Fatigue 2020, 134, 105466. [Google Scholar] [CrossRef]
- Schreier, H.; Orteu, J.J.; Sutton, M.A. Image Correlation for Shape, Motion and Deformation Measurements: Basic Concepts, Theory and Applications; Springer: Berlin/Heidelberg, Germany, 2009. [Google Scholar]
- Marques, B.; Neto, D.; Antunes, F.; Vasco-Olmo, J.; Díaz, F. Numerical tool for the analysis of CTOD curves obtained by DIC or FEM. Fatigue Fract. Eng. Mater. Struct. 2020, 43, 2984–2997. [Google Scholar] [CrossRef]
- Harris, C.R.; Millman, K.J.; van der Walt, S.J.; Gommers, R.; Virtanen, P.; Cournapeau, D.; Wieser, E.; Taylor, J.; Berg, S.; Smith, N.J.; et al. Array programming with NumPy. Nature 2020, 585, 357–362. [Google Scholar] [CrossRef] [PubMed]
- Suresh, S. Fatigue of Materials, 2nd ed.; Cambridge University Press: Cambridge, UK, 1998. [Google Scholar]
- McClung, R.C. The influence of applied stress, crack length, and stress intensity factor on crack closure. Metall. Trans. A 1991, 22, 1559–1571. [Google Scholar] [CrossRef]


| Measurement Stages | N (Accumulated Cycles) | ∆CTODp (mm) | da/dN (mm/Cycle) |
|---|---|---|---|
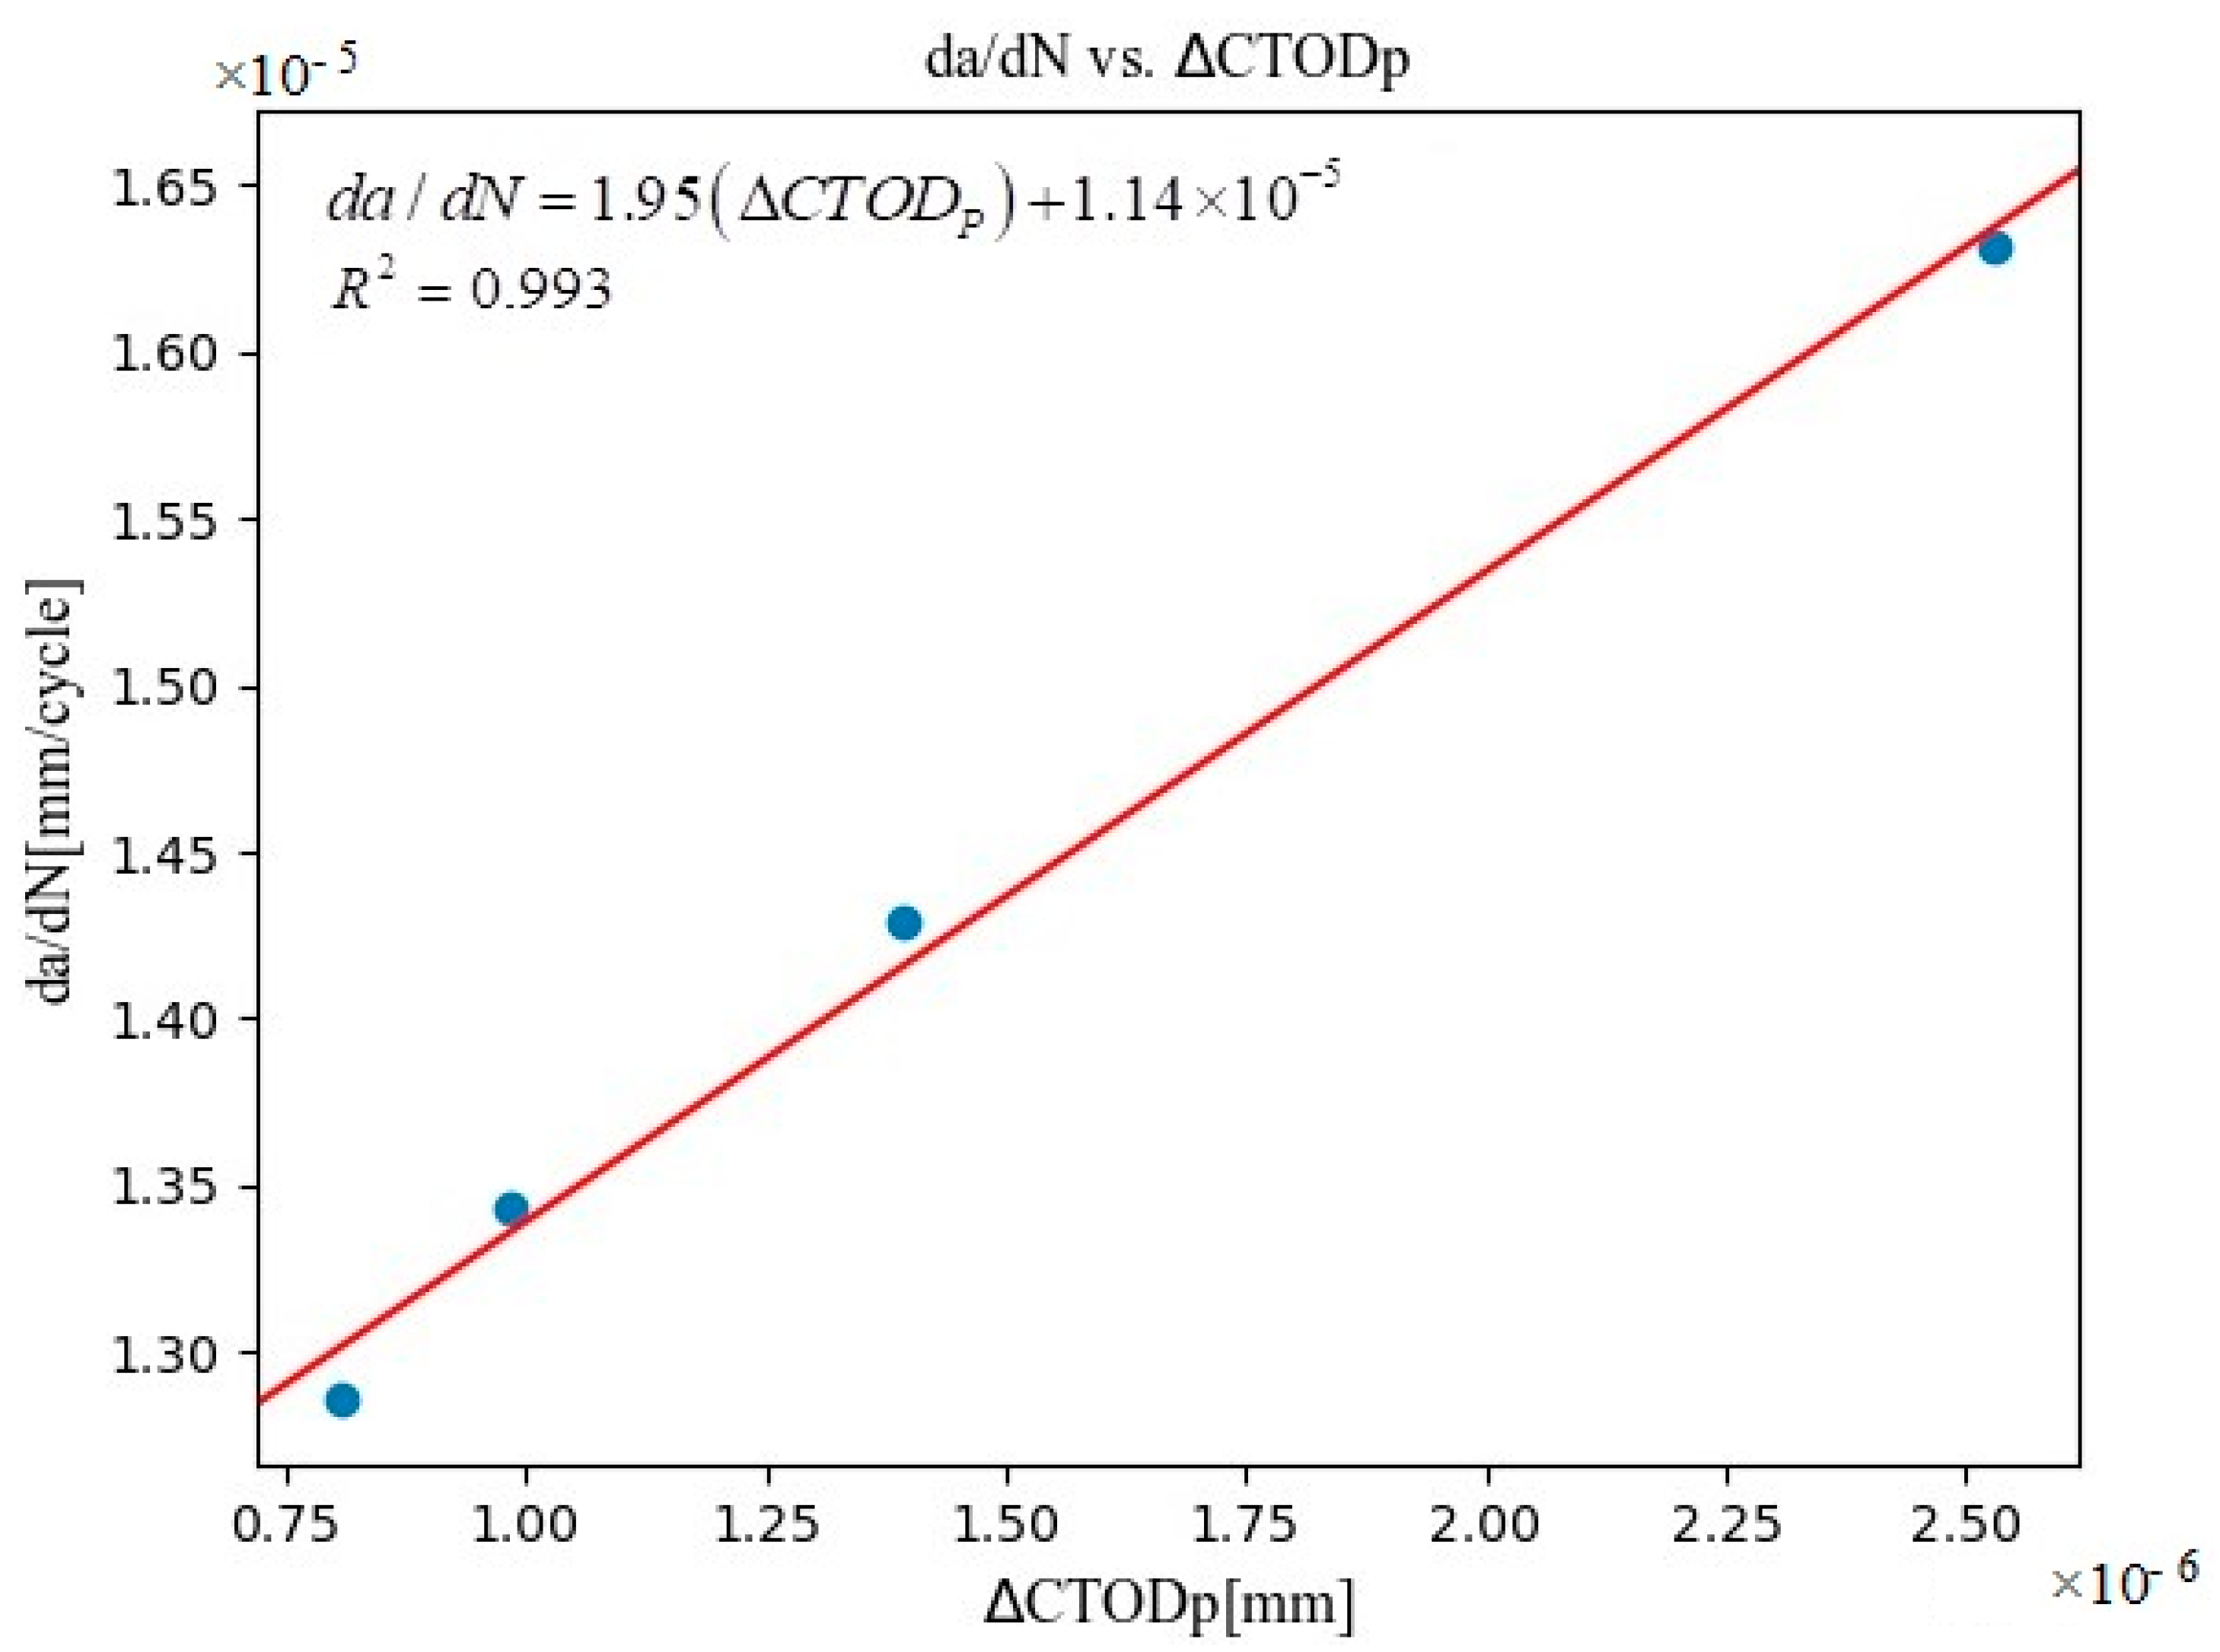
| 1 | 230,792 | 8.06564 × 10⁻⁷ | 1.28577 × 10⁻⁵ |
| 2 | 250,786 | 9.84161 × 10⁻⁷ | 1.34326 × 10⁻⁵ |
| 3 | 290,838 | 1.39211 × 10⁻⁶ | 1.42913 × 10⁻⁵ |
| 4 | 331,273 | 2.53057 × 10⁻⁶ | 1.63225 × 10⁻⁵ |
Disclaimer/Publisher’s Note: The statements, opinions and data contained in all publications are solely those of the individual author(s) and contributor(s) and not of MDPI and/or the editor(s). MDPI and/or the editor(s) disclaim responsibility for any injury to people or property resulting from any ideas, methods, instructions or products referred to in the content. |
© 2023 by the authors. Licensee MDPI, Basel, Switzerland. This article is an open access article distributed under the terms and conditions of the Creative Commons Attribution (CC BY) license (https://creativecommons.org/licenses/by/4.0/).
Share and Cite
Ajmal, M.; Lopez-Crespo, C.; Cruces, A.S.; Lopez-Crespo, P. New Plastic Crack-Tip Opening Displacement Tool Based on Digital Image Correlation for Estimating the Fatigue-Crack-Growth Law on 316L Stainless Steel. Materials 2023, 16, 4589. https://doi.org/10.3390/ma16134589
Ajmal M, Lopez-Crespo C, Cruces AS, Lopez-Crespo P. New Plastic Crack-Tip Opening Displacement Tool Based on Digital Image Correlation for Estimating the Fatigue-Crack-Growth Law on 316L Stainless Steel. Materials. 2023; 16(13):4589. https://doi.org/10.3390/ma16134589
Chicago/Turabian StyleAjmal, Muhammad, Cristina Lopez-Crespo, Alejandro S. Cruces, and Pablo Lopez-Crespo. 2023. "New Plastic Crack-Tip Opening Displacement Tool Based on Digital Image Correlation for Estimating the Fatigue-Crack-Growth Law on 316L Stainless Steel" Materials 16, no. 13: 4589. https://doi.org/10.3390/ma16134589