

Modelling of Fatigue Microfracture in Porous Sintered Steel Using a Phase-Field Method


Abstract
:1. Introduction
- simplified numerical modelling based on the PF method for estimating the fatigue life of sintered steels is presented,
- mechanical characterization of the applied PF fatigue model based on the degradation of fracture energy is critically discussed,
- the influence of the porosity of the considered sintered steel on the estimated fatigue life is analysed using the proposed numerical method.
2. Materials and Methods
2.1. Experimental Testing
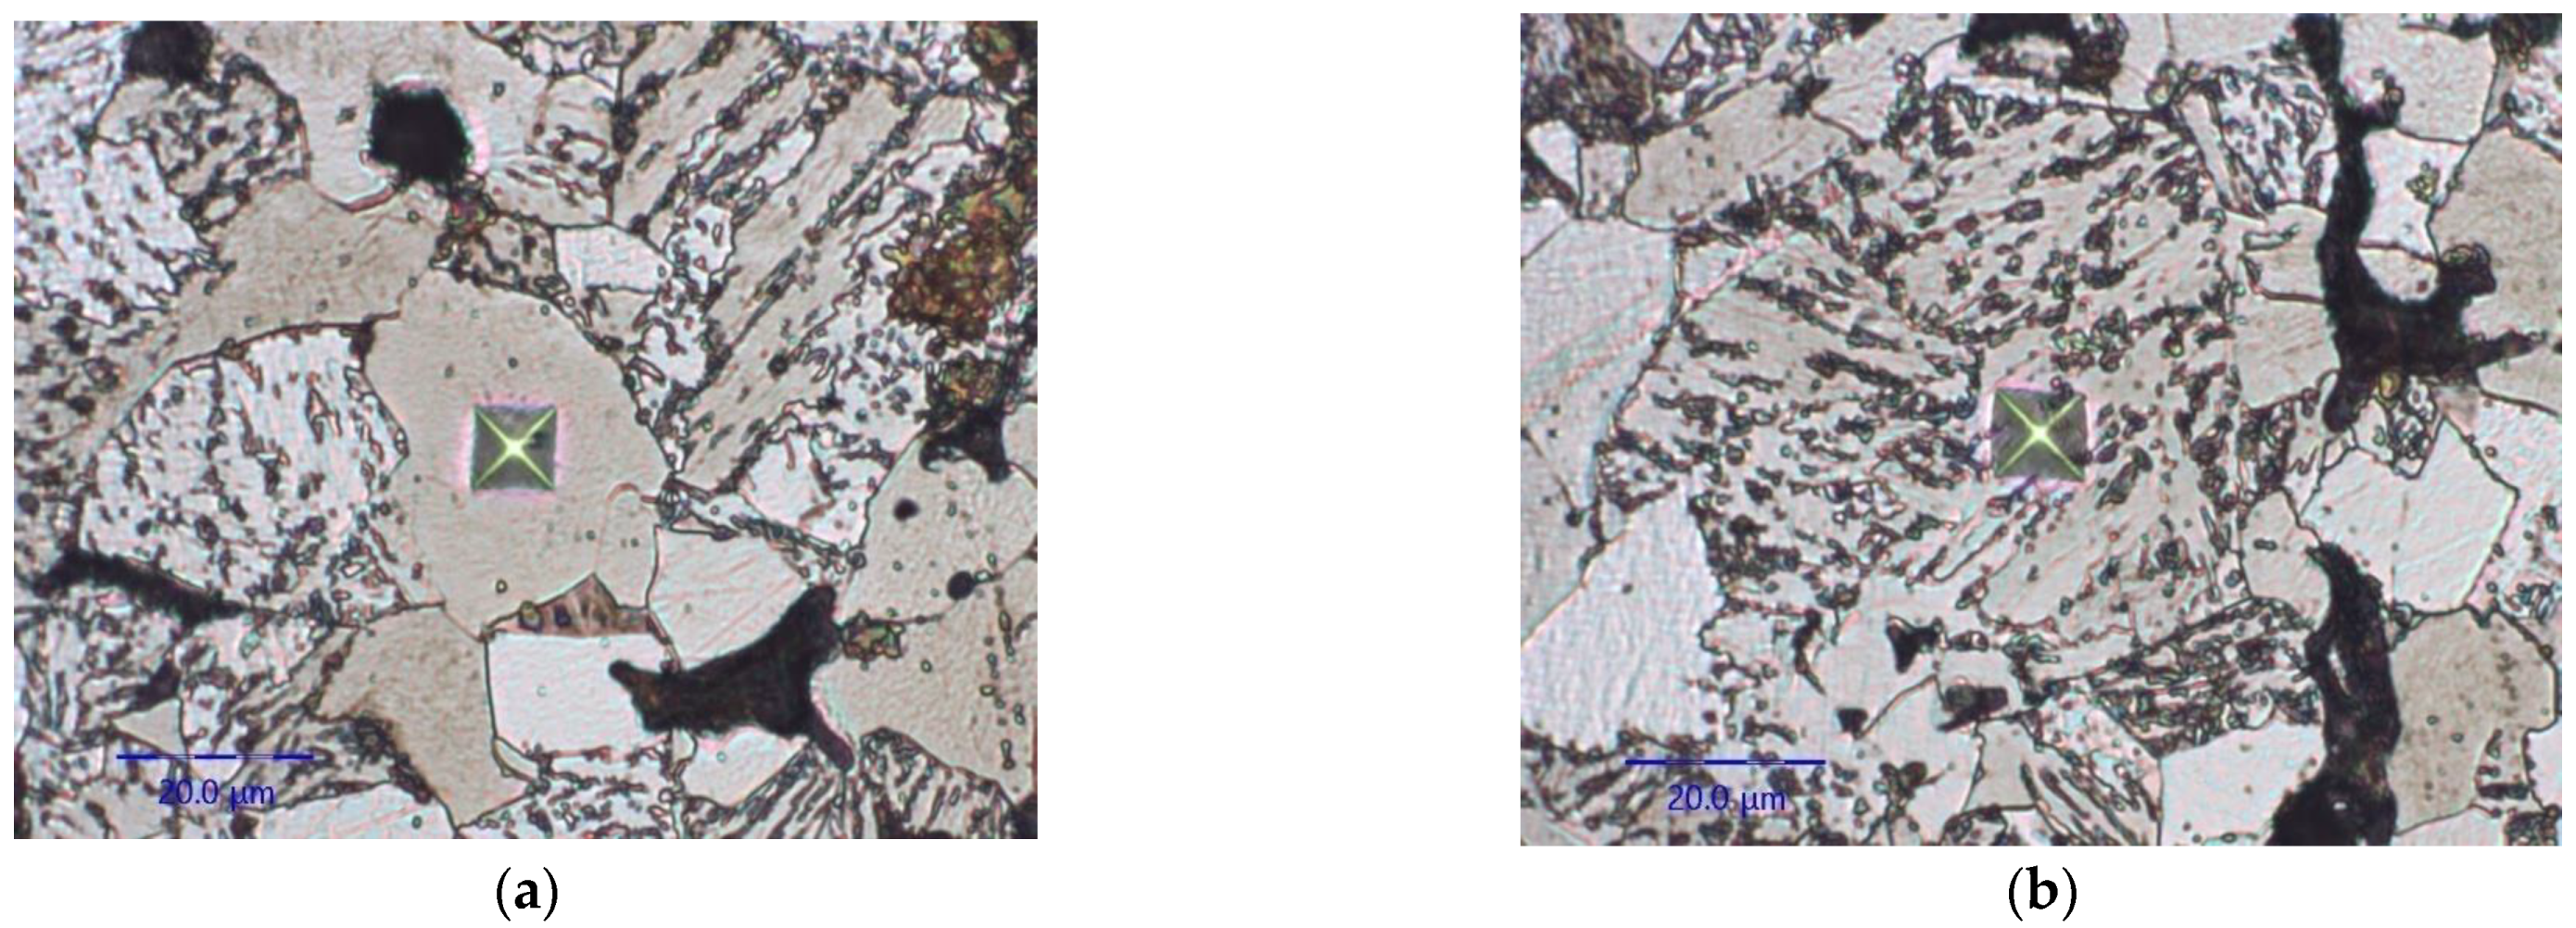
2.1.1. Microscale
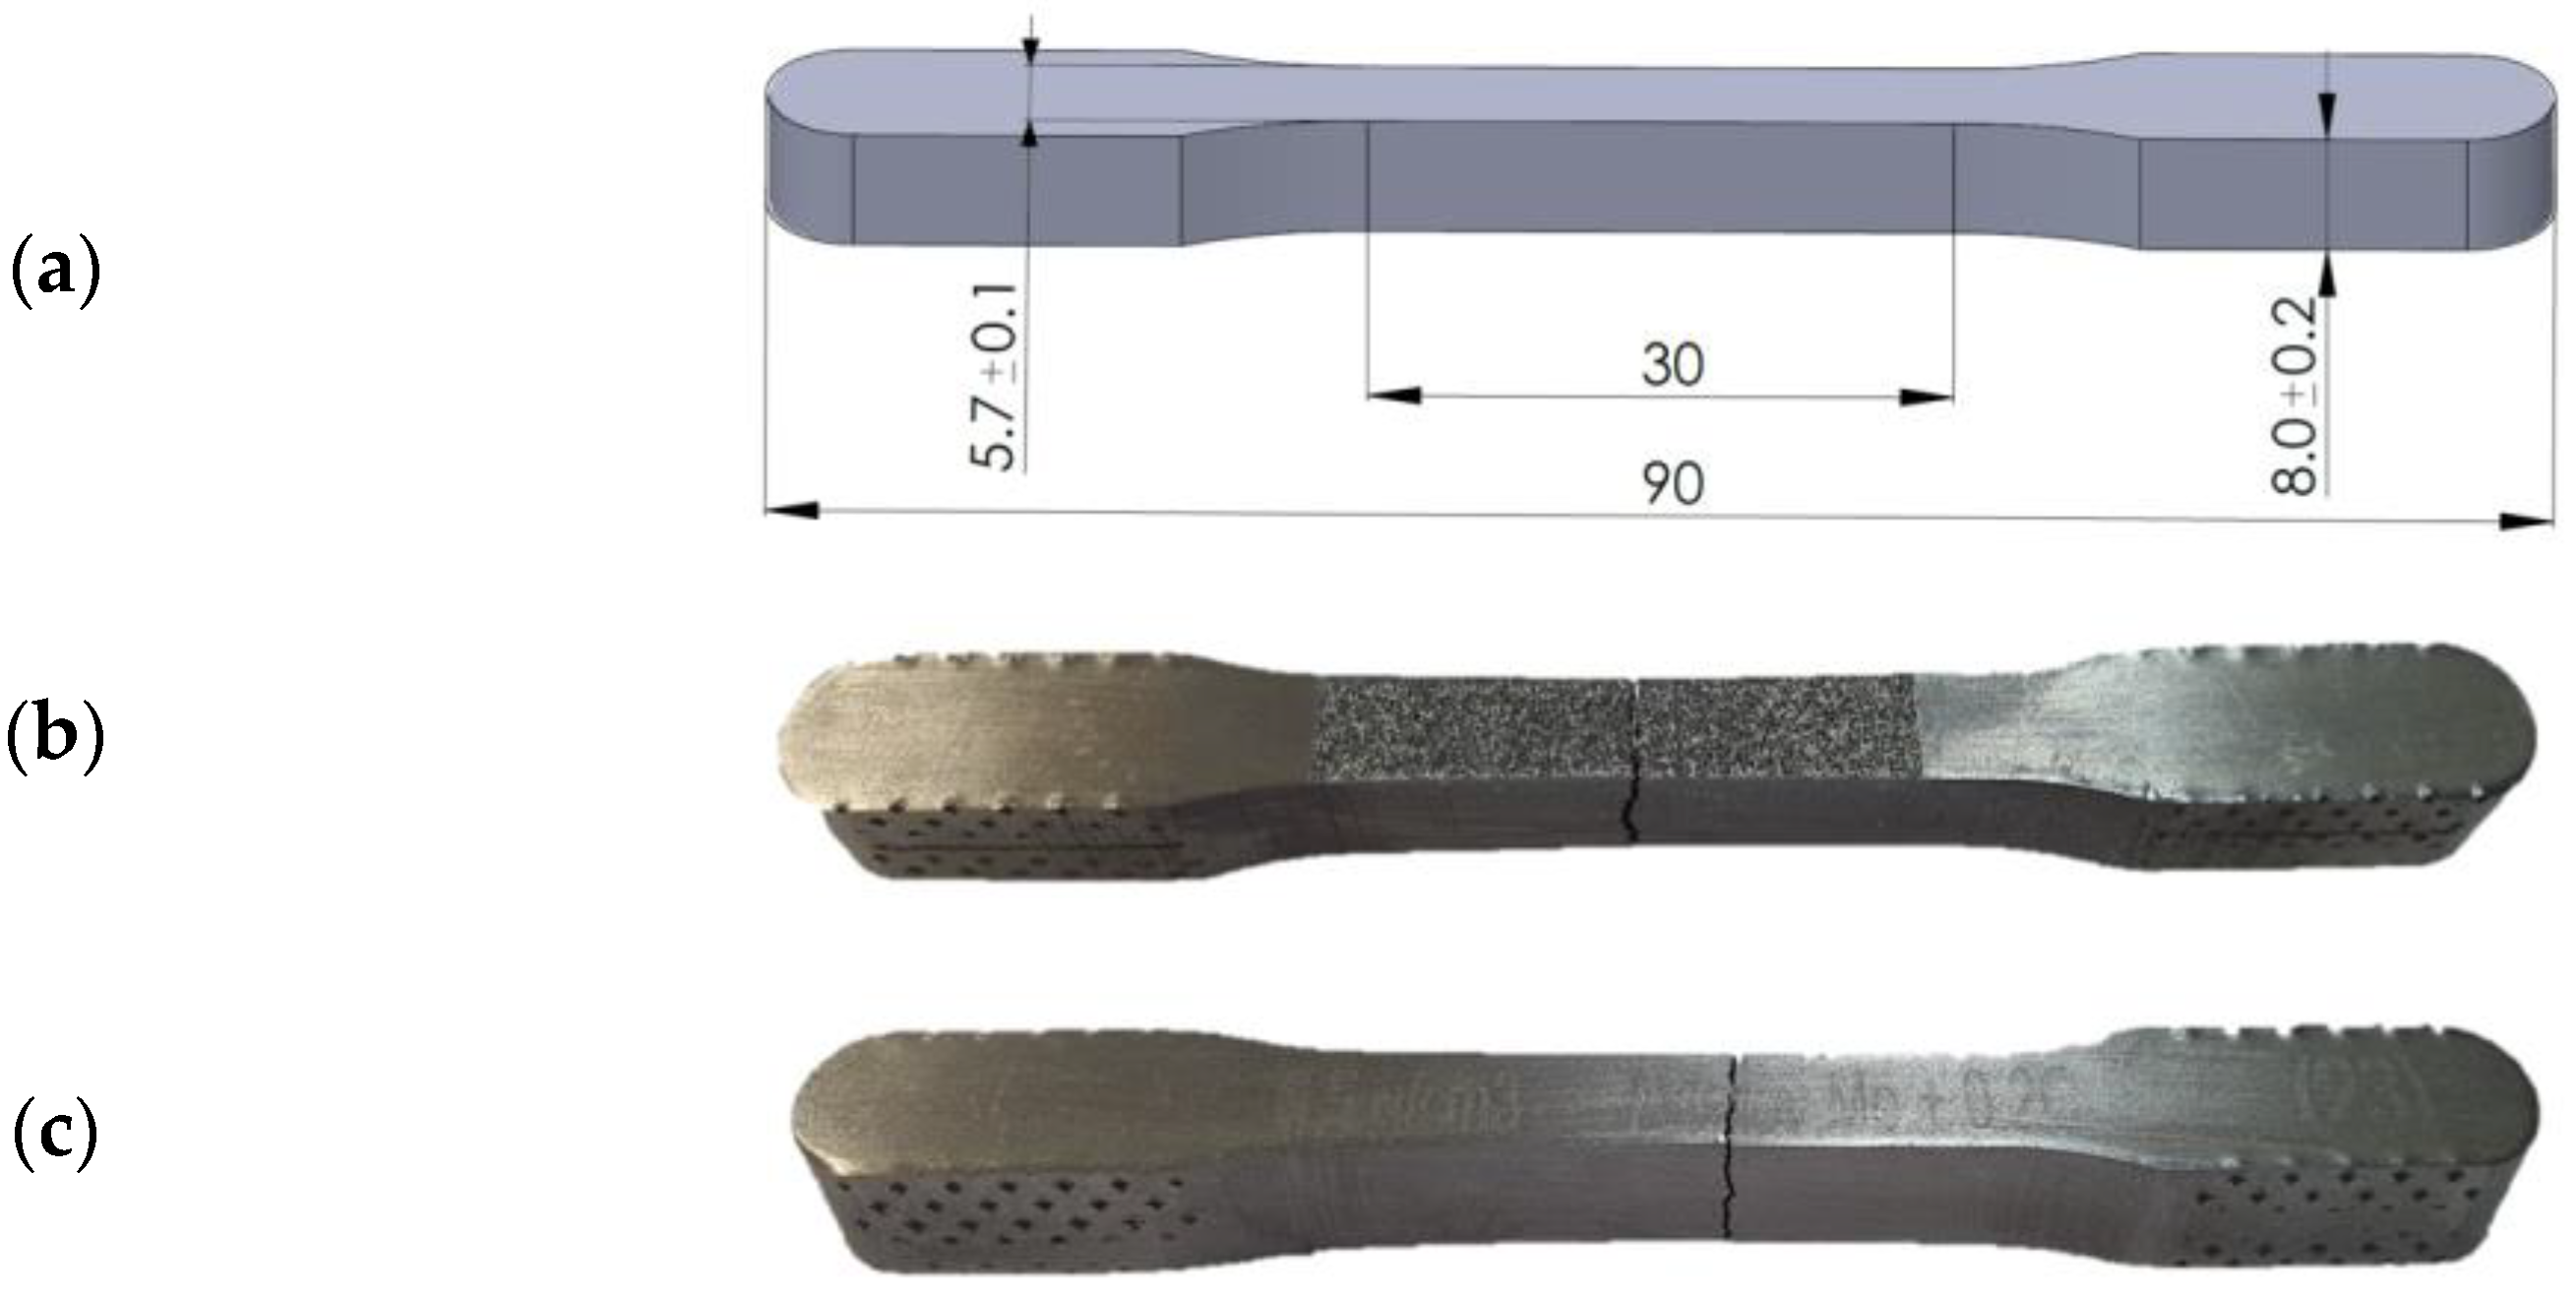
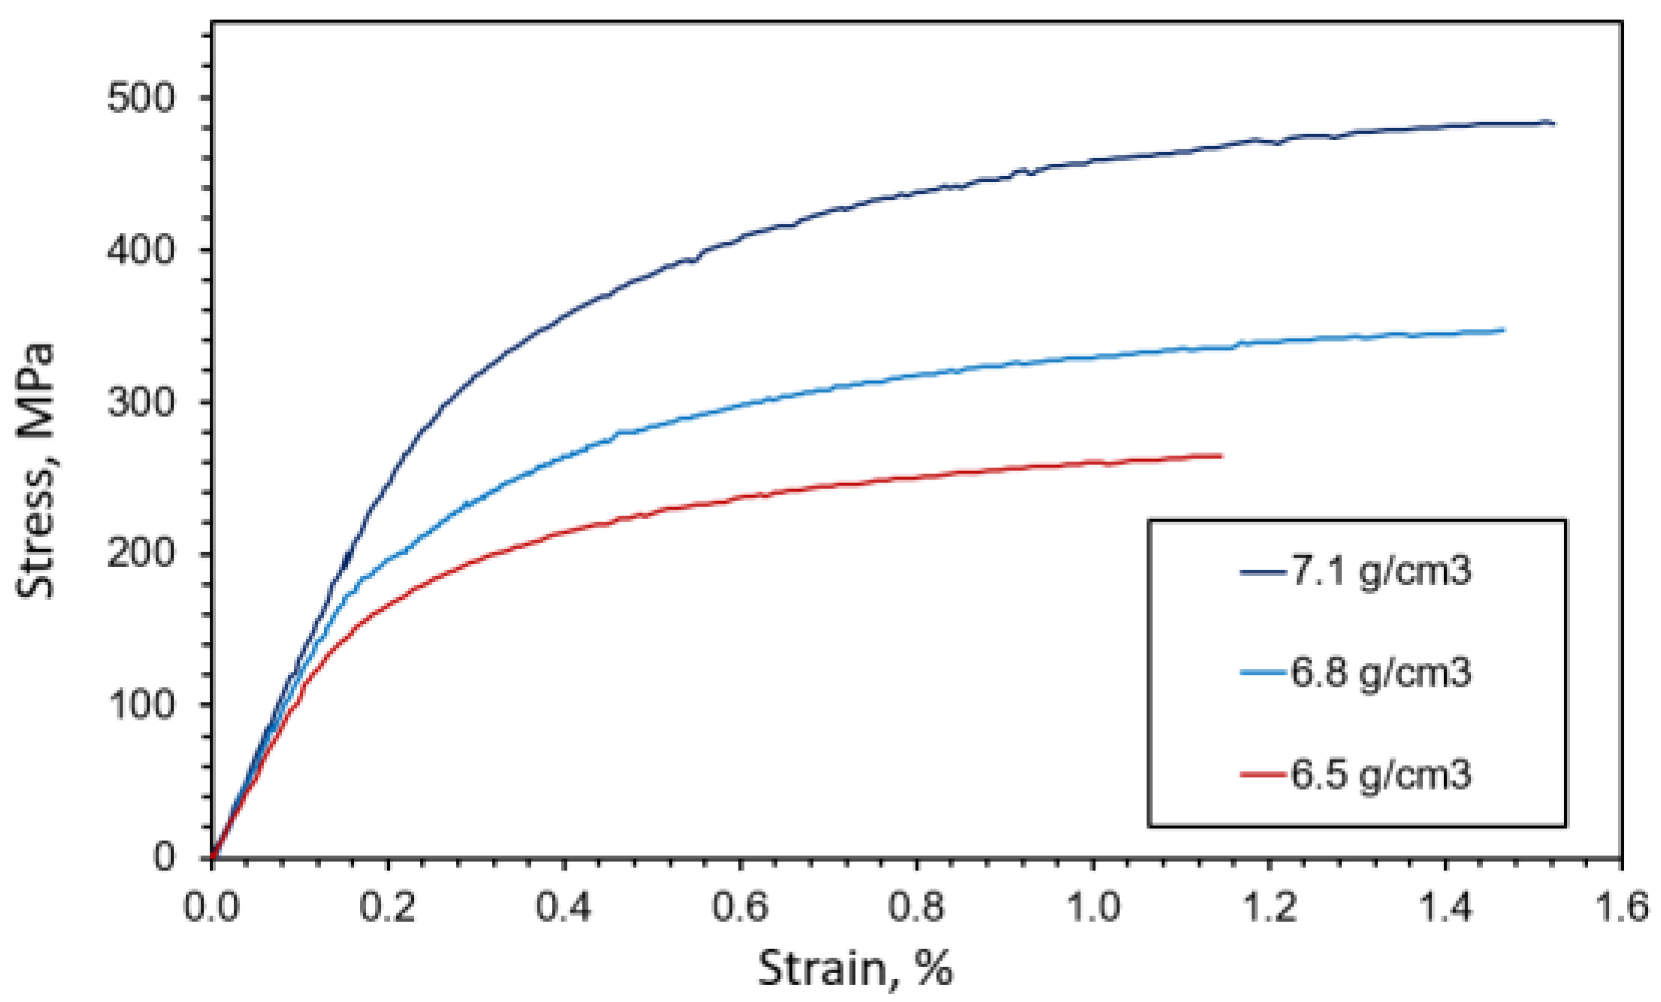
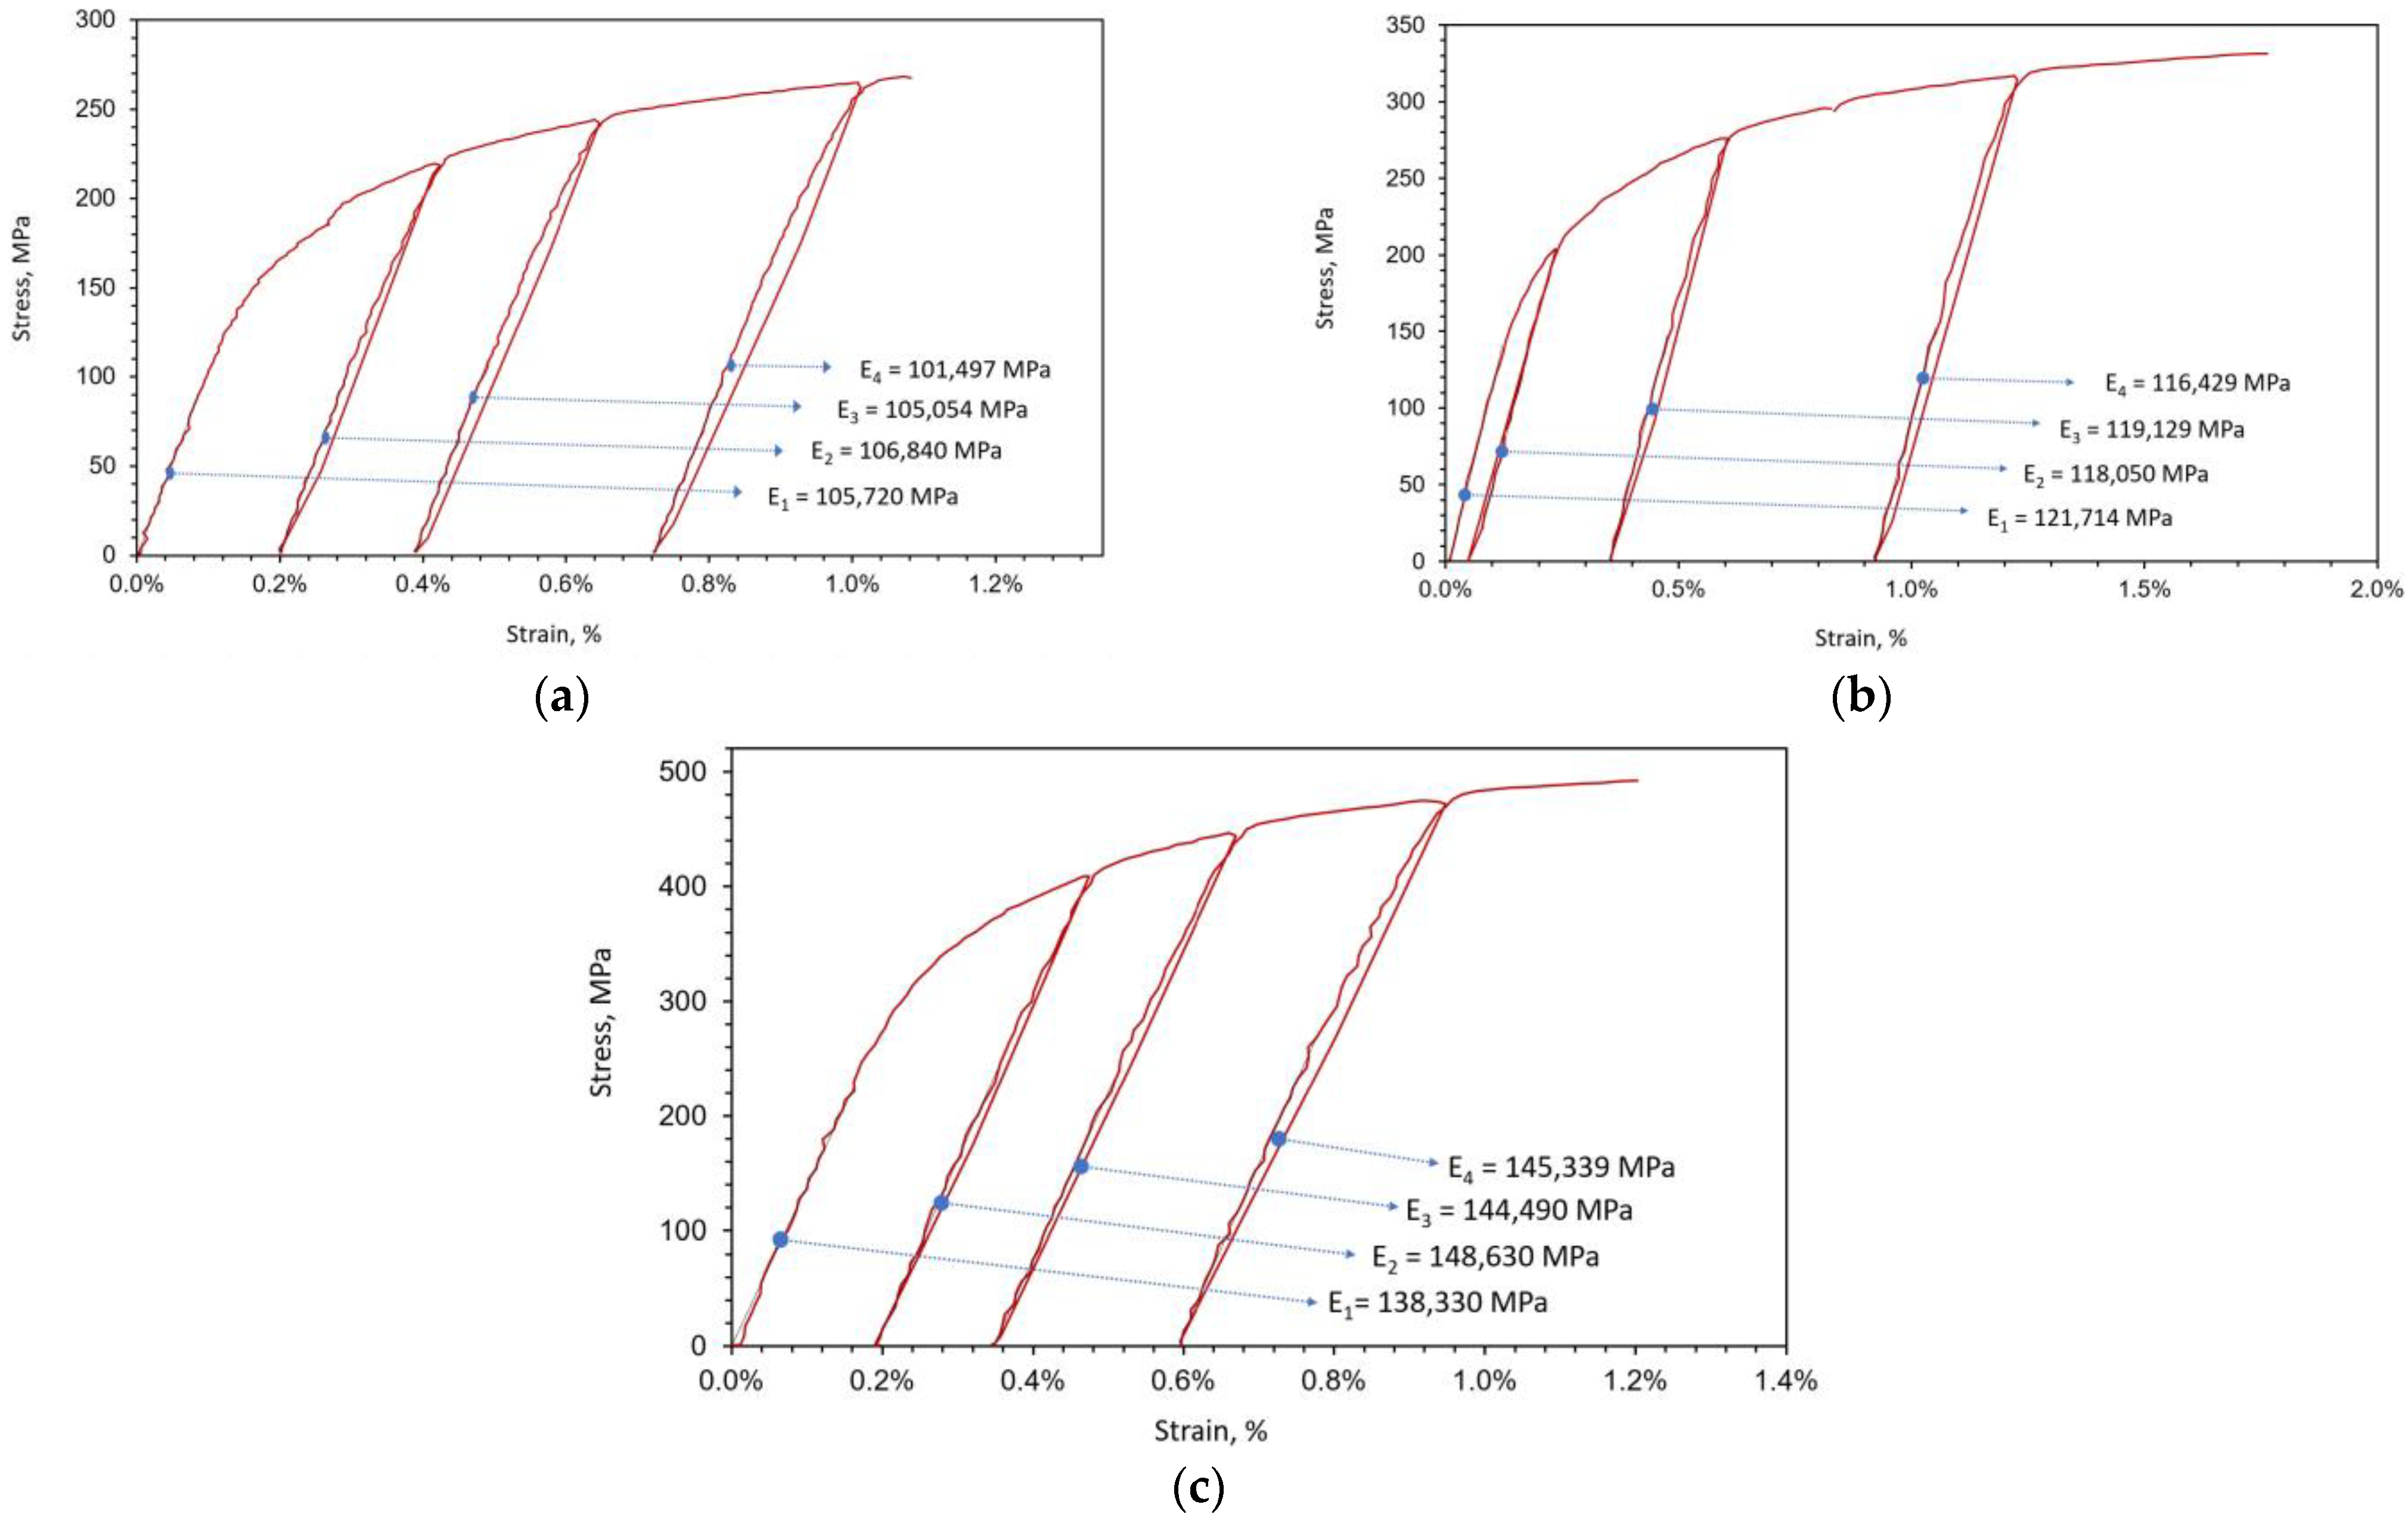
2.1.2. Macroscale
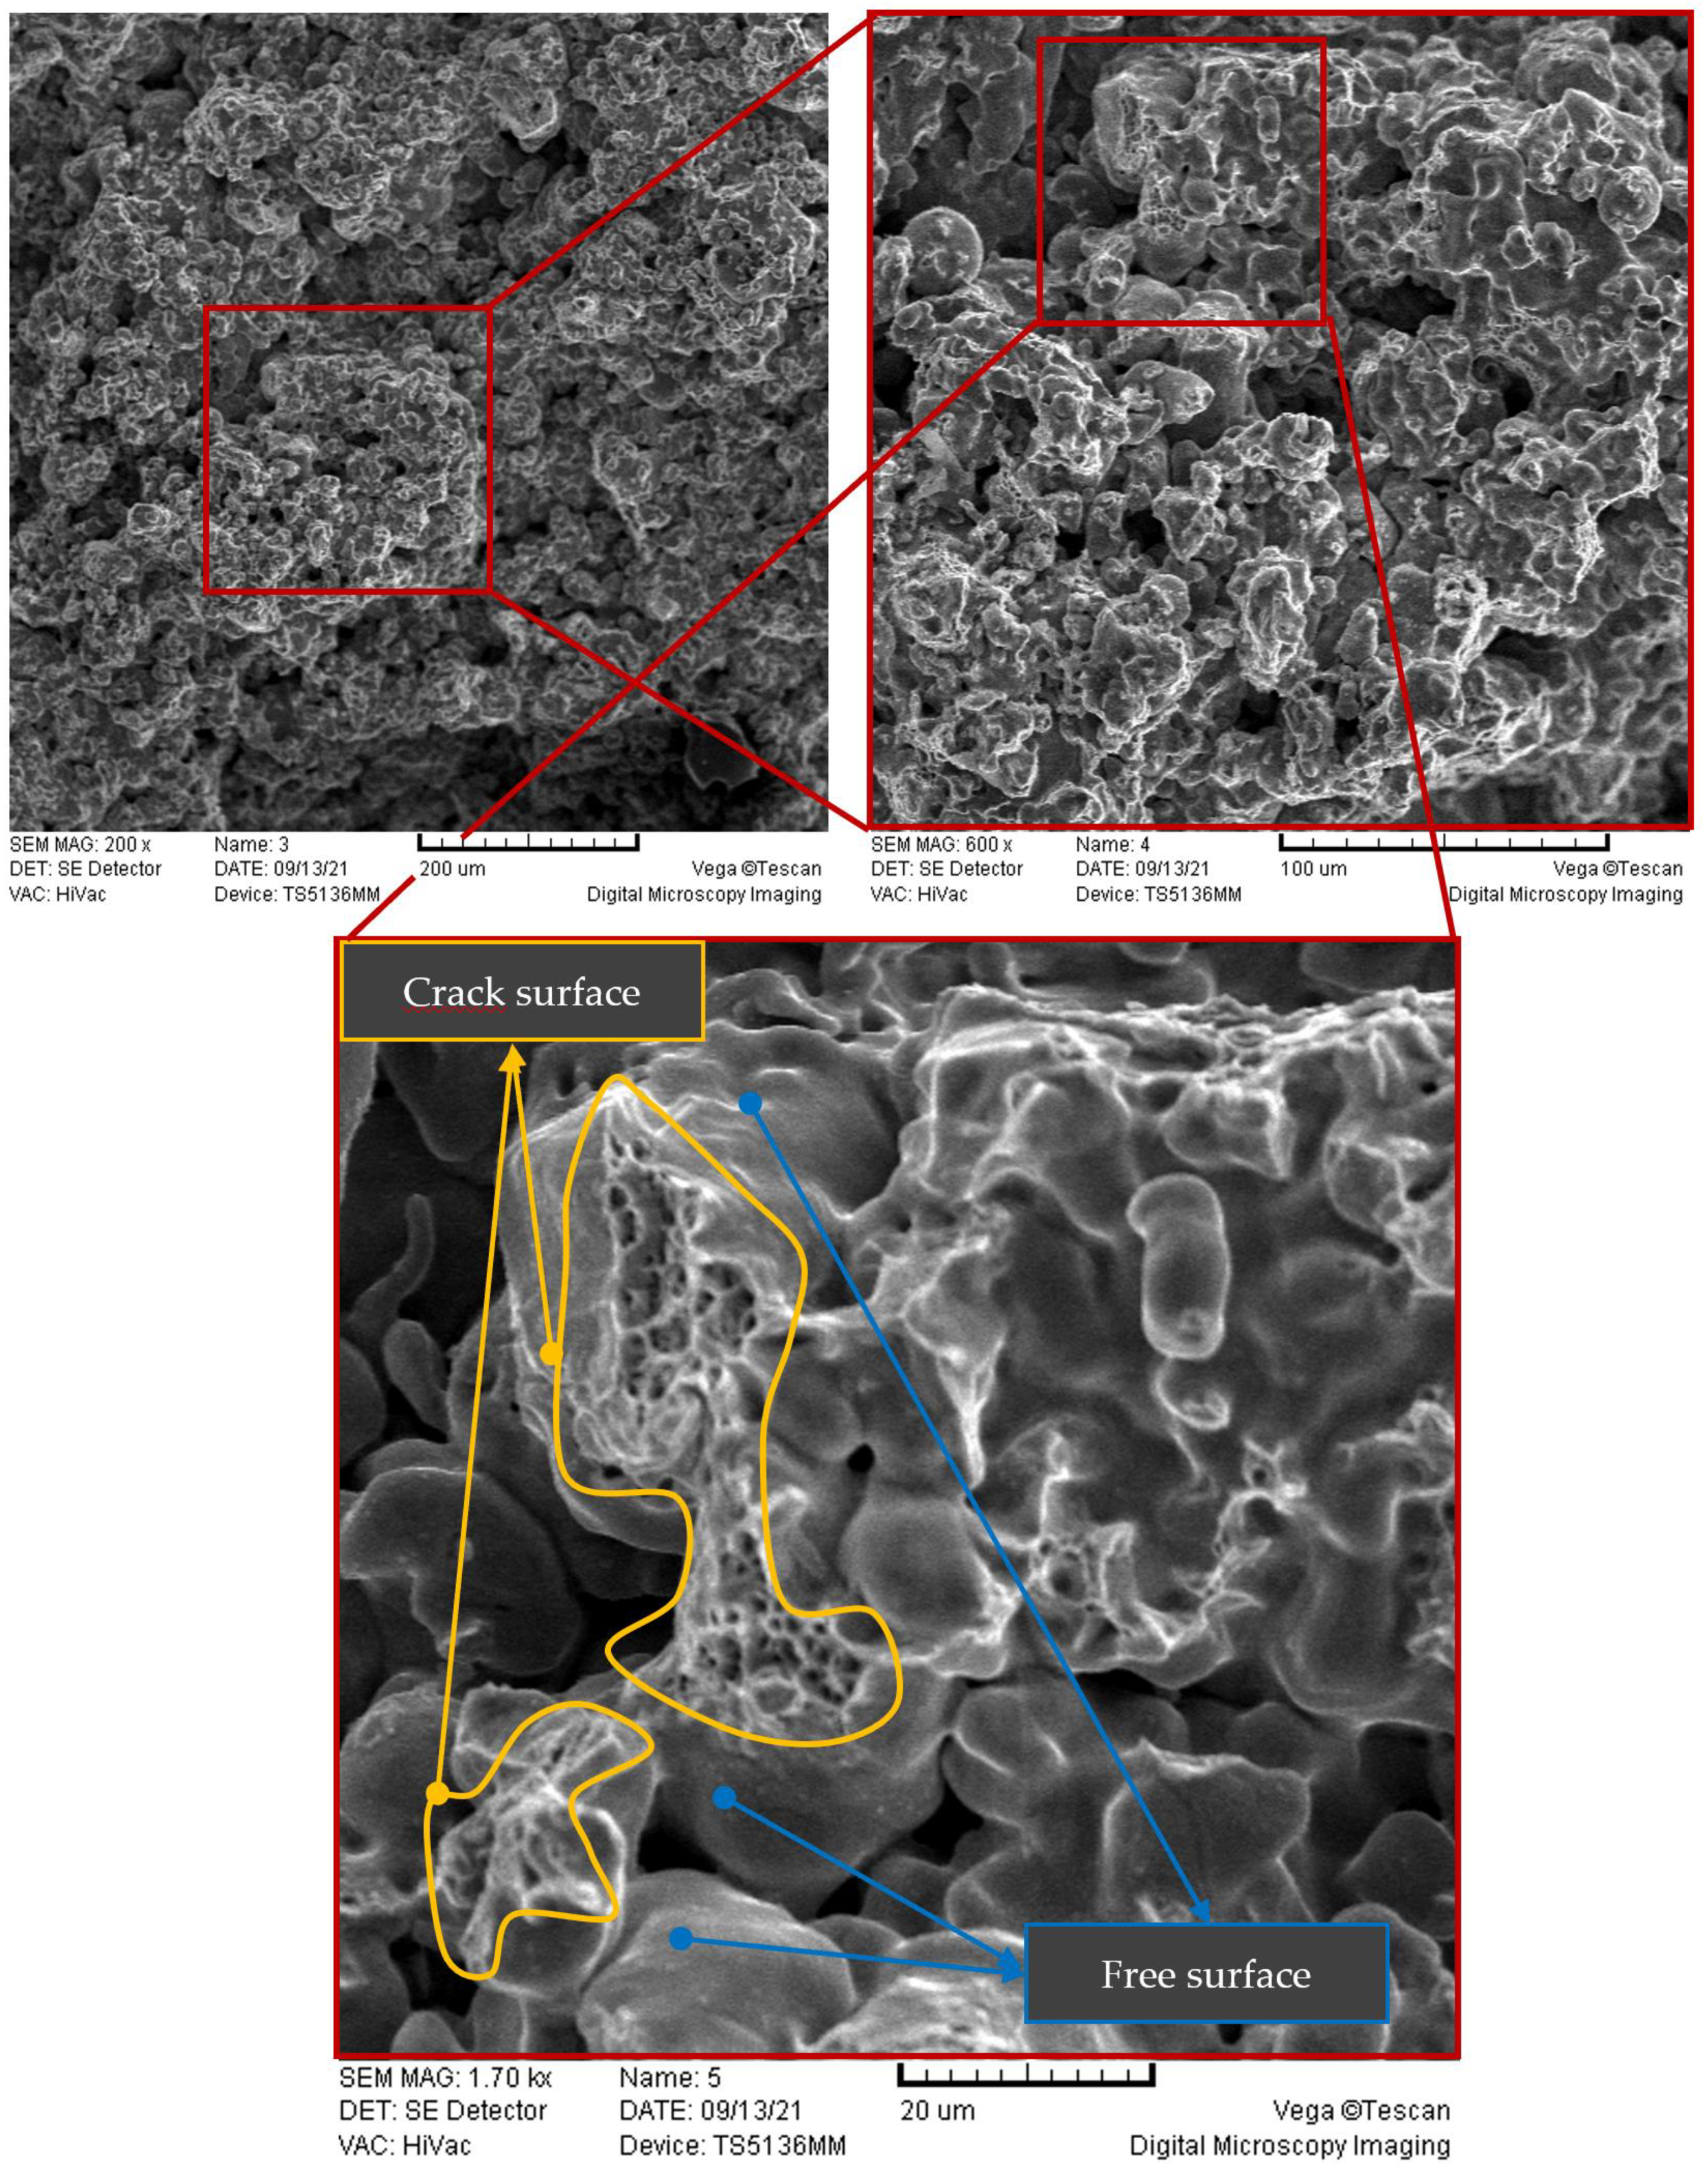
2.1.3. Fractographic Observations
2.2. Numerical Phase-Field Model for Fatigue Fracture
2.2.1. Governing Equations
2.2.2. Numerical Implementation
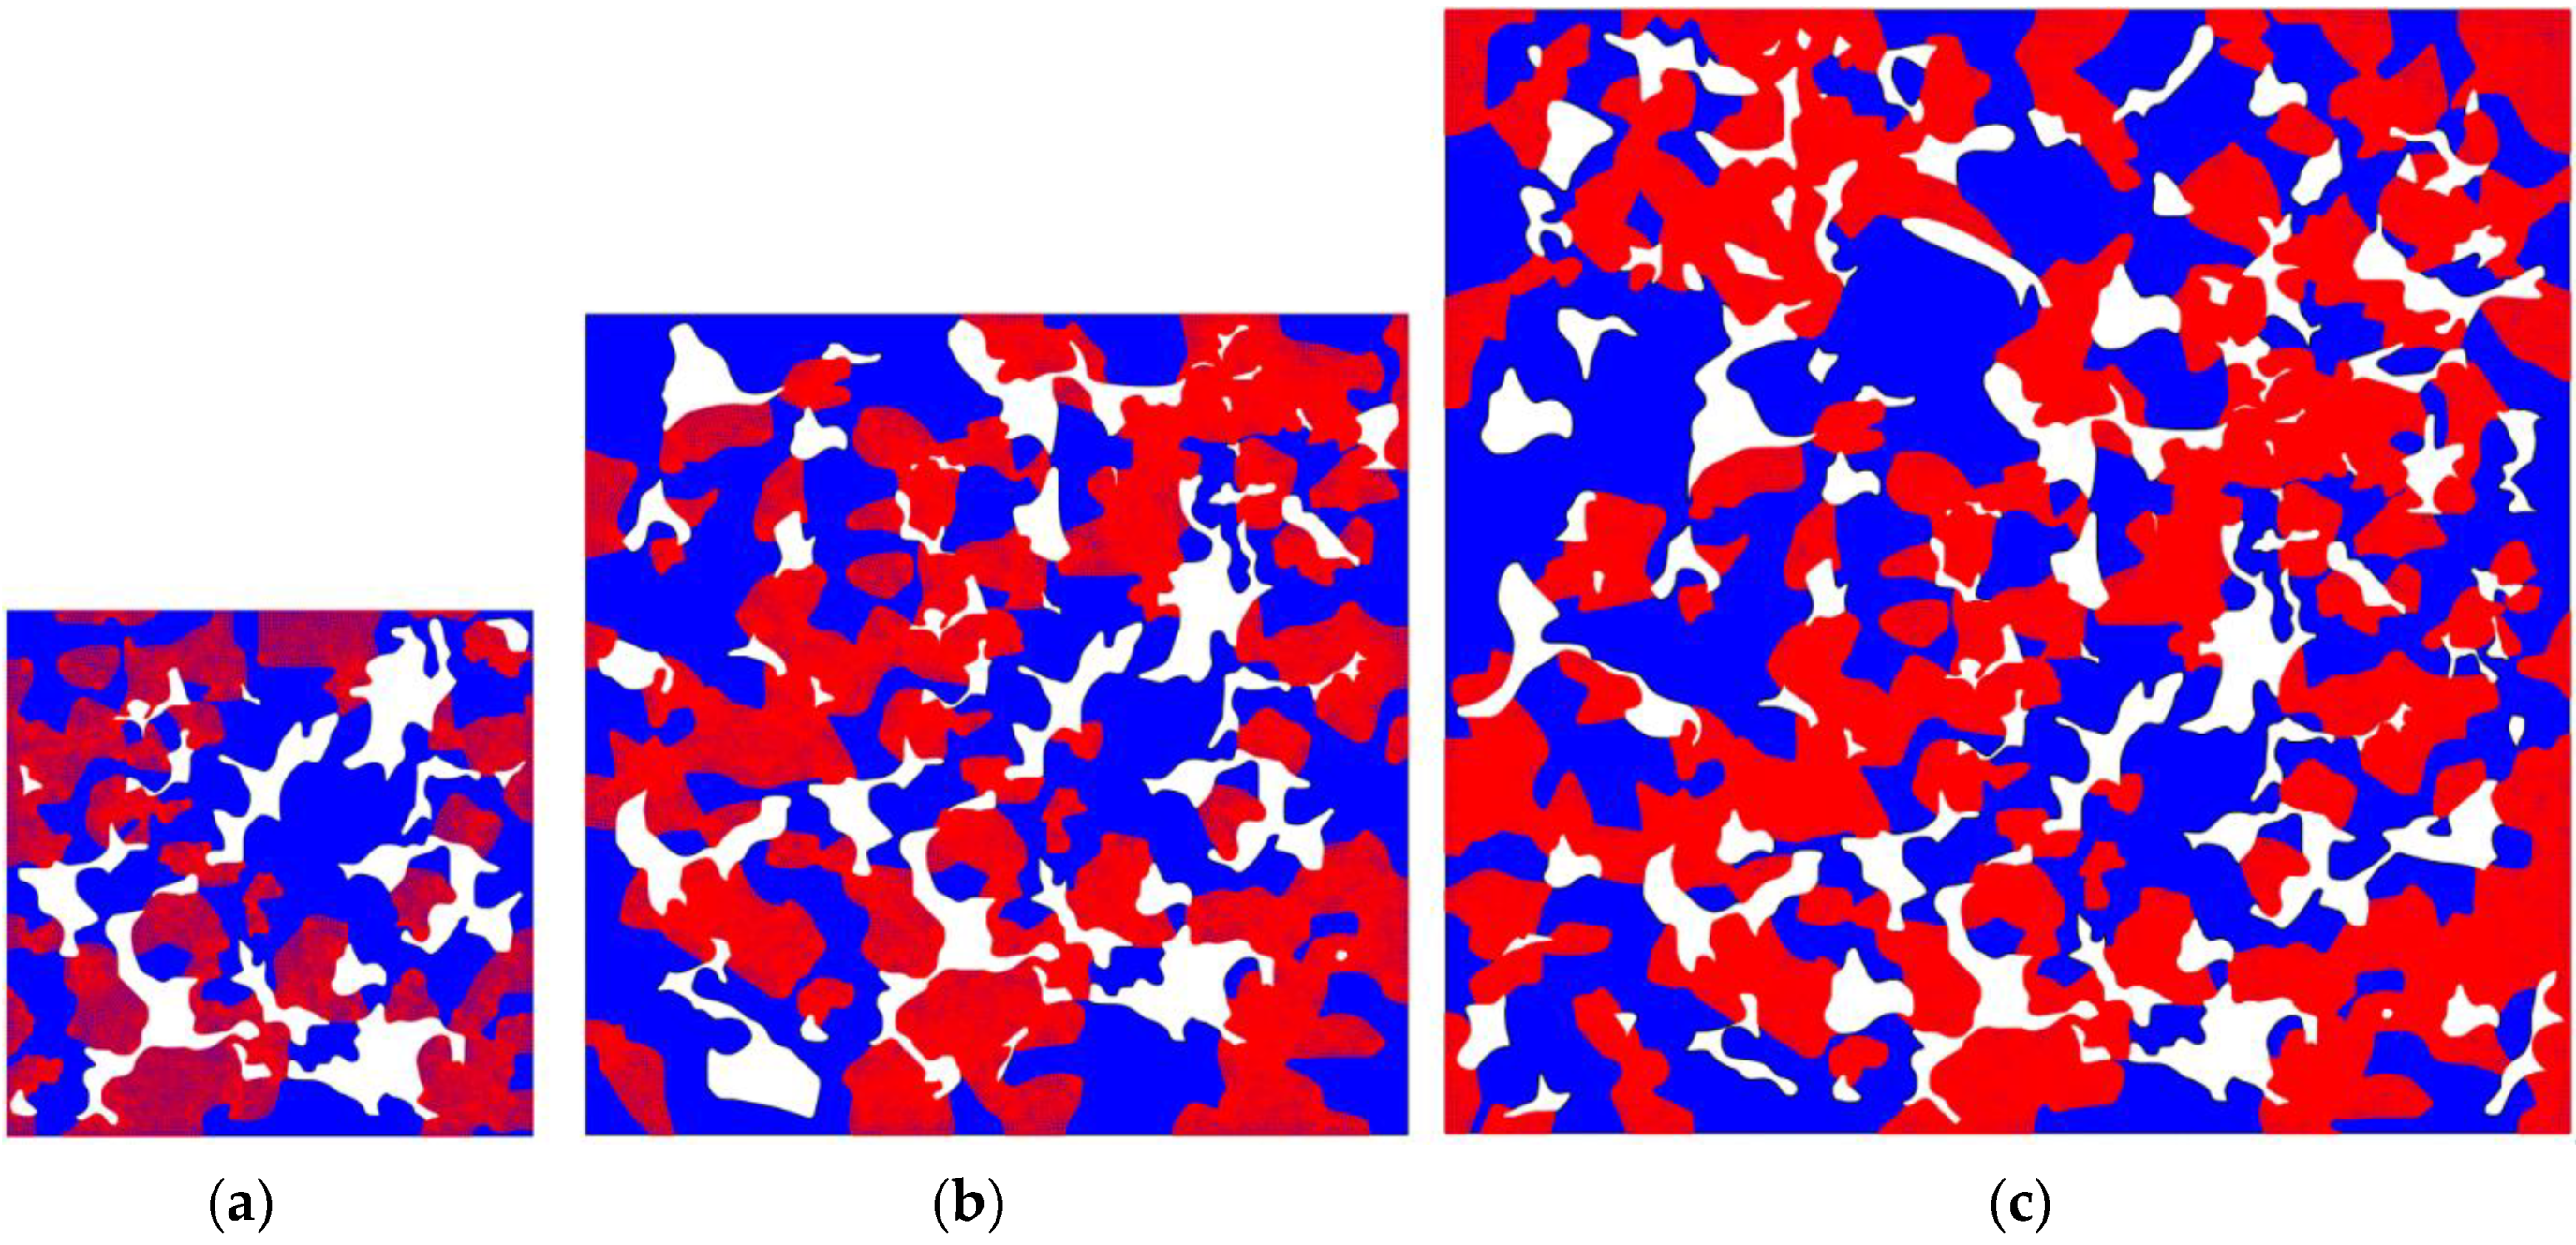
2.3. Numerical Modelling of Microstructure
- The interfaces between individual material phases are not modelled as separate entities or properties. Consequently, the present model is unable to simulate interphase fracture.
- Both material phases are considered to be elastically isotropic, with properties given in Table 3, with bainite regarded as being homogenous.
- The isotropic fracture surface energy defined in Equation (1) is adopted.
- Plastic deformation, which can normally be expected during the microfracture of sintered metals, is neglected.
3. Results and Discussion
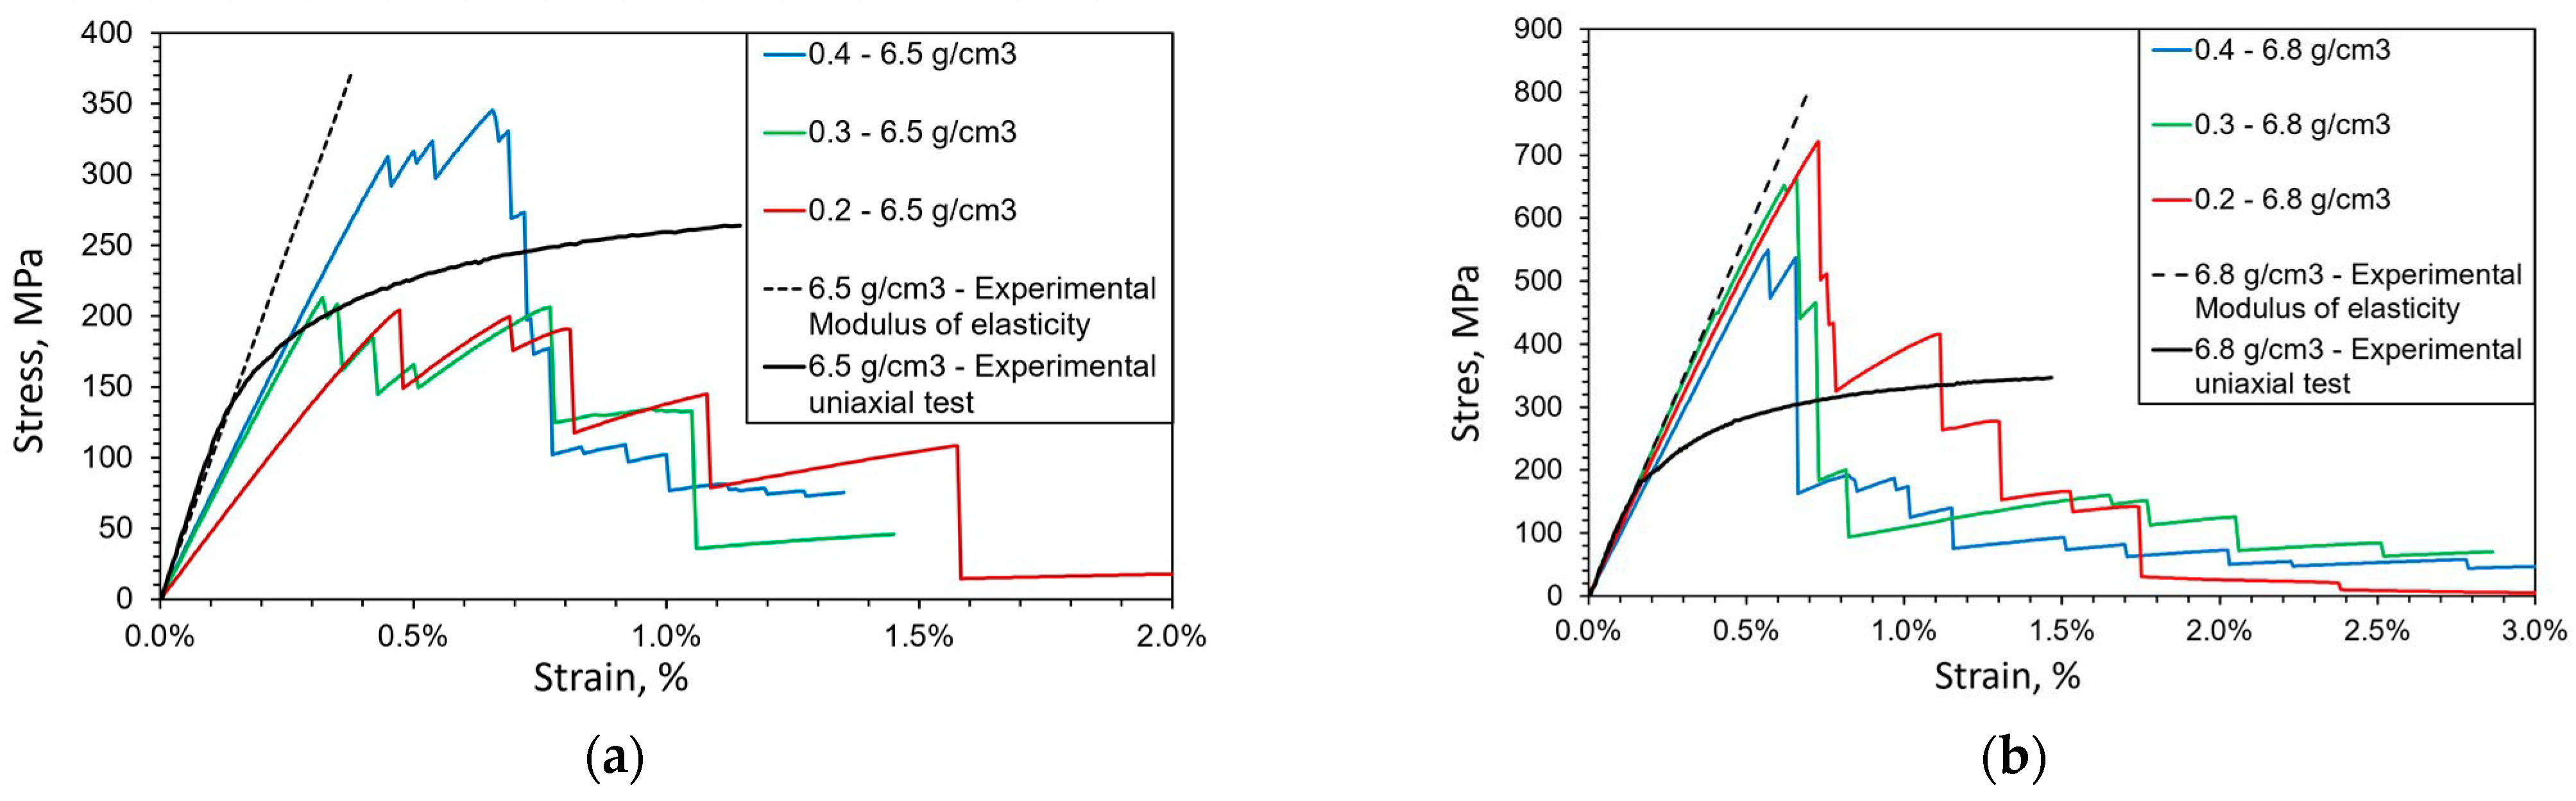
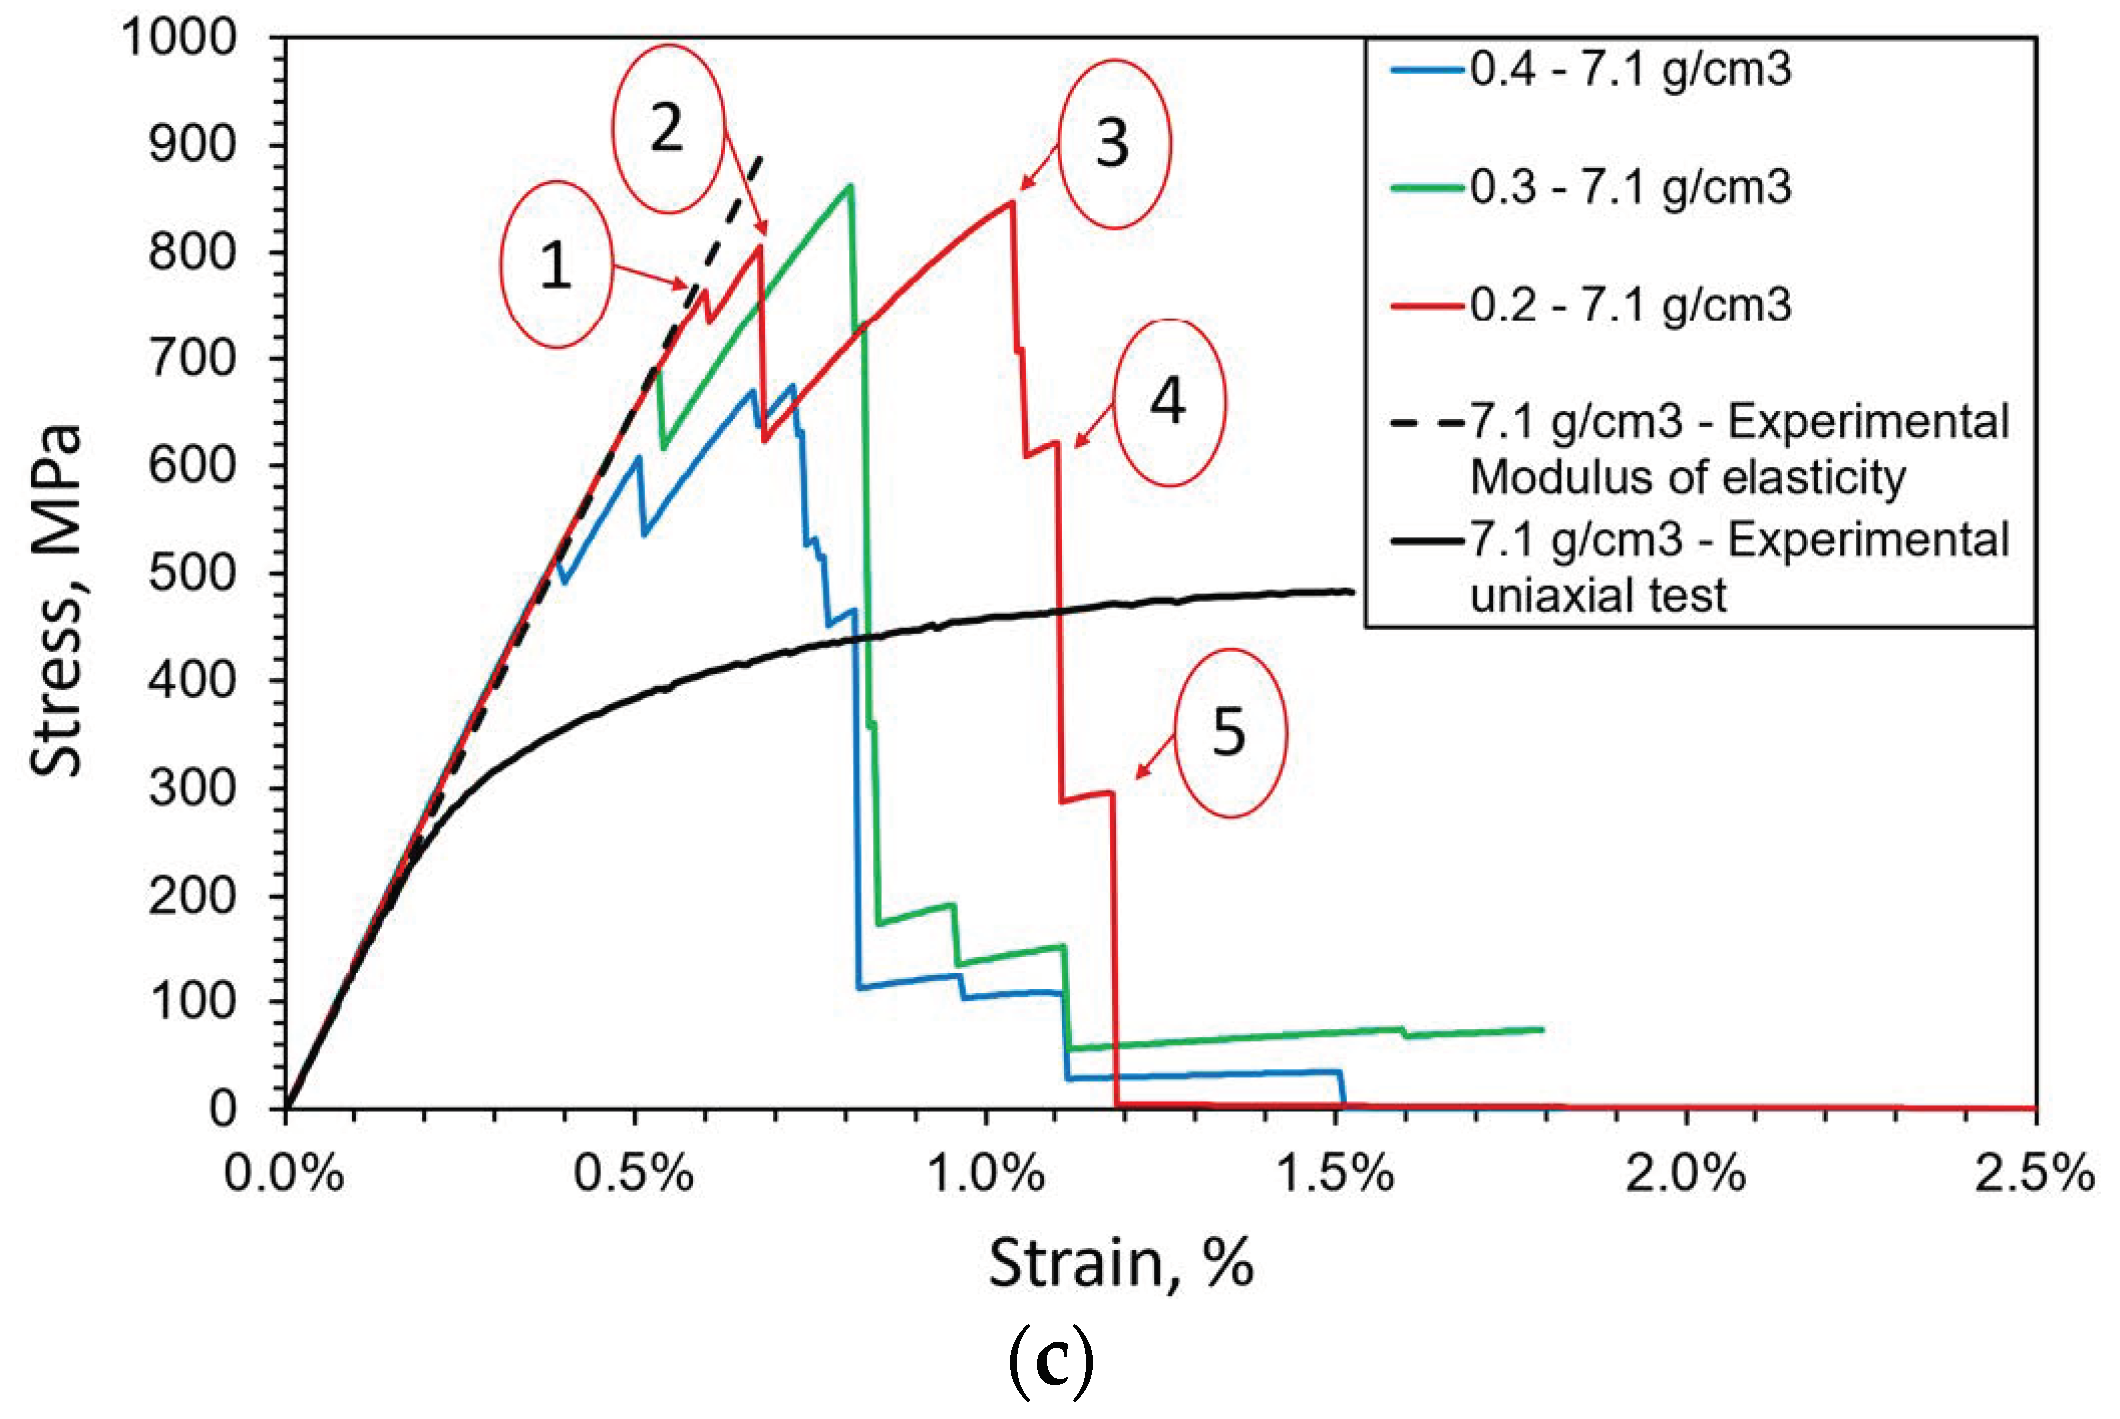
3.1. Quasi-Static Fracture
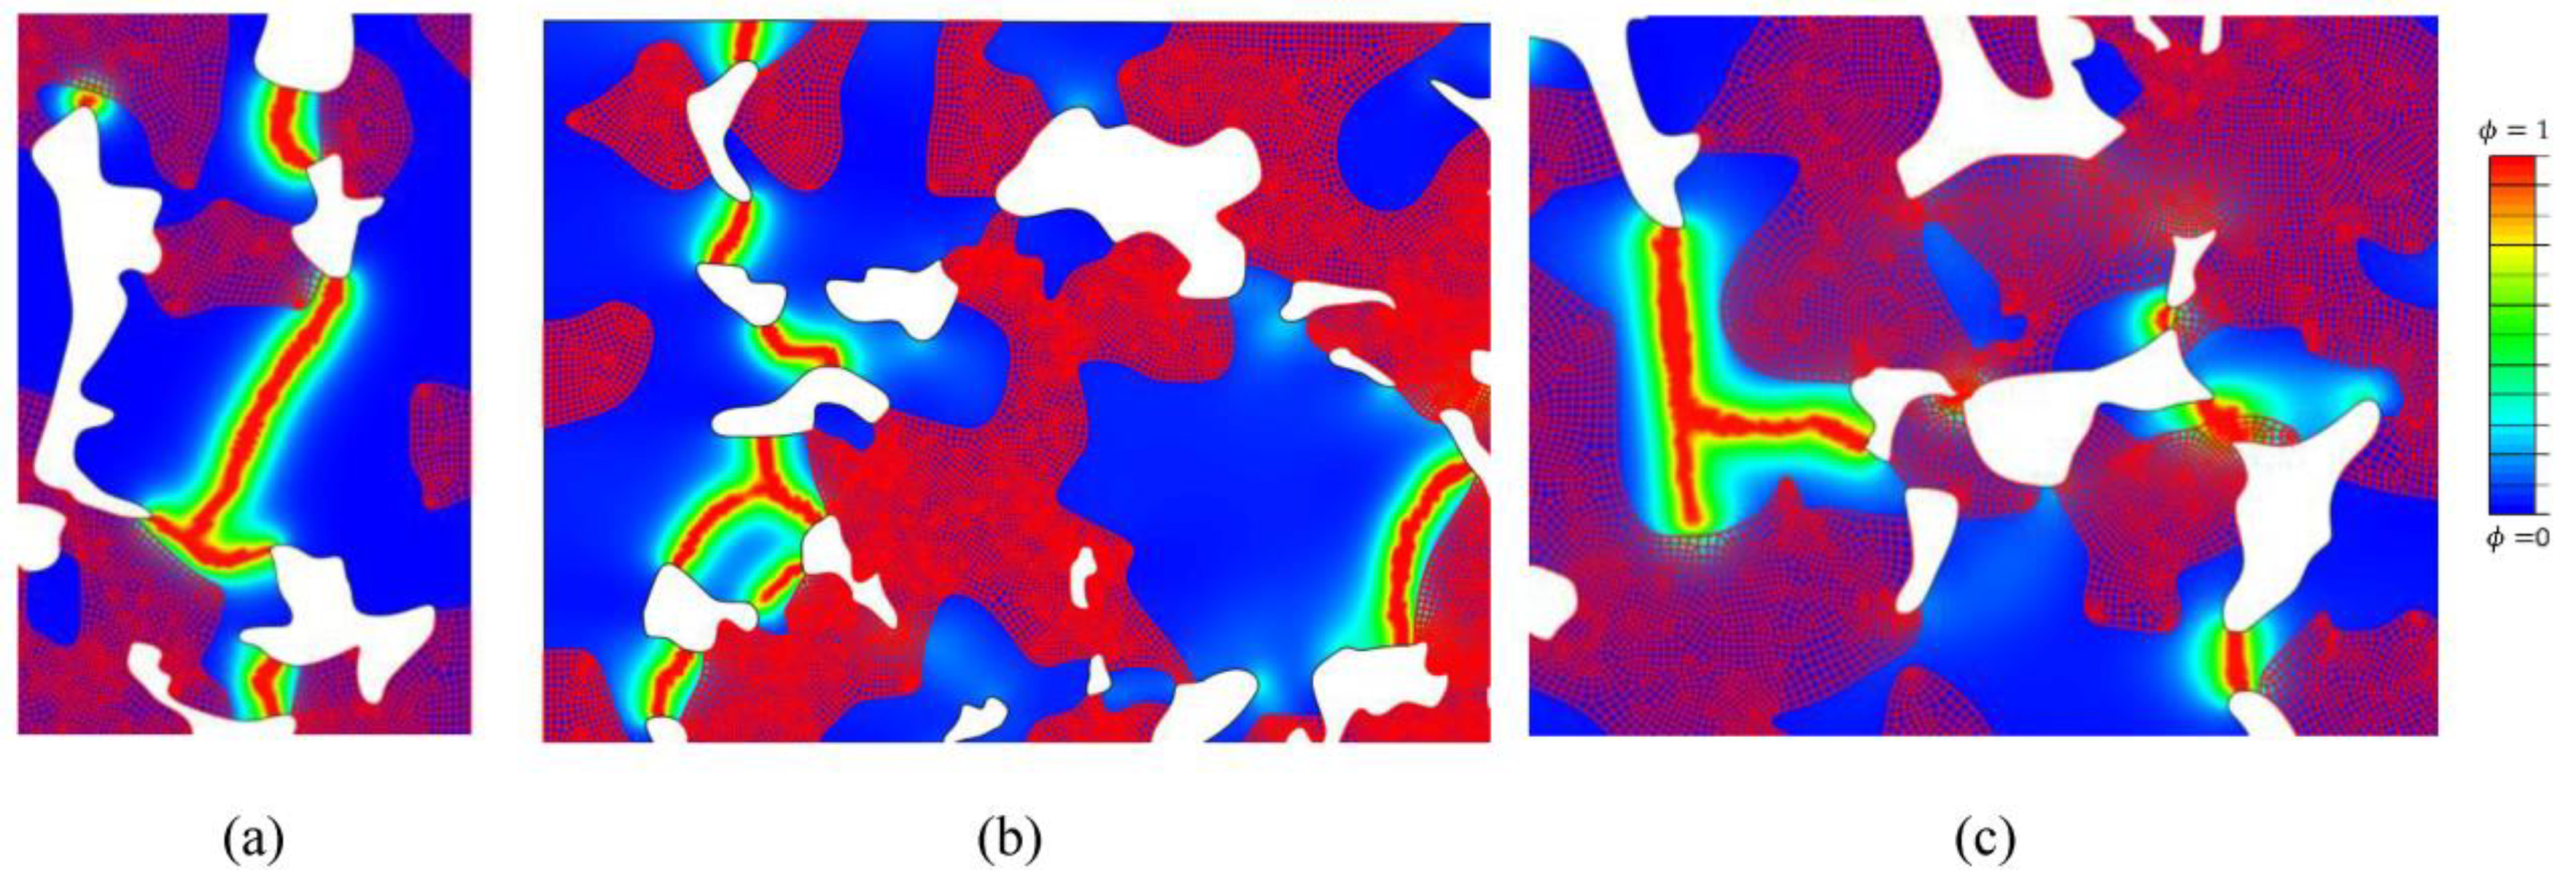
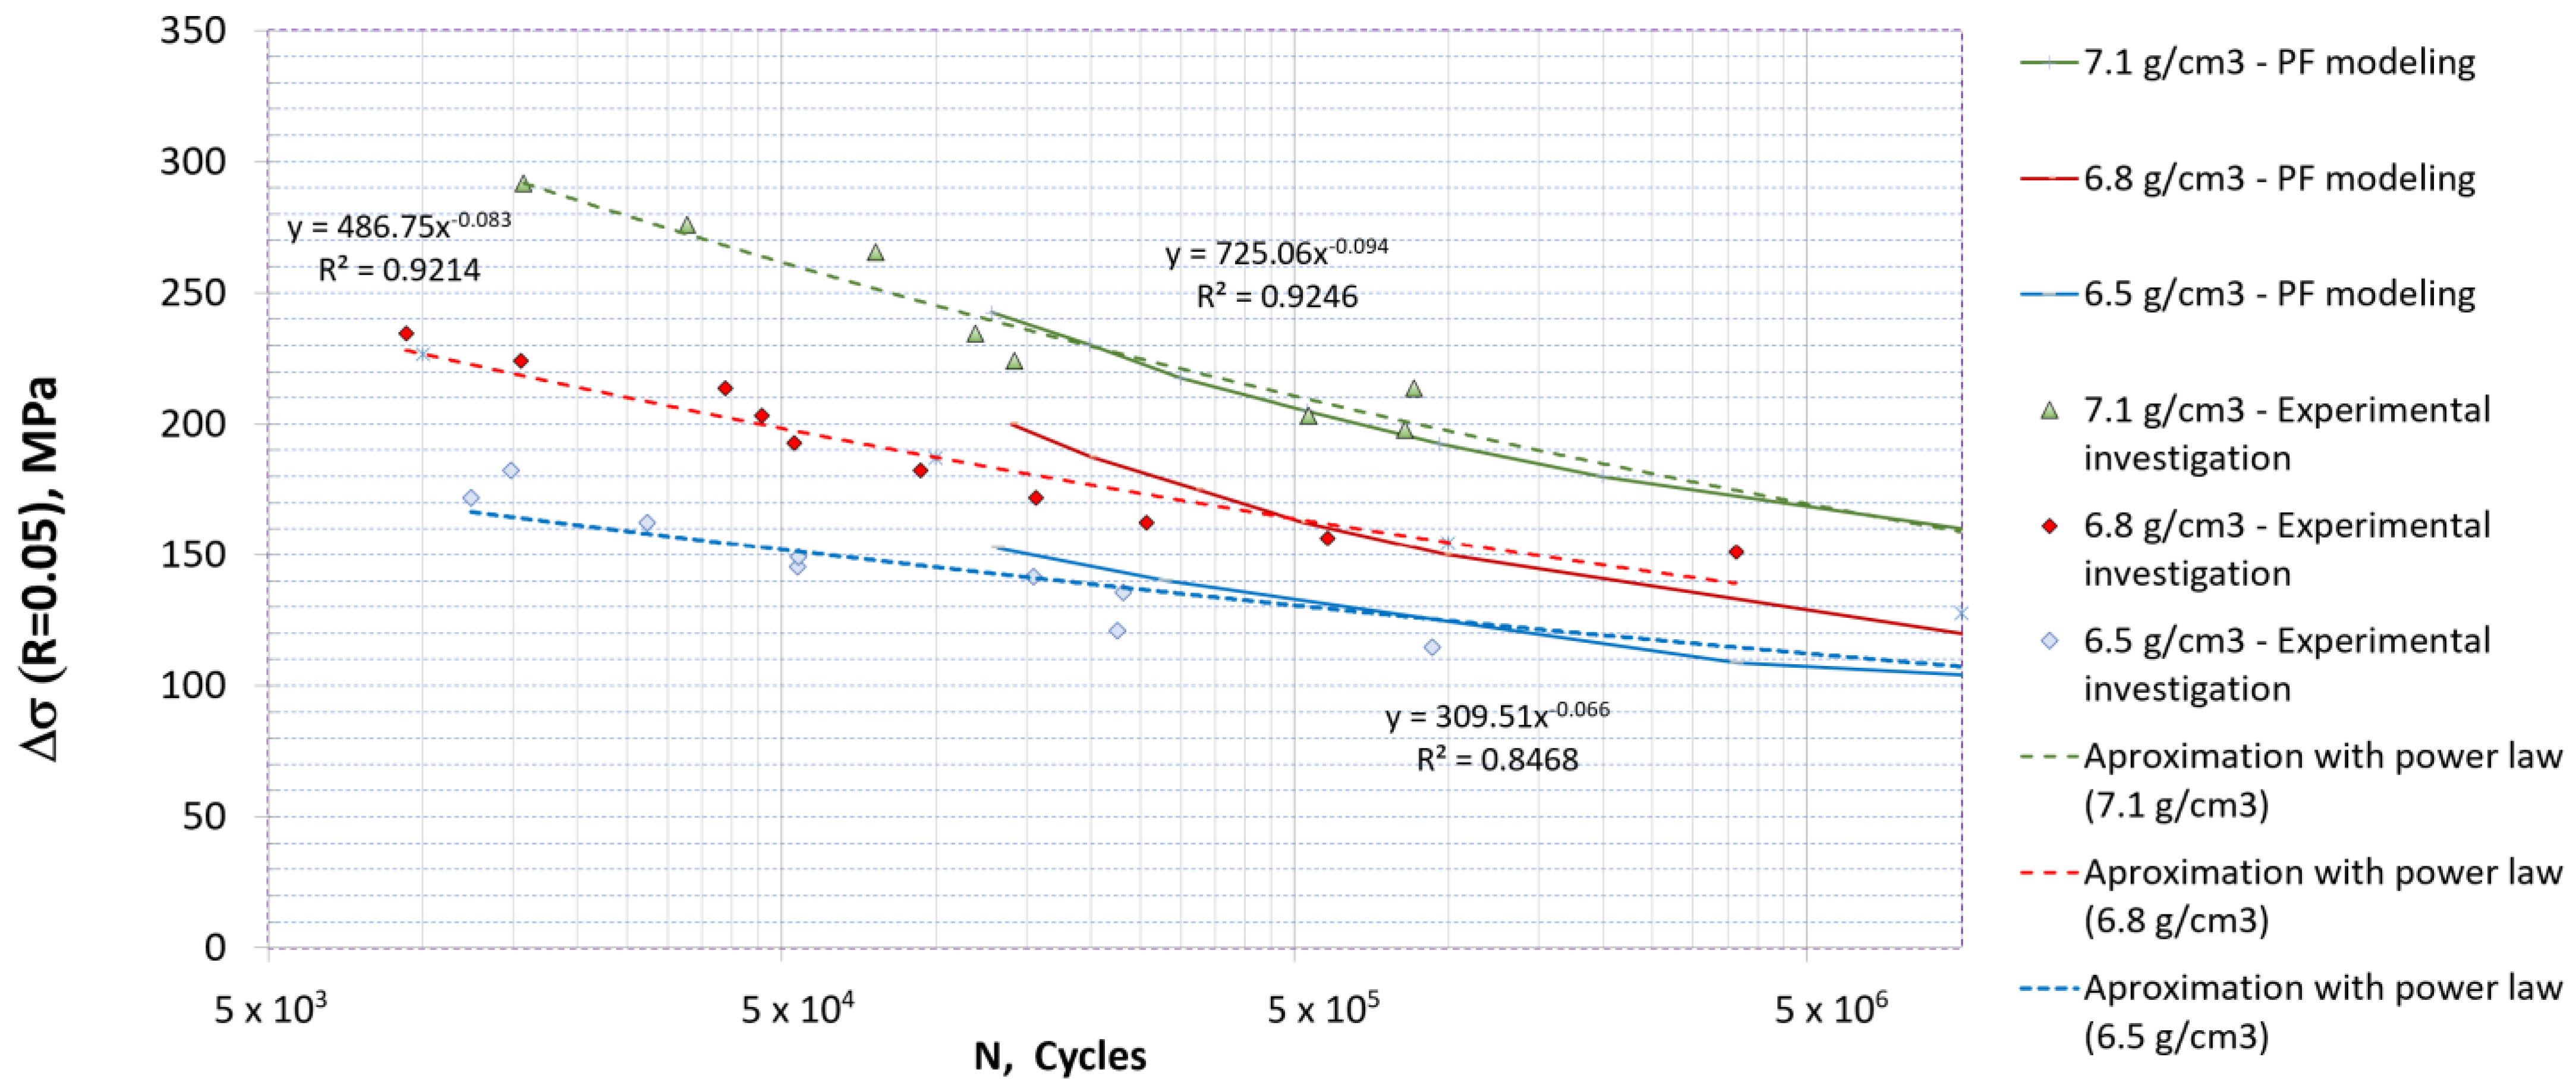
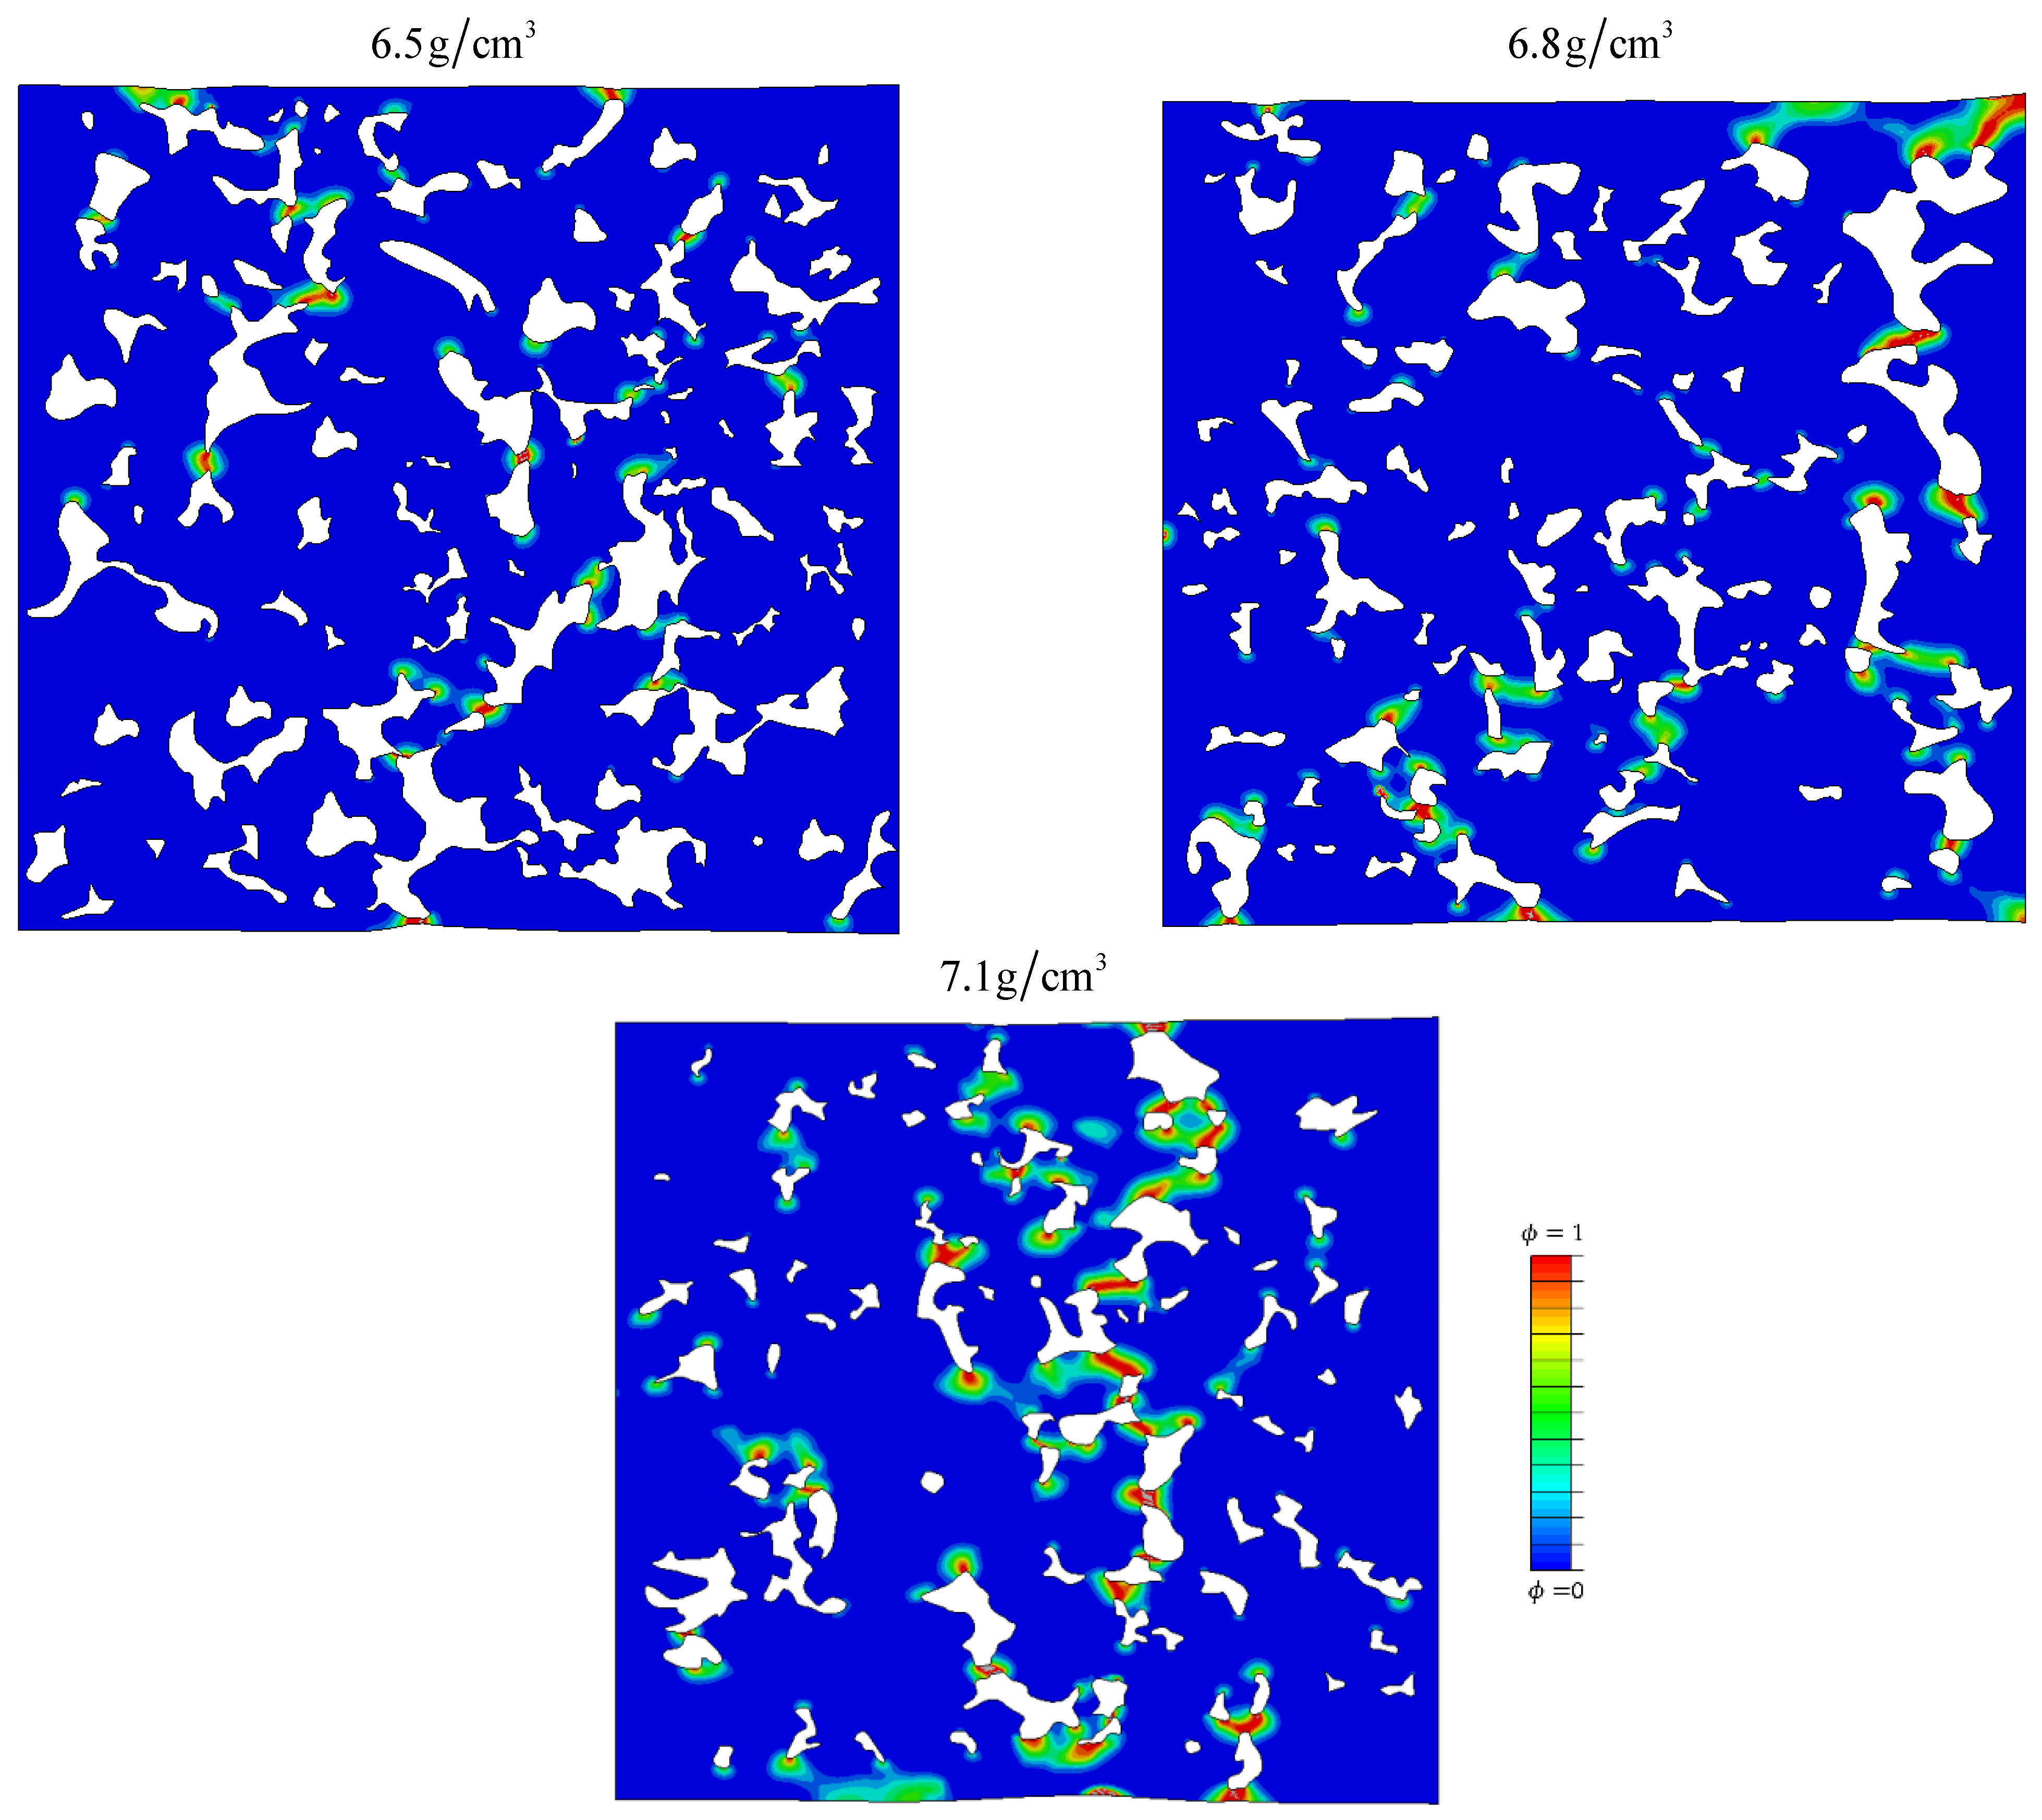
3.2. Cyclic Loading
4. Conclusions
Author Contributions
Funding
Institutional Review Board Statement
Informed Consent Statement
Data Availability Statement
Conflicts of Interest
References
- Danninger, H. What will Be the Future of Powder Metallurgy? Powder Metall. Prog. 2018, 18, 70–79. [Google Scholar] [CrossRef] [Green Version]
- Dudrova, E.; Kabatova, M. Fractography of sintered iron and steels. Powder Metall. Prog. 2008, 8, 59–75. [Google Scholar]
- Dudrova, E.; Kabátova, M. A review of failure of sintered steels: Fractography of static and dynamic crack nucleation, coalescence, growth and propagation. Powder Metall. 2016, 59, 148–167. [Google Scholar] [CrossRef]
- Sukumar, N.; Srolovitz, D.J.; Baker, T.J.; Prévost, J.-H. Brittle fracture in polycrystalline microstructures with the extended finite element method. Int. J. Numer. Methods Eng. 2003, 56, 2015–2037. [Google Scholar] [CrossRef] [Green Version]
- Shibanuma, K.; Suzuki, Y.; Kiriyama, K.; Suzuki, K.; Shirahata, H. A model of cleavage crack propagation in a BCC polycrystalline solid based on the extended finite element method. Acta Mater. 2019, 176, 232–241. [Google Scholar] [CrossRef]
- Prechtel, M.; Ronda, P.L.; Janisch, R.; Hartmaier, A.; Leugering, G.; Steinmann, P.; Stingl, M. Simulation of fracture in heterogeneous elastic materials with cohesive zone models. Int. J. Fract. 2011, 168, 15–29. [Google Scholar] [CrossRef]
- Wei, Y.J.; Anand, L. Grain-boundary sliding and separation in polycrystalline metals: Application to nanocrystalline fcc metals. J. Mech. Phys. Solids. 2004, 52, 2587–2616. [Google Scholar] [CrossRef]
- Mousavi, S.M.T.; Richart, N.; Wolff, C.; Molinari, J.F. Dynamic crack propagation in a heterogeneous ceramic microstructure, insights from a cohesive model. Acta Mater. 2015, 88, 136–146. [Google Scholar] [CrossRef]
- Cervera, M.; Wu, J.-Y. On the conformity of strong, regularized, embedded and smeared discontinuity approaches for the modeling of localized failure in solids. Int. J. Solids Struct. 2015, 71, 19–38. [Google Scholar] [CrossRef]
- Funari, M.F.; Lonetti, P.; Spadea, S. A crack growth strategy based on moving mesh method and fracture mechanics. Theor. Appl. Fract. Mech. 2019, 102, 103–115. [Google Scholar] [CrossRef]
- Nguyen, T.T.; Yvonnet, J.; Zhu, Q.Z.; Bornert, M.; Chateau, C. A phase field method to simulate crack nucleation and propagation in strongly heterogeneous materials from direct imaging of their microstructure. Eng. Fract. Mech. 2015, 139, 18–39. [Google Scholar] [CrossRef]
- Miehe, C.; Hofacker, M.; Welschinger, F. A phase field model for rate-independent crack propagation: Robust algorithmic implementation based on operator splits. Comput. Methods Appl. Mech. Eng. 2010, 199, 2765–2778. [Google Scholar] [CrossRef]
- Nguyen, T.T.; Yvonnet, J.; Bornert, M.; Chateau, C. Initiation and propagation of complex 3D networks of cracks in heterogeneous quasi-brittle materials: Direct comparison between in situ testing-microCT experiments and phase field simulations. J. Mech. Phys. Solids 2016, 95, 320–350. [Google Scholar] [CrossRef]
- Seleš, K.; Jurčević, A.; Tonković, Z.; Sorić, J. Crack propagation prediction in heterogeneous microstructure using an efficient phase-field algorithm. Theor. Appl. Fract. Mech. 2019, 100, 289–297. [Google Scholar] [CrossRef]
- Abdollahi, A.; Arias, I. Numerical simulation of intergranular and transgranular crack propagation in ferroelectric polycrystals. Int. J. Fract. 2012, 174, 3–15. [Google Scholar] [CrossRef]
- Emdadi, A.; Zaeem, M.A. Phase-field modeling of crack propagation in polycrystalline materials. Comput. Mater. Sci. 2021, 186, 110057. [Google Scholar] [CrossRef]
- Oshima, K.; Takaki, T.; Muramatsu, M. Development of multi-phase-field crack model for crack propagation in polycrystal. Int. J. Comput. Mater. Sci. Eng. 2014, 3, 1450009. [Google Scholar] [CrossRef]
- Schneider, D.; Schoof, E.; Huang, Y.; Selzer, M.; Nestler, B. Phase-field modeling of crack propagation in multiphase systems. Comput. Methods Appl. Mech. Eng. 2016, 312, 186–195. [Google Scholar] [CrossRef]
- Clayton, J.D.; Knap, J. Phase field modeling of directional fracture in anisotropic polycrystals. Comput. Mater. Sci. 2015, 98, 158–169. [Google Scholar] [CrossRef]
- Clayton, J.D. Modeling Deformation and Fracture of Boron-Based Ceramics with Nonuniform Grain and Phase Boundaries and Thermal-Residual Stress. Solids 2022, 3, 643–664. [Google Scholar] [CrossRef]
- Nguyen, T.-T.; Réthoré, J.; Yvonnet, J.; Baietto, M.-C. Multi-phase-field modeling of anisotropic crack propagation for polycrystalline materials. Comput. Mech. 2017, 60, 289–314. [Google Scholar] [CrossRef] [Green Version]
- Nguyen, T.T.; Yvonnet, J.; Zhu, Q.-Z.; Bornert, M.; Chateau, C. A phase-field method for computational modeling of interfacial damage interacting with crack propagation in realistic microstructures obtained by microtomography. Comput. Methods Appl. Mech. Eng. 2016, 312, 567–595. [Google Scholar] [CrossRef] [Green Version]
- Li, G.; Yin, B.B.; Zhang, L.W.; Liew, K.M. Modeling microfracture evolution in heterogeneous composites: A coupled cohesive phase-field model. J. Mech. Phys. Solids 2020, 142, 103968. [Google Scholar] [CrossRef]
- Seleš, K.; Tomić, Z.; Tonković, Z. Microcrack propagation under monotonic and cyclic loading conditions using generalised phase-field formulation. Eng. Fract. Mech. 2021, 255, 107973. [Google Scholar] [CrossRef]
- Seleš, K.; Aldakheel, F.; Tonković, Z.; Sorić, J.; Wriggers, P. A general phase-field model for fatigue failure in brittle and ductile solids. Comput. Mech. 2021, 67, 1431–1452. [Google Scholar] [CrossRef]
- Oliver, W.C.; Pharr, G.M. An improved technique for determining hardness and elastic modulus using load and displacement sensing indentation experiments. J. Mater. Res. 1992, 7, 1564–1583. [Google Scholar] [CrossRef]
- Giannakopoulos, A.E.; Suresh, S. Determiantion of elastoplastic properties by instrumented sharp indentation. Scr. Mater. 1999, 40, 1191–1198. [Google Scholar] [CrossRef] [Green Version]
- Lu, L.; Dao, M.; Kumar, P.; Ramamurty, U.; Karniadakis, G.E.; Suresh, S. Extraction of mechanical properties of materials through deep learning from instrumented indentation. Proc. Natl. Acad. Sci. USA 2020, 117, 7052–7062. [Google Scholar] [CrossRef] [Green Version]
- Donohue, B.R.; Ambrus, A.; Kalidindi, S.R. Critical evaluation of the indentation data analyses methods for the extraction of isotropic uniaxial mechanical properties using finite element models. Acta Mater. 2012, 60, 3943–3952. [Google Scholar] [CrossRef]
- Cheng, G.; Choi, K.S.; Hu, X.; Sun, X. Determining individual phase properties in a multi-phase Q&P steel using multi-scale indentation tests. Mater. Sci. Eng. A 2016, 652, 384–395. [Google Scholar] [CrossRef] [Green Version]
- Höganäs, A.B. Iron-Based Materials, Design and Mechanical Properties—Höganäs Handbook for Sintered Components; Höganäs: Halmstad, Sweden, 2015; pp. 45–90. [Google Scholar]
- ASTM E8; Standard Testing Methods for Tension Testing of Metallic Materials. ASTM: West Conshohocken, PA, USA, 2016.
- Tomić, Z.; Gubeljak, N.; Jarak, T.; Polančec, T.; Tonković, Z. Micro—And macromechanical properties of sintered steel with different porosity. Scr. Mater. 2022, 217, 114787. [Google Scholar] [CrossRef]
- Anstis, G.R.; Chantikul, P.; Lawn, B.R.; Marshall, D.B. A Critical Evaluation of Indentation Techniques for Measuring Fracture Toughness: I, Direct Crack Measurements. J. Am. Ceram. Soc. 1981, 64, 533–538. [Google Scholar] [CrossRef]
- TFabijanić, A.; Ćorić, D.; Musa, M.Š.; Sakoman, M. Vickers indentation fracture toughness of near-nano and nanostructured WC-Co cemented carbides. Metals 2017, 7, 143. [Google Scholar] [CrossRef] [Green Version]
- Jeon, S.-W.; Lee, K.-W.; Kim, J.Y.; Kim, W.J.; Park, C.-P.; Kwon, D. Estimation of Fracture Toughness of Metallic Materials Using Instrumented Indentation: Critical Indentation Stress and Strain Model. Exp. Mech. 2016, 57, 1013–1025. [Google Scholar] [CrossRef]
- Doroszko, M.; Seweryn, A. Modeling of the tension and compression behavior of sintered 316L using micro computed tomography. Acta Mech. Autom. 2015, 9, 70–74. [Google Scholar] [CrossRef] [Green Version]
- Carrara, P.; Ambati, M.; Alessi, R.; De Lorenzis, L. A framework to model the fatigue behavior of brittle materials based on a variational phase-field approach. Comput. Methods Appl. Mech. Eng. 2020, 361, 112731. [Google Scholar] [CrossRef]
- Miehe, C.; Schanzel, L.M.; Ulmer, H. Phase field modeling of fracture in multi-physics problems. Part I. Balance of crack surface and failure criteria for brittle crack propagation in thermo-elastic solids. Comput. Methods Appl. Mech. Eng. 2015, 294, 449–485. [Google Scholar] [CrossRef]
- Miehe, C.; Hofacker, M.; Schanzel, L.M.; Aldakheel, F. Phase field modeling of fracture in multi-physics problems. Part II. Coupled brittle-to-ductile failure criteria and crack propagation in thermo-elastic-plastic solids. Comput. Methods Appl. Mech. Eng. 2015, 294, 486–522. [Google Scholar] [CrossRef]
- Wu, J.-Y.; Nguyen, V.P.; Nguyen, C.T.; Sutula, D.; Sinaie, S.; Bordas, S.P.A. Chapter One—Phase-field modeling of fracture. Adv. Appl. Mech. 2020, 53, 1–183. [Google Scholar] [CrossRef]
- Miehe, C.; Welschinger, F.; Hofacker, M. Thermodynamically consistent phase-field models of fracture: Variational principles and multi-field FE implementations. Int. J. Numer. Methods Eng. 2010, 83, 1273–1311. [Google Scholar] [CrossRef]
- Seleš, K.; Lesičar, T.; Tonković, Z.; Sorić, J. A residual control staggered solution scheme for the phase-field modeling of brittle fracture. Eng. Fract. Mech. 2018, 205, 370–386. [Google Scholar] [CrossRef]
- Cojocaru, D.; Karlsson, A. A simple numerical method of cycle jumps for cyclically loaded structures. Int. J. Fatigue 2006, 28, 1677–1689. [Google Scholar] [CrossRef] [Green Version]
- Abaqus 6.14-1, Abaqus/CAE User’s Guide; Dassault Systems Simulia Corp.: Providence, RI, USA, 2014.
- Falkowska, A.; Seweryn, A. Fatigue life of 316L steel sinters of varying porosity under conditions of uniaxial periodically variable loading at a fixed stress amplitude. Int. J. Fatigue 2018, 117, 496–510. [Google Scholar] [CrossRef]


| Sintered Density, g/cm3 | Phase Volume Fraction, % | Microproperties | |||
|---|---|---|---|---|---|
| Porosity, kp = Vp/V0 | Ferrite, kf = Vf/V0 | Bainite, kb = 1 − kf | Ferrite | Bainite | |
| Modulus of Elasticity, GPa | |||||
| 6.5 | 20 | 33 ±2.5 | xxx | 185.3 ± 29.5 | 238 ± 29.6 |
| 6.8 | 14.7 | 30 ±3.7 | xxx | 189.1 ± 22.8 | 240 ± 17.2 |
| 7.1 | 9,9 | 31 ± 4.1 | xxx | 183.6 ± 20.7 | 238 ± 22.4 |
| Fracture Toughness (Energy Release Rate), GC, N/mm | |
|---|---|
| bainite | 8.45 |
| ferrite | 14.5 |
| Bainite | Ferrite | |
|---|---|---|
| Modulus of elasticity, E, MPa | 239,000 | 186,000 |
| Poisson ratio, v, - | 0.28 | |
| Energy release rate (Fracture toughness), GC, N/mm | 8.5 | 14.5 |
Disclaimer/Publisher’s Note: The statements, opinions and data contained in all publications are solely those of the individual author(s) and contributor(s) and not of MDPI and/or the editor(s). MDPI and/or the editor(s) disclaim responsibility for any injury to people or property resulting from any ideas, methods, instructions or products referred to in the content. |
© 2023 by the authors. Licensee MDPI, Basel, Switzerland. This article is an open access article distributed under the terms and conditions of the Creative Commons Attribution (CC BY) license (https://creativecommons.org/licenses/by/4.0/).
Share and Cite
Tomić, Z.; Jarak, T.; Lesičar, T.; Gubeljak, N.; Tonković, Z. Modelling of Fatigue Microfracture in Porous Sintered Steel Using a Phase-Field Method. Materials 2023, 16, 4174. https://doi.org/10.3390/ma16114174
Tomić Z, Jarak T, Lesičar T, Gubeljak N, Tonković Z. Modelling of Fatigue Microfracture in Porous Sintered Steel Using a Phase-Field Method. Materials. 2023; 16(11):4174. https://doi.org/10.3390/ma16114174
Chicago/Turabian StyleTomić, Zoran, Tomislav Jarak, Tomislav Lesičar, Nenad Gubeljak, and Zdenko Tonković. 2023. "Modelling of Fatigue Microfracture in Porous Sintered Steel Using a Phase-Field Method" Materials 16, no. 11: 4174. https://doi.org/10.3390/ma16114174