
Study on the Gas Release of 3D-Printed Furan Resin Sand Core during the Casting Process
Abstract
:1. Introduction
2. Experiment
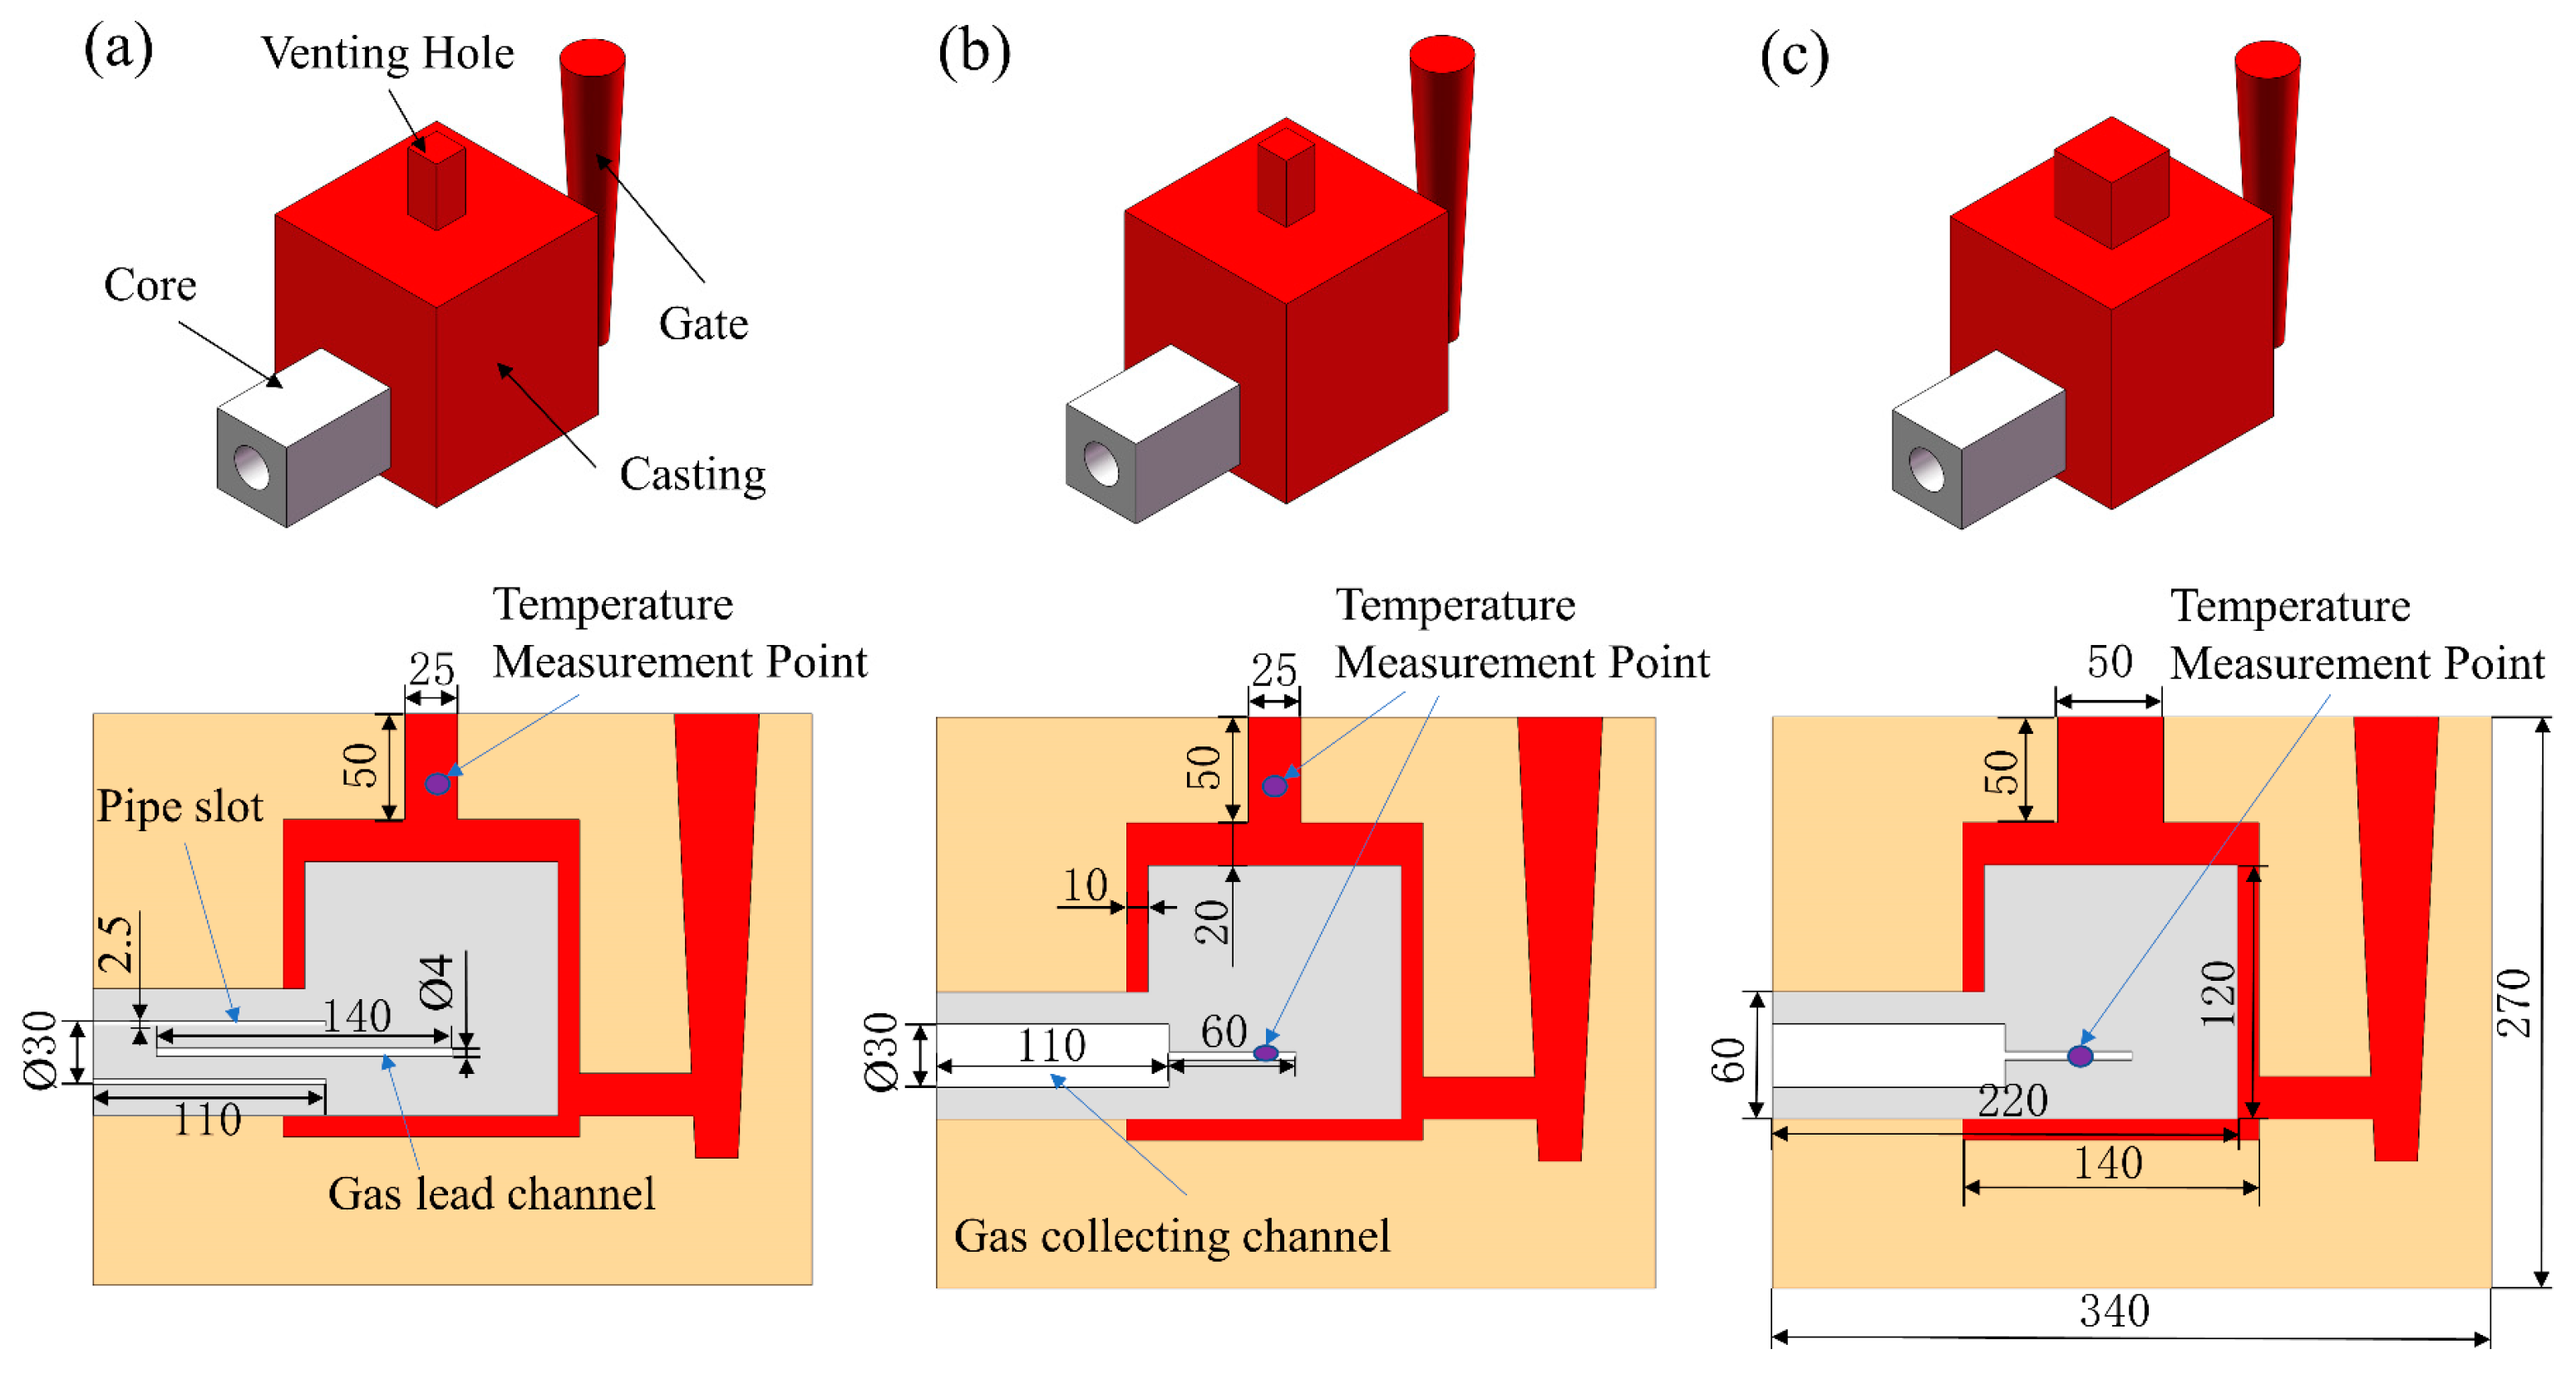
2.1. Model Design
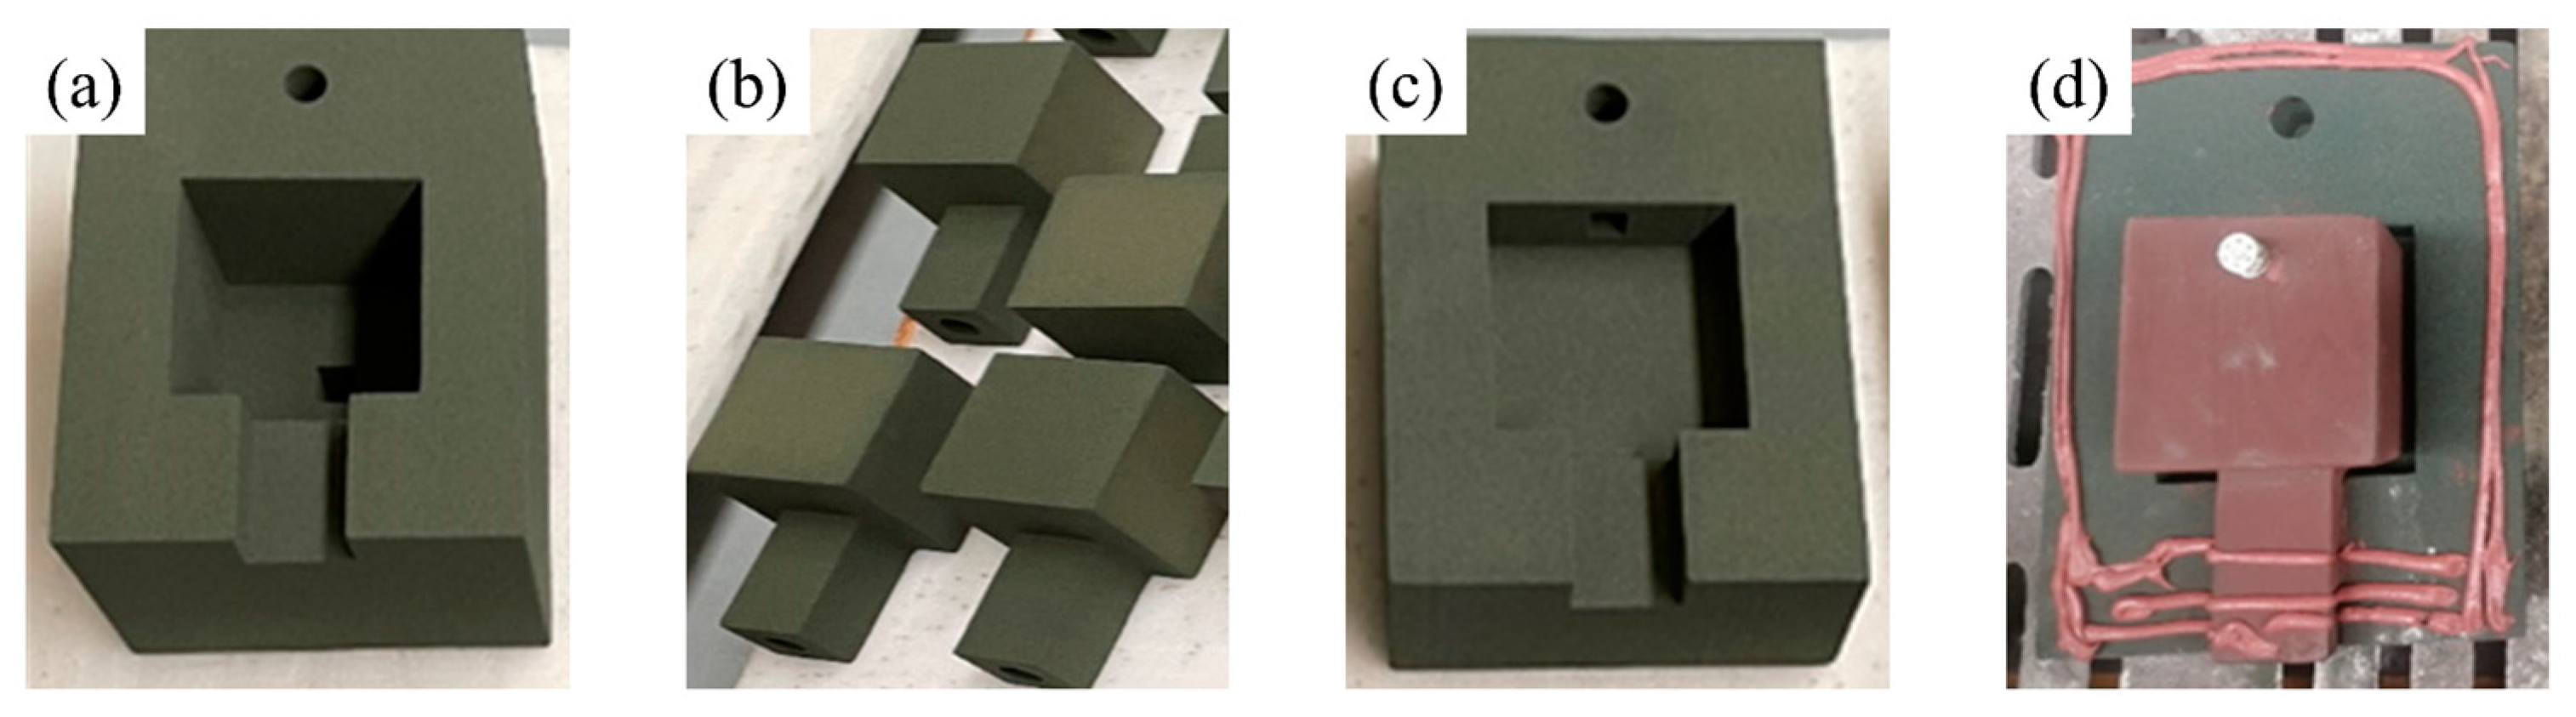
2.2. Sand Molds and Cores Manufacturing
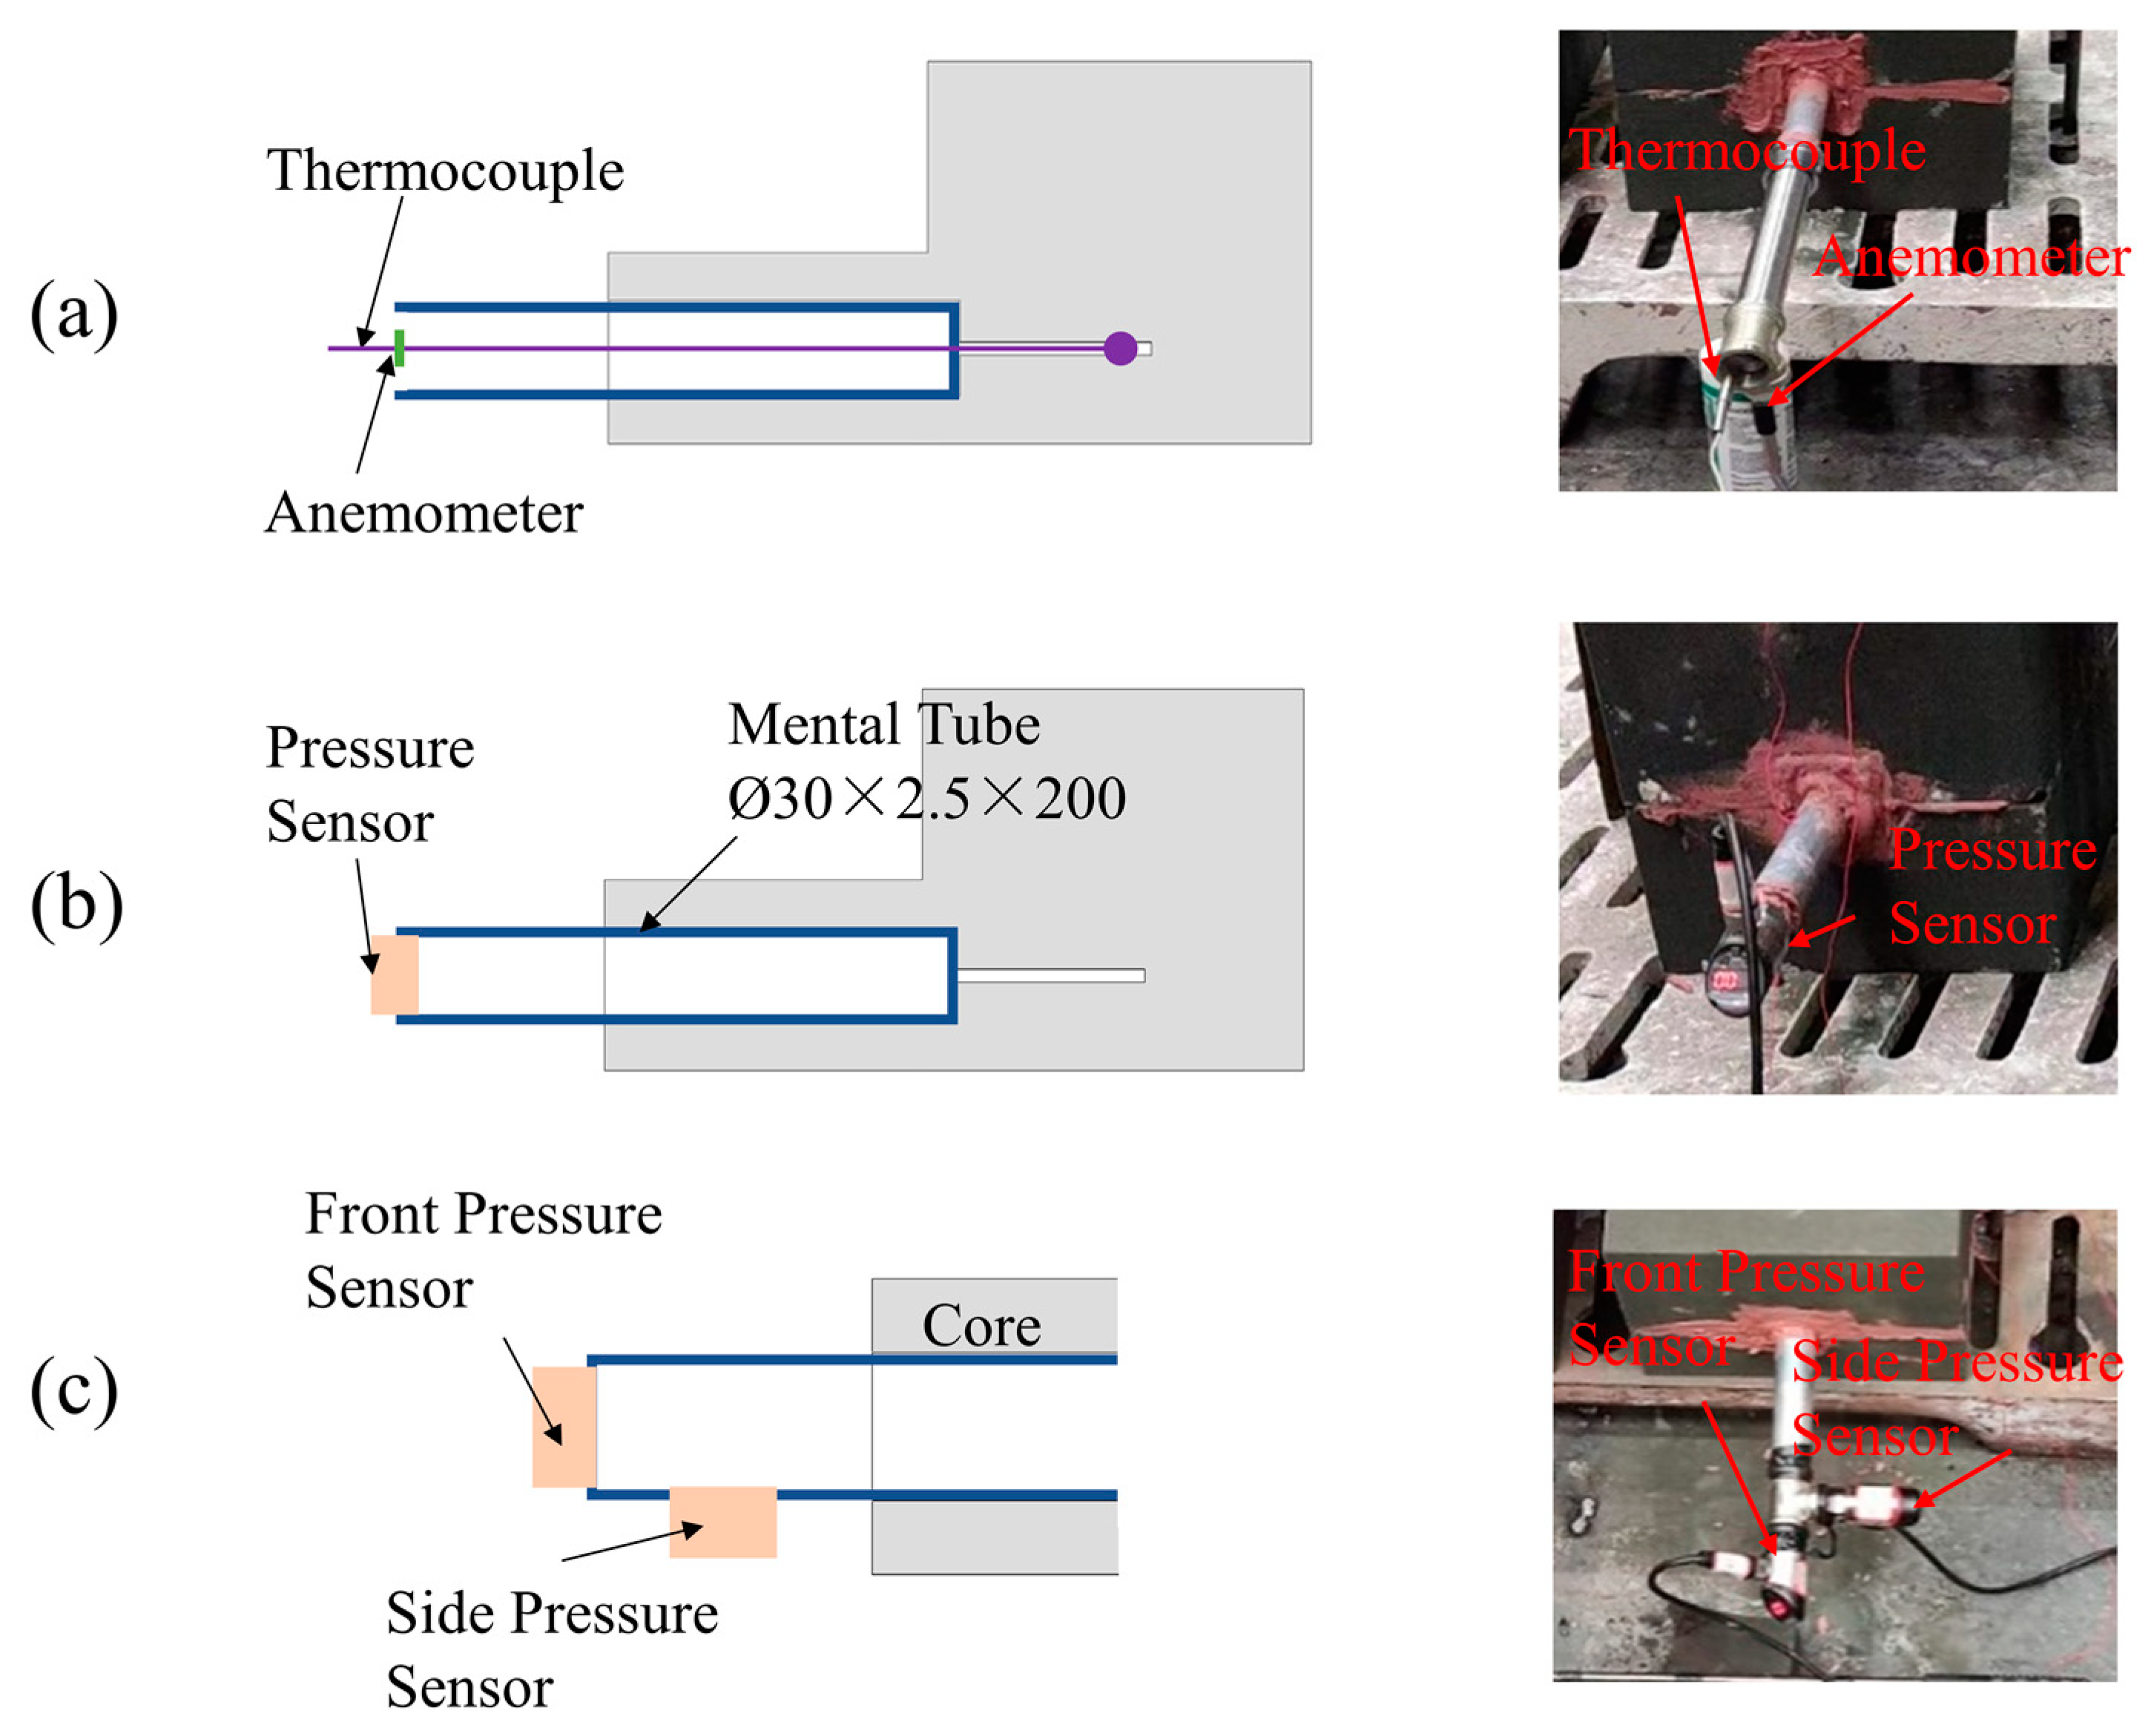
2.3. Experimental Design
3. Results
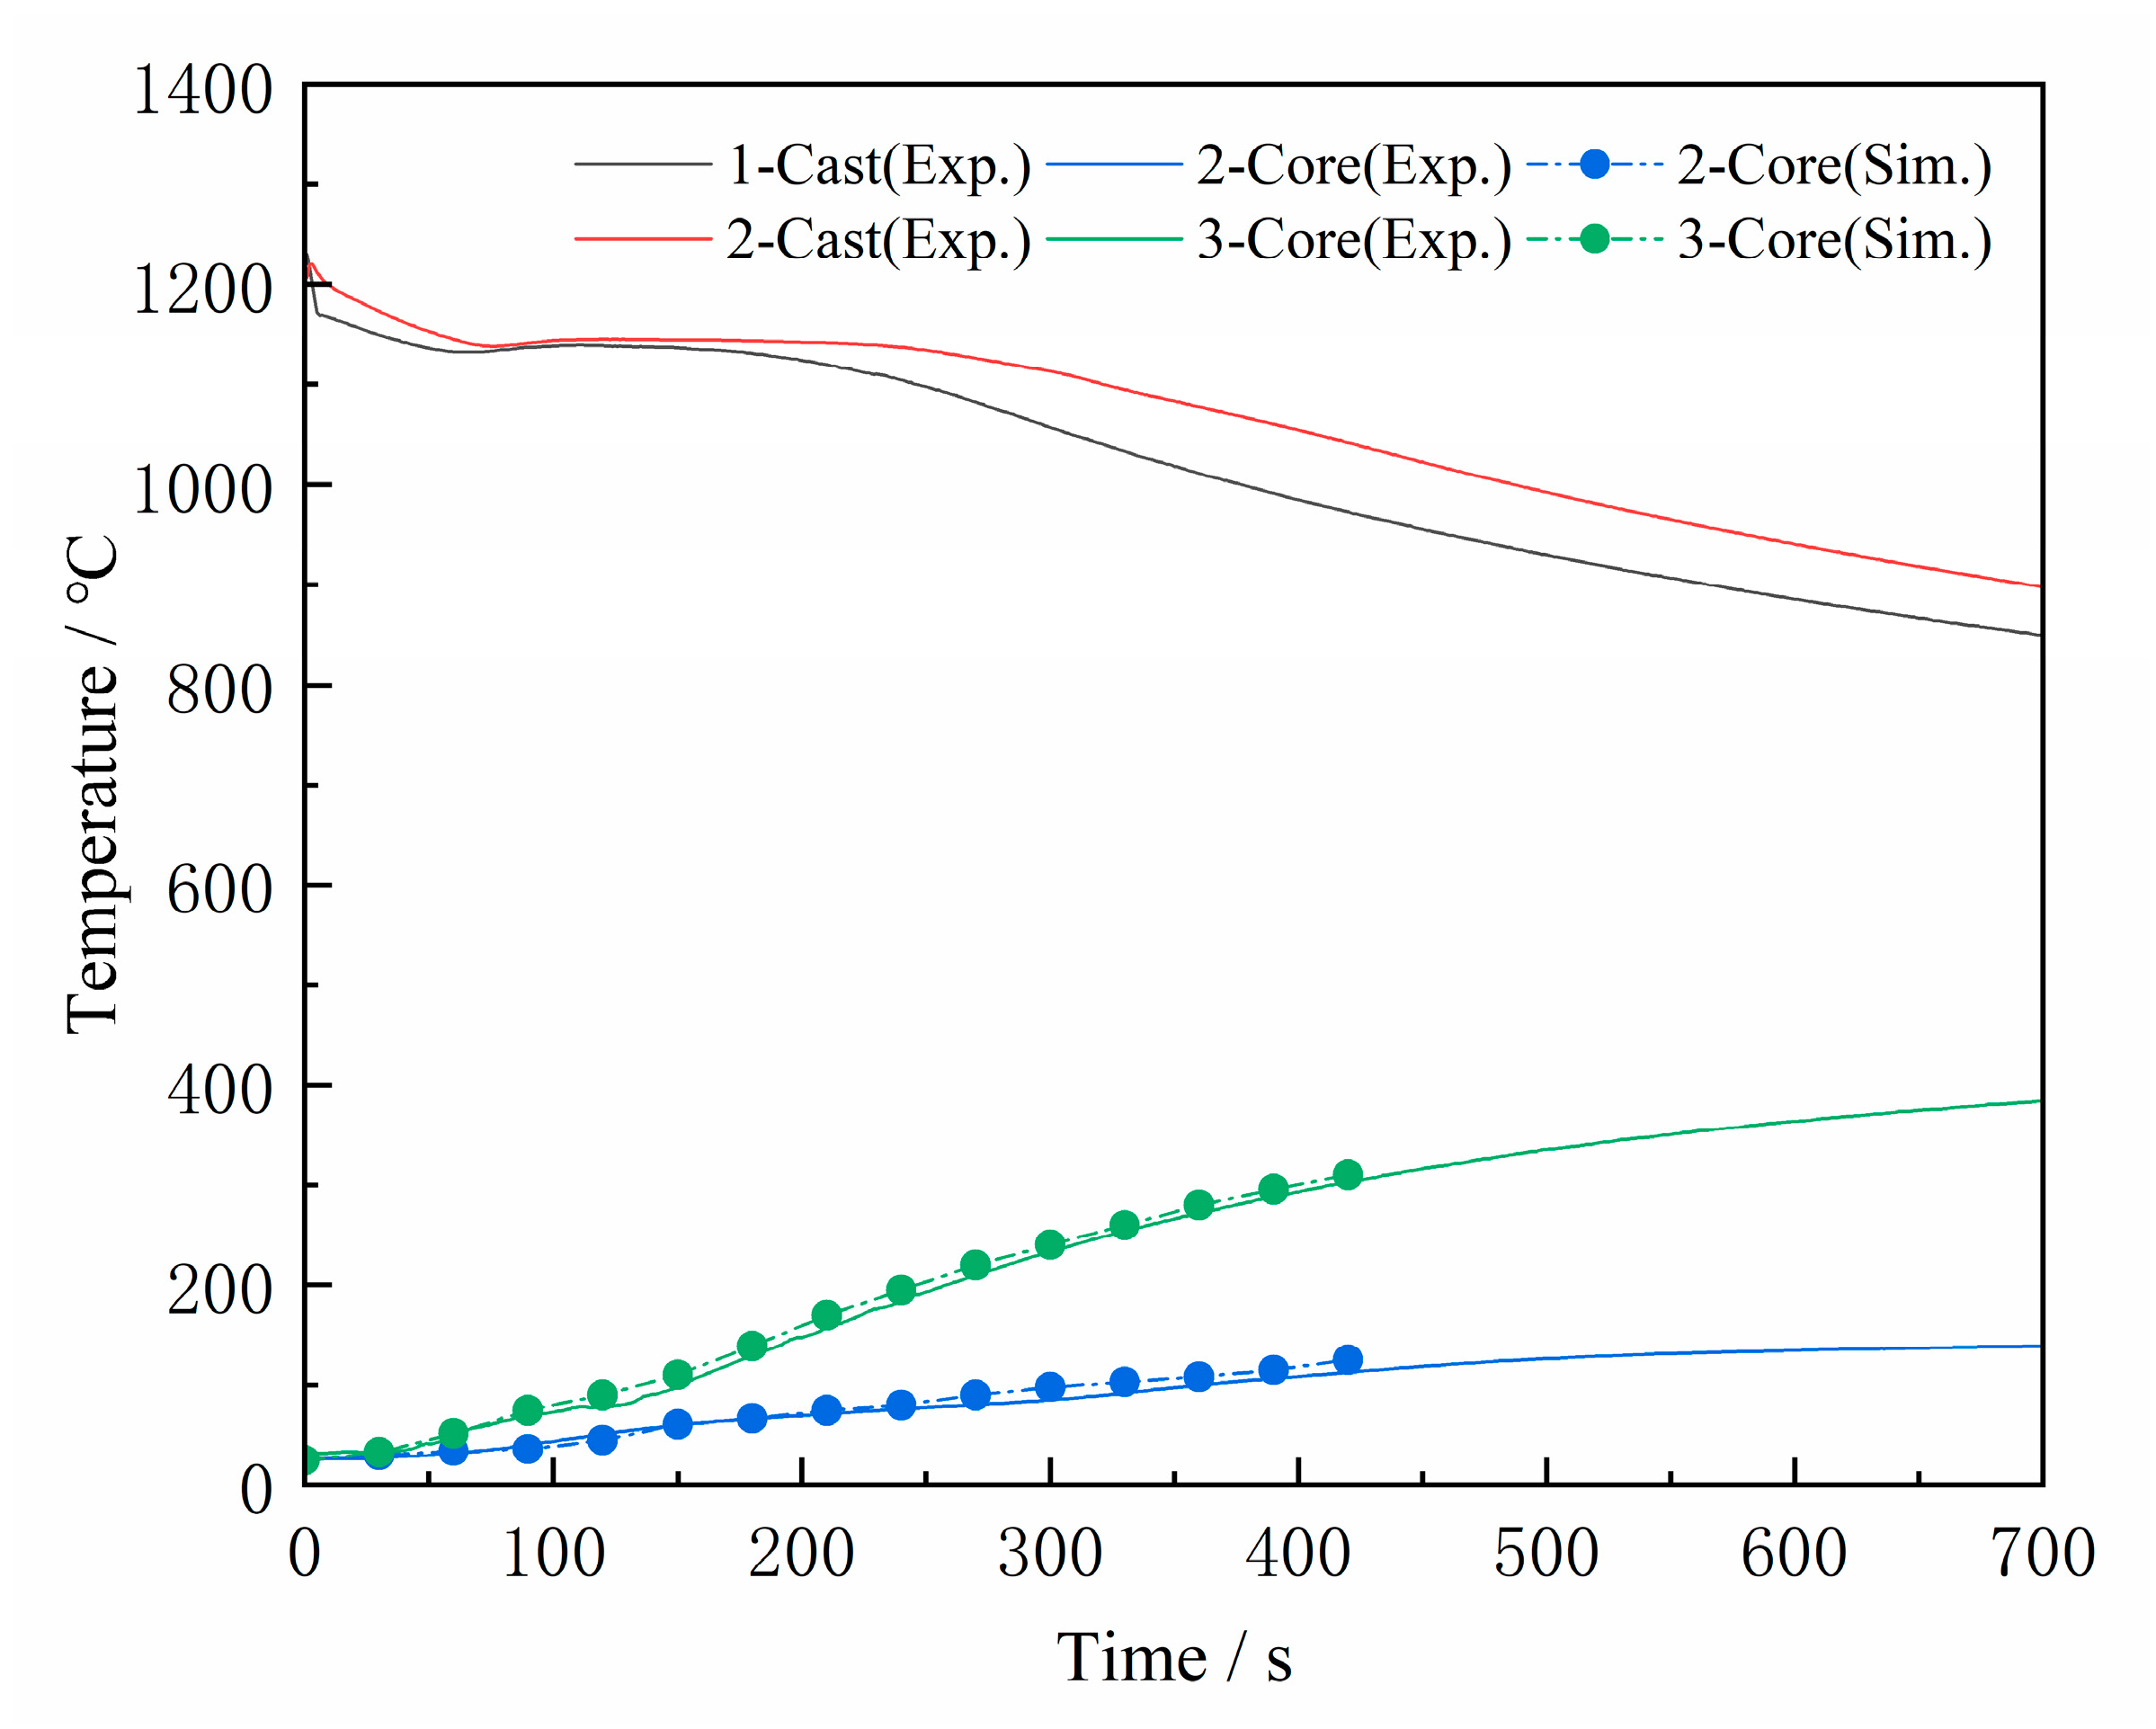
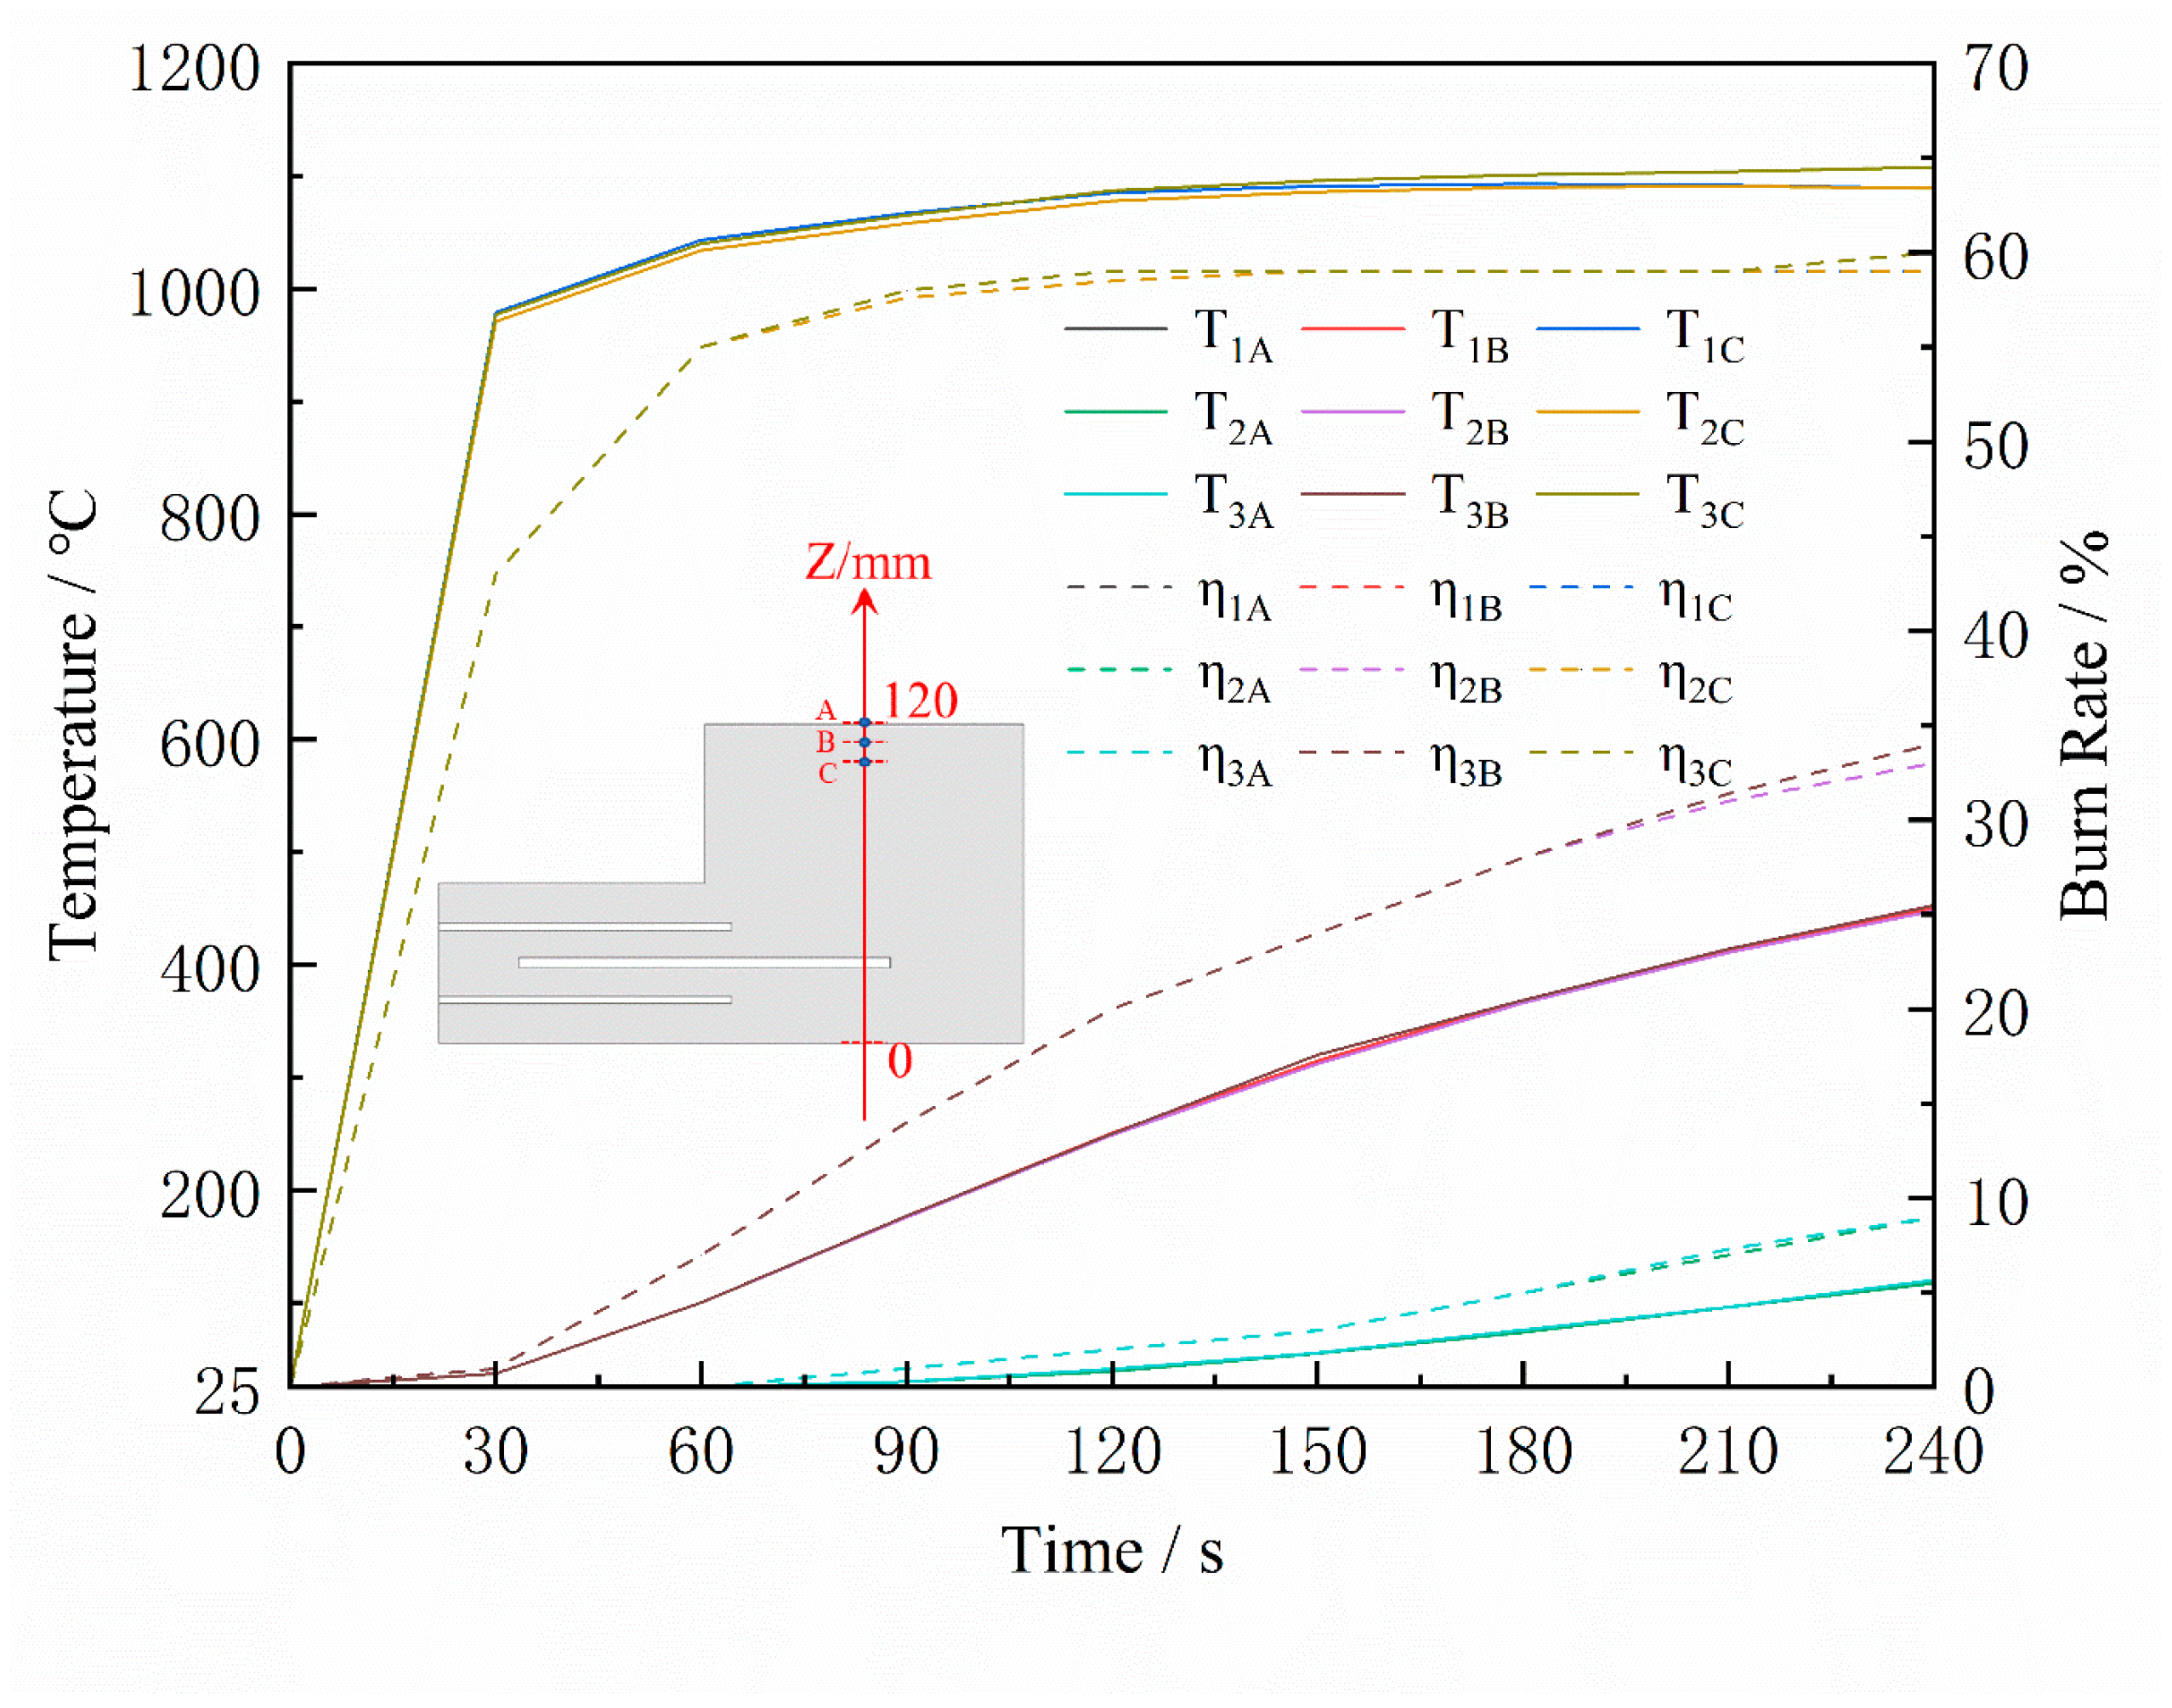
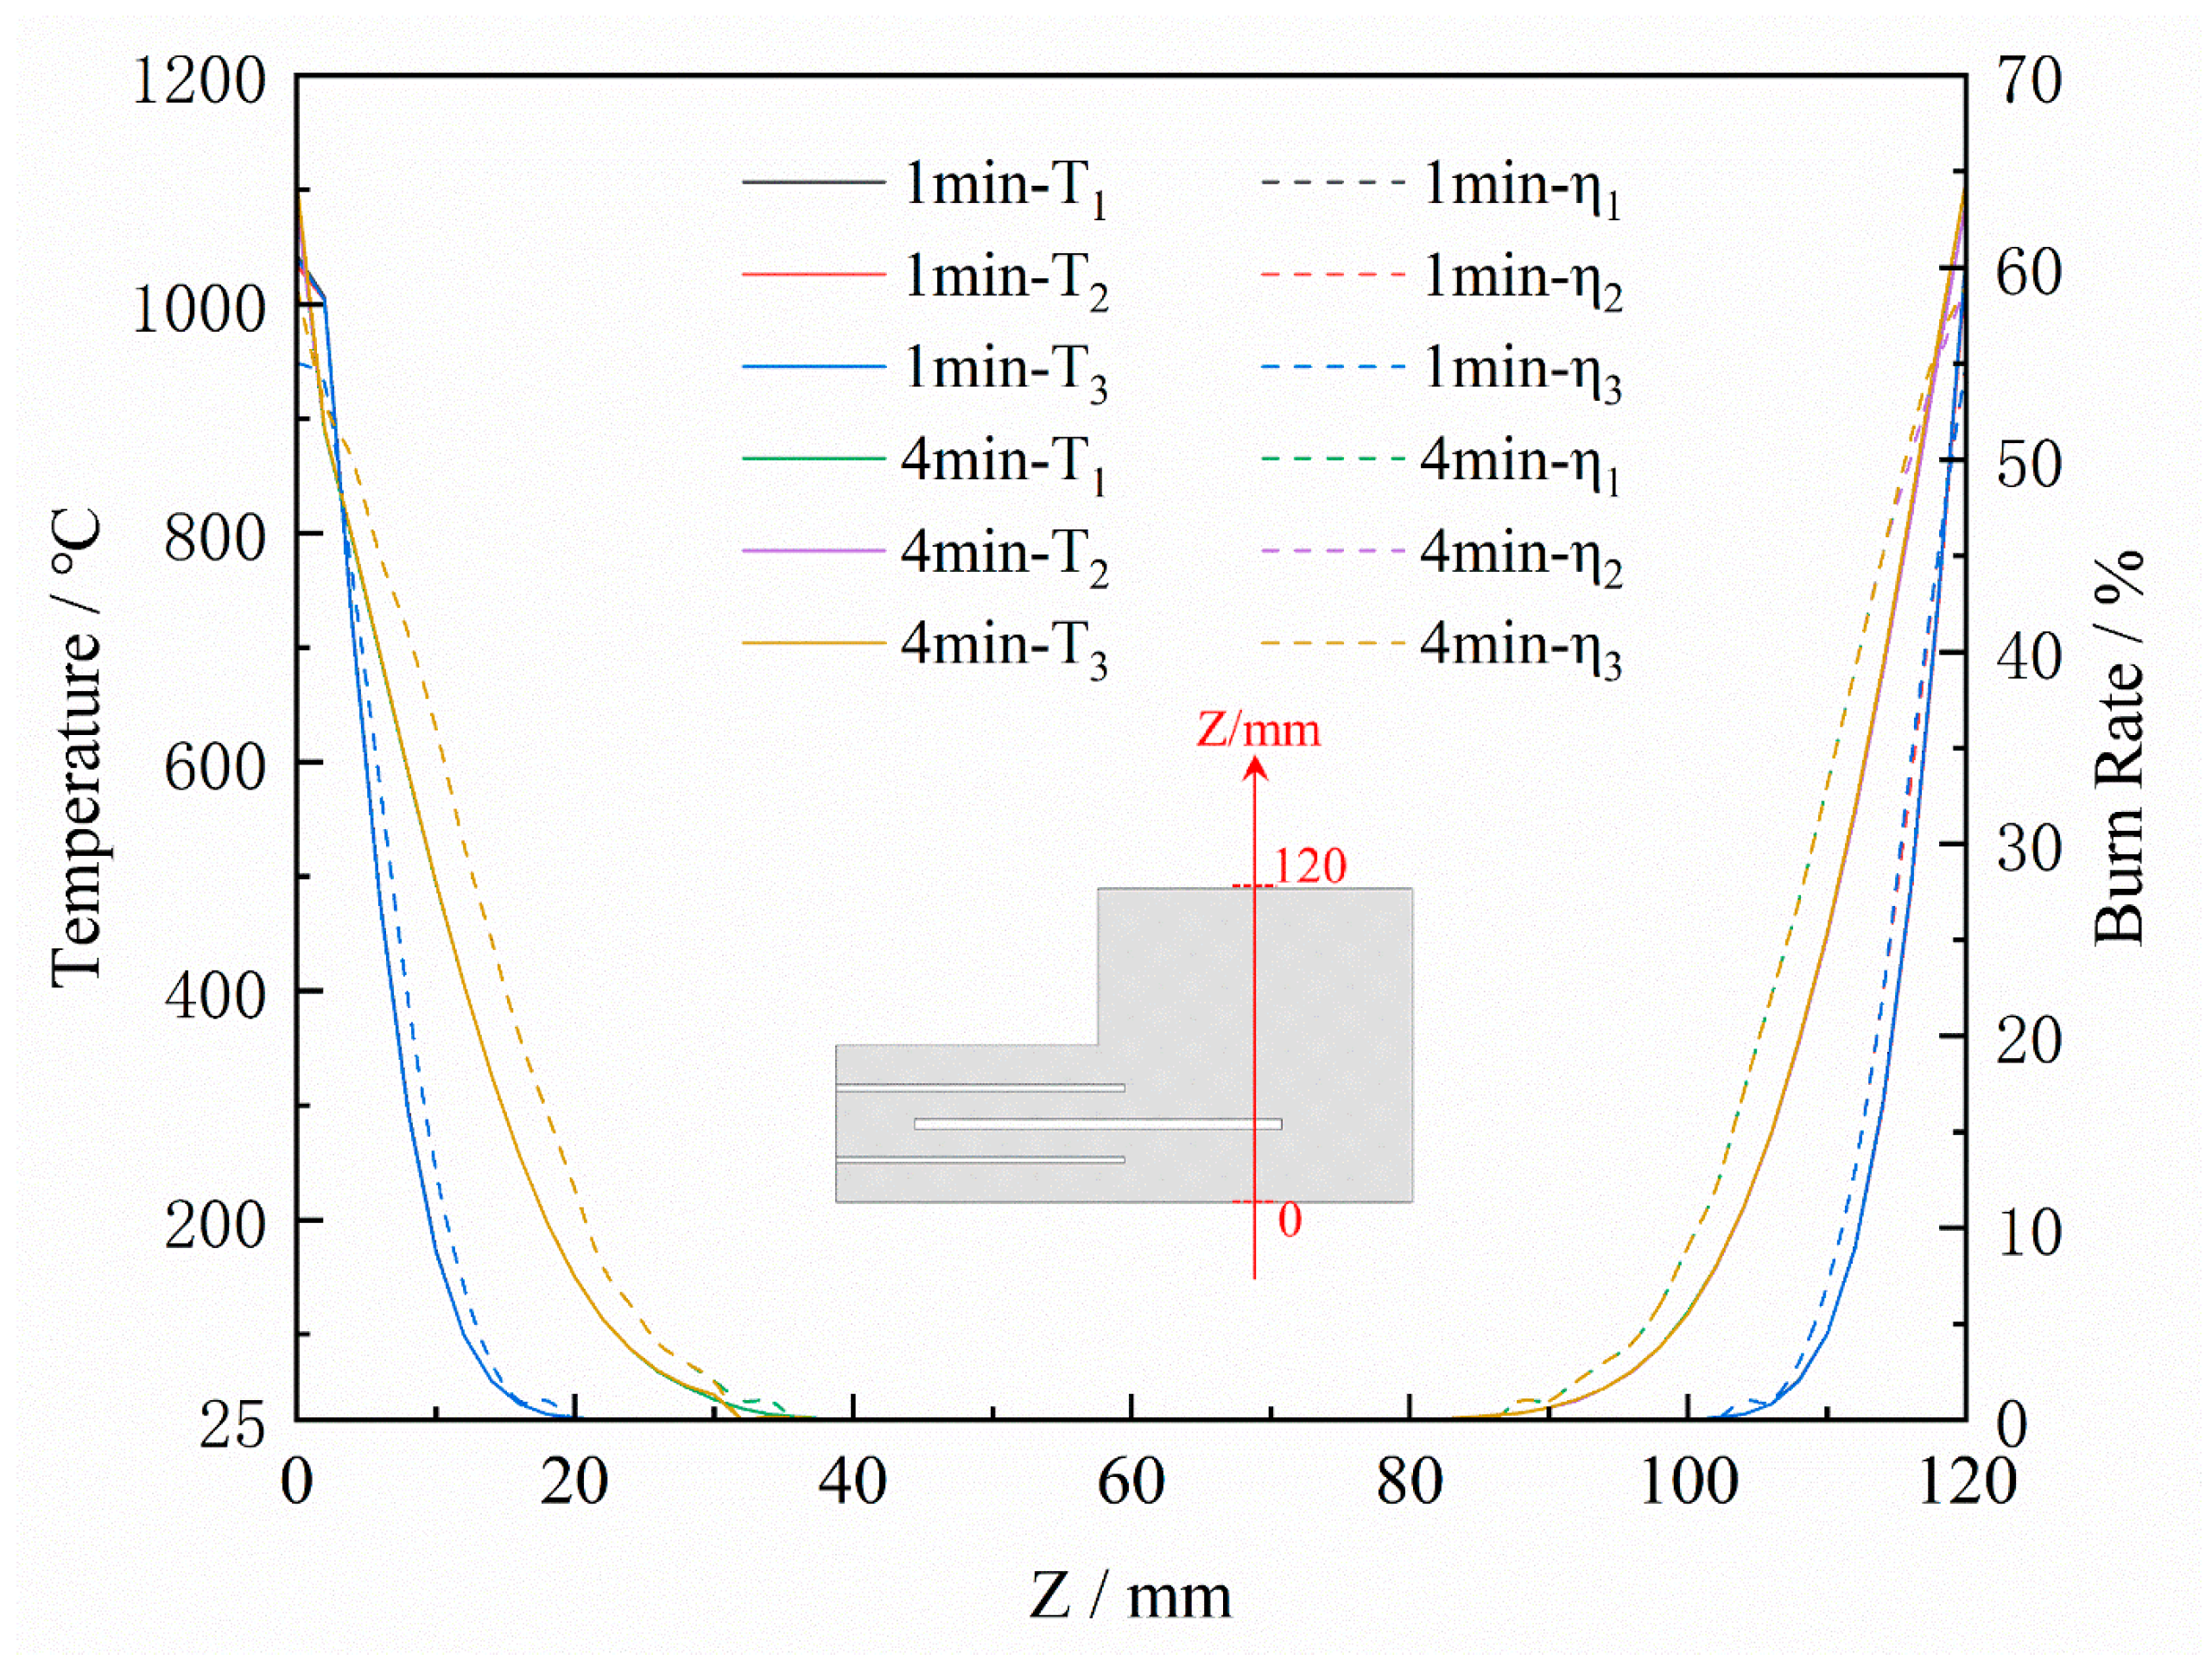
3.1. Casting and Sand Core Temperature
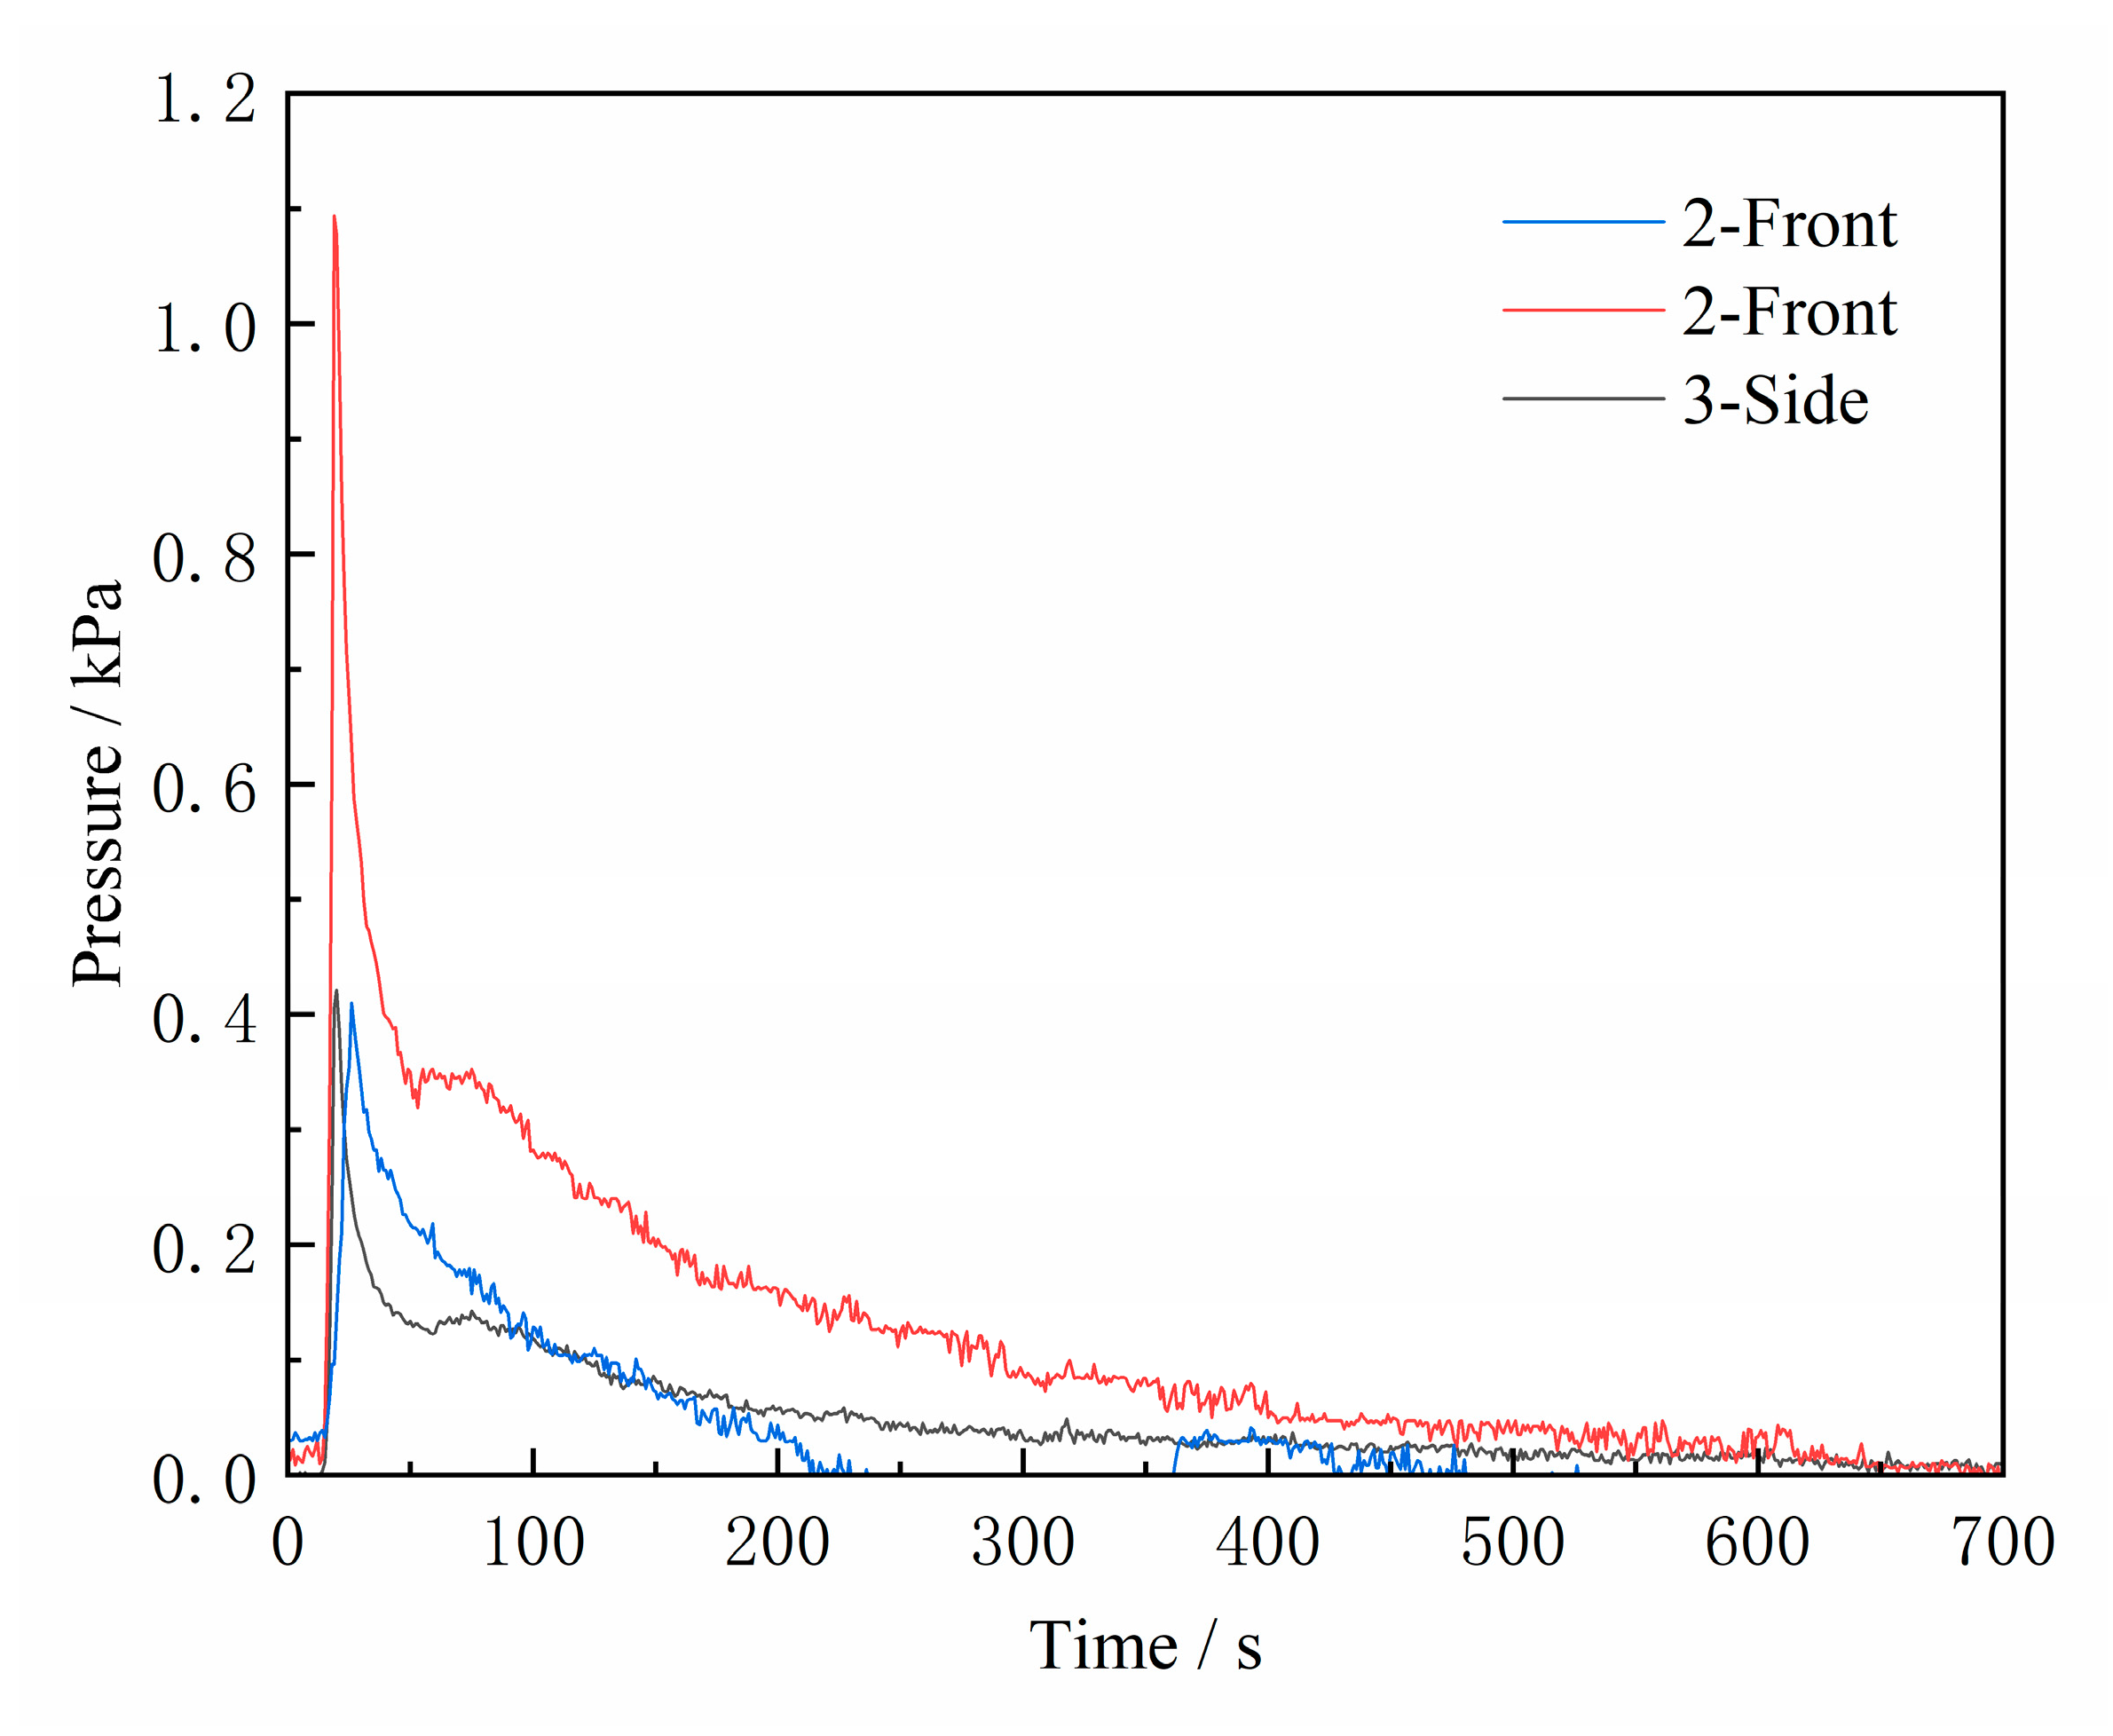
3.2. Gas Pressure
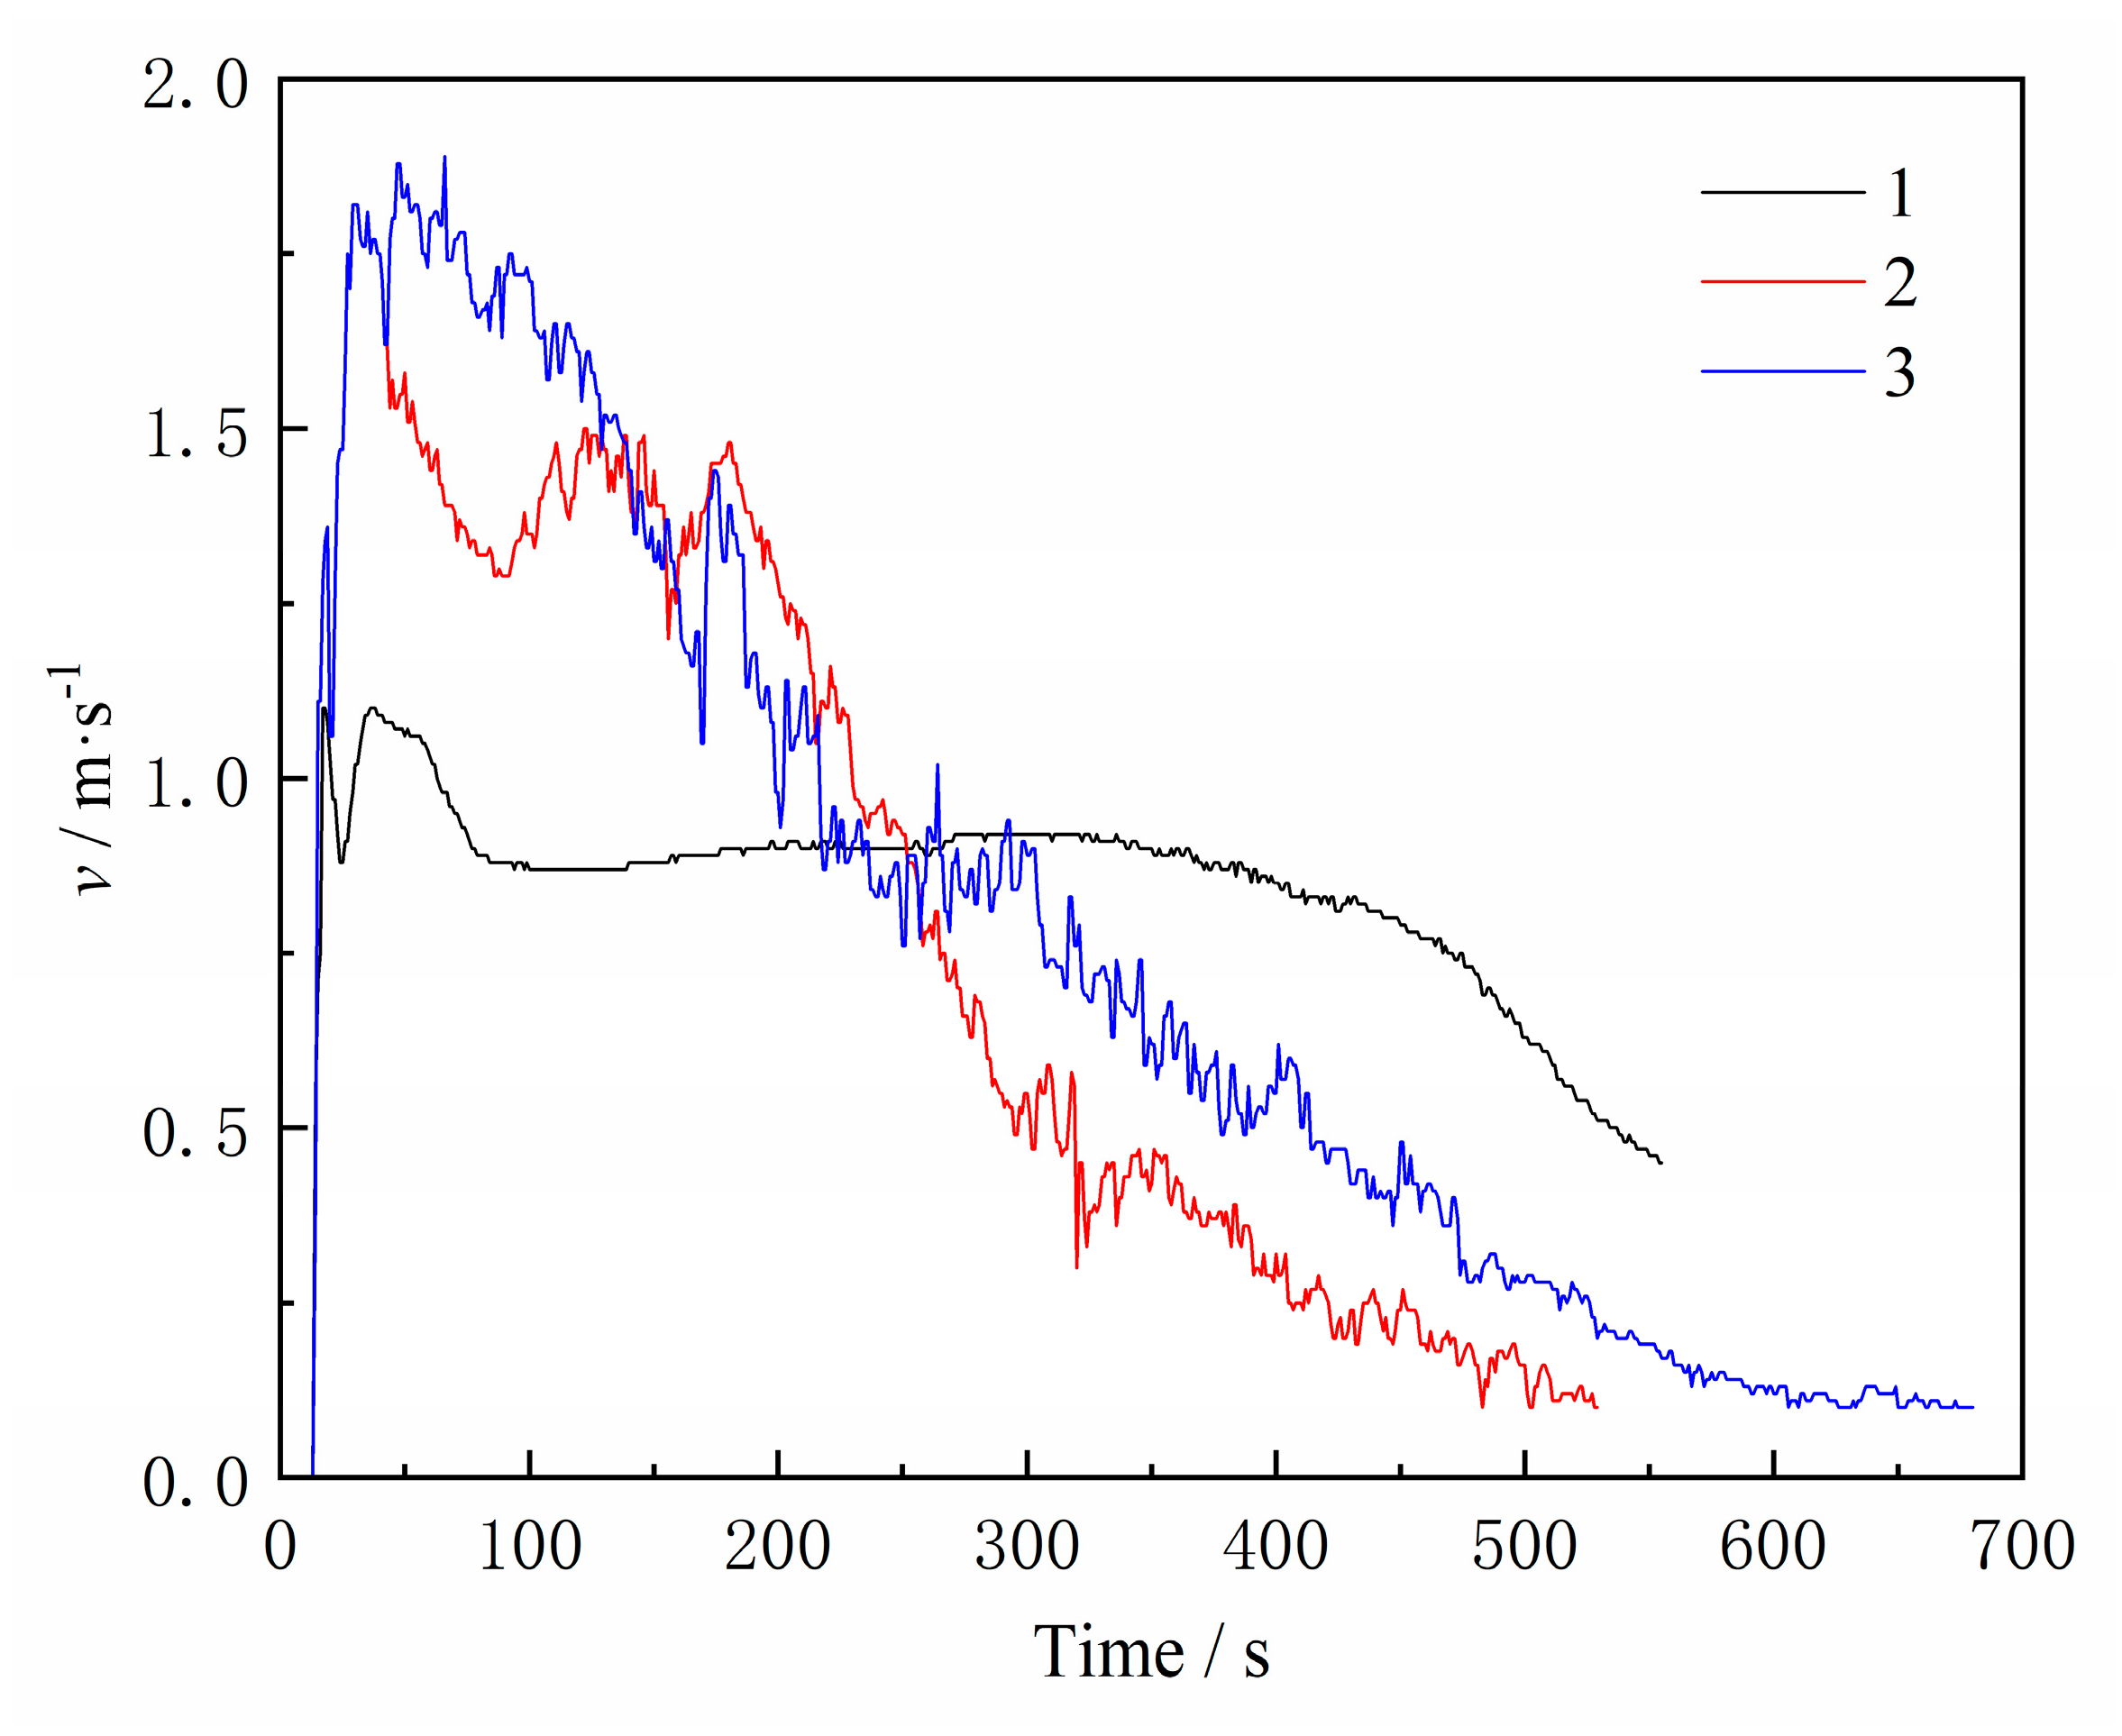
3.3. Exhaust Speed
4. Discussion
4.1. Heating up of Core and Binder Burning
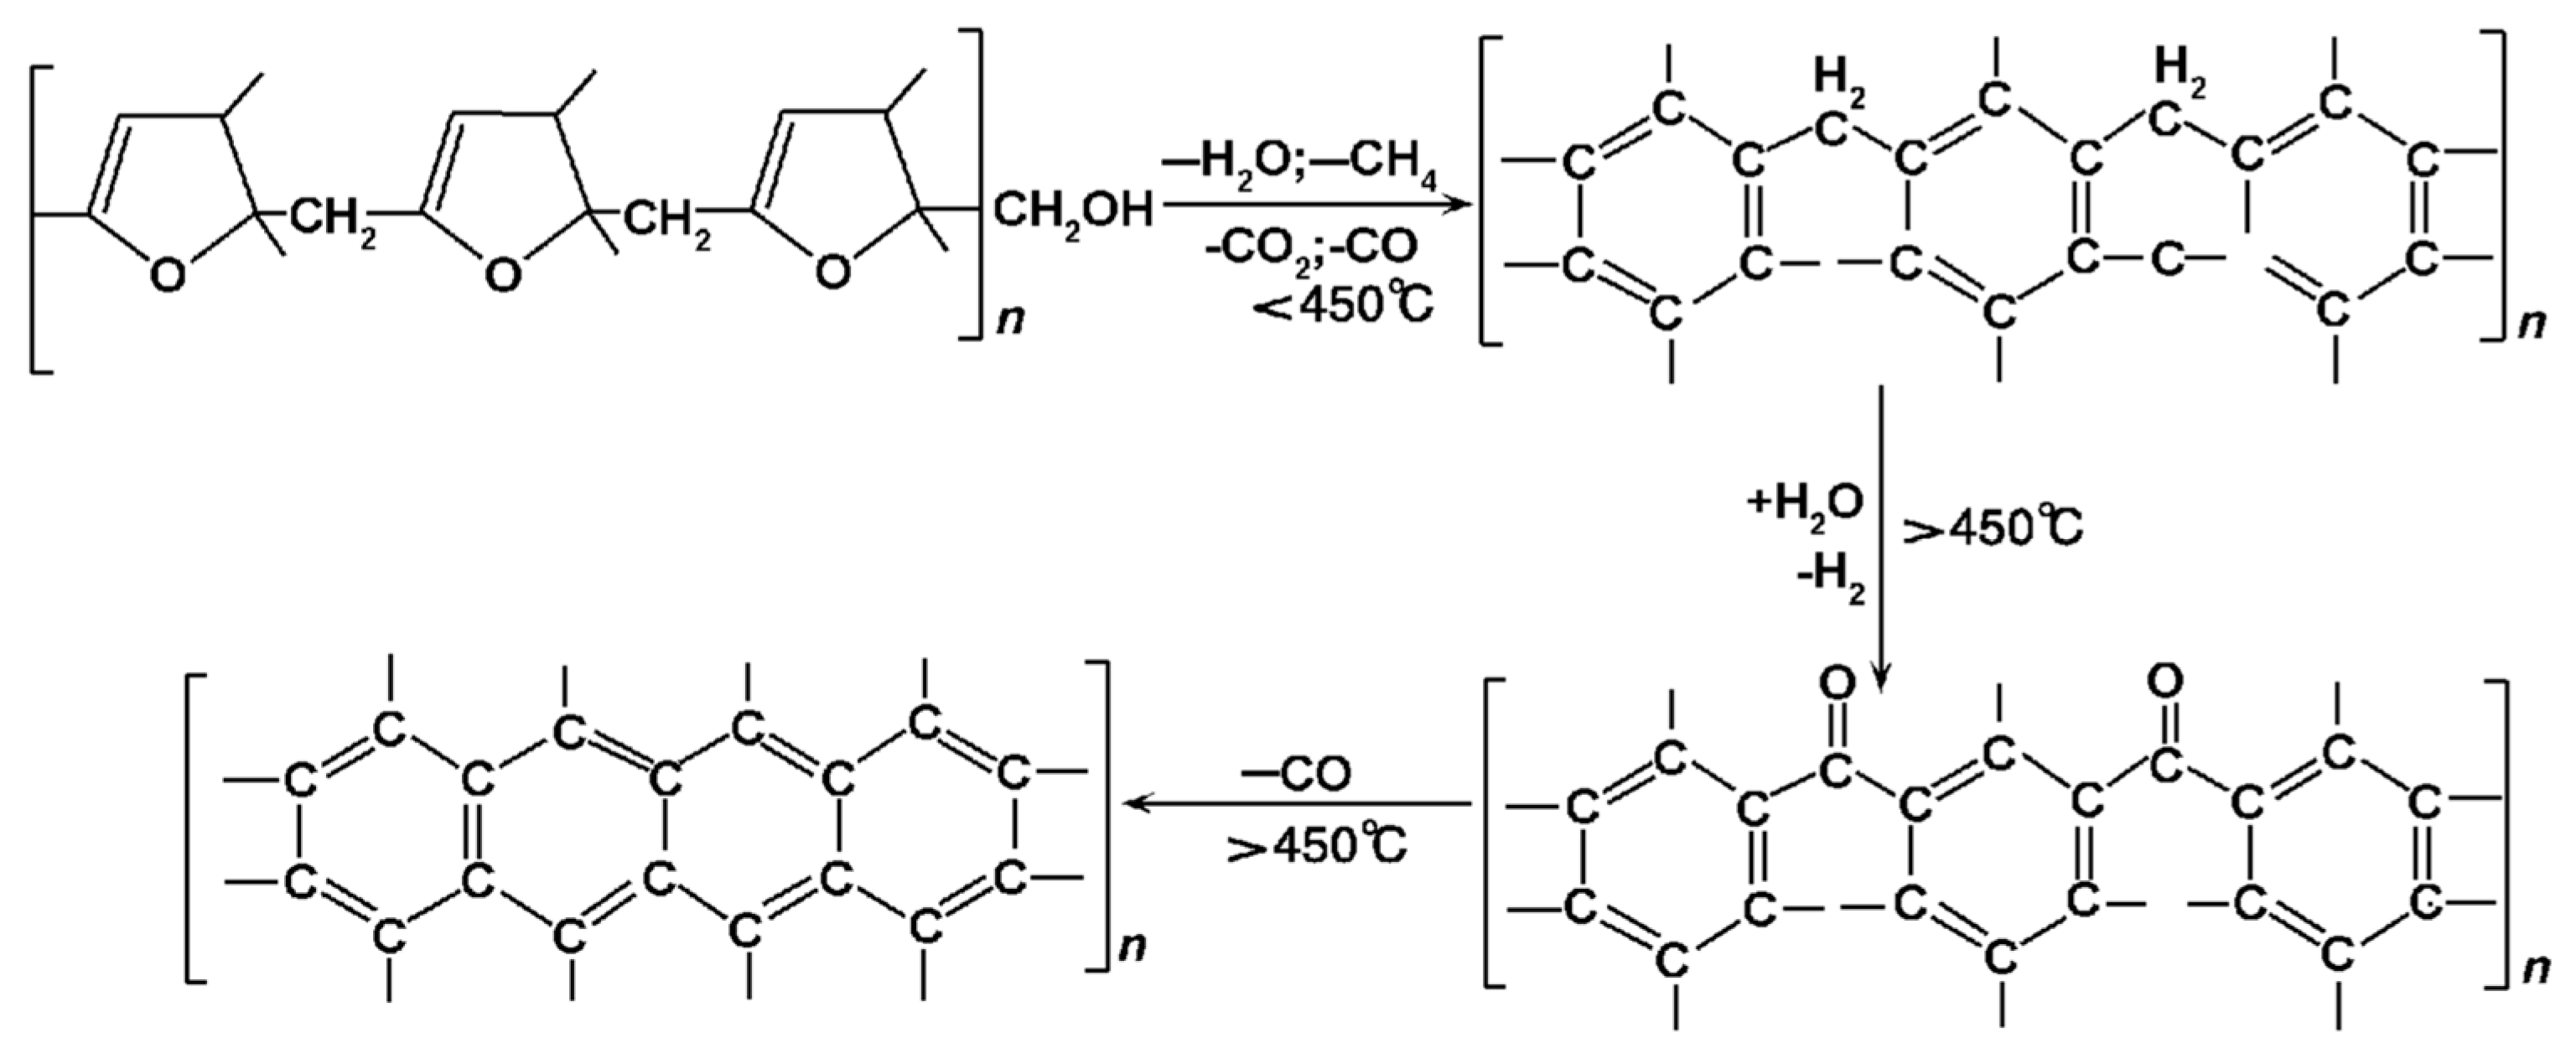
4.2. Binder Burning Mechanism
5. Conclusions
- The rate of gas generation in the furan resin sand core was high during the first 60 s after pouring, reaching a gas pressure peak of 1.09 kPa.
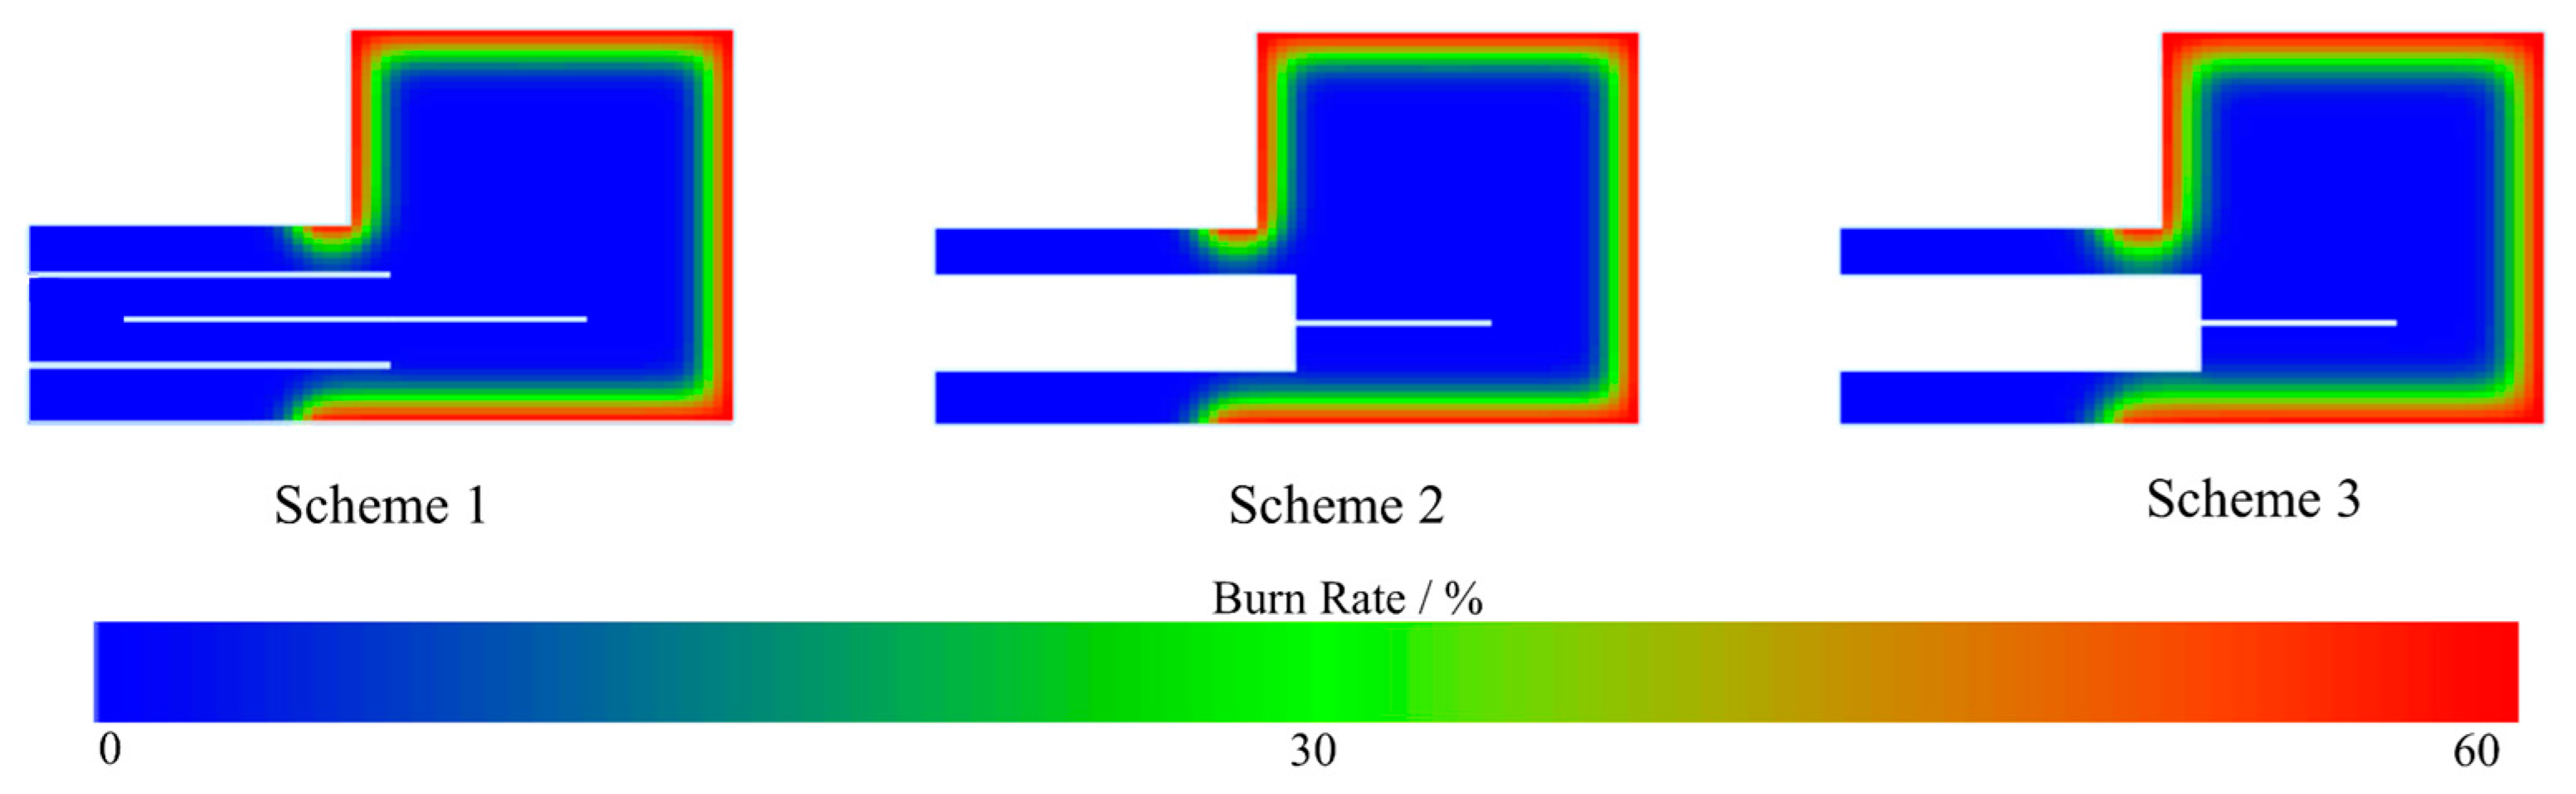
- The gas release of sand cores lasted for 10 min. The sand core with a blind core print structure had a peak speed of 1.10 m/s, and maintained a constant exhaust speed of 1 m/s for 500 s. The exhaust speed of the sand core with a hollow structure quickly reached a peak of 1.89 m/s and then slowly decreased.
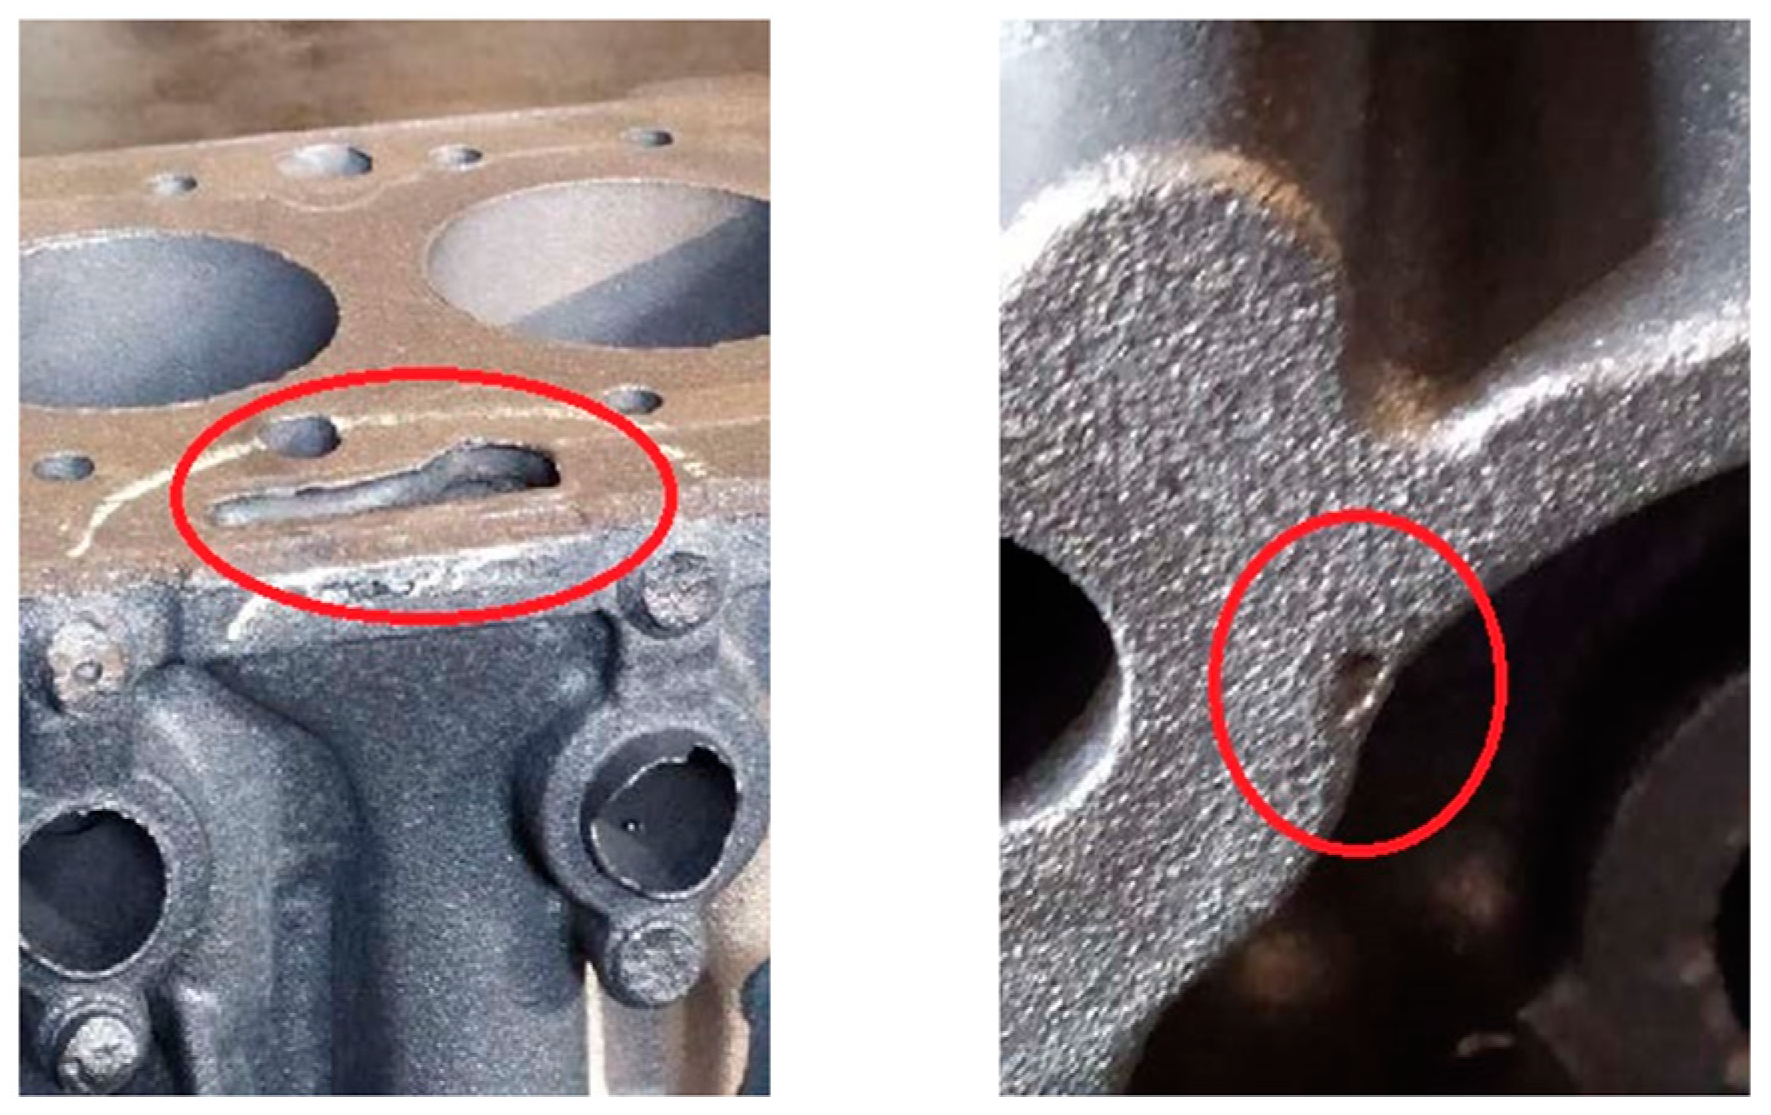
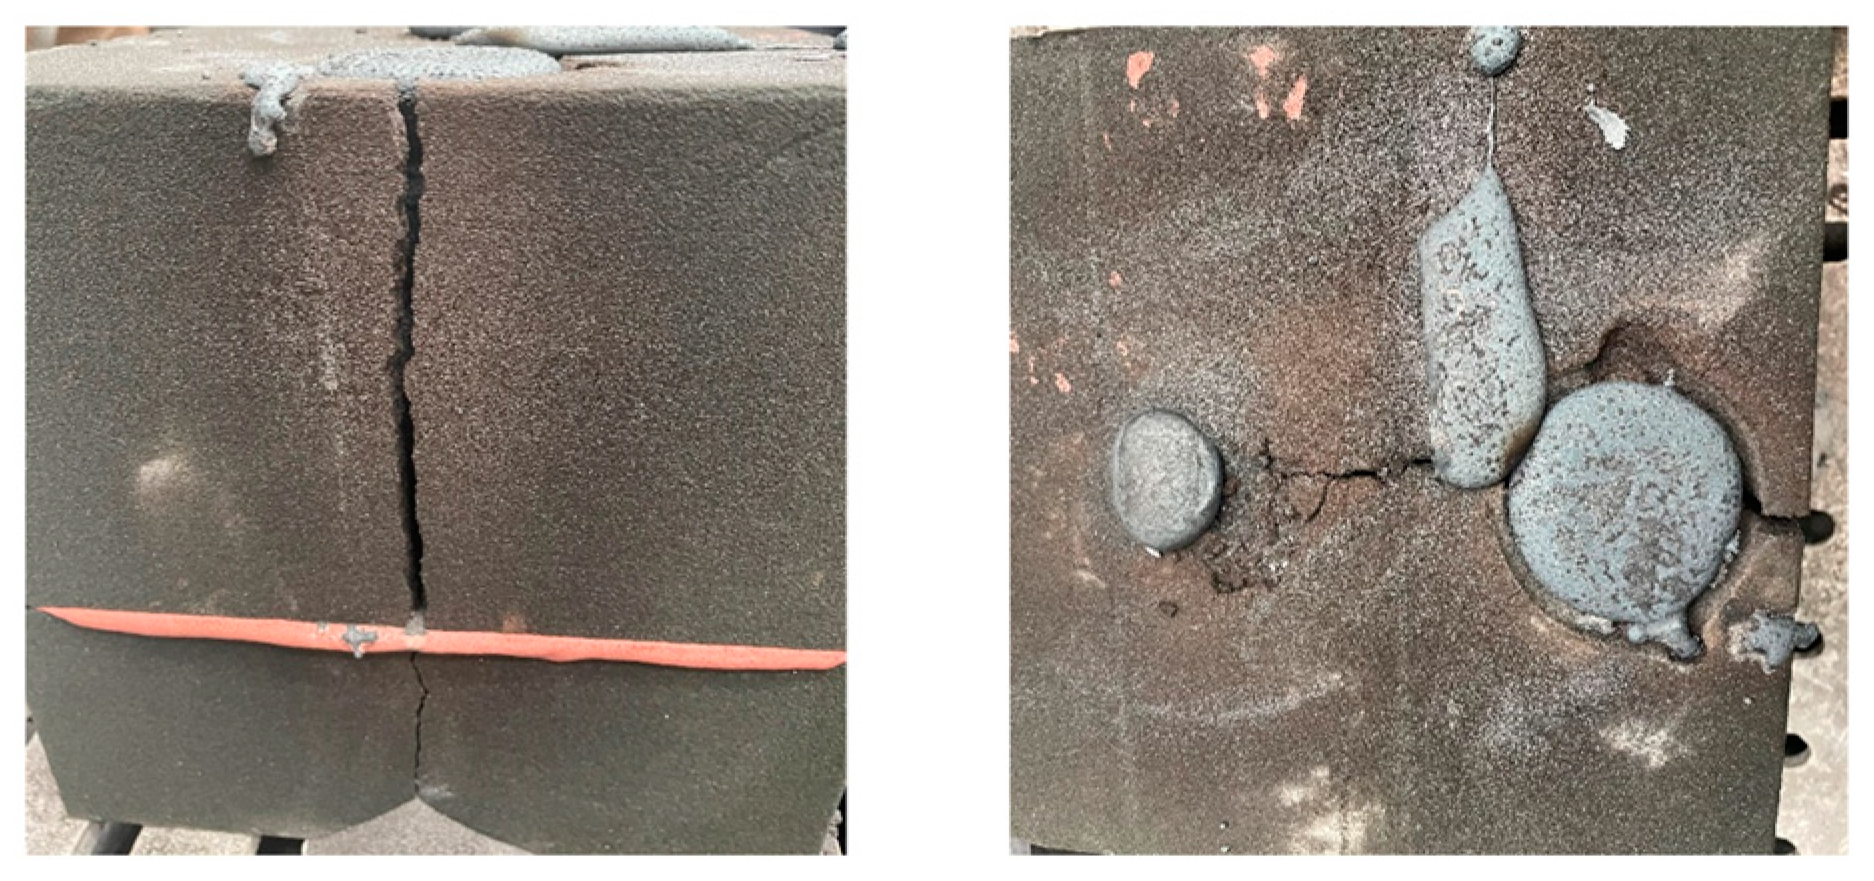
- There is the possibility of gas pores occurring during the initial stage of casting due to an eruption of gas release.
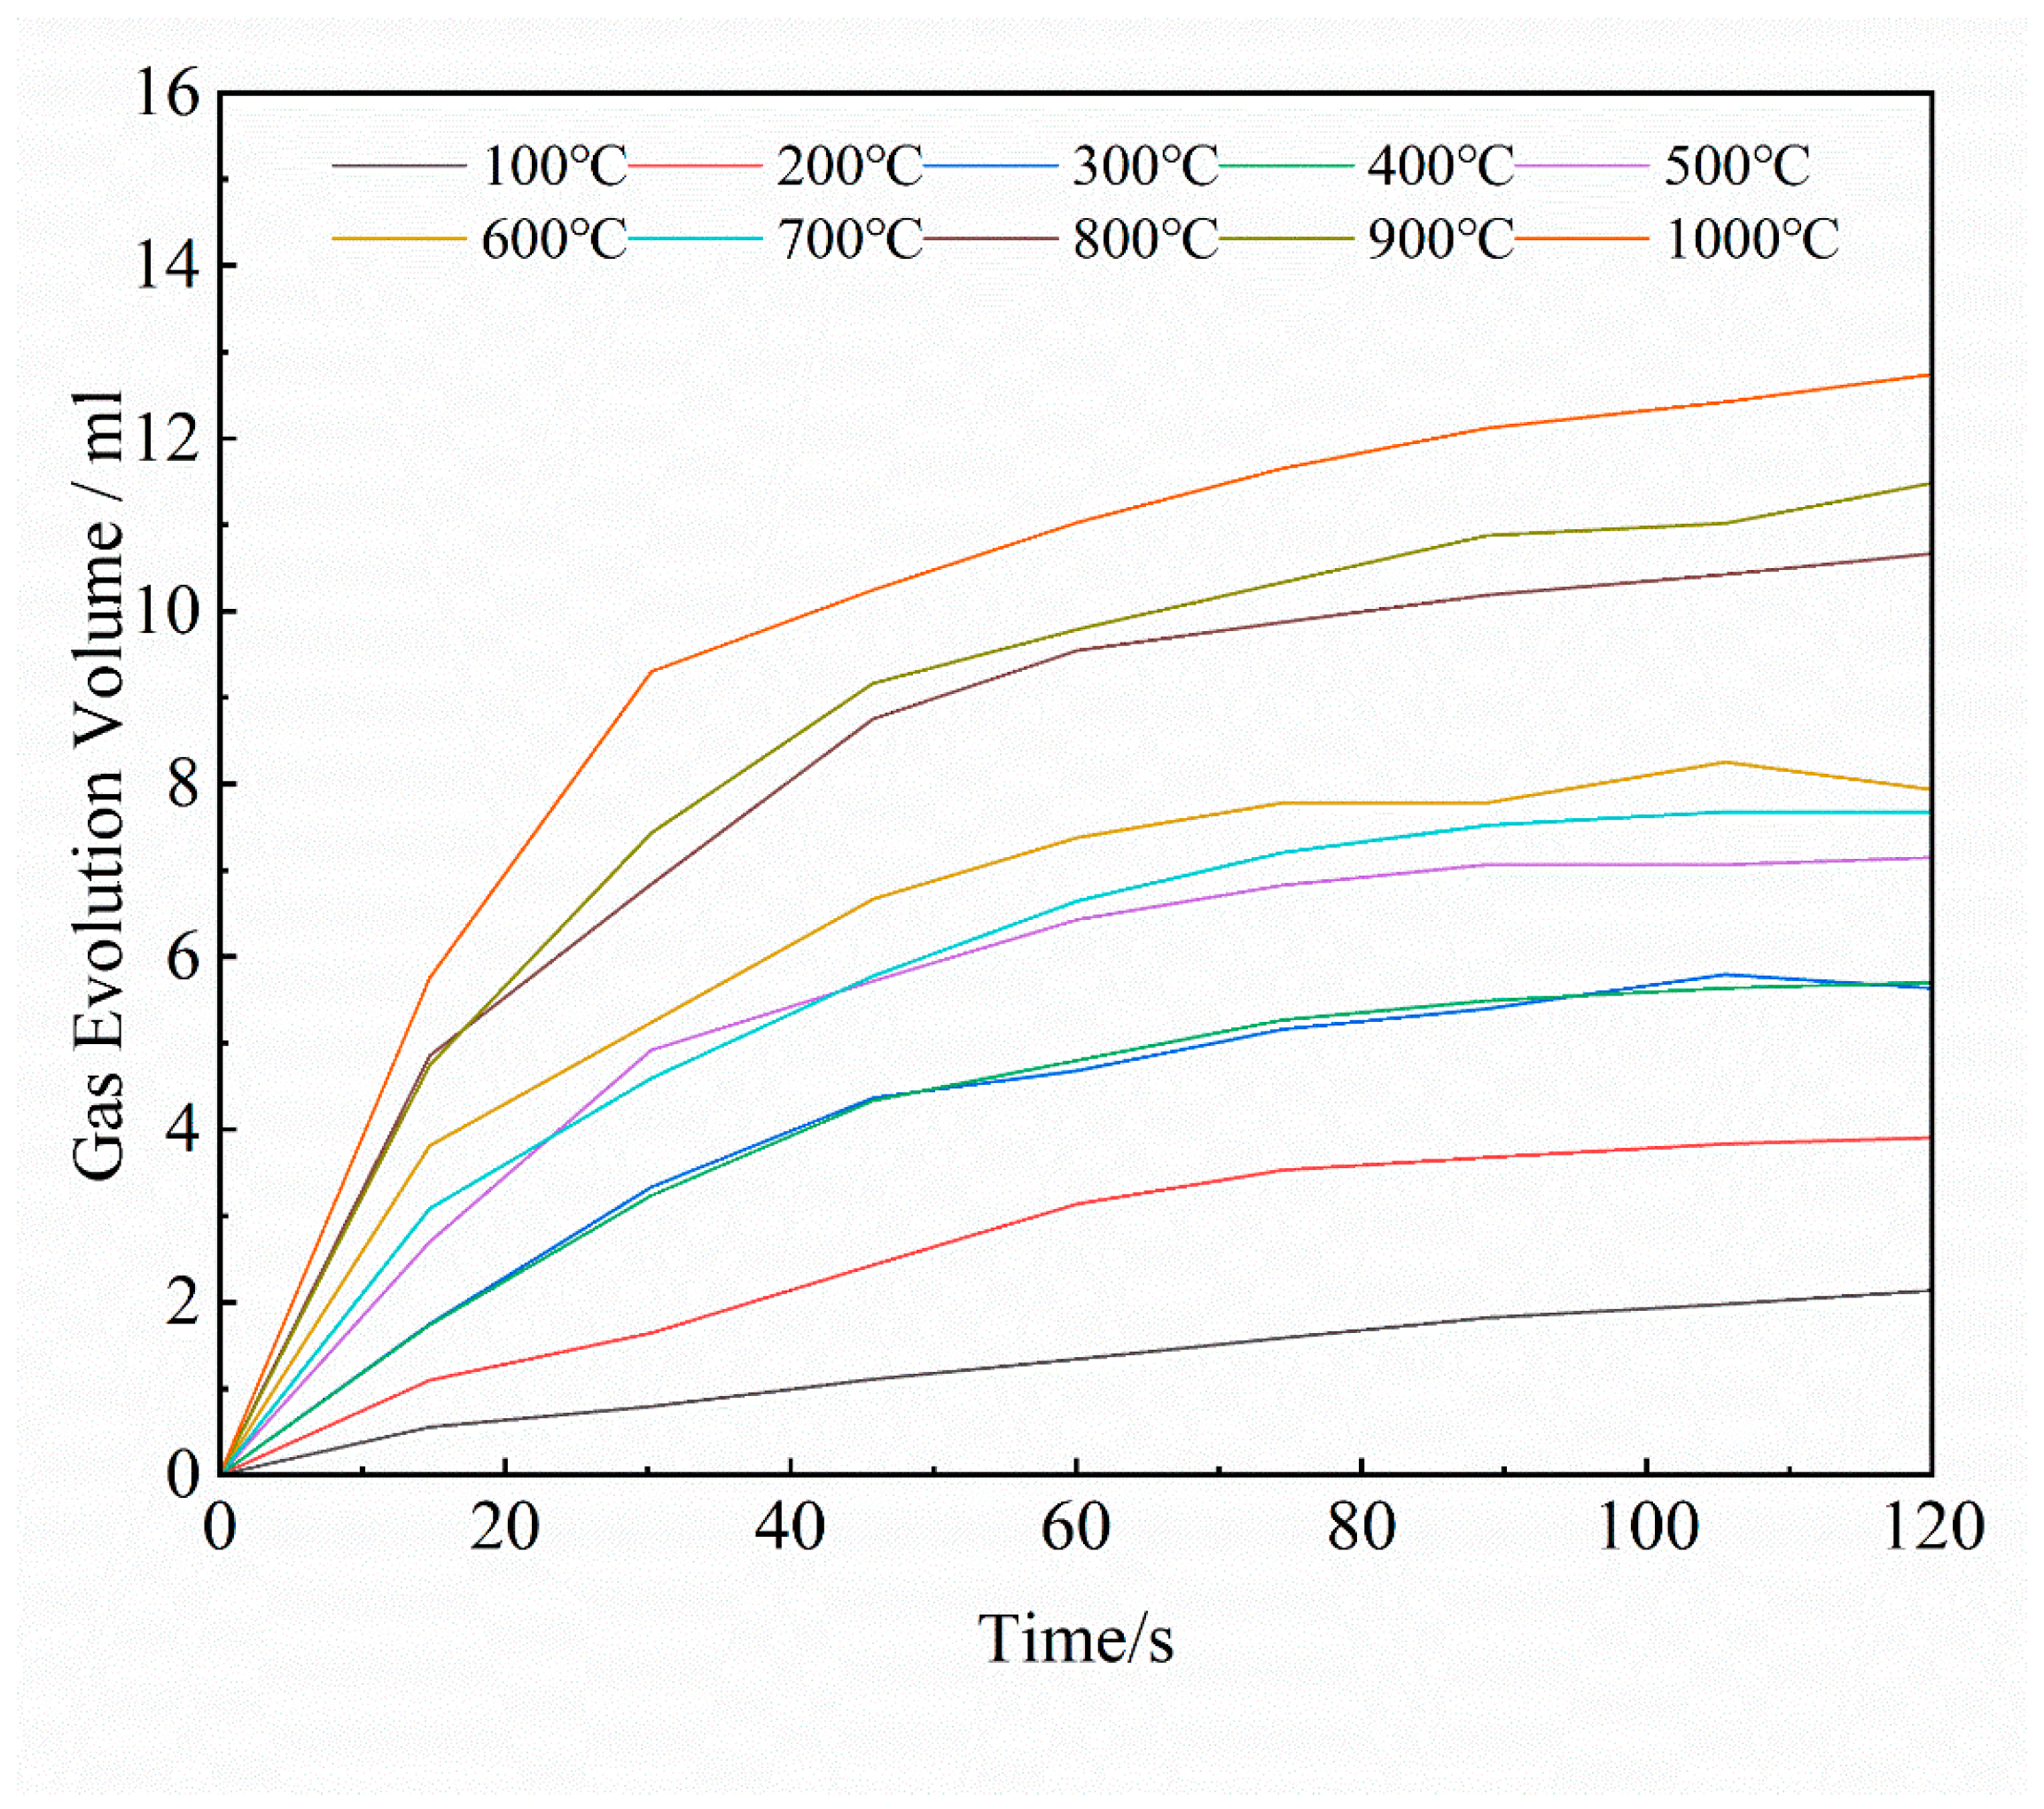
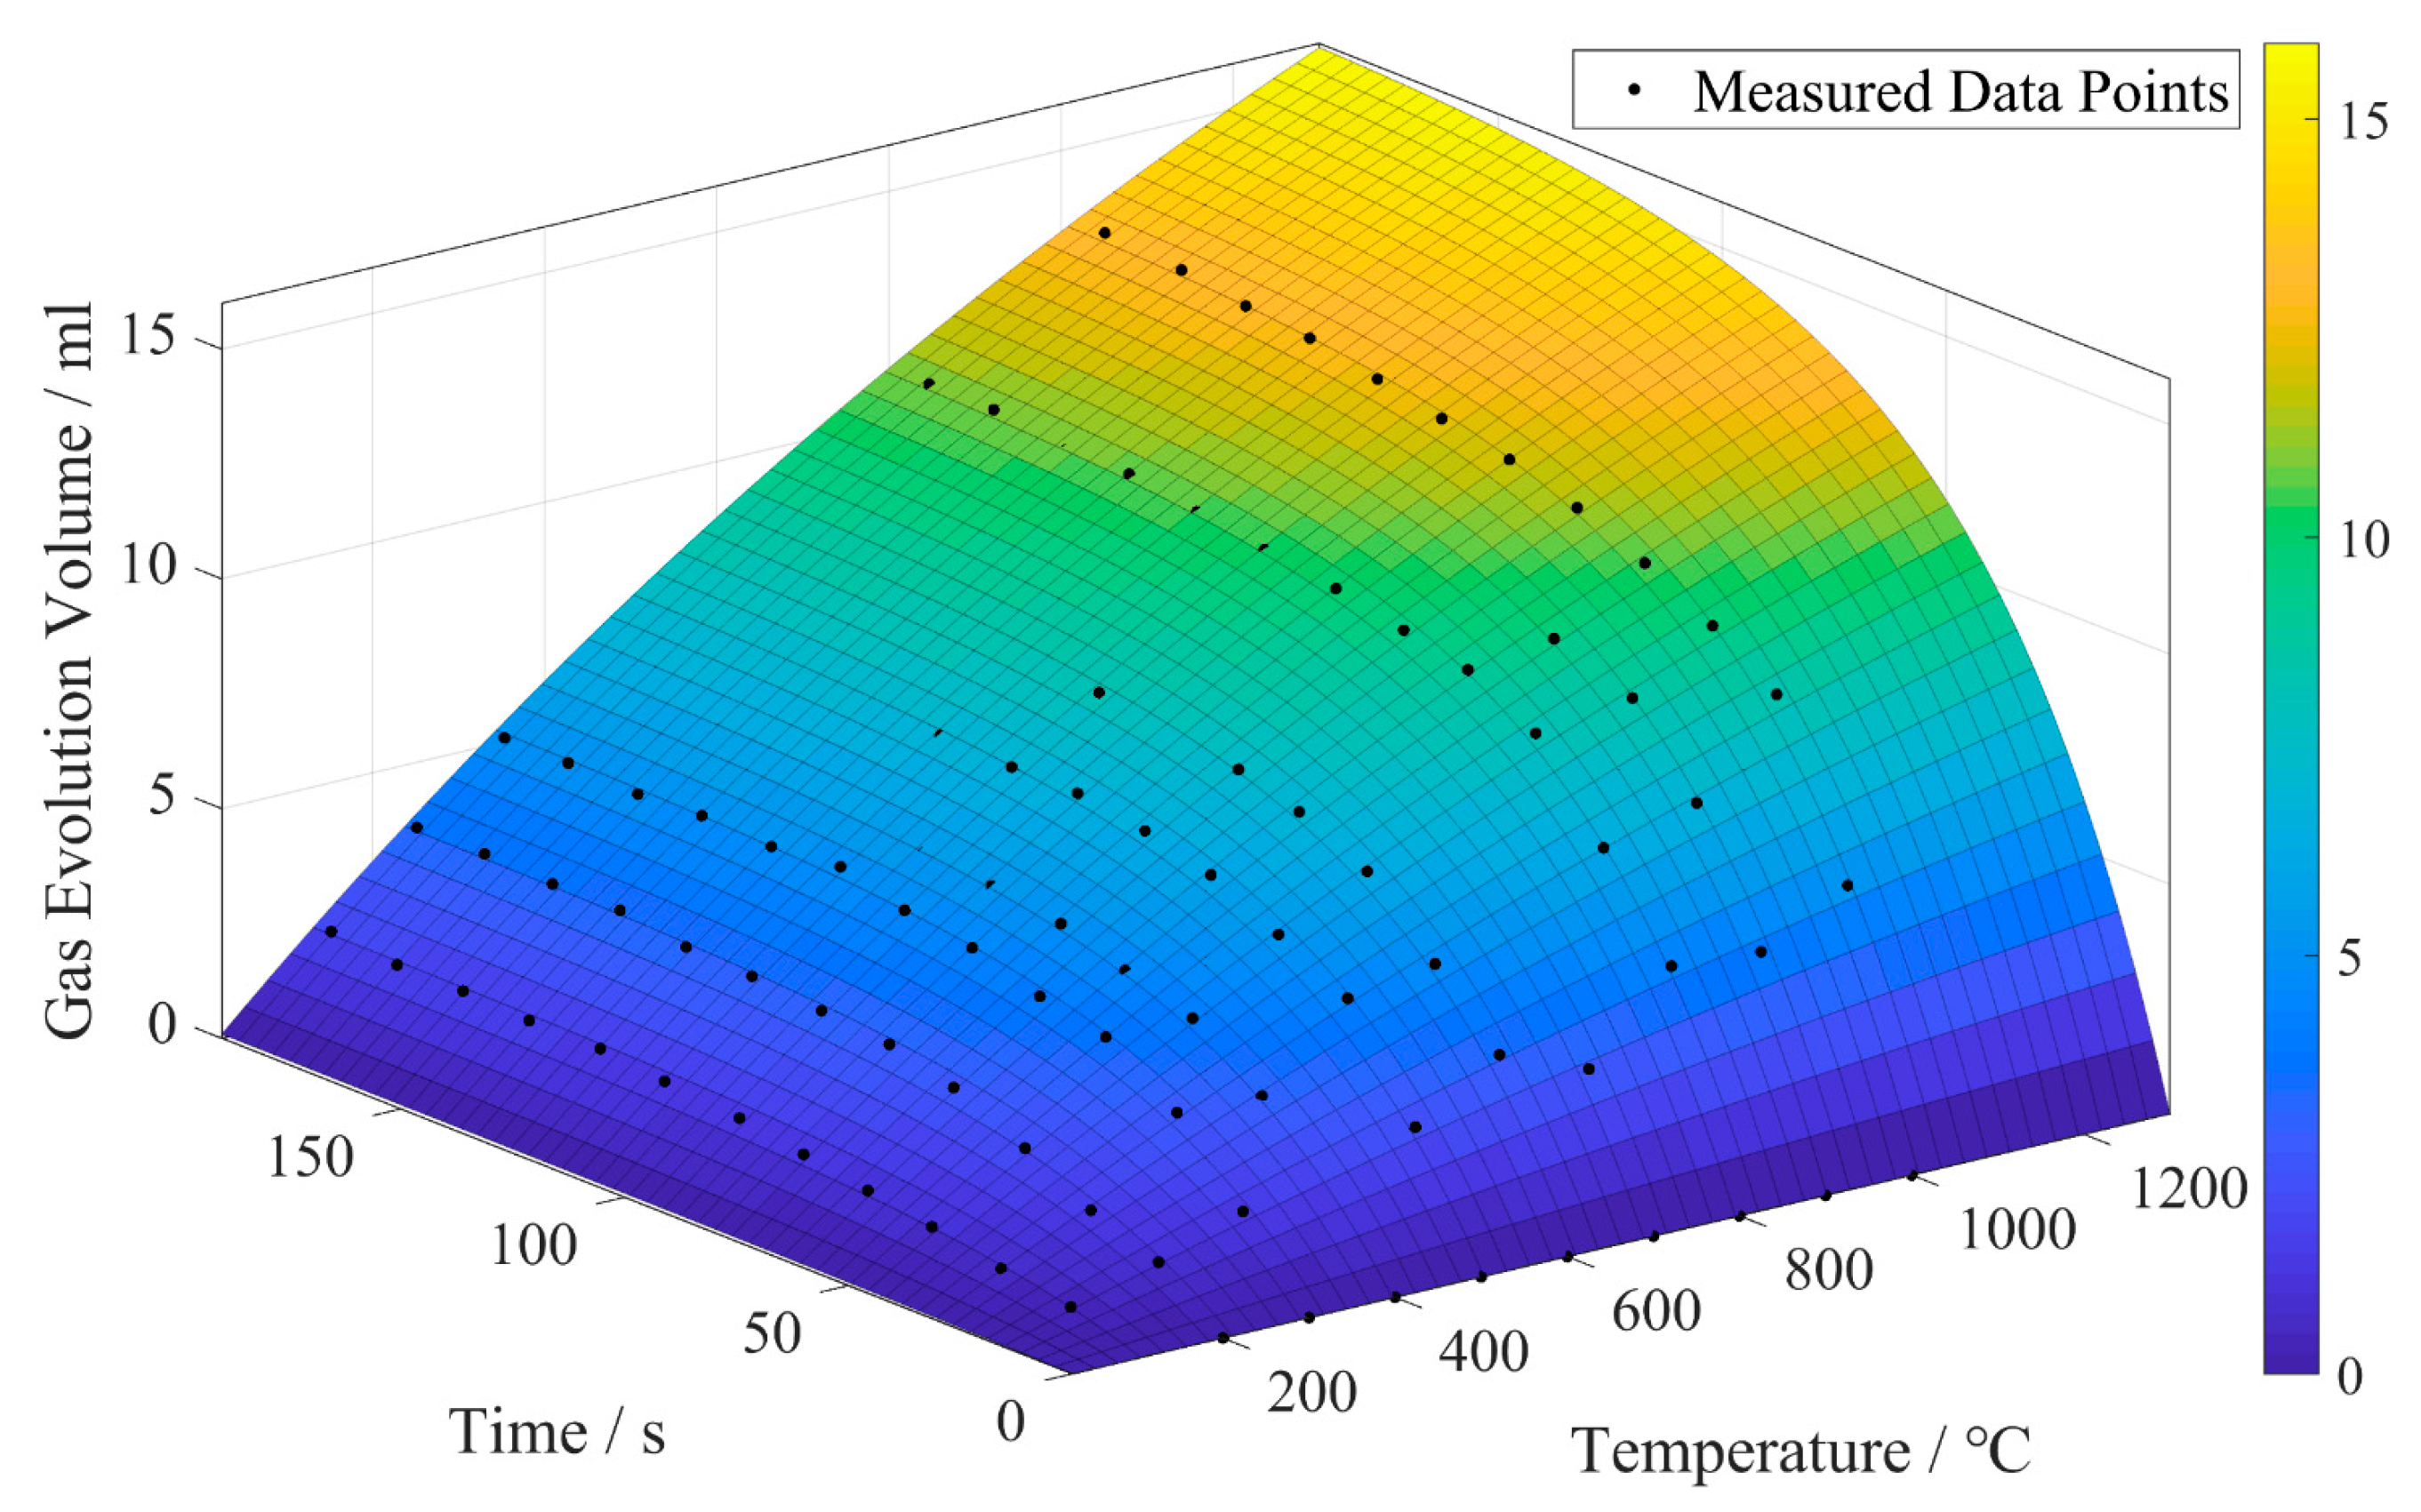
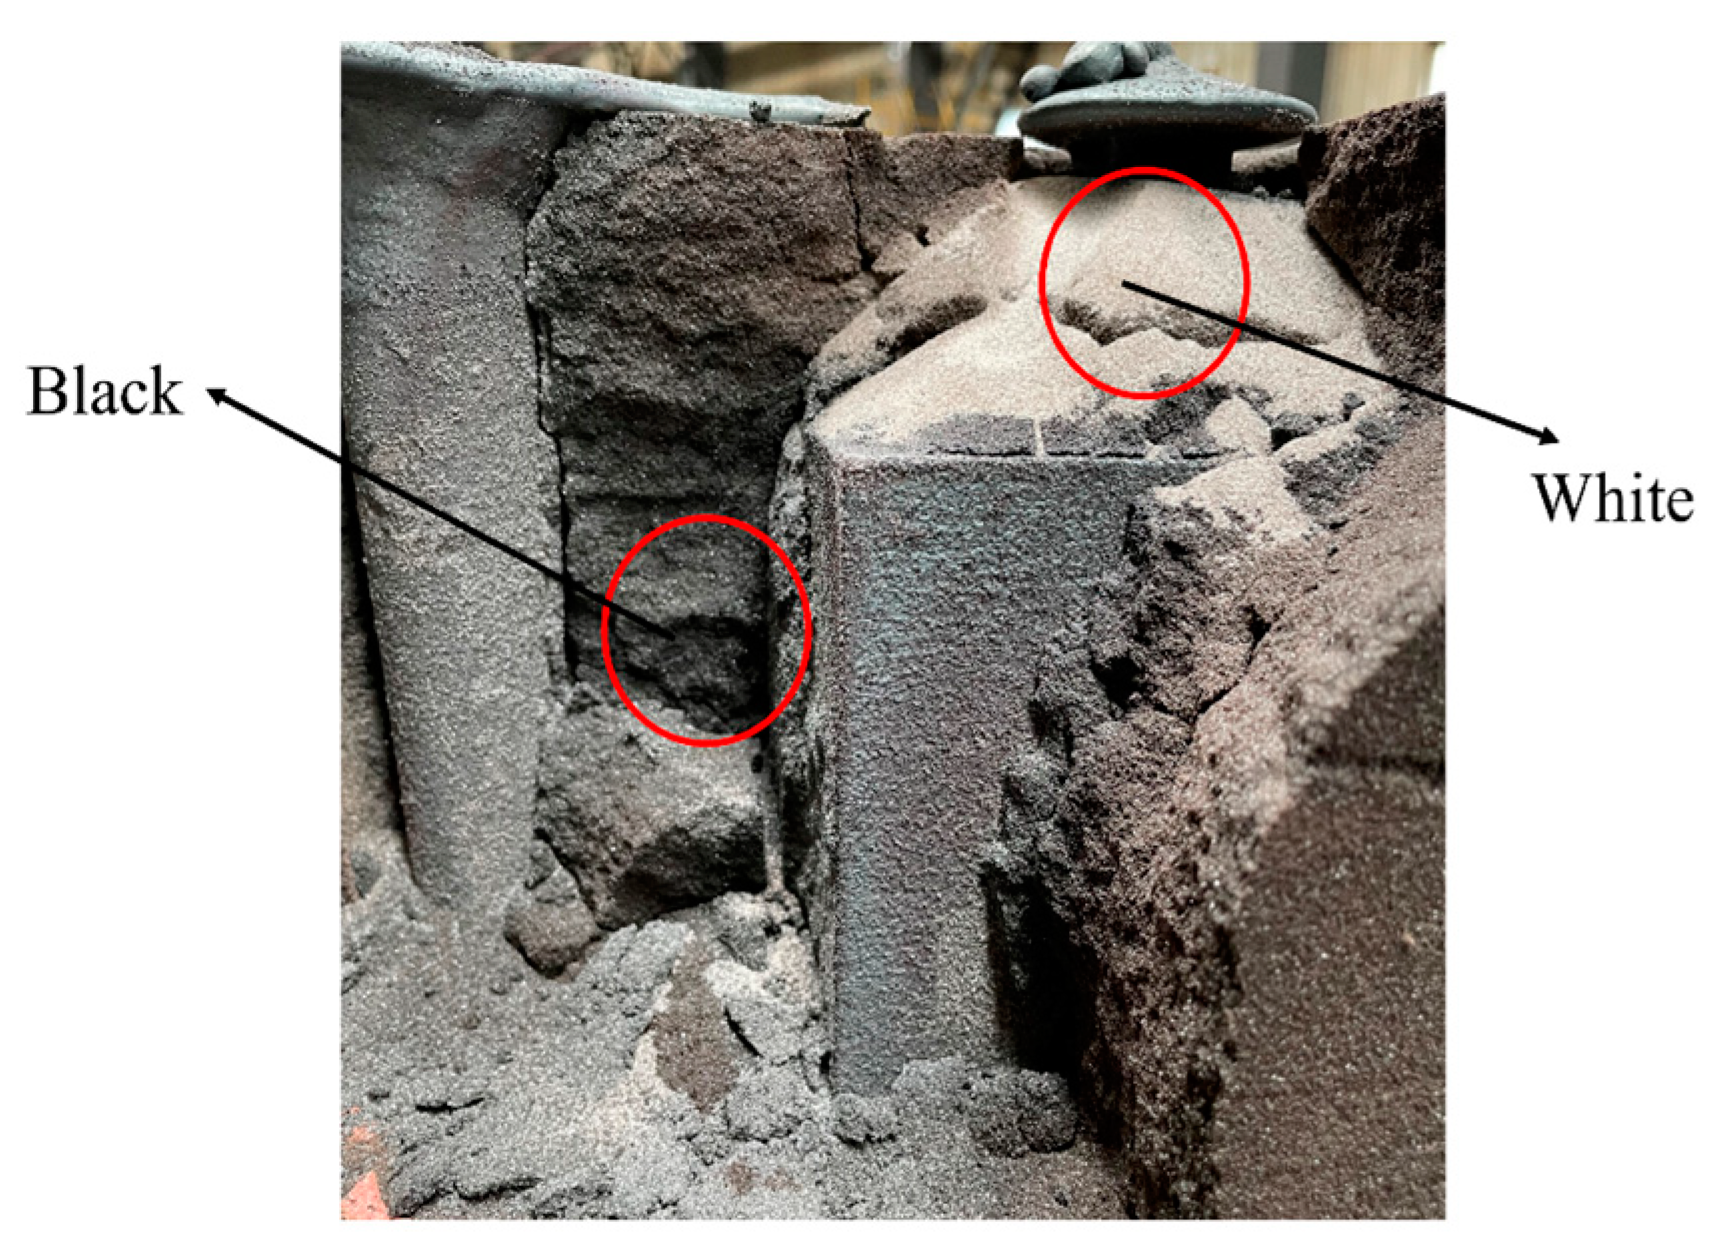
- Since the sand core was wrapped in molten metal, the air gaps inside the core were unable to fully support the combustion of the products of the pyrolysis of the binder. After the binder was burnt, residual carbon accumulated, resulting in blackened internal resin sand. However, on the surface or area with cracks, the burnt surface resin sand turns white. The gas volume generated by the burnt resin sand under anaerobic conditions is 30.7% higher than that in contact with air. Therefore, there is more gas released in the core than the amount found using a calculation based on a gas evolution test of core sand, which is carried out in conditions with enough air. Traditional gas evolution testing of mold or core sand should be modified to the state of the sand sample so that it may be insulated from the air.
Author Contributions
Funding
Institutional Review Board Statement
Informed Consent Statement
Data Availability Statement
Conflicts of Interest
References
- Bargaoui, H.; Azzouz, F.; Thibault, D.; Cailletaud, G. Thermomechanical Behavior of Resin Bonded Foundry Sand Cores during Casting. J. Mater. Process. Technol. 2017, 246, 30–41. [Google Scholar] [CrossRef]
- Samuels, G.; Beckermann, C. Measurement of Gas Evolution from PUNB Bonded Sand as a Function of Temperature. Int. J. Met. 2012, 6, 23–40. [Google Scholar] [CrossRef]
- Wan, P.; Zhou, J.; Li, Y.; Yin, Y.; Peng, X.; Ji, X.; Shen, X. Kinetic Analysis of Resin Binder for Casting in Combustion Decomposition Process. J. Therm. Anal. Calorim. 2022, 147, 6323–6336. [Google Scholar] [CrossRef]
- Zhang, B.; Garro, M.; Chautard, D.; Tagliano, C. Gas Evolution from Resin-Bonded Sand Cores Prepared by Various Processes. Metall. Sci. Tecnol. 2002, 20, 27–32. [Google Scholar]
- Bobrowski, A.; Holtzer, M.; Danko, R.; Zymankowska-Kumon, S. Analysis of Gases Emitted during a Thermal Decomposition of the Selected Phenolic Binders. Metal. Int. 2013, 18, 259–261. [Google Scholar]
- Holtzer, M.; Dańko, R.; Piasny, S.; Kubecki, M.; Drożyński, D.; Roczniak, A.; Skrzyński, M.; Kmita, A. Research on the Release of Dangerous Compounds from the BTEX and PAHs Groups in Industrial Casting Conditions. Materials 2021, 14, 2581. [Google Scholar] [CrossRef] [PubMed]
- Zych, J.; Mocek, J. Kinetics of Gas Emissions from Moulding and Core Sands, Gasification Patterns and Protective Coatings—The New Investigation Method. Manuf. Technol. 2017, 17, 126–131. [Google Scholar] [CrossRef]
- Walker, J.; Harris, E.; Lynagh, C.; Beck, A.; Lonardo, R.; Vuksanovich, B.; Thiel, J.; Rogers, K.; Conner, B.; MacDonald, E. 3D Printed Smart Molds for Sand Casting. Int. J. Met. 2018, 12, 785–796. [Google Scholar] [CrossRef] [Green Version]
- Walker, J.M.; Prokop, A.; Lynagh, C.; Vuksanovich, B.; Conner, B.; Rogers, K.; Thiel, J.; MacDonald, E. Real-Time Process Monitoring of Core Shifts during Metal Casting with Wireless Sensing and 3D Sand Printing. Addit. Manuf. 2019, 27, 54–60. [Google Scholar] [CrossRef]
- Zhang, A.; Su, D.; Li, C.; Zhang, Y.; Jiang, B.; Pan, F. Investigation of Bubble Dynamics in a Micro-Channel with Obstacles Using a Conservative Phase-Field Lattice Boltzmann Method. Phys. Fluids 2022, 34, 043312. [Google Scholar] [CrossRef]
- Liu, J.; Du, H.; Xu, H.; Zhang, J.; Zhao, K. Gas Volume Prediction in Sand Core for Aluminum Alloy Cylinder Head and Processing Optimization Based on AnyCasting Software. Spec. Cast. Nonferrous Alloy 2019, 39, 1301–1304. [Google Scholar] [CrossRef]
- Guofa, M.; Xiangyu, L.; Kuangfei, W.; Hengzhi, F. Numerical Simulation of Low Pressure Die-Casting Aluminum Wheel. China Foundry 2009, 6, 48–52. [Google Scholar]
- Yang, L.; Zhao, L.; Zhang, Q.; Zhou, T. Numerical Simulation Analysis of Aluminium Alloy Wheels Casting Defects and Casting Process Optimization. In Proceedings of the Materials Performance, Modeling and Simulation; Han, Y., Liu, X., Lv, G.H., Eds.; Trans Tech Publications Ltd.: Stafa-Zurich, Switzerland, 2013; Volume 749, pp. 125–132. [Google Scholar]
- Deng, C.; Kang, J.; Shangguan, H.; Hu, Y.; Huang, T.; Liu, Z. Effects of Hollow Structures in Sand Mold Manufactured Using 3D Printing Technology. J. Mater. Process. Technol. 2018, 255, 516–523. [Google Scholar] [CrossRef]
- Kang, J.; Ma, Q. The Role and Impact of 3D Printing Technologies in Casting. China Foundry 2017, 14, 157–168. [Google Scholar] [CrossRef] [Green Version]
- Trick, K.A.; Saliba, T.E. Mechanisms of the Pyrolysis of Phenolic Resin in a Carbon/Phenolic Composite. Carbon 1995, 33, 1509–1515. [Google Scholar] [CrossRef]
- Sobera, M.; Hetper, J. Pyrolysis–Gas Chromatography–Mass Spectrometry of Cured Phenolic Resins. J. Chromatogr. A 2003, 993, 131–135. [Google Scholar] [CrossRef] [PubMed]
- Dungan, R.S.; Reeves, J.B., III. Pyrolysis of Foundry Sand Resins: A Determination of Organic Products by Mass Spectrometry. J. Environ. Sci. Health Part A 2005, 40, 1557–1567. [Google Scholar] [CrossRef] [PubMed]
- Shindo, A.; Izumino, K. Structural Variation during Pyrolysis of Furfuryl Alcohol and Furfural-Furfuryl Alcohol Resins. Carbon 1994, 32, 1233–1243. [Google Scholar] [CrossRef]
- Wang, J.; Jiang, N.; Jiang, H. The Analysis of the Pyrolysis Structure of B4C Modified Furan Resin Using FT-IR Spectroscopy. In Proceedings of the China Functional Material Technology and Industry High-Level Forum, Zhenjiang, China, 7 November 2009; pp. 315–318. [Google Scholar]
- Wang, J.; Jiang, H.; Jiang, N. Study on the Pyrolysis of Phenol-Formaldehyde (PF) Resin and Modified PF Resin. Thermochim. Acta 2009, 496, 136–142. [Google Scholar] [CrossRef]
- Wang, L.; Wang, Z.; Chen, W.; Tan, M.; Yuan, Y.; Ji, B. Reduction of Chemical Kinetic Mechanism for High-Temperature Pyrolysis Products of Phenolic Resin. J. Nanjing Univ. Aeronaut. Astronaut. 2020, 52, 131–134. [Google Scholar] [CrossRef]


| Scheme | Core Print Structure | Venting Hole/mm |
|---|---|---|
| 1 | Blind hole | 25 × 25 × 50 |
| 2 | Through-hole | 25 × 25 × 50 |
| 3 | Through-hole | 50 × 50 × 50 |
| Element | C | Si | Mn | P | S | Fe |
|---|---|---|---|---|---|---|
| Content | 3.12 | 1.56 | 0.9 | 0.1 | 0.12 | Balance |
| Scheme | Core Print Structure | Measurement Items | |
|---|---|---|---|
| No. 1 | No. 2 | ||
| 1 | Blind hole | Tcast v | / |
| 2 | Through-hole | Tcast Tcore v | Pfront |
| 3 | Through-hole | Tcore v | Pfront Psider |
| Scheme | Core Print Structure | Sand-to-Metal Ratio | Peak Pressure/kPa | Peak Speed/m·s−1 | Total Gas/mL |
|---|---|---|---|---|---|
| 1 | Blind hole | 0.284 | / | 1.10 | 98,265 |
| 2 | Through-hole | 0.284 | 0.41 | 1.82 | 89,700 |
| 3 | Through-hole | 0.266 | 1.09 | 1.89 | 108,776 |
| Name | Unit | Value |
|---|---|---|
| Sand | cm3 | 1 |
| Porosity | / | 40% |
| Density | g/cm3 | 1.6 |
| Entrapped air | mL | 0.4 |
| Entrapped O2 in | mL | 0.08 |
| Pyrolysis gas | mL | 25.6 |
| Gas Type | Gas Content/mol [22] | Redox Reaction Equation | Volume Change/mol |
|---|---|---|---|
| H2O | 0.258 | / | 0 |
| CH4 | 0.11 | CH4 + 2O2 = 2H2O + CO2 | 0 |
| CO | 0.063 | 2CO + O2 = 2CO2 | −0.0315 |
| H2 | 0.551 | 2H2 + O2 = 2H2O | −0.2755 |
| CO2 | 0.018 | / | 0 |
| Sum | 1 | −0.307 |
| Gas Type | Gas Content/mol | Entrapped O2/mol | Redox Reaction Equation | Volume Change/mol |
|---|---|---|---|---|
| H2O | 0.258 | / | 0 | |
| CH4 | 0.11 | / | 0 | |
| CO | 0.063 | 0.003 | 2CO + O2 = 2CO2 | −0.003 |
| H2 | 0.551 | / | 0 | |
| CO2 | 0.018 | / | 0 | |
| Sum | 1 | 0.003 | −0.003 |
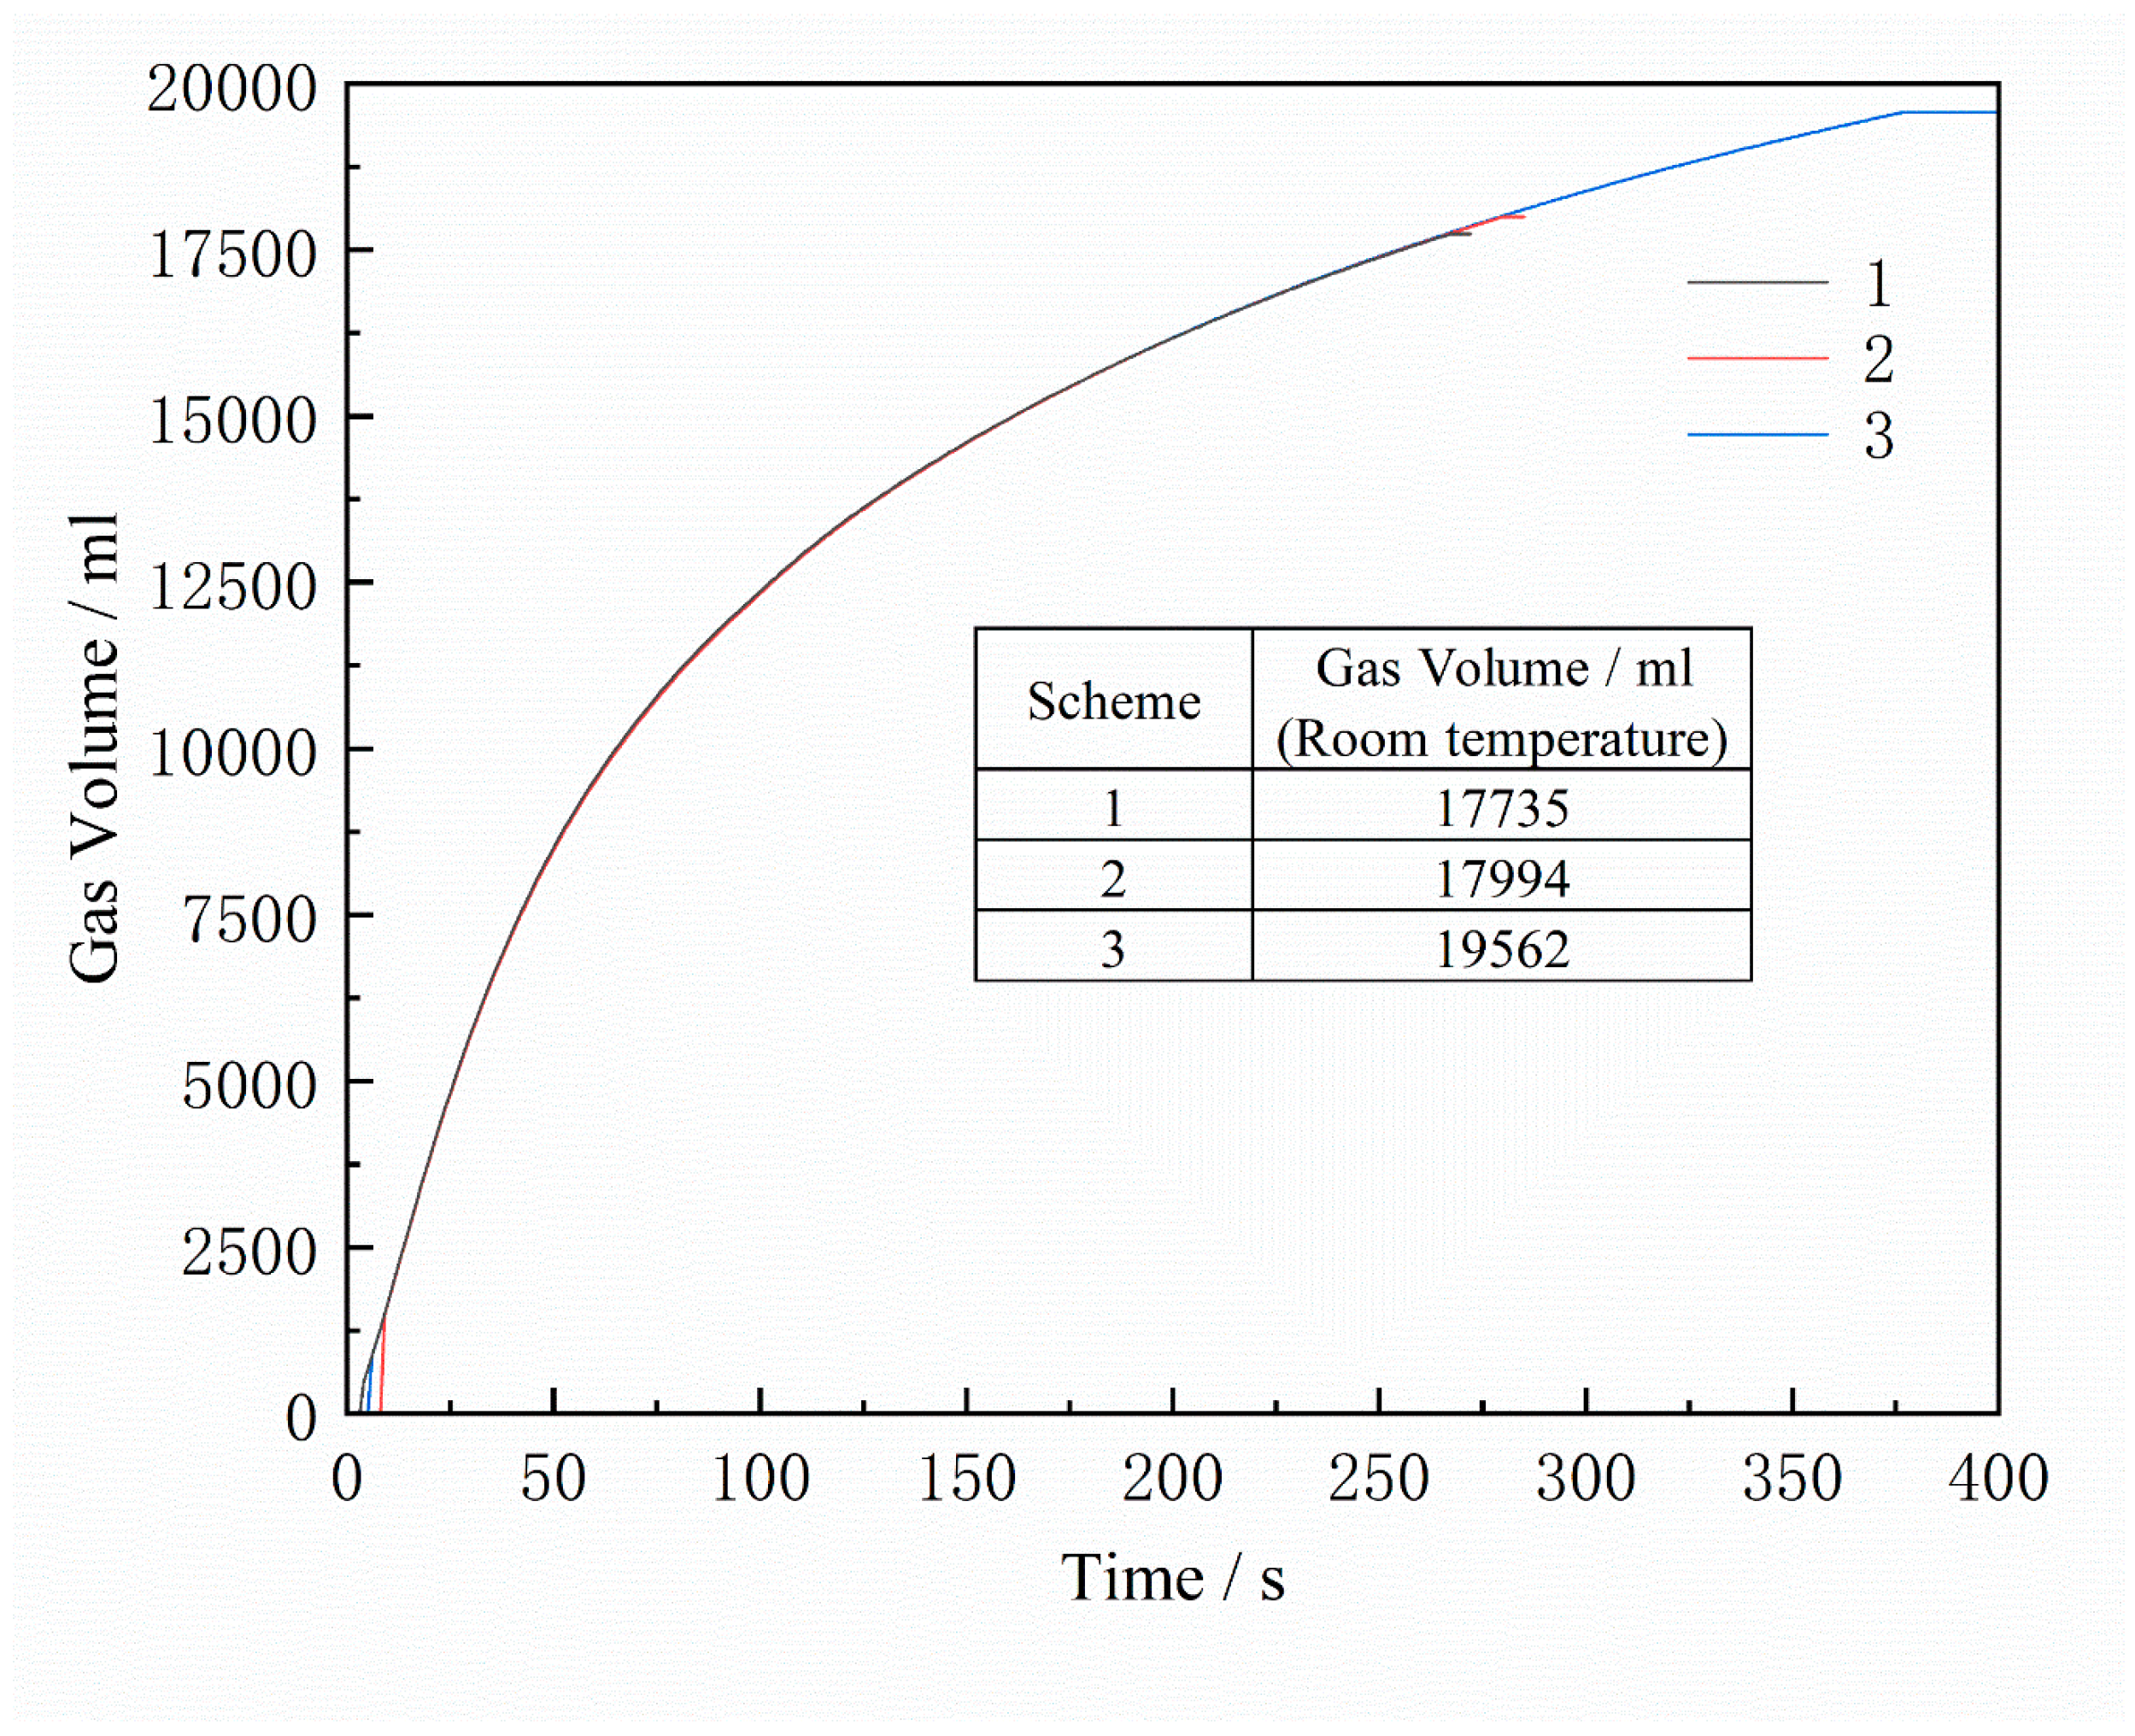
| Scheme | Simulated Gas Volume/mL (Room Temperature) | Tested Gas Volume/mL | |
|---|---|---|---|
| 900 °C | Room Temperature (25 °C) | ||
| 1 | 17,735 | 98,265 | 24,966 |
| 2 | 17,994 | 89,700 | 22,789 |
| 3 | 19,562 | 108,776 | 27,636 |
Disclaimer/Publisher’s Note: The statements, opinions and data contained in all publications are solely those of the individual author(s) and contributor(s) and not of MDPI and/or the editor(s). MDPI and/or the editor(s) disclaim responsibility for any injury to people or property resulting from any ideas, methods, instructions or products referred to in the content. |
© 2023 by the authors. Licensee MDPI, Basel, Switzerland. This article is an open access article distributed under the terms and conditions of the Creative Commons Attribution (CC BY) license (https://creativecommons.org/licenses/by/4.0/).
Share and Cite
Wang, X.; Wu, Q.; Huang, Y.; Li, N.; Wu, X.; Chen, X.; Wang, J.; Jing, T.; Huang, T.; Kang, J. Study on the Gas Release of 3D-Printed Furan Resin Sand Core during the Casting Process. Materials 2023, 16, 4152. https://doi.org/10.3390/ma16114152
Wang X, Wu Q, Huang Y, Li N, Wu X, Chen X, Wang J, Jing T, Huang T, Kang J. Study on the Gas Release of 3D-Printed Furan Resin Sand Core during the Casting Process. Materials. 2023; 16(11):4152. https://doi.org/10.3390/ma16114152
Chicago/Turabian StyleWang, Xiaolong, Qihua Wu, Yuhang Huang, Na Li, Xiongzhi Wu, Xiuming Chen, Jiwu Wang, Tao Jing, Tianyou Huang, and Jinwu Kang. 2023. "Study on the Gas Release of 3D-Printed Furan Resin Sand Core during the Casting Process" Materials 16, no. 11: 4152. https://doi.org/10.3390/ma16114152