
Empirical Study of Surface Deterioration Analysis Based on Random Fields for Reinforced Concrete Structures in Marine Environment

Abstract
:1. Introduction
- (1)
- The accuracy of the surface deterioration analysis based on random fields is unclear [15]. The verification of the method according to the in-situ inspection data of the existing structures is necessary.
- (2)
- Many studies employed the surface deterioration analysis in newly-built structures [7,10,15], while much fewer studies focused on its application in existing structures, which, in addition, involves the extraction of statistical properties from the inspection data, the interpretation of the grading criteria in the inspection, etc.
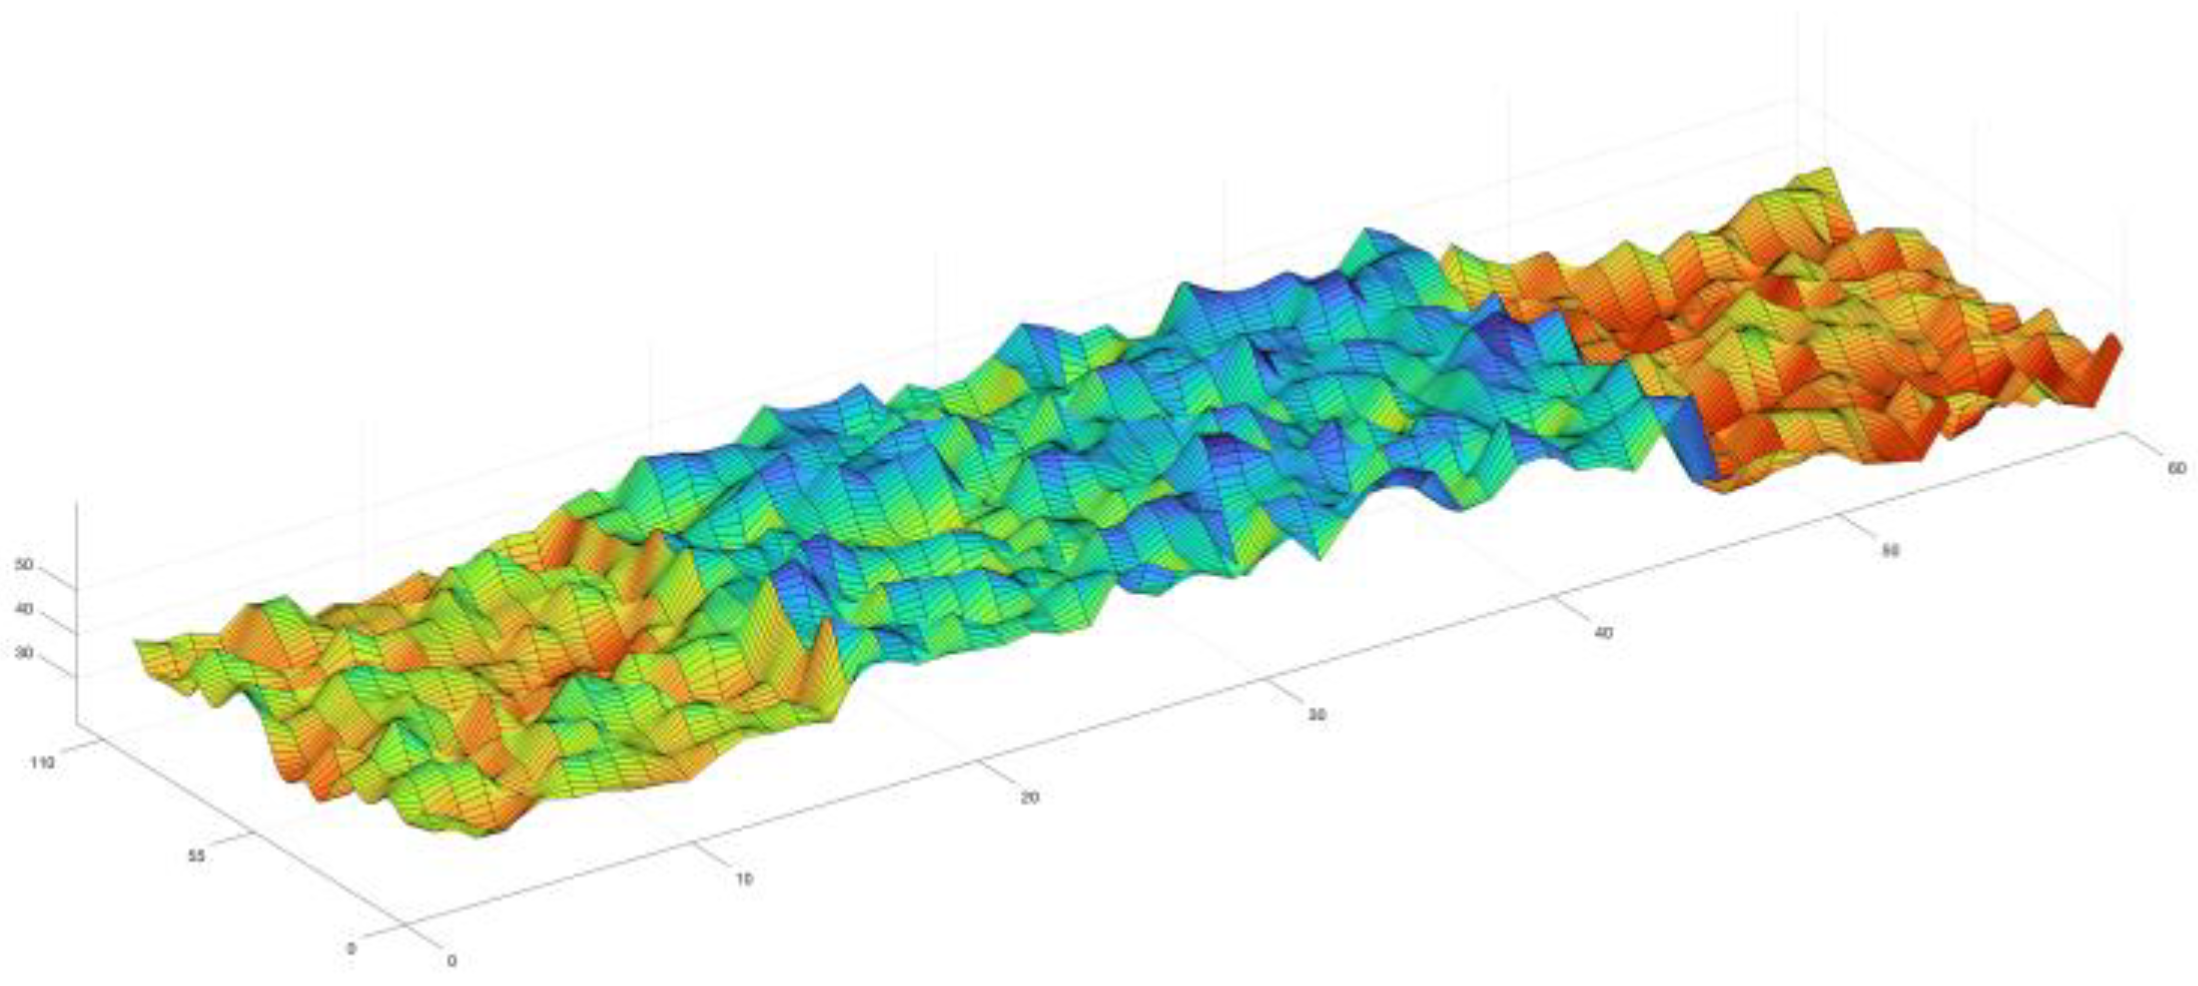
2. Random Field Modeling
- 1.
- Categorize the data by the batch, and for batch , the inspection results are denoted as ; then
- 2.
- Calculate the mean value of the data from the same batch, , which are considered the measures for the random variable ; then
- 3.
- Calculate the sample mean, , and sample variance, , of the collection , and regard them as the estimation for and ; then
- 4.
- Collect the data , calculate its sample variance, , and regard it as the estimation for .
3. Surface Deterioration Models
- (1)
- Chloride-ingress: The chloride ion from the outer environment penetrates into the concrete cover mainly through diffusion, leading to the increase of chloride content in the concrete. When the chloride content around the steel reaches the critical level , it is considered that the corrosion of the steel initiates. Fick’s Second Law is often used to model the process [22], and with the aging effect considered [23], the time duration of this phase can be calculated by Equation (4).
- (2)
- Crack initiation: The corrosion product fills the porous area around the steel and then exerts pressure on the surrounding concrete, leading to surface cracking. Models were developed to predict the time duration of this phase [24,25,26,27], and based on the results from long-term in-situ experiments by [26], Equation (5) was suggested in [10] and adopted in this research.
- (3)
- Crack propagation: The surface crack will propagate in width as the corrosion product on the steel surface is cumulating; as suggested by [28], the transition of the corrosion pattern from pitting corrosion to general corrosion may occur in this phase. The crack width under the pitting corrosion pattern and under the general corrosion pattern can be calculated by Equations (6) and (7), respectively, as suggested by [29,30]; the transition modeling method by [10] is adopted in this study.
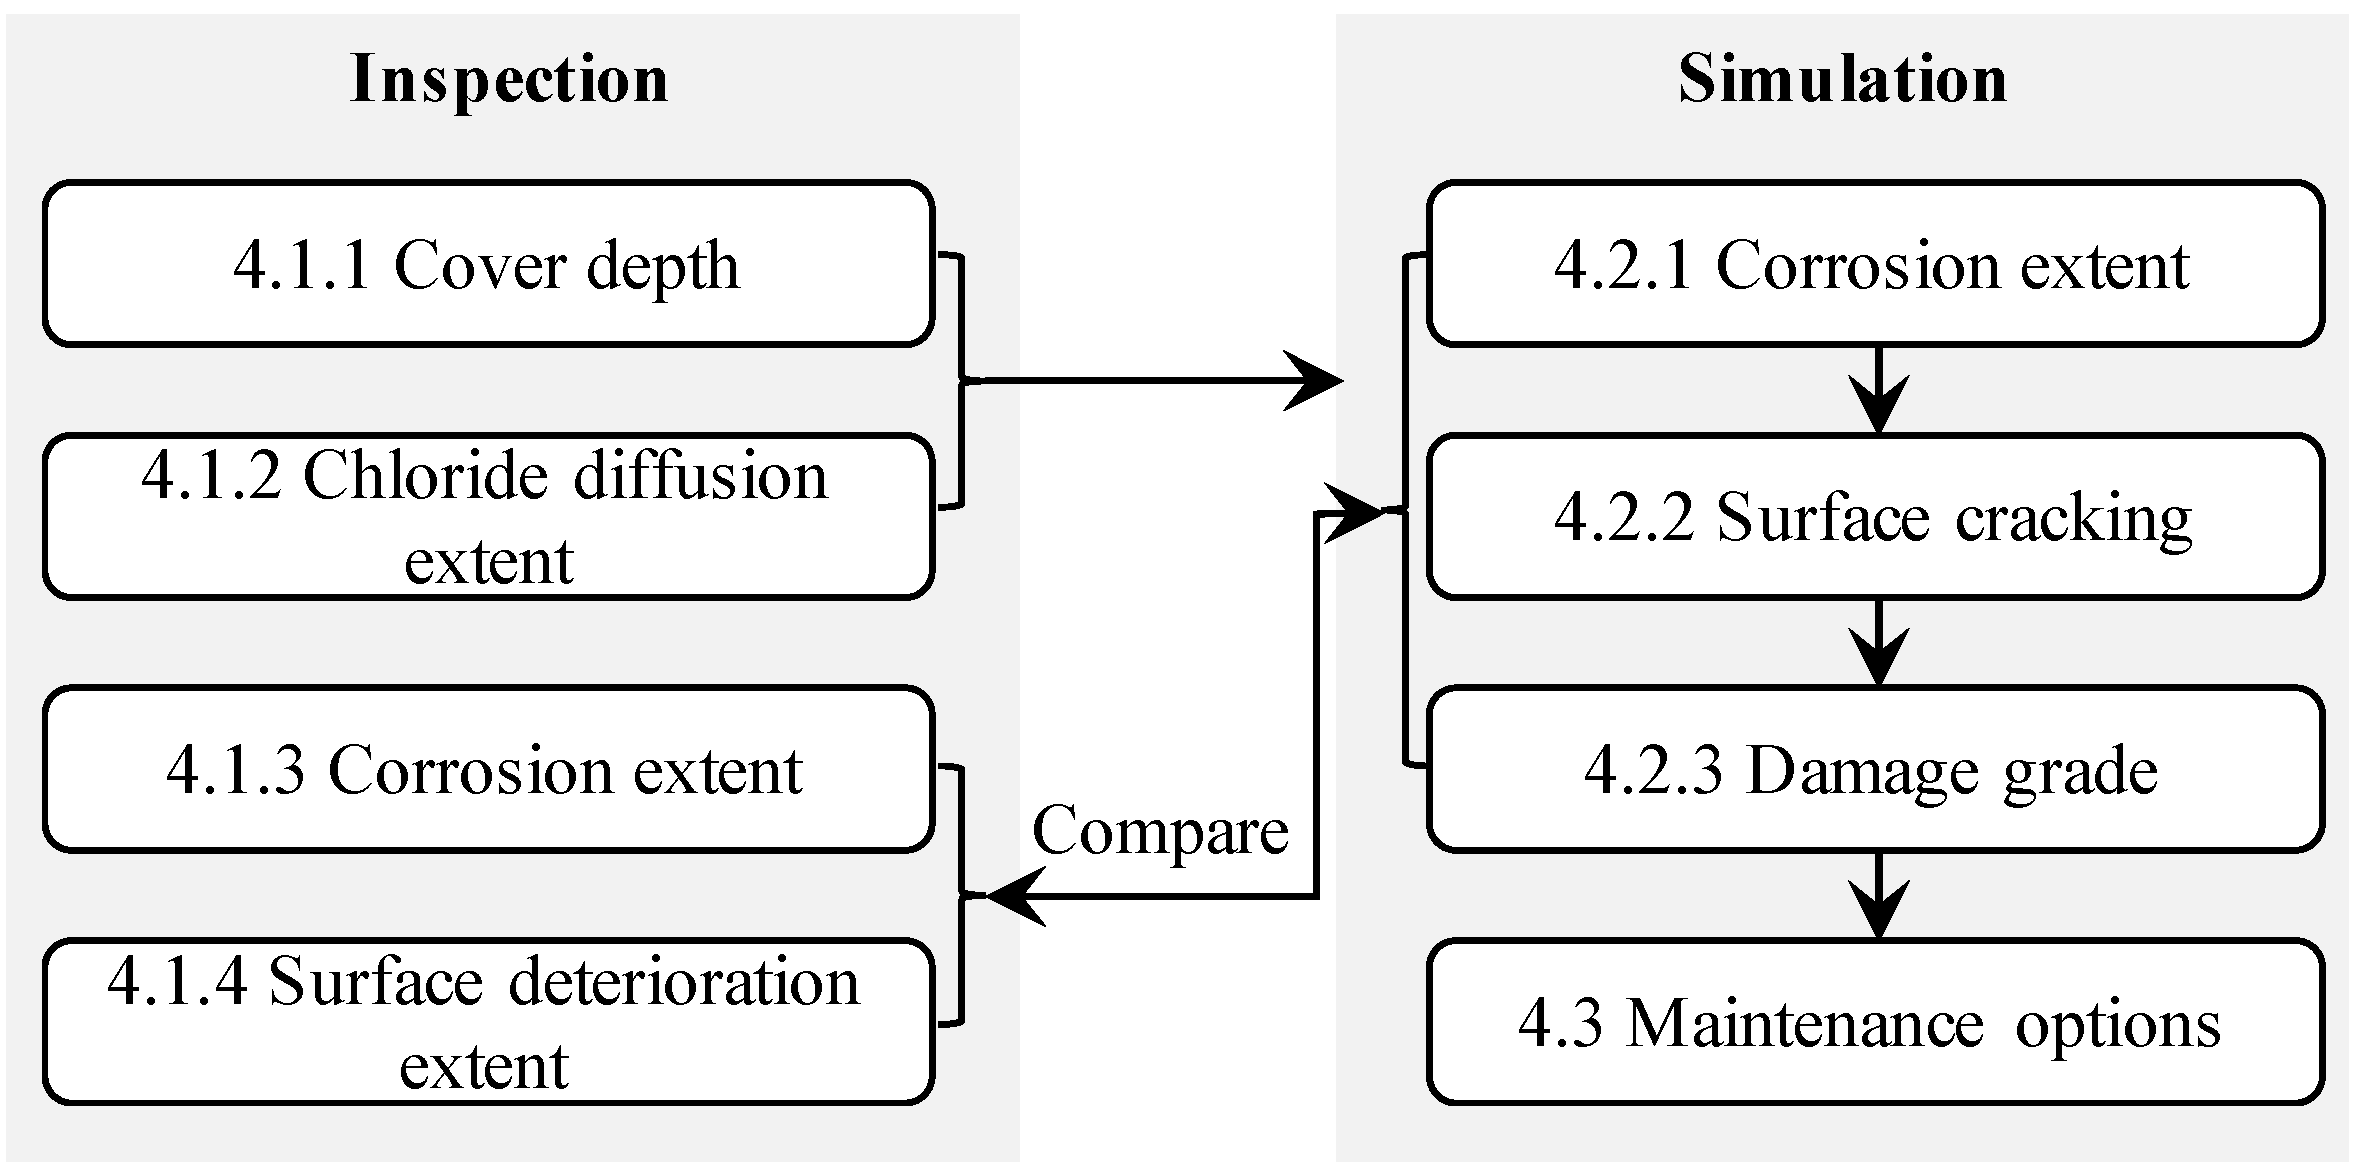
4. Empirical Study of Surface Deterioration Analysis
4.1. Inspection Results
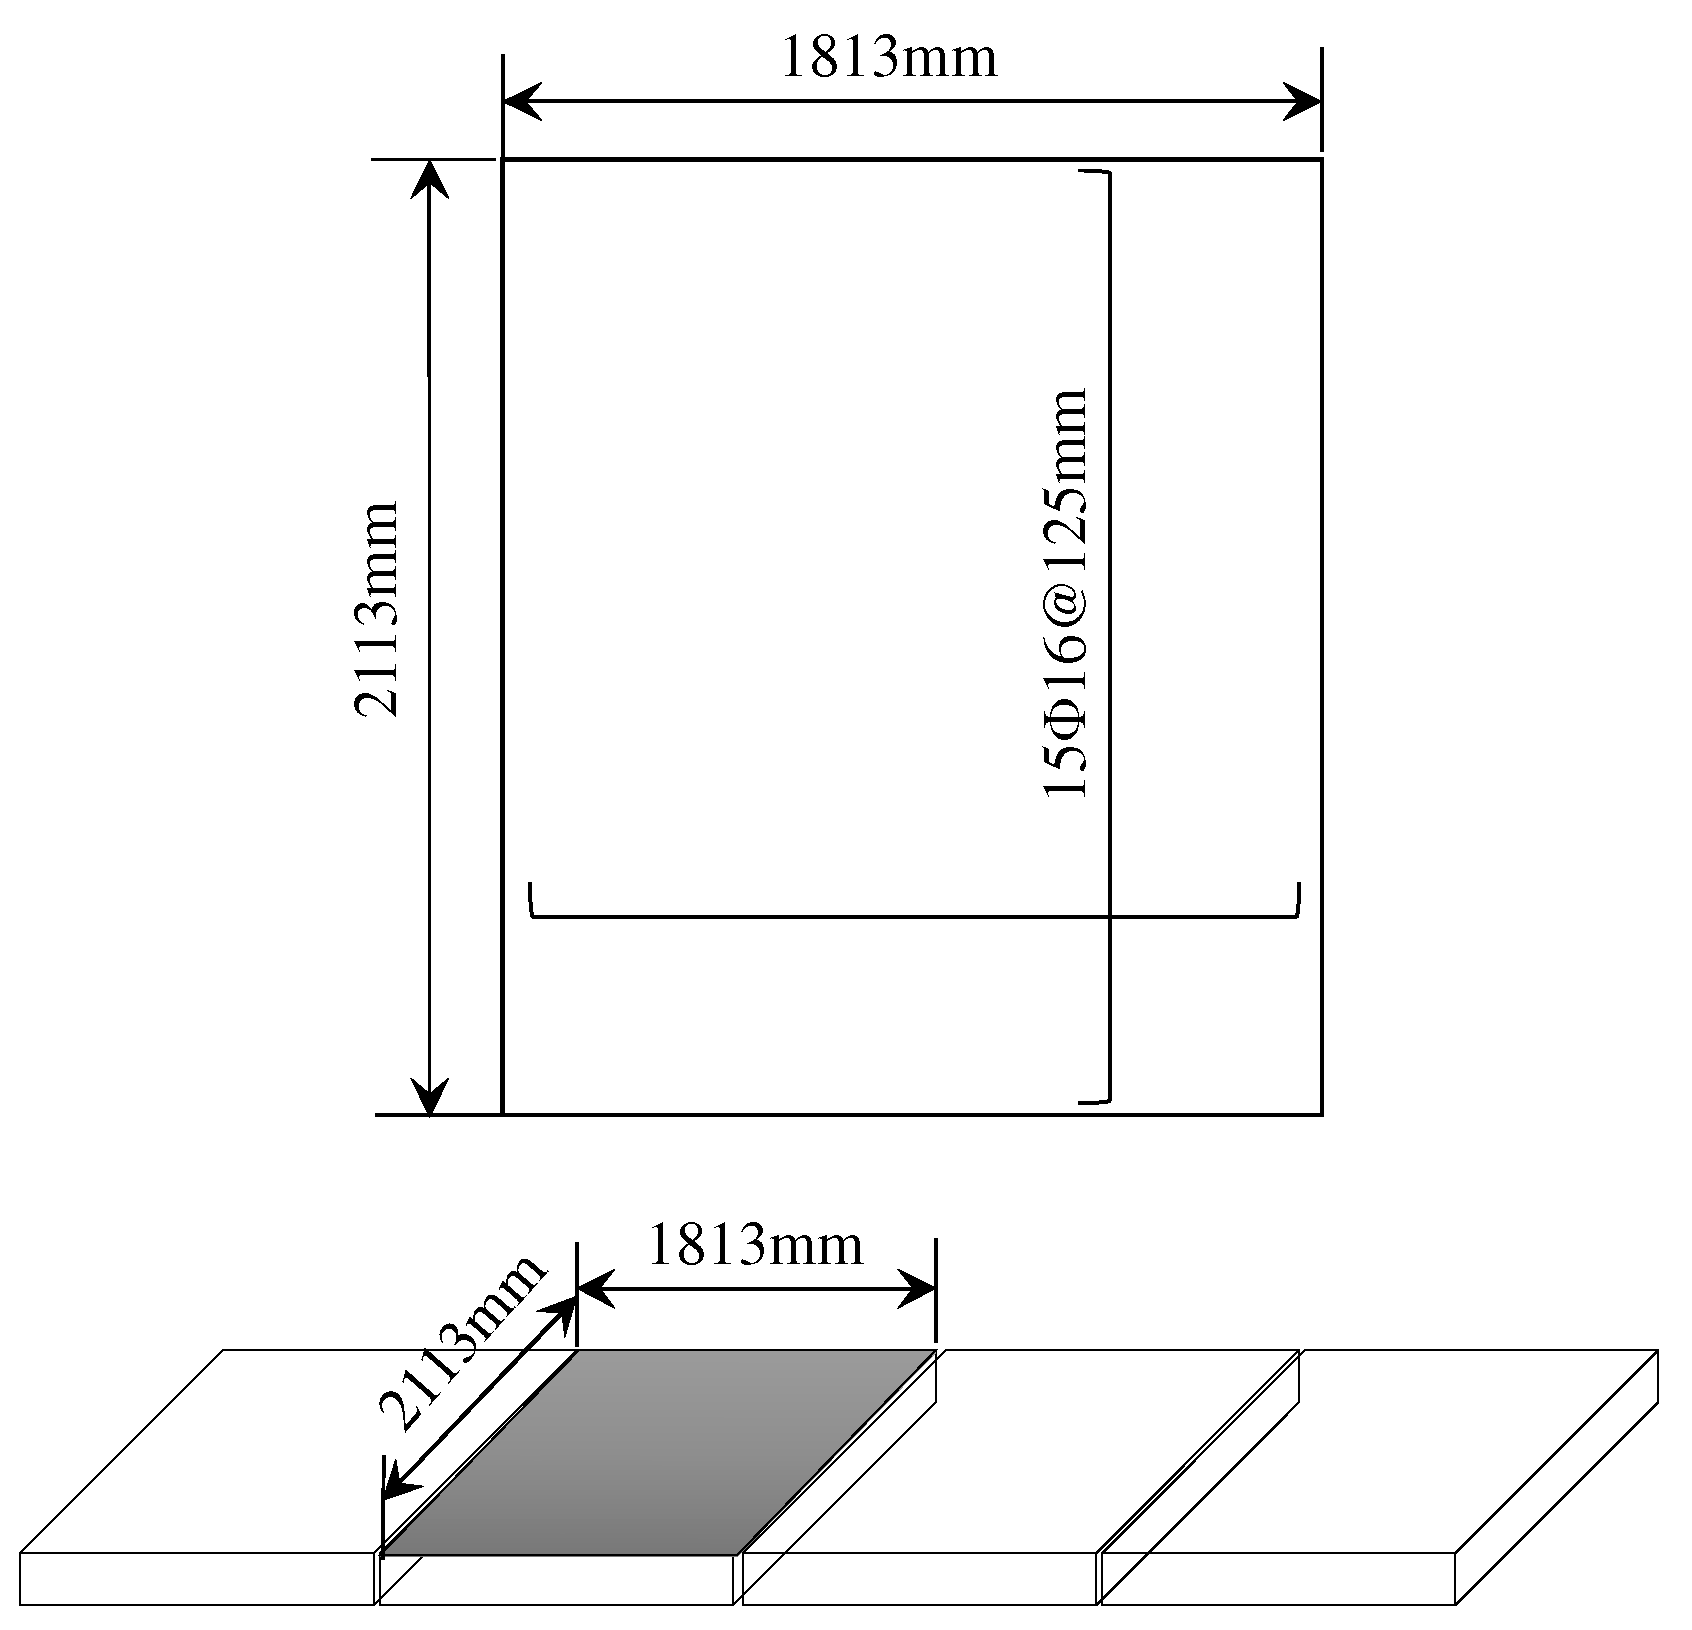
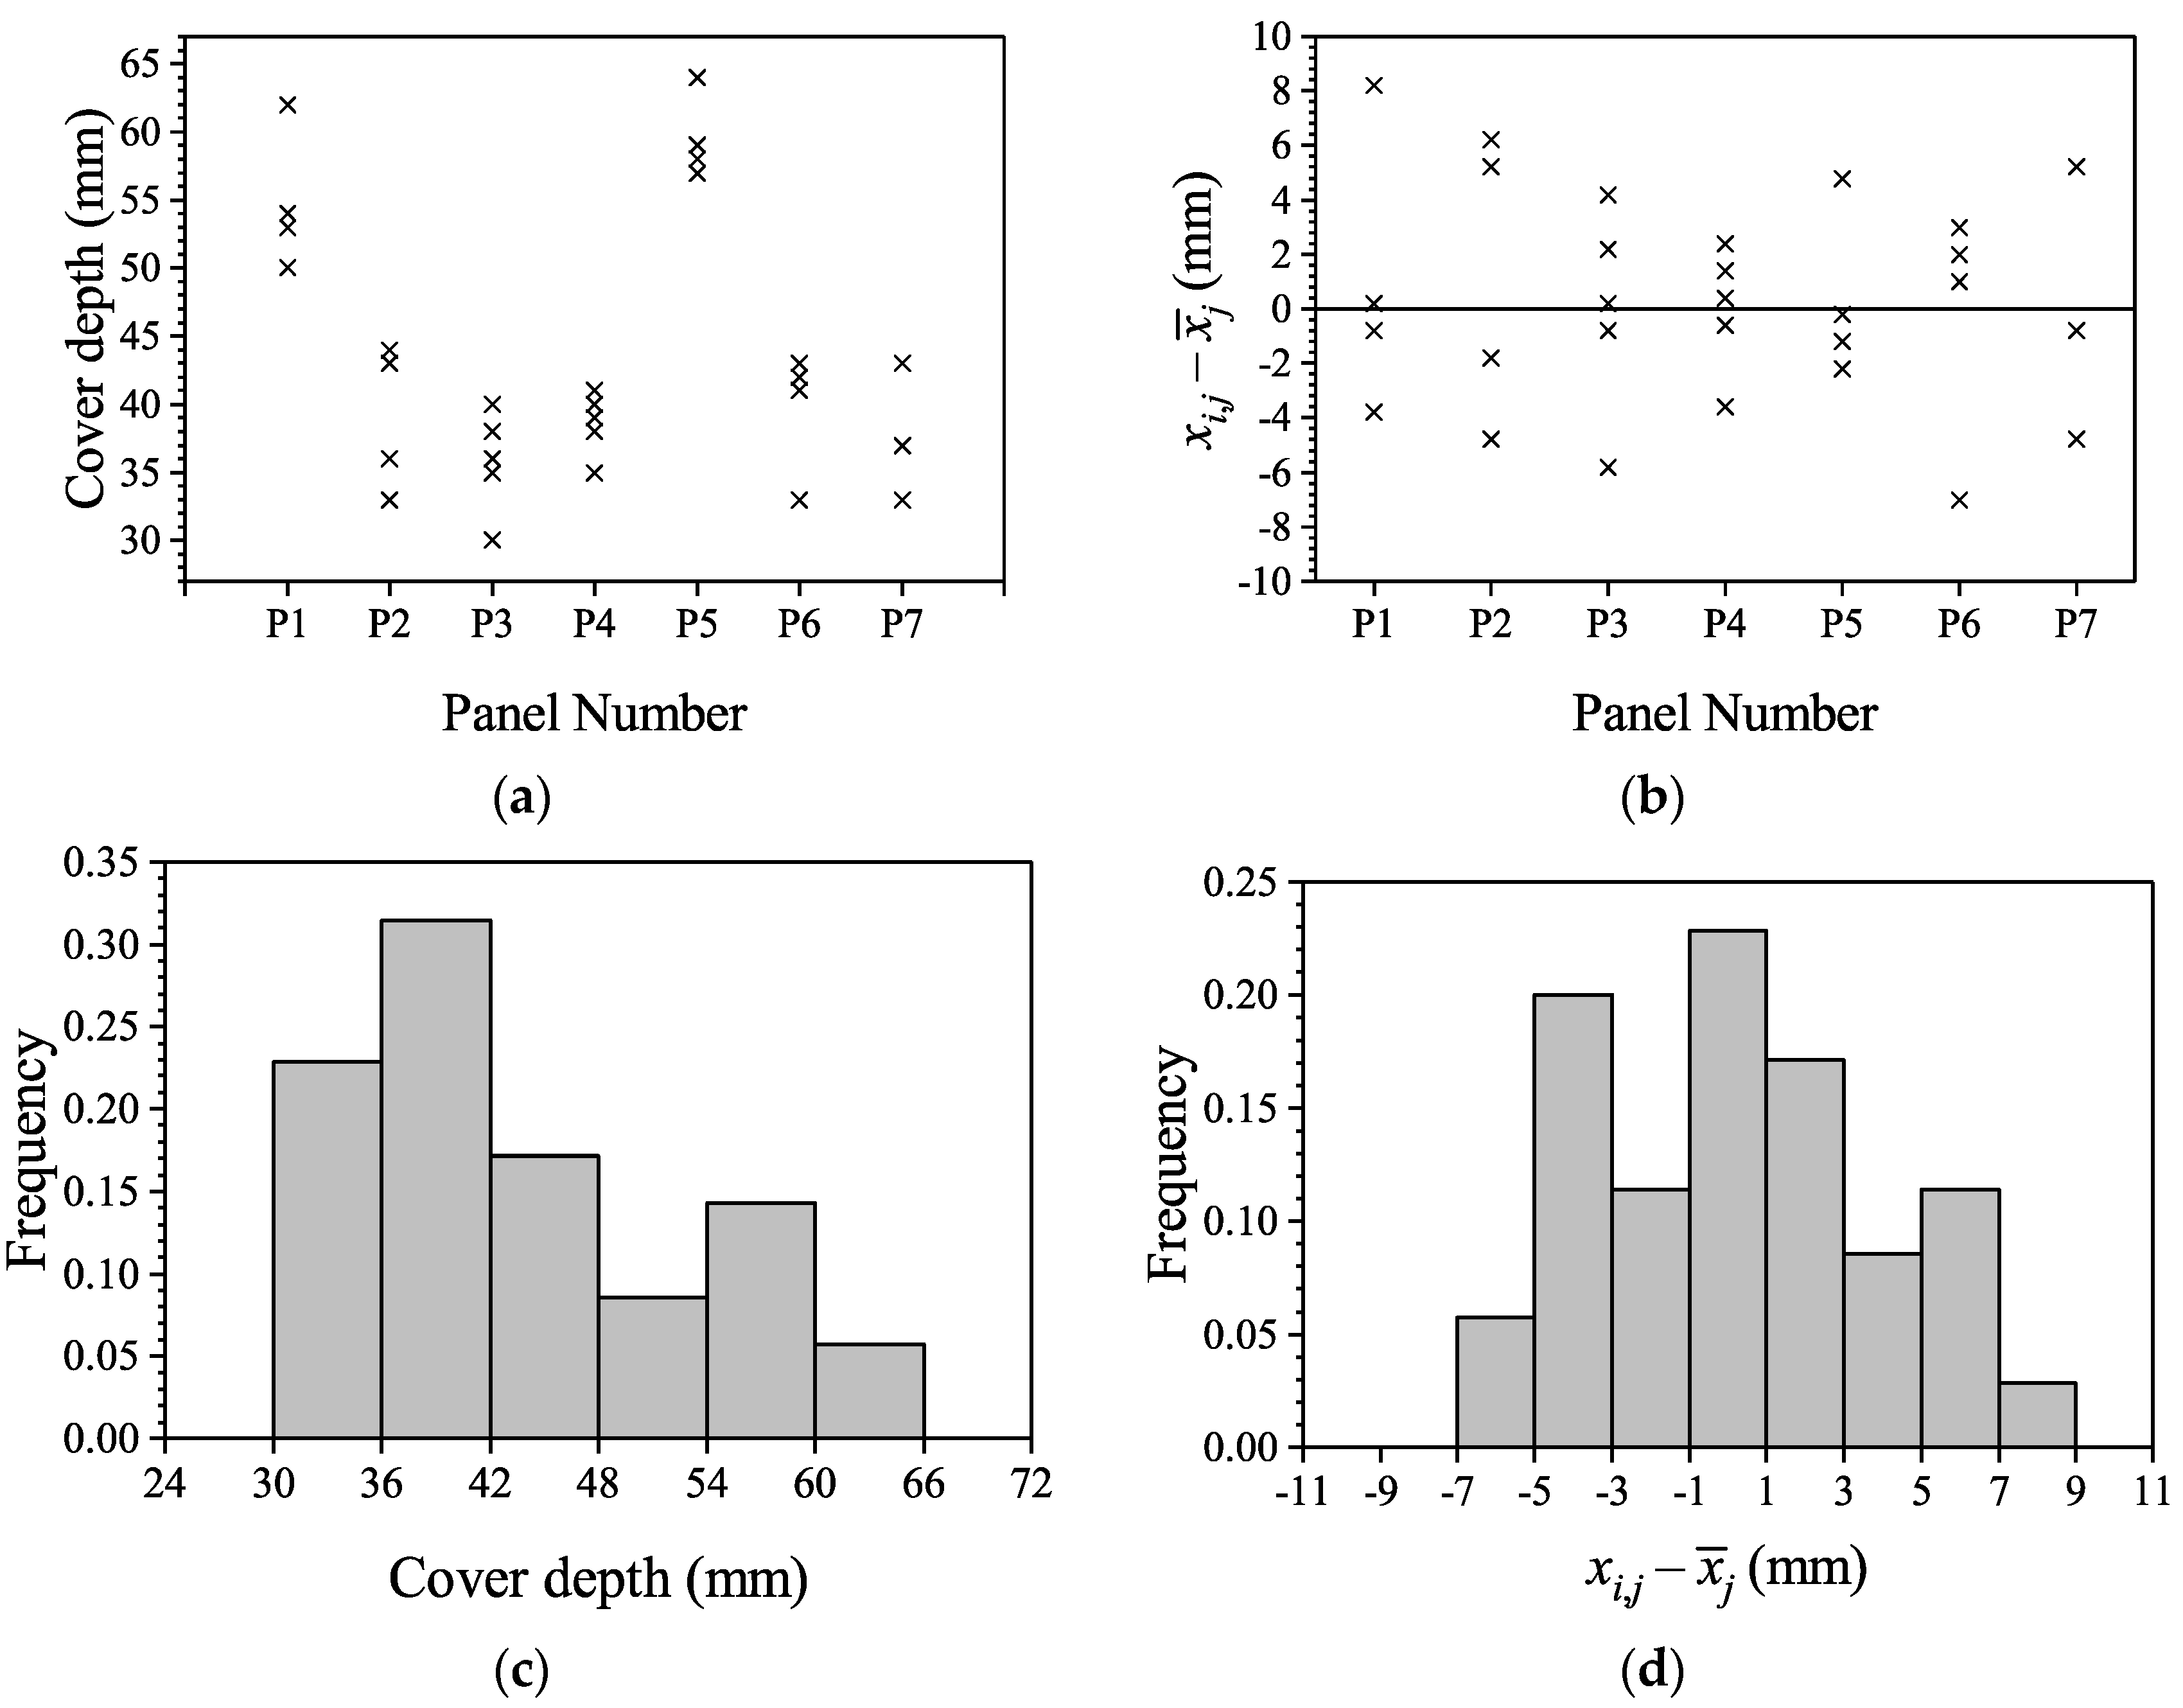
4.1.1. Concrete Cover Depth
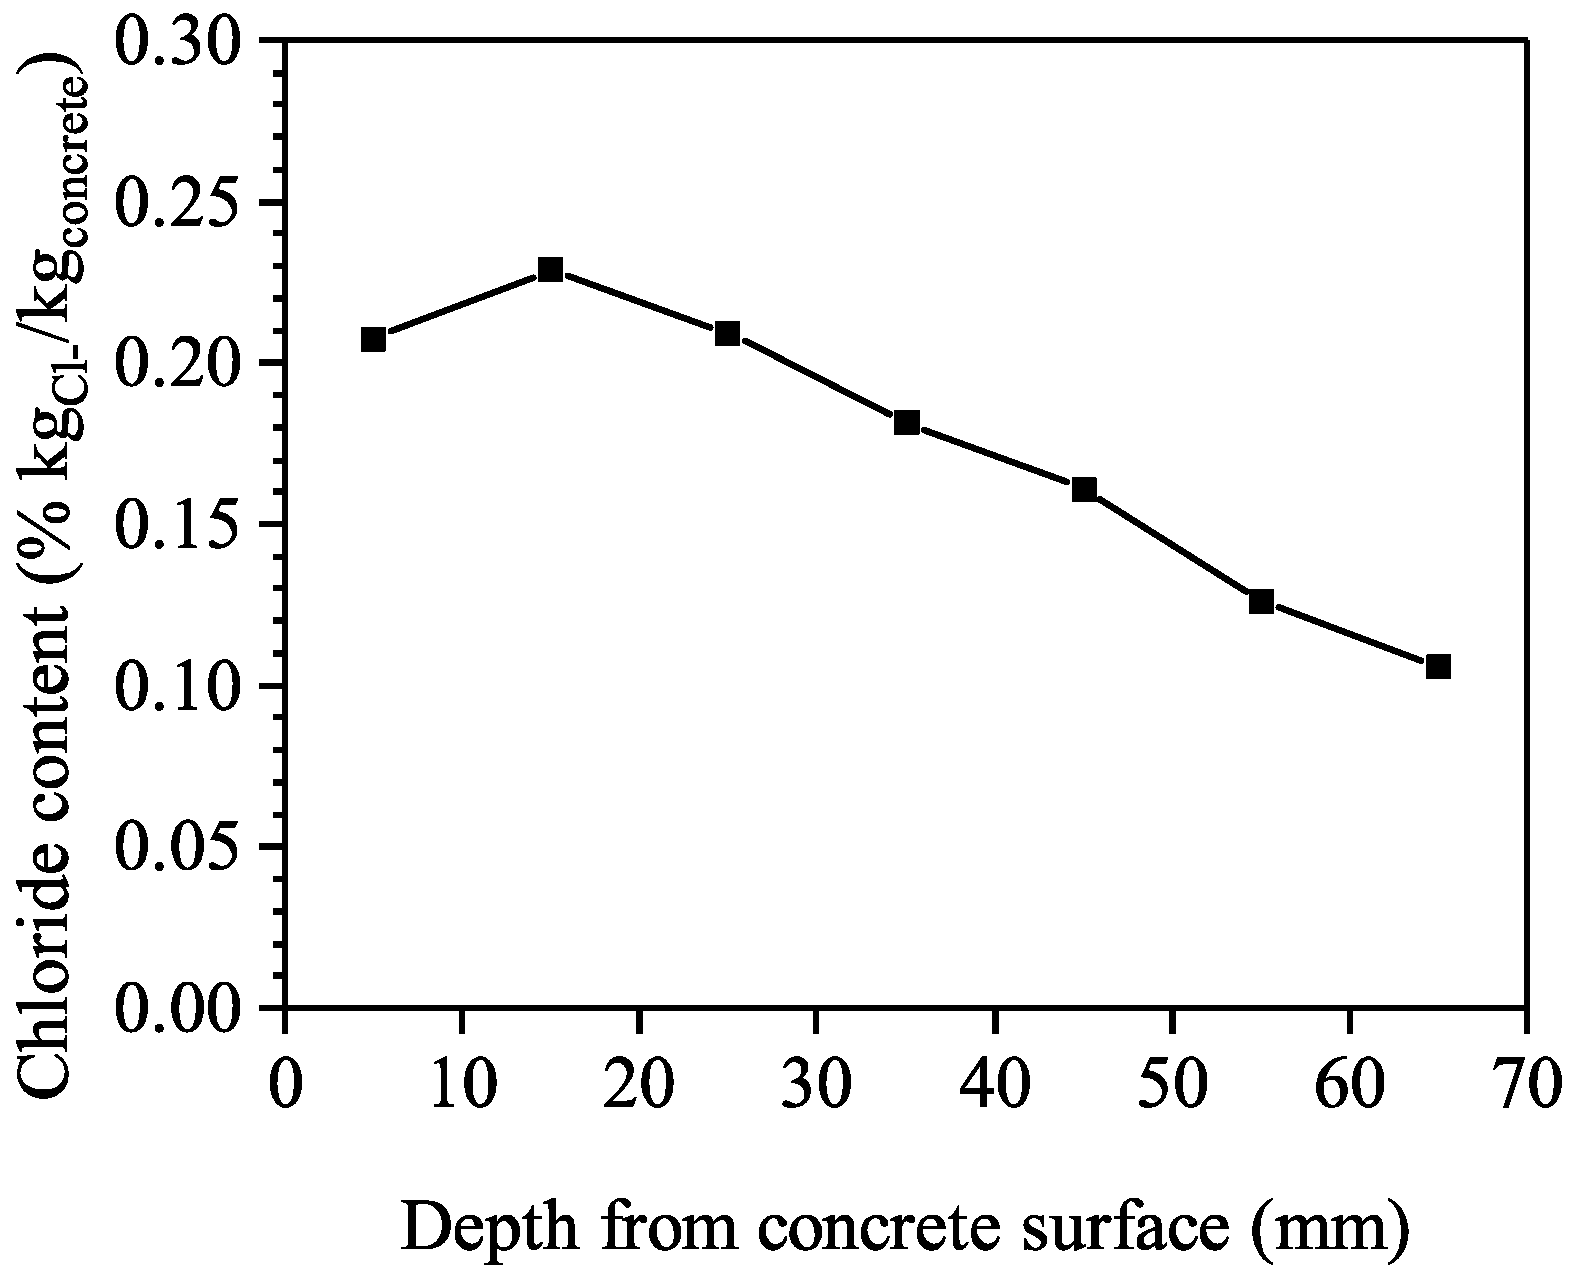
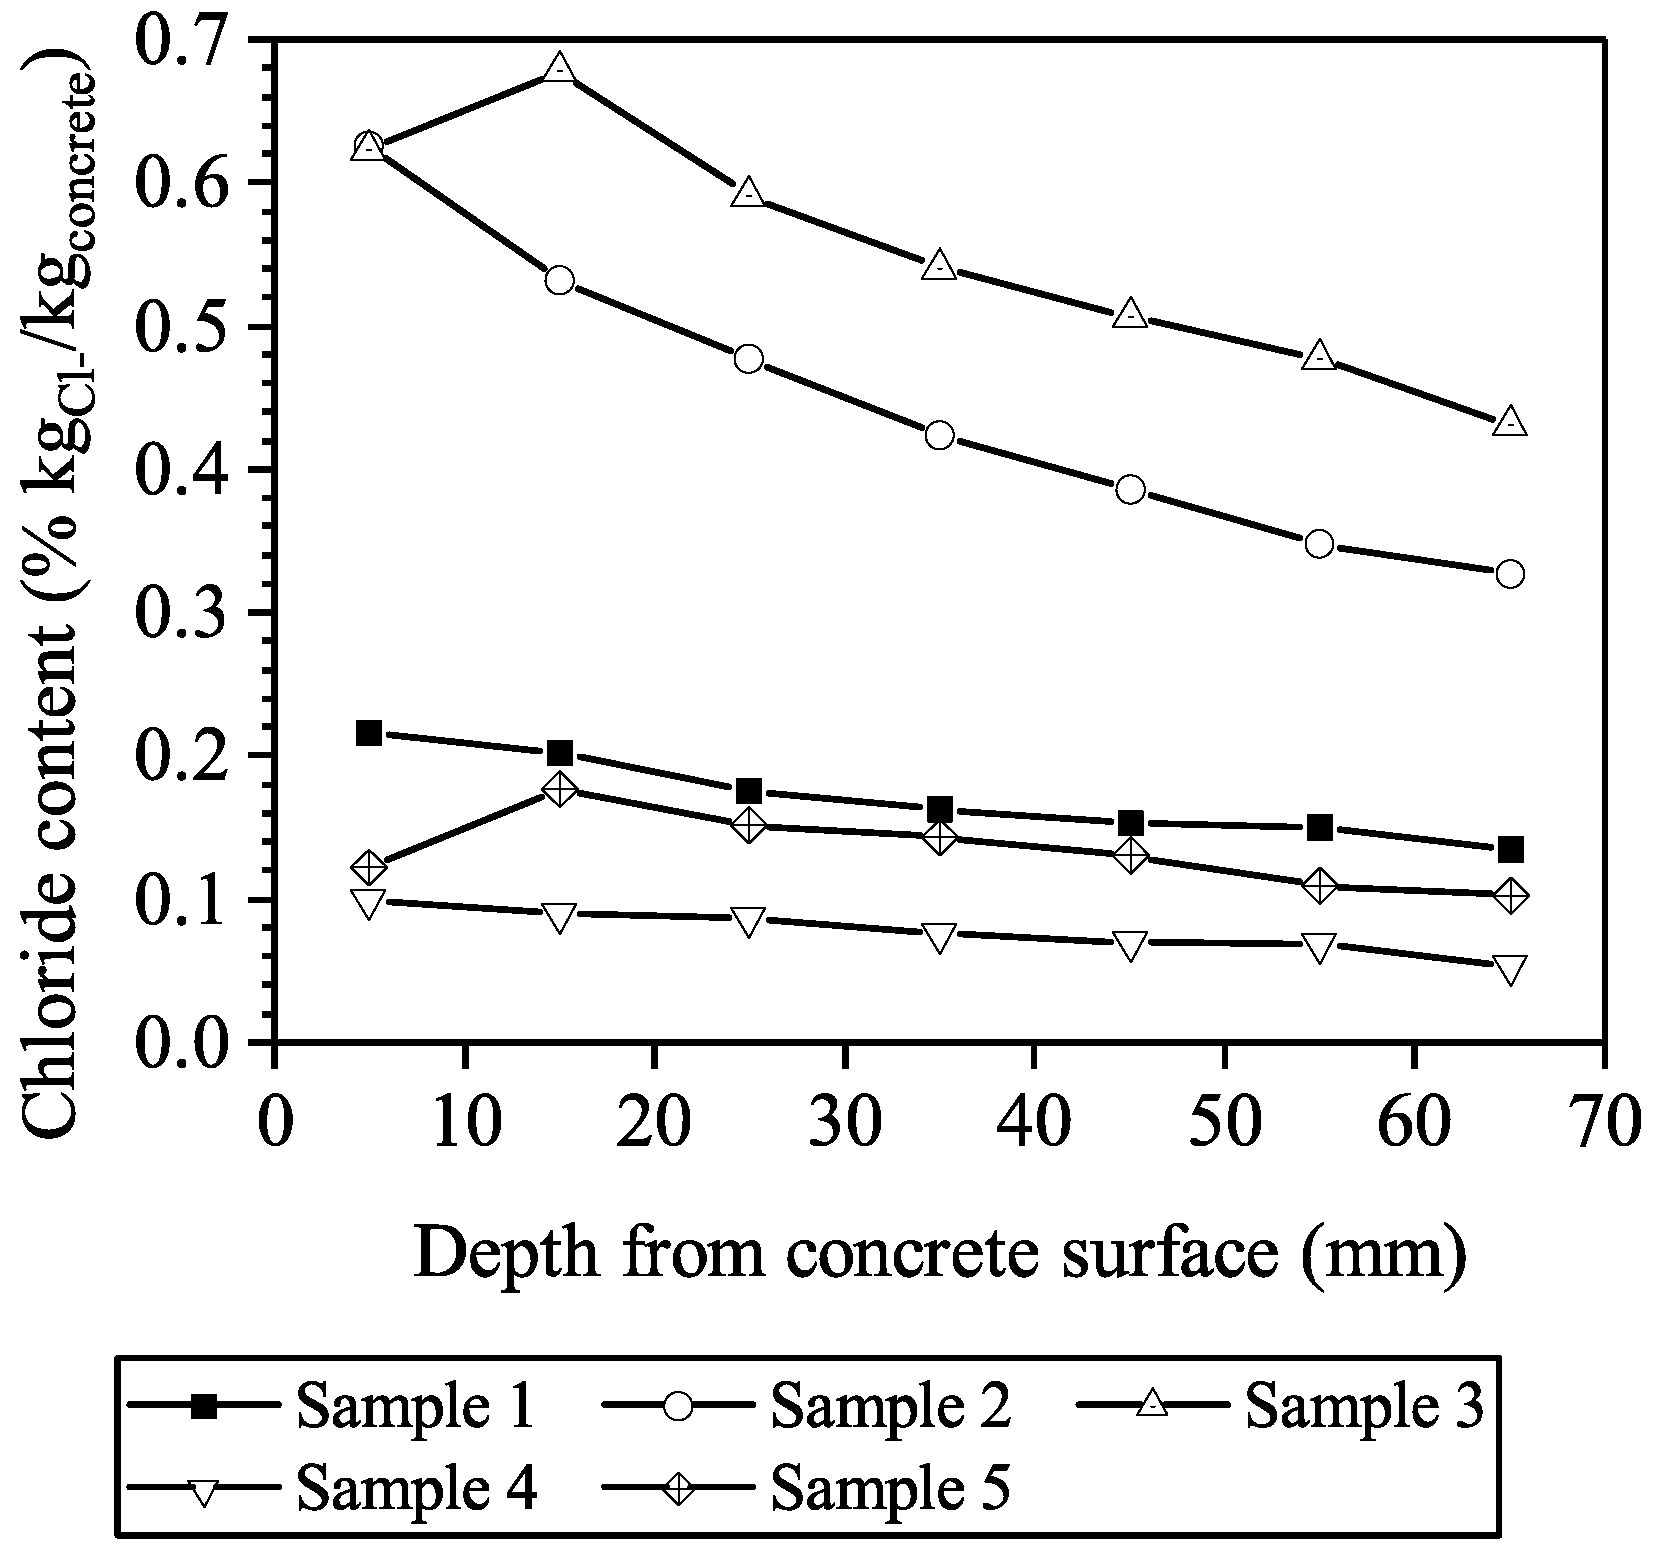
4.1.2. Chloride Diffusion Extent
4.1.3. Steel Corrosion Extent
4.1.4. Surface Deterioration Extent
4.2. Simulation Results
4.2.1. Steel Corrosion Extent
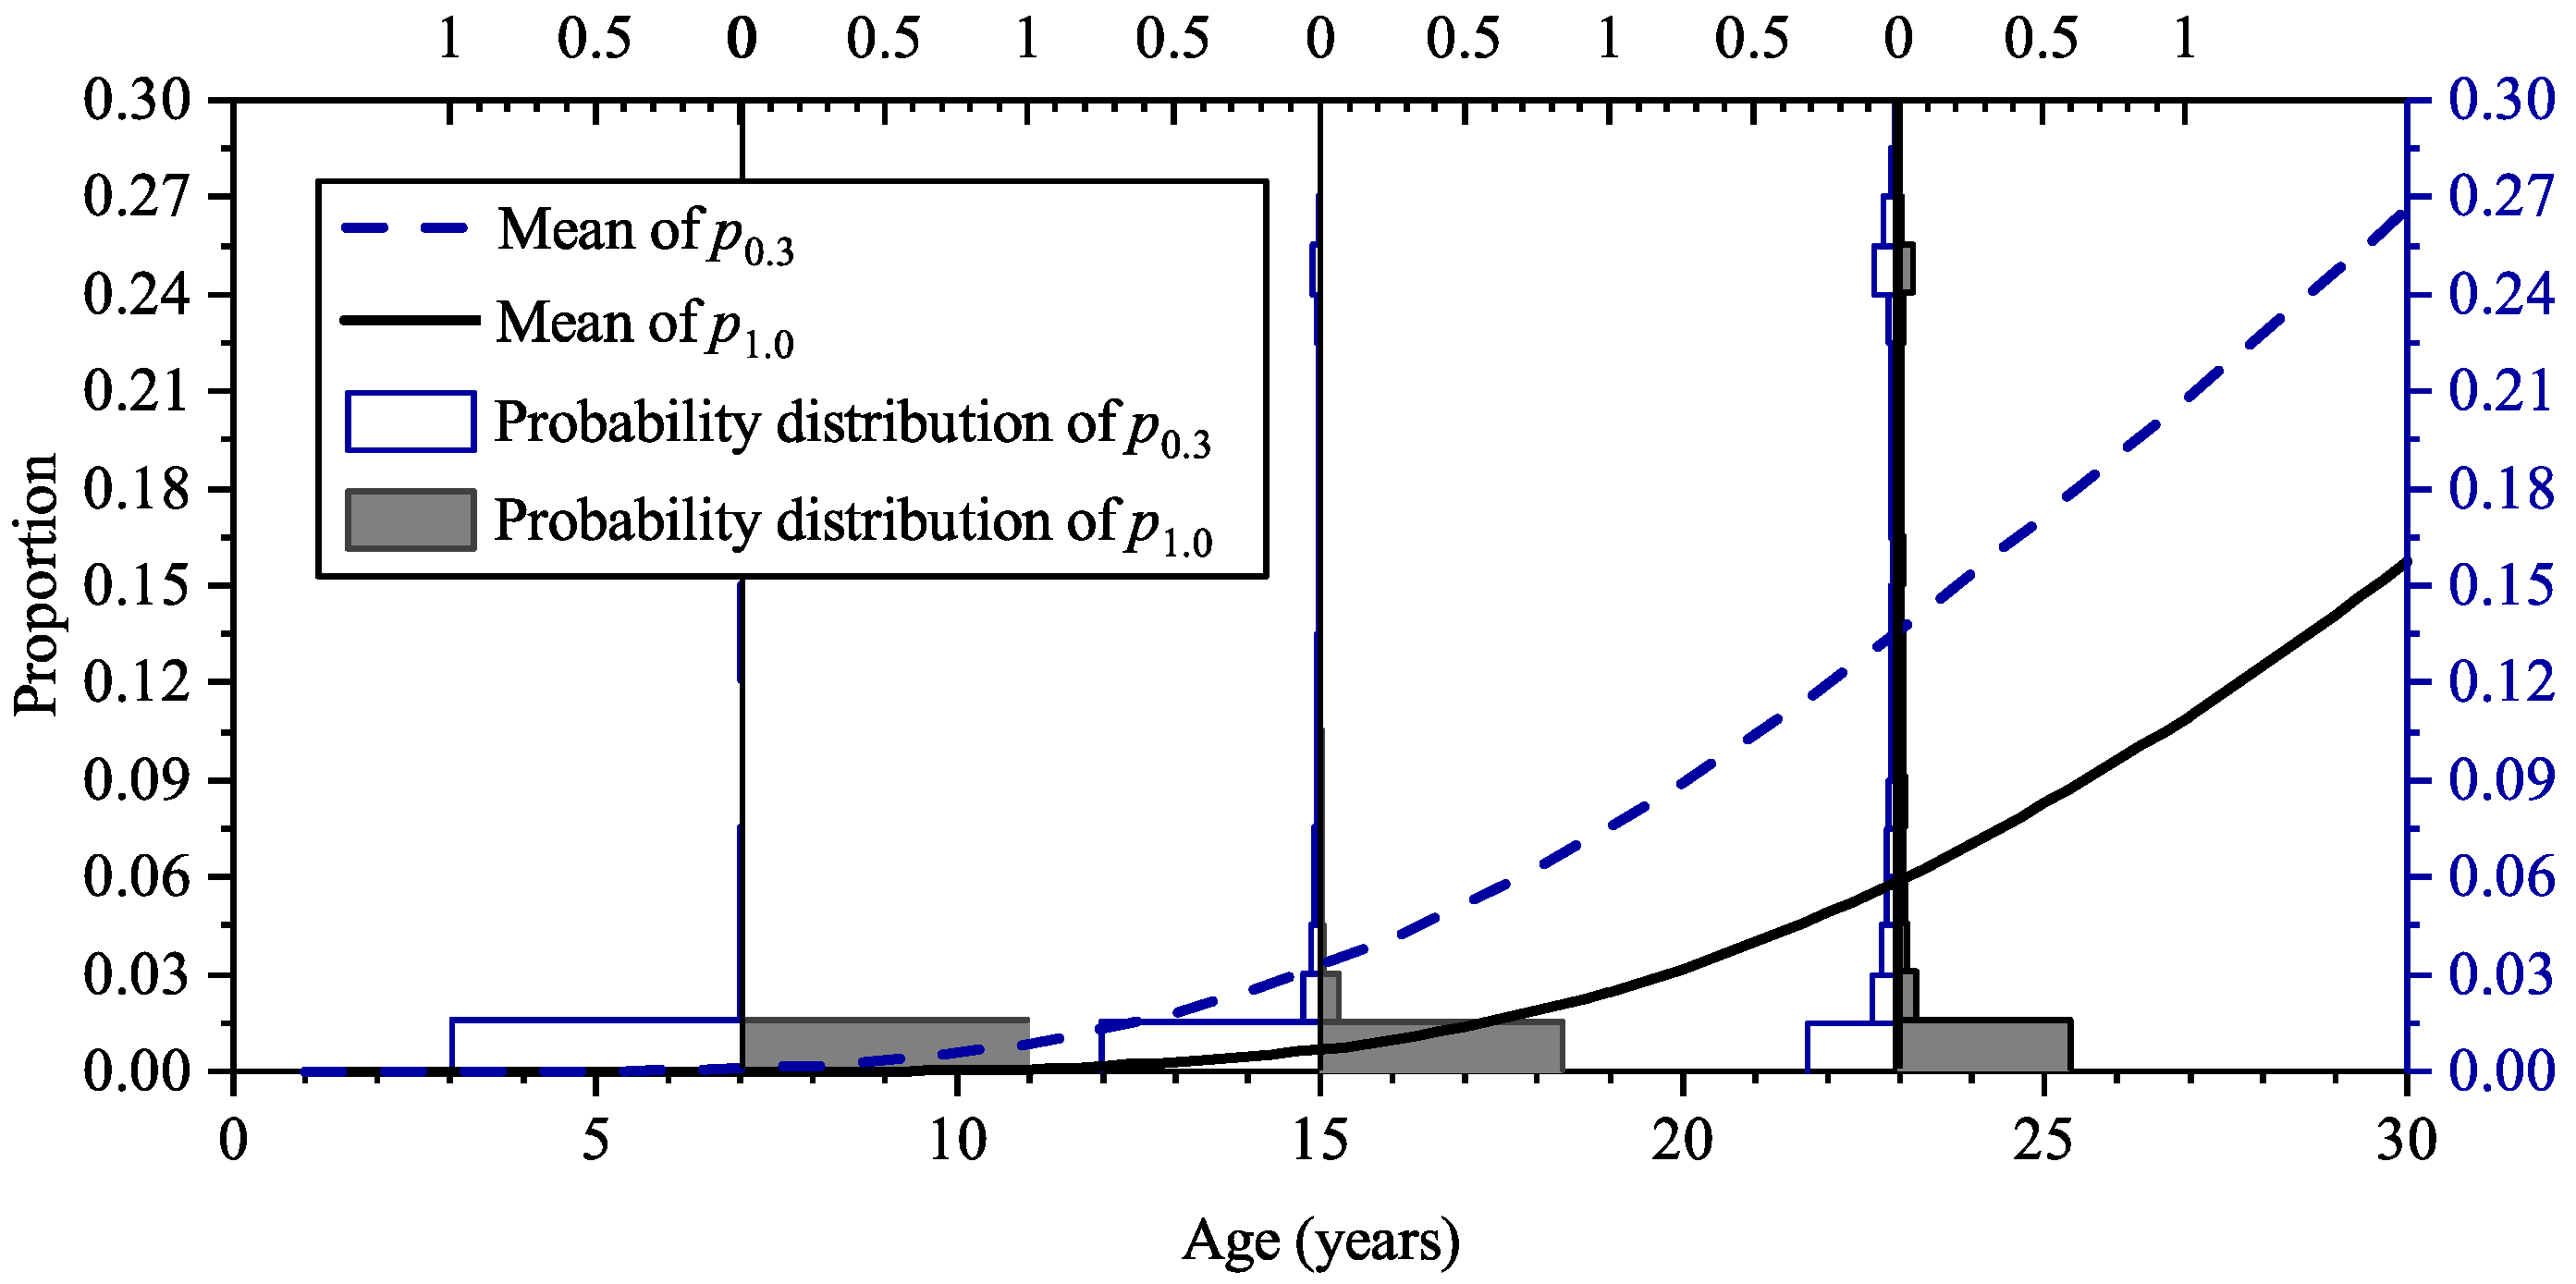
4.2.2. Surface Deterioration
4.2.3. Damage Evaluation
- 1.
- The quantification in Table 2 may not be able to correctly reflect the engineering judgment according to the description of damage extents. For example, as mentioned in Section 4.1, the most frequent surface damage on the panels of this project is concrete spalling instead of cracking; however, the quantified criteria in Table 4 use the indices relating to the crack width to grade the damage extents. It is likely that the quantified criteria are not equivalent to the engineering judgment in the inspection.
- 2.
- As shown in Section 4.1, only the mean values and variations of , , are obtained from the inspection. Because the initial profiles of the project are unavailable, and there is a limitation on conducting more destructive testings on in-service structures, the statistical properties of the other durability parameters are lacking in this study; and they are determined according to the existing literature, which may not be equal to the actual values on this structure. In addition, the model uncertainty may also lead to the bias of the simulation results.
4.3. Application in the Analysis of Maintenance
5. Limitations and Further Works
- The random-field-based durability analysis requires the statistical properties of the durability parameters, which should be determined based on a large amount of inspection data; in practice, the data acquisition for all the durability parameters of the in-situ structures is not always convenient.
- The random-field-based durability analysis relies on the calculation models about the deterioration process. The models used in this study focus on the development of the steel corrosion and surface crack width, which may not be able to evaluate all the deterioration behaviors and phenomena of the marine RC structures. With better models, the accuracy of the durability analysis can be improved.
- The deterioration behaviors after the restoration cannot be precisely simulated, given the aforementioned methods and models. It is because the restoration often involves using materials that are different from the original, and it may significantly change the mechanism of the structural deterioration process.
6. Conclusions
- Procedures for extracting the statistical properties of the durability parameters data with the batch-casting effect considered are suggested; it can be used to establish the “step-shaped” random fields in order to coordinate the actual spatial distribution of the parameters.
- With the statistical properties obtained from inspection results, surface deterioration analysis based on random fields can be performed on the in-service structures; and testing from a high-pile wharf located in the South China Sea was considered as the verification for the analysis;
- Simulation results of the steel cross-section loss and the crack width were verified in the empirical study in the present paper; surface damage grading was established according to the practical judgment during the inspection of the structure; and it is suggested that the simulation results regarding the simulation results coordinate well with the inspection results;
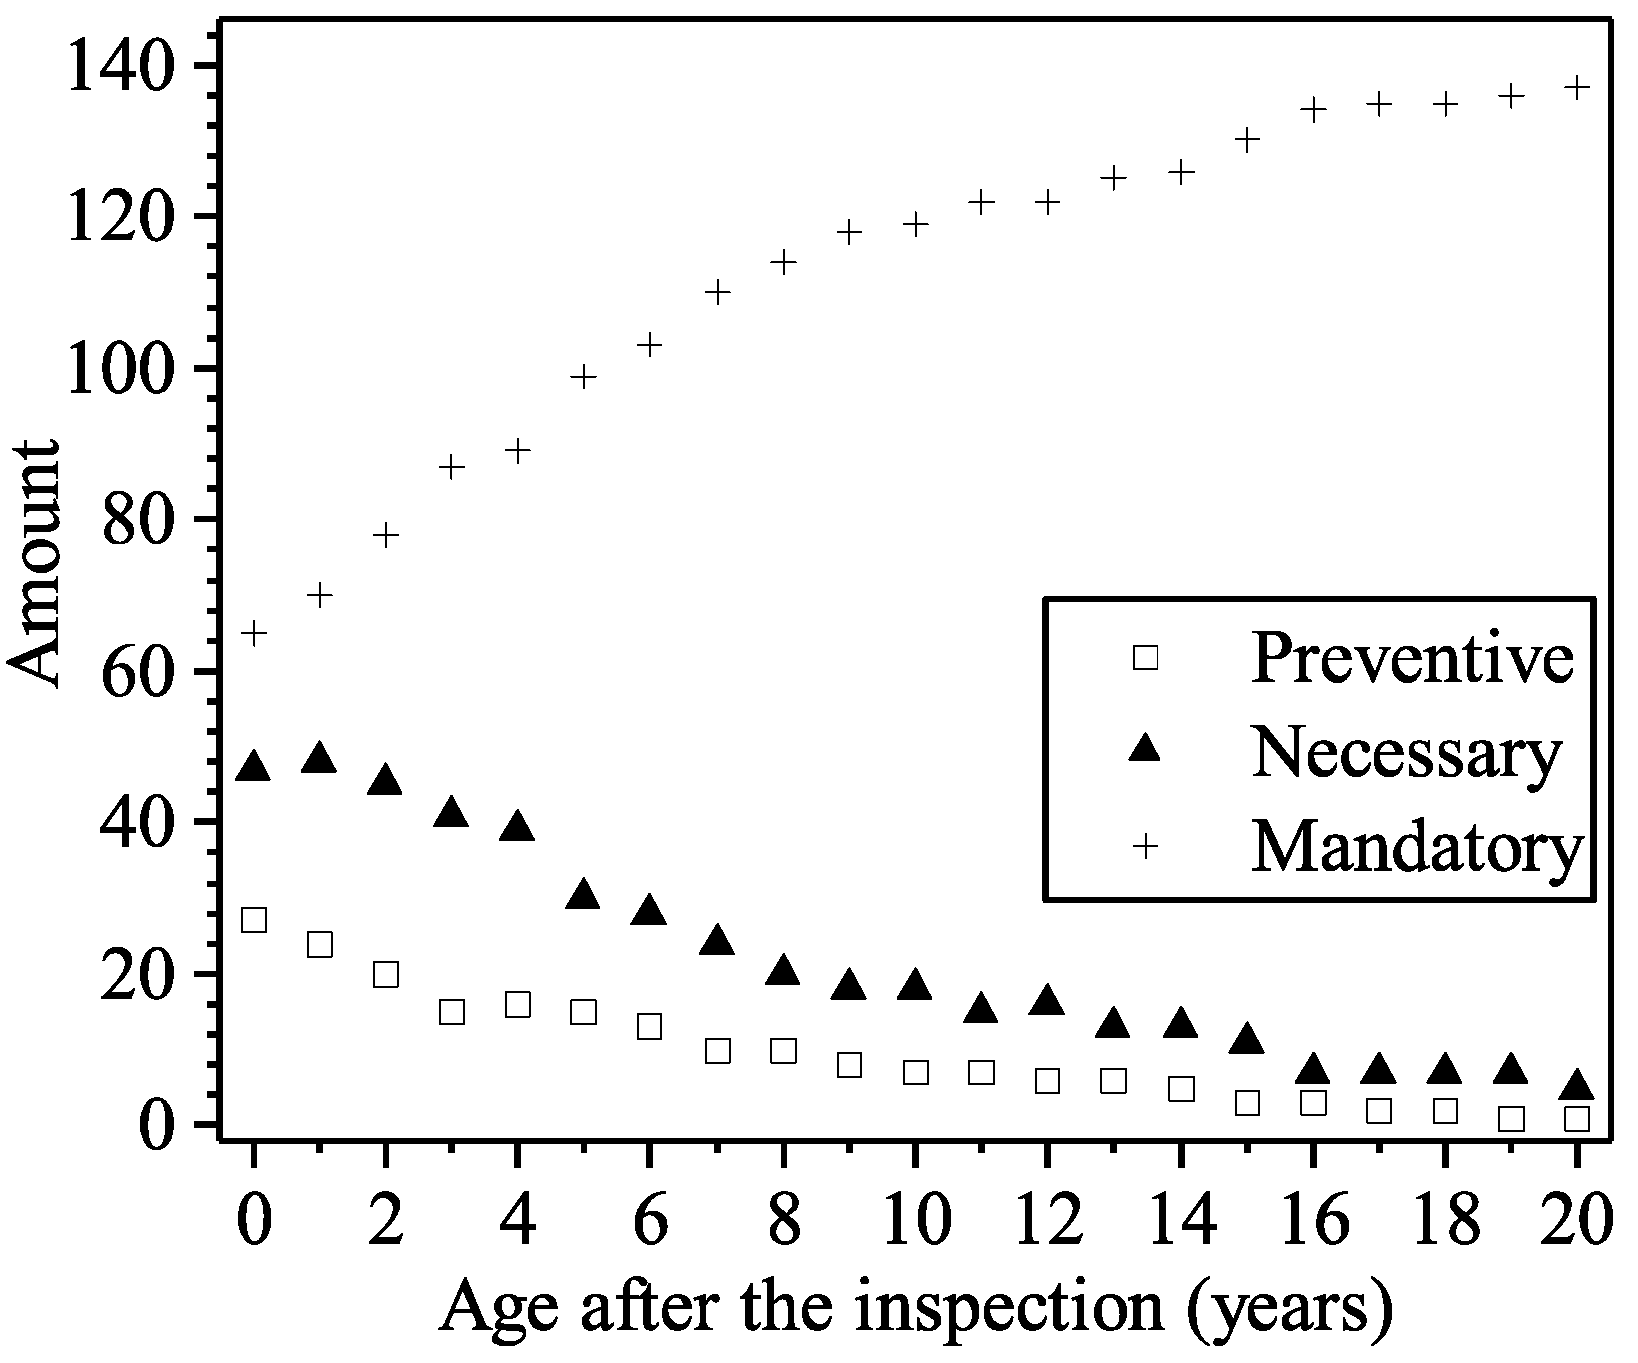
- Given the inspection results, by performing the surface deterioration analysis based on random fields, four options for the maintenance schemes were compared in terms of the amounts of panels requiring the restoration and the total economic costs. The results showed that the postponement of intervention would lead to a higher total fee. This information can help to choose alternative options and establish the maintenance scheme for in-service structures.
Author Contributions
Funding
Institutional Review Board Statement
Informed Consent Statement
Data Availability Statement
Conflicts of Interest
References
- prEN 1992-1-1; EuroCode2: Design of Concrete Structures. European Committee for Standardization: Brussels, Belgium, 2002.
- ACI 318-05; ACI 318R-05; Building Code Requirements for Structural Concrete (ACI 318-05) and Commentary (ACI 318R-05). American Concrete Institute: Indianapolis, IN, USA, 2004.
- GB/T50476-2019; Standard for Durability Design of Concrete Structures. Ministry of Housing and Urban-Rural Development of the People’s Republic of China: Beijing, China, 2019. (In Chinese)
- JTJ 302-2006; Technical Specification for Detection and Assessment of Harbour and Marine Structures. Ministry of Transport of the People’s Republic of China: Beijing, China, 2007. (In Chinese)
- FIB. Model Code for Service Life Design. In Bulletin 34; Fédération International du Béton: Lausanne, Switzerland, 2006. [Google Scholar]
- DuraCrete. Probabilistic Performance Based Durability of Concrete Structures: General Guidelines for Durability Design and Redesign; Report No. BE95-1347; The European Union—Brite EuRam III: Gouda, The Netherlands, 2000. [Google Scholar]
- Stewart, M.G.; Mullard, J.A. Spatial time-dependent reliability analysis of corrosion damage and the timing of first repair for RC structures. Eng. Struct. 2007, 29, 1457–1464. [Google Scholar] [CrossRef]
- O’Connor, A.J.; Kenshel, O. Experimental evaluation of the scale of fluctuation for spatial variability modeling of chloride-induced reinforced concrete corrosion. J. Bridge Eng. 2013, 18, 3–14. [Google Scholar] [CrossRef] [Green Version]
- Angst, U.M.; Polder, R. Spatial variability of chloride in concrete within homogeneously exposed areas. Cem. Concr. Res. 2014, 56, 40–51. [Google Scholar] [CrossRef]
- Li, Q.; Ye, X. Surface deterioration analysis for probabilistic durability design of RC structures in marine environment. Struct. Saf. 2018, 75, 13–23. [Google Scholar] [CrossRef]
- Li, Y.; Vrouwenvelder, T.; Wijnants, G.H.; Walraven, J. Spatial variability of concrete deterioration and repair strategies. Struct. Concr. 2004, 5, 121–129. [Google Scholar] [CrossRef]
- Stewart, M.G. Spatial variability of pitting corrosion and its influence on structural fragility and reliability of RC beams in flexure. Struct. Saf. 2004, 26, 453–470. [Google Scholar] [CrossRef]
- Ye, X.; Li, Q.; Zhang, H. A simplified method for risk assessment of surface damage of marine reinforced concrete structures. Struct. Saf. 2022, 99, 102265. [Google Scholar] [CrossRef]
- Li, Y. Effect of Spatial Variability on Maintenance and Repair Decisions for Concrete Structures. Ph.D. Thesis, Technische Universiteit Delft, Delft, The Netherlands, 2004. [Google Scholar]
- Stewart, M.G. Spatial and time-dependent reliability modelling of corrosion damage, safety and maintenance for reinforced concrete structures. Struct. Infrastruct. Eng. 2012, 8, 607–619. [Google Scholar] [CrossRef]
- Engelund, S.; Sorensen, J.D. A probabilistic model for chloride-ingress and initiation of corrosion in reinforced concrete structures. Struct. Saf. 1998, 20, 69–89. [Google Scholar] [CrossRef]
- Karimi, A.R. Probabilistic Assessment of Deterioration and Strength of Concrete Bridge Beams and Slabs. Ph.D. Thesis, University of London, London, UK, 2002. [Google Scholar]
- Vanmarcke, E. Random Fields: Analysis and Synthesis; MIT Press: Cambridge, MA, USA, 1983. [Google Scholar]
- Noh, Y.; Choi, K.K.; Du, L. Reliability-based design optimization of problems with correlated input variables using a Gaussian Copula. Struct. Multidiscip. Optim. 2009, 38, 1–16. [Google Scholar] [CrossRef]
- Li, C.Q. Life-cycle modeling of corrosion-affected concrete structures: Propagation. J. Struct. Eng. 2003, 129, 753–761. [Google Scholar] [CrossRef]
- Li, C.Q. Life-cycle modeling of corrosion-affected concrete structures: Initiation. J. Mater. Civ. Eng. 2003, 15, 594–601. [Google Scholar] [CrossRef]
- Collepardi, M.; Marcialis, A.; Turriziani, R. Penetration of chloride ions into cement pastes and concretes. J. Am. Ceram. Soc. 1972, 55, 534–535. [Google Scholar] [CrossRef]
- Mangat, P.S.; Molloy, B.T. Prediction of long term chloride concentration in concrete. Mater. Struct. 1994, 27, 338–346. [Google Scholar] [CrossRef]
- Liu, Y.P.; Weyers, R.E. Modeling the time-to-corrosion cracking in chloride contaminated reinforced concrete structures. ACI Mater. J. 1998, 95, 675–681. [Google Scholar]
- Alonso, C.; Andrade, C.; Rodriguez, J.; Diez, J.M. Factors controlling cracking of concrete affected by reinforcement corrosion. Mater. Struct. 1998, 31, 435–441. [Google Scholar] [CrossRef]
- Vidal, T.; Castel, A.; François, R. Analyzing crack width to predict corrosion in reinforced concrete. Cem. Concr. Res. 2004, 34, 165–174. [Google Scholar] [CrossRef]
- El Maaddawy, T.; Soudki, K. A model for prediction of time from corrosion initiation to corrosion cracking. Cem. Concr. Compos. 2007, 29, 168–175. [Google Scholar] [CrossRef]
- Zhang, R.; Castel, A.; François, R. The corrosion pattern of reinforcement and its influence on serviceability of reinforced concrete members in chloride environment. Cem. Concr. Res. 2009, 39, 1077–1086. [Google Scholar] [CrossRef]
- Zhang, R.; Castel, A.; François, R. Concrete cover cracking with reinforcement corrosion of RC beam during chloride-induced corrosion process. Cem. Concr. Res. 2010, 40, 415–425. [Google Scholar] [CrossRef]
- Khan, I.; François, R.; Castel, A. Prediction of reinforcement corrosion using corrosion induced cracks width in corroded reinforced concrete beams. Cem. Concr. Res. 2014, 56, 84–96. [Google Scholar] [CrossRef]
- Coronelli, D.; Hanjari, K.Z.; Lundgren, K. Severely corroded RC with cover cracking. J. Struct. Eng. 2012, 139, 221–232. [Google Scholar] [CrossRef] [Green Version]
- Dong, J. Cracking and Spalling of Reinforced Concrete Structures under Simultaneous Loading and Chloride Penetration. Ph.D. Thesis, Zhejiang University, Hangzhou, China, 2018. (In Chinese). [Google Scholar]
- Zhu, W.; François, R. Structural performance of RC beams in relation with the corroded period in chloride environment. Mater. Struct. 2015, 48, 1757–1769. [Google Scholar] [CrossRef]
- Roberts, M.B.; Atkins, C.; Hogg, V.; Middleton, C. A proposed empirical corrosion model for reinforced concrete. Proc. Inst. Civ. Eng.—Struct. Build. 2000, 140, 1–11. [Google Scholar] [CrossRef]
- Andrade, C.; Díez, J.M.; Alonso, C. Mathematical Modeling of a Concrete Surface “Skin Effect” on Diffusion in Chloride Contaminated Media. Adv. Cem. Based Mater. 1997, 6, 39–44. [Google Scholar] [CrossRef]
- Castro, P.; De Rincon, O.T.; Pazini, E.J. Interpretation of chloride profiles from concrete exposed to tropical marine environments. Cem. Concr. Res. 2001, 31, 529–537. [Google Scholar] [CrossRef]
- JTJ 270-1998; Testing Code of Concrete for Port and Waterwog Engineering. Ministry of Communication of the People’s Republic of China: Beijing, China, 2008. (In Chinese)
- Ye, X. Reliability-based Durability Design and Quality Control of Reinforced Concrete Structures in Marine Environment. Ph.D. Thesis, Tsinghua University, Beijing, China, 2021. (In Chinese). [Google Scholar]


| Damage Grade | Description of the Phenomenon |
|---|---|
| Grade A | Without any visible surface deterioration phenomenon. |
| Grade B | With rust stain, slight corrosion-induced cracks, and concrete hollowing appeared in the small area; the crack widths are less than 0.3 mm. |
| Grade C | With more rust stain, concrete hollowing, and spalling in the larger area, more corrosion-induced cracks appeared, or net-shaped cracks appeared, with the crack width between 0.3 mm and 1.0 mm; the proportion of concrete spalling in the surface area is less than 30%. |
| Grade D | With lots of cracks, most or all of the steel corroded, and significant decrease in the steel cross-section occurred; Large area of net-shaped cracks appeared with the crack width exceeding 1.0 mm; Large area of concrete spalling occurred with the proportion in the surface area exceeding 30%. |
| Damage Grade | Description of the Criteria |
|---|---|
| Grade I | The steel corrosion is slight, with no surface damaged or a small area of the concrete surface being damaged. |
| Grade II | Moderate steel corrosion occurred; spalling occurred on less than 10% of the surface area; most of the crack widths are less than 0.3 mm. |
| Grade III | Serious steel corrosion occurred; Lots of rust stains and corrosion-induced cracks; most of the crack widths are between 0.3 mm and 1.0 mm; the proportion of concrete spalling in the surface area is less than 30%. |
| Grade IV | With lots of cracks, most or all of the steel corroded, and significant decrease in the steel cross-section happened; Large area of net-shaped cracks appeared with a crack width exceeding 1.0 mm; Large area of concrete spalling occurred with the proportion in the surface area exceeding 30%. |
| Parameters | Distribution | Statistical Properties | Correlation Length |
|---|---|---|---|
| Ccr) | Lognormal | Mean = 0.10%, std. = 0.02% | 2000 mm |
| Cs,b) | Lognormal | Mean = 0.37%, std. = 0.25% | 1960 mm |
| Cs,a) | Normal | Mean = 0, std. = 0.037% | |
| x0,b (mm) | Lognormal | Mean = 43.0, std. = 8.56 | --- |
| x0,a (mm) | Normal | Mean = 0, std. = 3.2 | 130 mm |
| Da0,b (10−12m2/s) | Lognormal | Mean = 4.35, std. = 1.17 | --- |
| Da0,a (10−12m2/s) | Lognormal | Mean = 0, std. = 0.44 | 250 mm |
| n | Normal | Mean = 0.2, std. = 0.01 | --- |
| κ | Uniform | Lower bound = 4, upper bound = 8 | --- |
| icor1,b (μA/cm2) | Lognormal | Mean = 0.67, std. = 0.39 | 2000 mm |
| icor1,a (μA/cm2) | Normal | Mean = 0, std. = 0.067 | 2000 mm |
| icor2,b (μA/cm2) | Lognormal | Mean = 8.80, std. = 5.10 | 2000 mm |
| icor2,a (μA/cm2) | Normal | Mean = 0, std. = 0.88 | 2000 mm |
| Grade | Description of the Criteria | Quantified Criteria |
|---|---|---|
| IV | (1) With lots of cracks, most or all of the steel corroded; | (1) p0 > 50%, and |
| (2) Large area of concrete spalling occurred with the proportion in the surface area exceeding 30%; | (2) p0.3 > 30%, and | |
| (3) Crack width exceeding 1.0 mm. | (3) p1.0 > 1% | |
| III | (1) Lots of rust stain and corrosion-induced cracks; | (1) p0 > 30%, and |
| (2) Proportion of concrete spalling in the surface area is less than 30%. | (2) p0.3 > 10% | |
| II | (1) Most of the crack widths are less than 0.3 mm; | (1) p0 > 10%, and |
| (2) Spalling occurred on less than 10% of the surface area. | (2) p0.3 > 1% | |
| I | The steel corrosion is slight, with no surface damaged or a small area of the concrete surface was damaged | --- |
| Grade | Simulation Results | Inspection Results |
|---|---|---|
| I | 28% | 31/144 = 0.22 |
| II | 25% | 54/144 = 0.38 |
| III | 6% | 7/144 = 0.05 |
| IV | 41% | 52/144 = 0.36 |
| Items | In-Situ Measurements (At the Age of 23 Years) | Simulation Results |
|---|---|---|
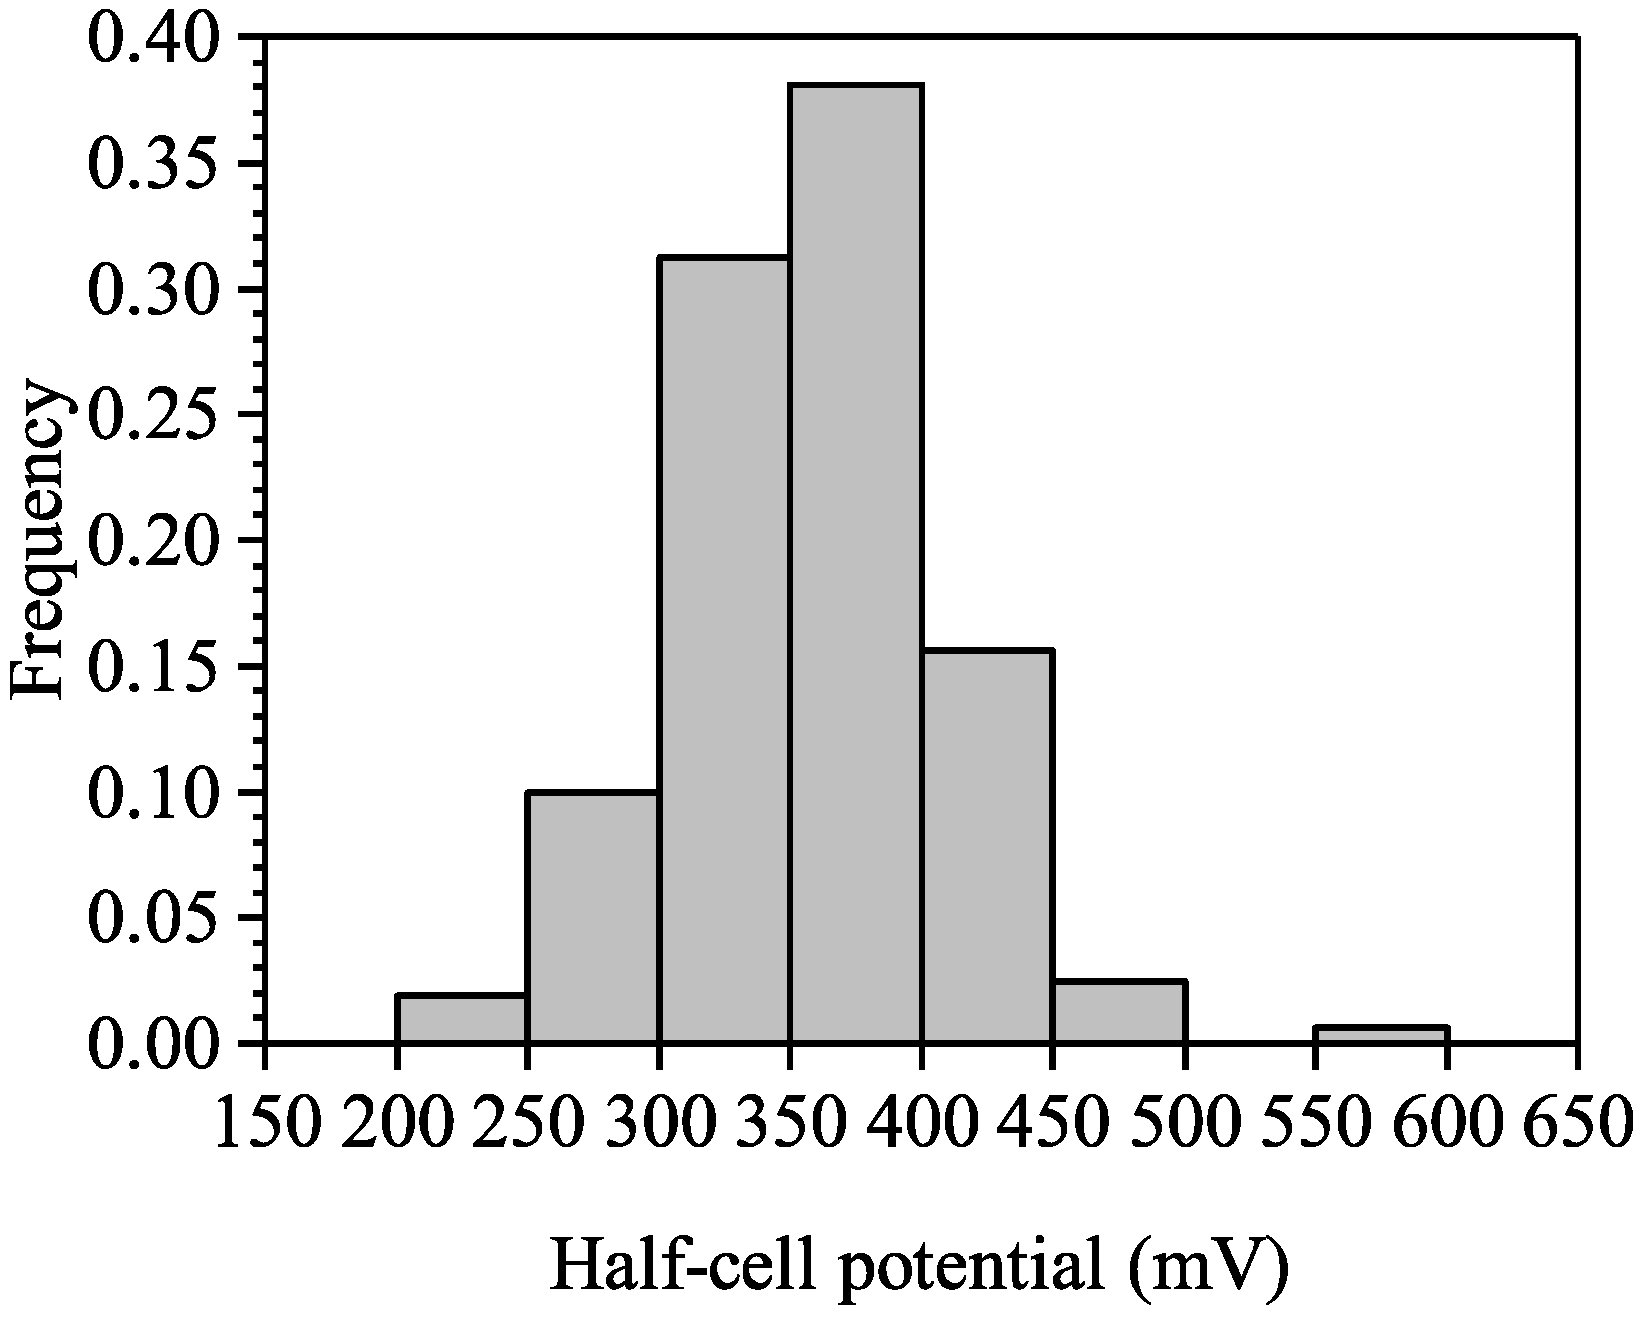
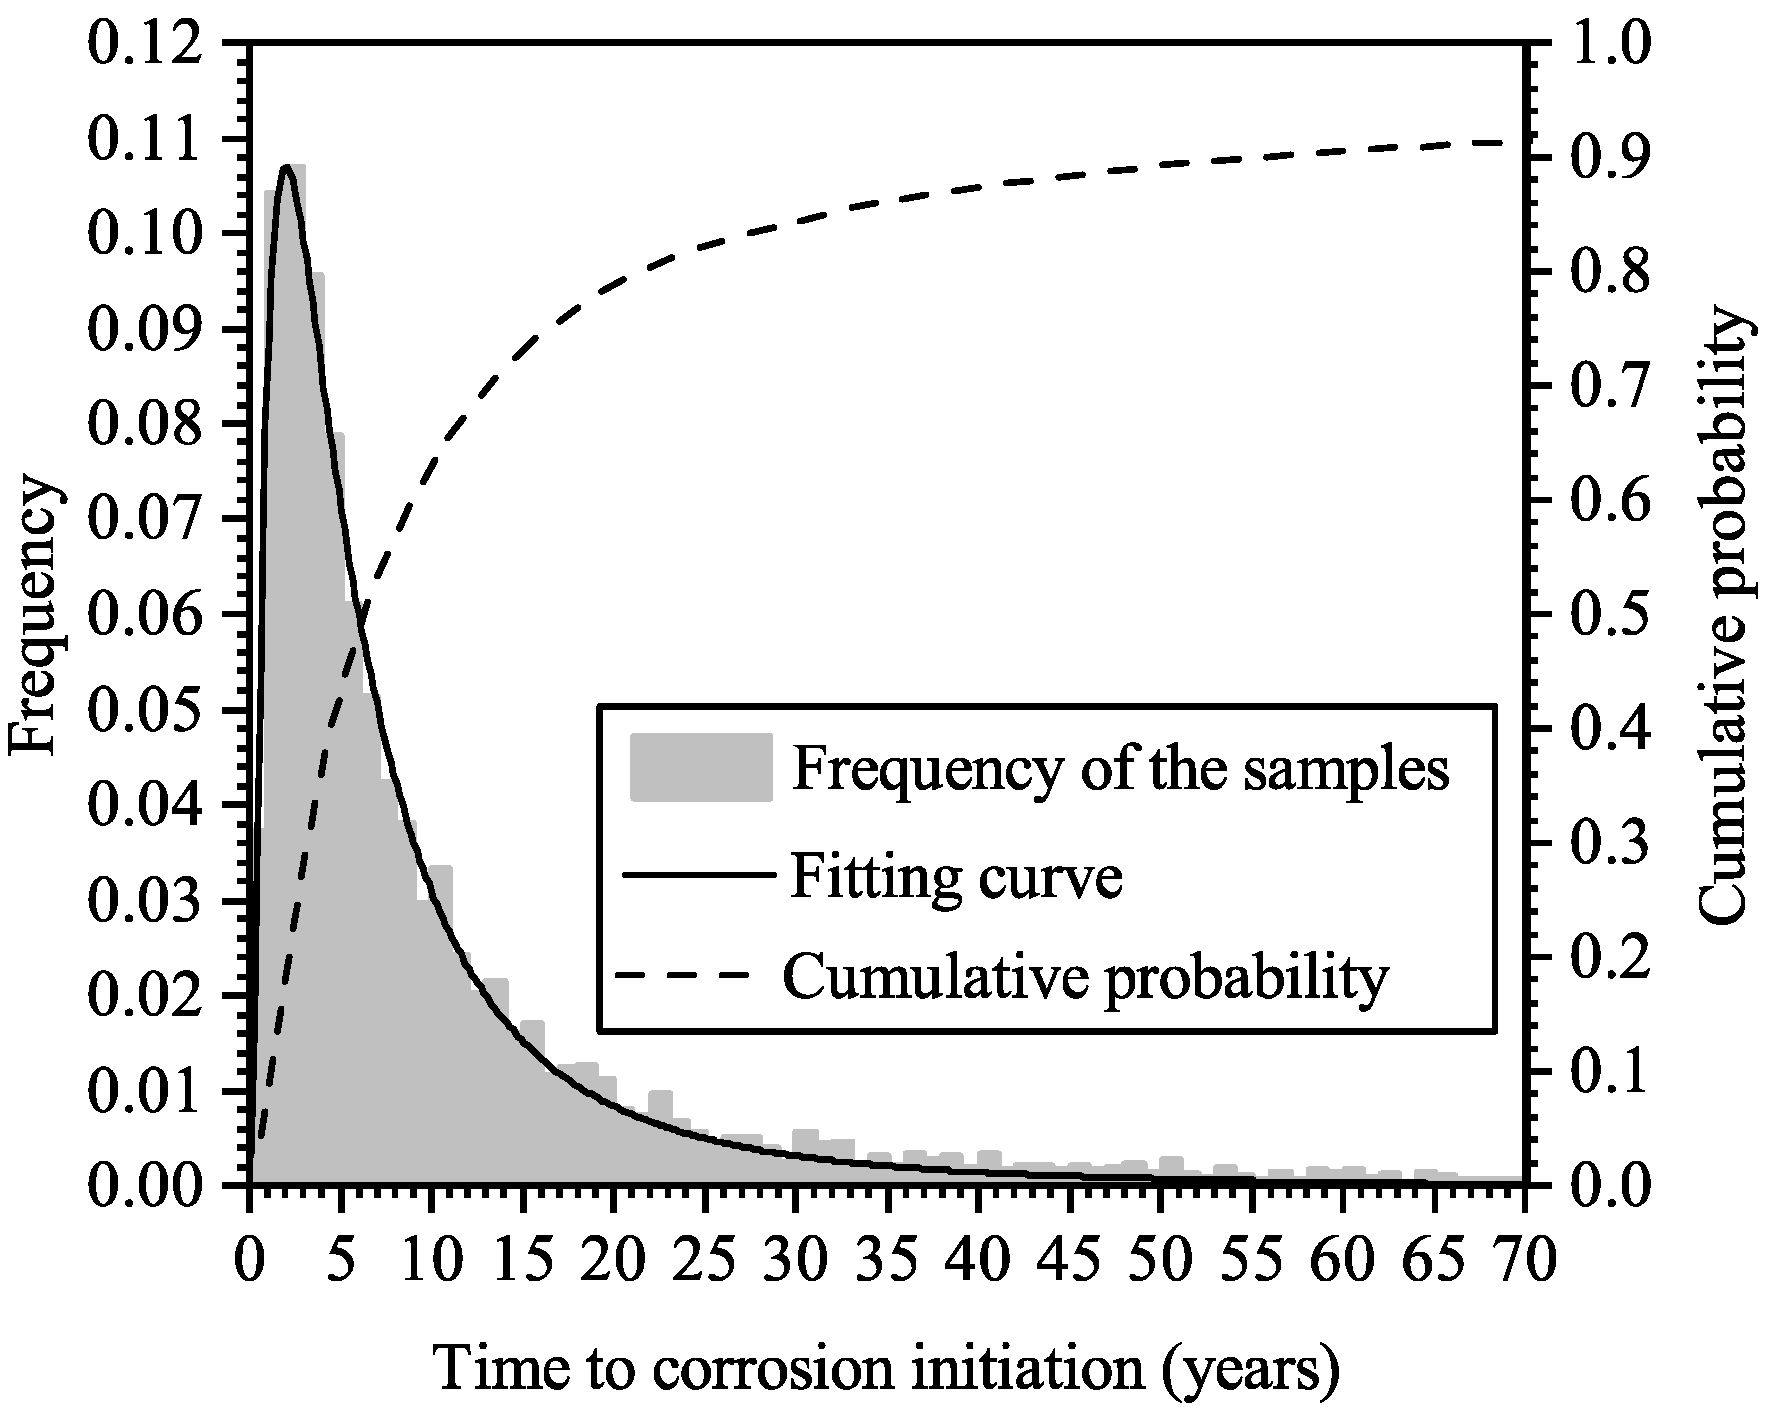
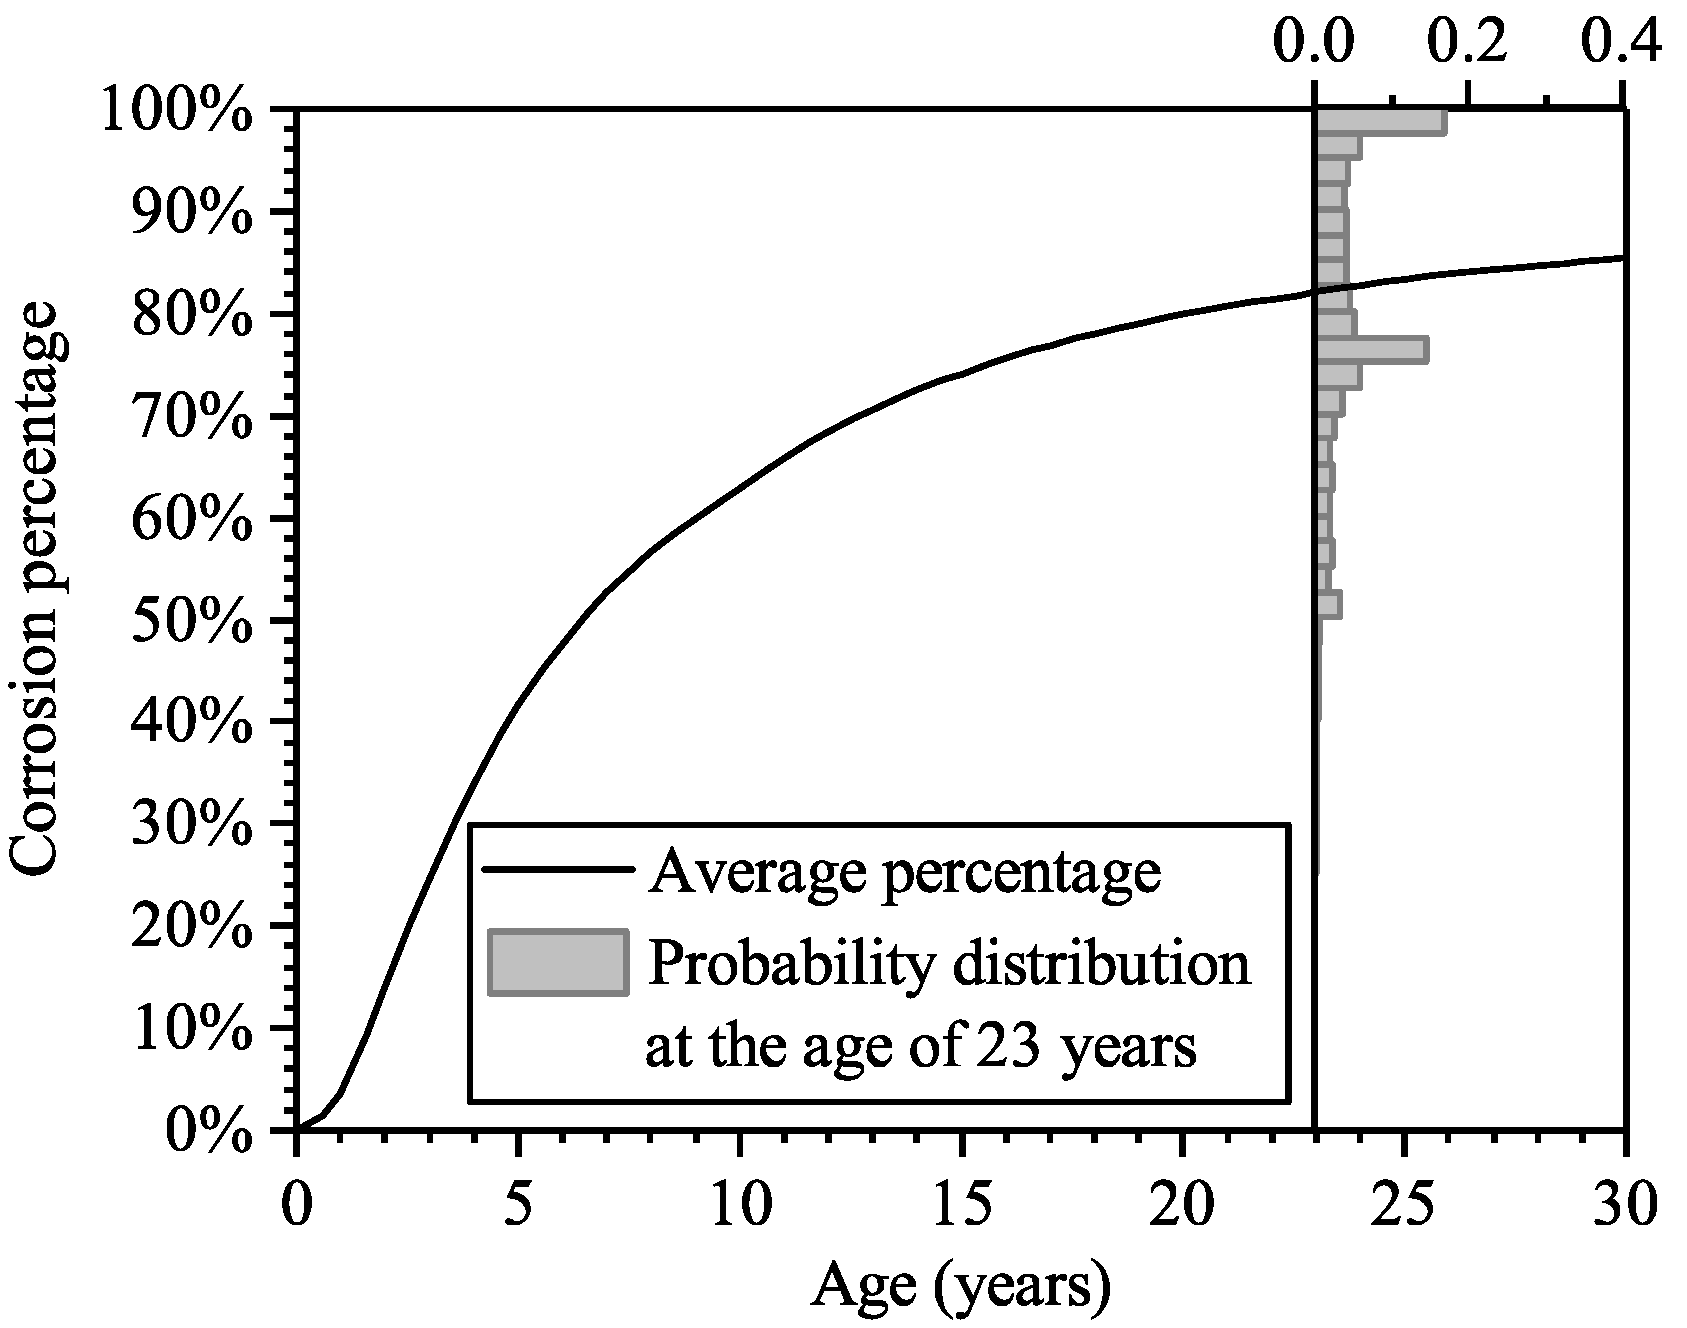
| Steel corrosion extent | Half-cell potential test results: 1. <200 mV (not corroded): 0% 2. 200 mV–350 mV (uncertain): 46% 3. >350 mV (corroded): 54% | Figure 8 (probability of corrosion initiation): 1. steel corrosion initiates very quickly after the construction is completed; 2. the probability is about 0.8 at the age of 23 years. Figure 9 (corrosion percentage in each panel at the age of 23 years): 1. the average percentage is about 0.8; 2. the probability of average percentage around 0.75 is significant. |
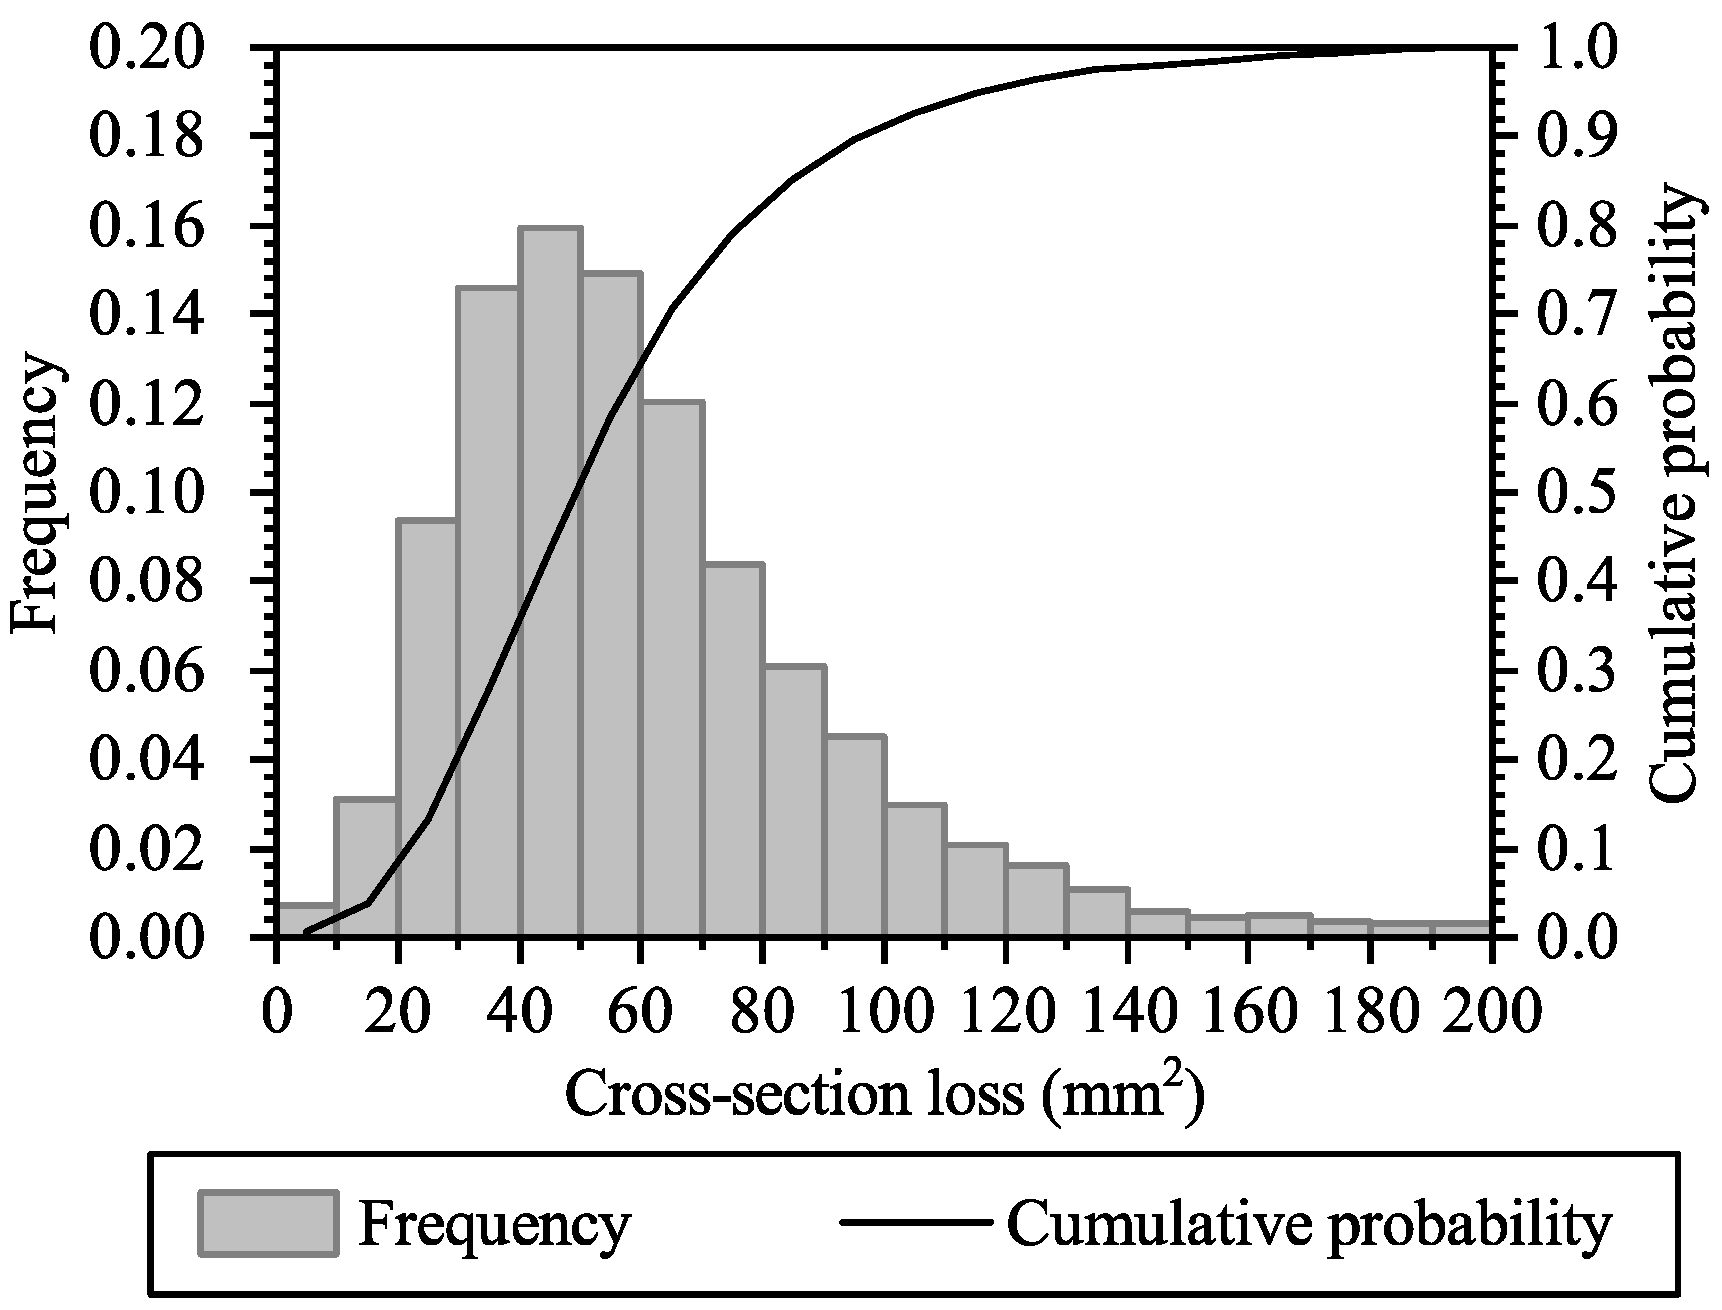
| Visual inspection in spalling area: 1. average cross-section loss of the exposed steel was up to 194 mm2; 2. some were entirely corroded in cross-section. | Figure 10 (probability of steel cross-section loss at the age of 23 years): 1. the most-likely maximum cross-section loss is 50 mm2; 2. the probability of the entire cross-section of the steel being corroded is small but unneglectable. | |
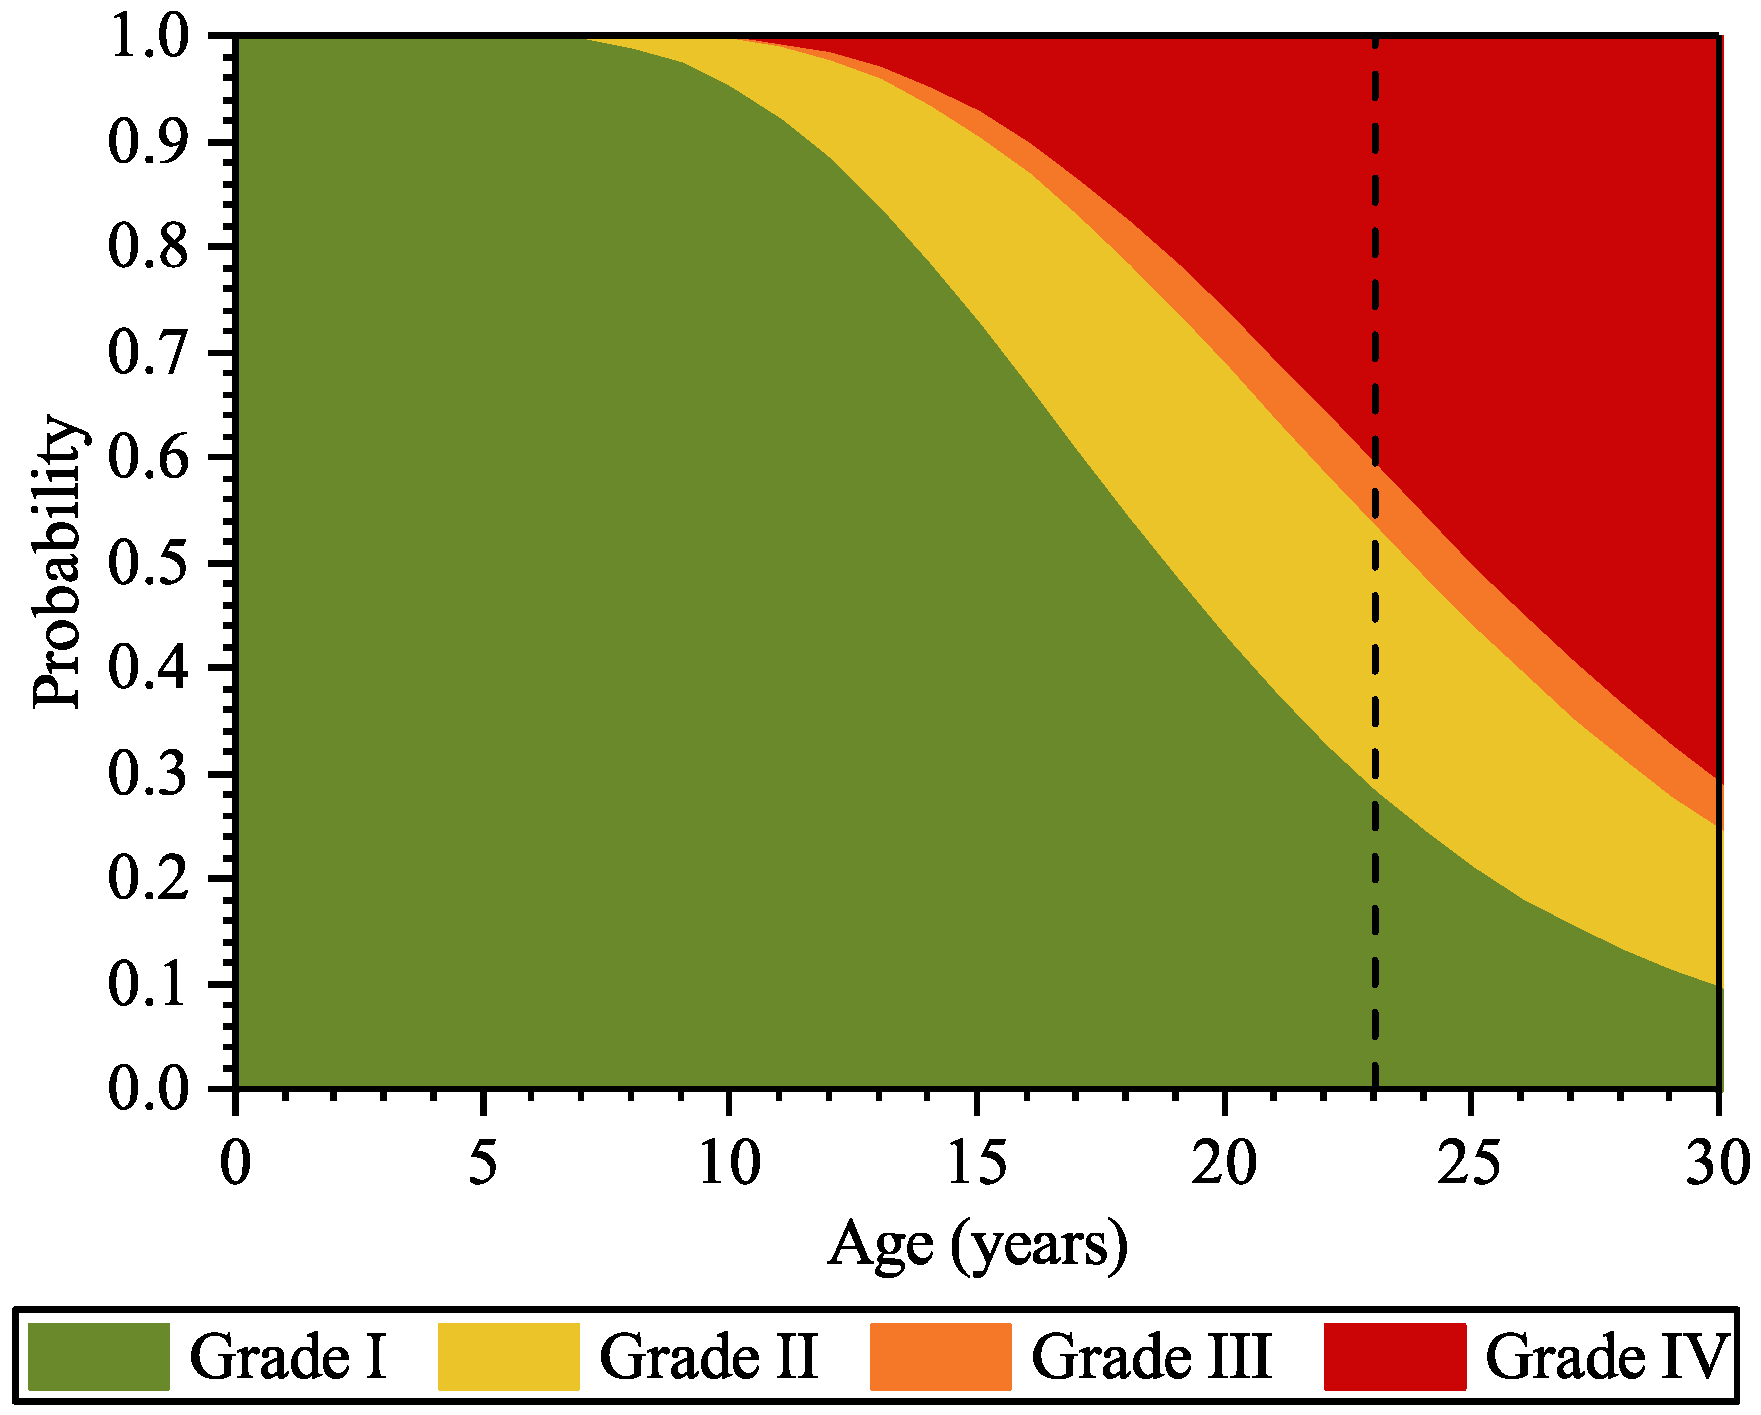
| Surface damage grade | Percentage of panels in various damage grades: 1. Grade I: 31/144 = 0.22; 2. Grade II: 54/144 = 0.38; 3. Grade III: 7/144 = 0.05; 4. Grade IV: 52/144 = 0.36. | Figure 14 and Table 5 (Percentage of panels in various damage grades): At the age of 23 years, 1. Grade I: 28%; 2. Grade II: 25%; 3. Grade III: 6%; 4. Grade IV: 41%. |
| Grade | Item in JTJ-302 | Our Quantification |
|---|---|---|
| A | Without any visible cracking | p0 ≤ 1% |
| B | A few corrosion-induced cracks with width less than 0.3 mm | p0 > 1% and p0.3 ≤ 1% |
| C | Some continuous cracks along the reinforcement bar, with width between 0.3 mm and 3.0 mm | p0.3 > 1% and p3.0 ≤ 1% |
| D | A large number of continuous cracks along the reinforcement bar, with some crack widths exceeding 3.0 mm | p3.0 > 1% |
| Maintenance Schemes | Grade B | Grade C | Grade D | |
|---|---|---|---|---|
| Option 1 | 1st intervention | ○ | ○ | ○ |
| 2nd intervention | ○ | ○ | ○ | |
| Option 2 | 1st intervention | - | ○ | ○ |
| 2nd intervention | ○ | ○ | ○ | |
| Option 3 | 1st intervention | - | - | ○ |
| 2nd intervention | ○ | ○ | ○ | |
| Option 4 | 1st intervention | - | - | - |
| 2nd intervention | ○ | ○ | ○ | |
| Maintenance Schemes | Grade B | Grade C | Grade D | |
|---|---|---|---|---|
| Option 1 | 1st intervention | 27 | 47 | 65 |
| 2nd intervention | 4 | 0 | 0 | |
| Total amount | 31 | 47 | 65 | |
| Total fee | CNY 420,059 | |||
| Option 2 | 1st intervention | 0 | 47 | 65 |
| 2nd intervention | 20 | 11 | 0 | |
| Total amount | 20 | 58 | 65 | |
| Total fee | CNY 425,548 | |||
| Option 3 | 1st intervention | 0 | 0 | 65 |
| 2nd intervention | 20 | 45 | 13 | |
| Total amount | 20 | 45 | 78 | |
| Total fee | CNY 462,297 | |||
| Option 4 | 1st intervention | 0 | 0 | 0 |
| 2nd intervention | 20 | 45 | 78 | |
| Total amount | 20 | 45 | 78 | |
| Total fee | CNY 437,777 | |||
Disclaimer/Publisher’s Note: The statements, opinions and data contained in all publications are solely those of the individual author(s) and contributor(s) and not of MDPI and/or the editor(s). MDPI and/or the editor(s) disclaim responsibility for any injury to people or property resulting from any ideas, methods, instructions or products referred to in the content. |
© 2023 by the authors. Licensee MDPI, Basel, Switzerland. This article is an open access article distributed under the terms and conditions of the Creative Commons Attribution (CC BY) license (https://creativecommons.org/licenses/by/4.0/).
Share and Cite
Yi, G.; Ye, X.; Li, Q. Empirical Study of Surface Deterioration Analysis Based on Random Fields for Reinforced Concrete Structures in Marine Environment. Materials 2023, 16, 4150. https://doi.org/10.3390/ma16114150
Yi G, Ye X, Li Q. Empirical Study of Surface Deterioration Analysis Based on Random Fields for Reinforced Concrete Structures in Marine Environment. Materials. 2023; 16(11):4150. https://doi.org/10.3390/ma16114150
Chicago/Turabian StyleYi, Guixiang, Xinyi Ye, and Quanwang Li. 2023. "Empirical Study of Surface Deterioration Analysis Based on Random Fields for Reinforced Concrete Structures in Marine Environment" Materials 16, no. 11: 4150. https://doi.org/10.3390/ma16114150