Article

Properties of Alkali-Activated Slag Cement Activated by Weakly Alkaline Activator

1
College of Materials Science and Engineering, Xi’an University of Architecture and Technology, Xi’an 710055, China
2
School of Civil Engineering and Architecture, Xi’an University of Technology, Xi’an 710048, China
3
School of Mathematics and Information Science, Baoji University of Arts and Sciences, Baoji 721013, China
*
Author to whom correspondence should be addressed.
Materials 2023, 16(10), 3871; https://doi.org/10.3390/ma16103871
Submission received: 12 April 2023 / Revised: 8 May 2023 / Accepted: 11 May 2023 / Published: 21 May 2023
(This article belongs to the Section Construction and Building Materials)

Abstract

:
Sodium sulfate (Na2SO4) and sodium carbonate (Na2CO3) are weakly alkaline activators. Alkali-activated slag (AAS) cement prepared with them shows the special advantages of long setting time and low shrinkage, but it shows slow development of mechanical properties. In the paper, Na2SO4 and Na2CO3 were used as activators and compounded with reactive magnesium oxide (MgO) and calcium hydroxide (Ca(OH)2) to optimize the setting time and mechanical properties. The hydration products and microscopic morphology were also studied using XRD, SEM, and EDS. Furthermore, the production cost and environmental benefits were compared and analyzed. The results show that Ca(OH)2 is the main influencing factor for setting time. It reacts preferentially with Na2CO3 to form CaCO3, which makes AAS paste lose plasticity rapidly and shortens the setting time, and then produces strength. Na2SO4 and Na2CO3 are the main influencing factors for flexural and compressive strength, respectively. Suitably high content is beneficial to promote the development of mechanical strength. The interaction of Na2CO3 and Ca(OH)2 shows a great effect on the initial setting time. High content of reactive MgO can shorten the setting time and increase the mechanical strength at 28 days. There are more crystal phases in hydration products. Considering the setting time and mechanical properties, the composition of activators are: 7% Na2SO4, 4% Na2CO3, 3–5% Ca(OH)2, and 2–4% reactive MgO. Compared with ordinary Portland cement (OPC) and AAS cement activated by sodium hydroxide (NaOH, NH) and water glass (WG) with the same alkali equivalent, the production cost and energy consumption are greatly reduced. Compared with P·O 42.5 of OPC, CO2 emission is reduced by 78.1%. AAS cement activated by weakly alkaline activators shows excellent environmental and economic benefits and good mechanical properties.

1. Introduction

Geopolymers are one of the hot topics in the research of composite materials. Its matrix is composed of a three-dimensional aluminosilicate skeleton. Aluminum and silicon are combined in a tetrahedral skeleton through Si-O and Al-O bonds to form alkali silicaluminate gel [1,2,3]. Alkali-activated slag (AAS) cement is a kind of geopolymer, which is a cementitious material prepared by mixing activators and granulated blast furnace slag (GBFS). Under the action of the activators, the vitreous body of GBFS is destroyed, decomposed, and then polymerized to form hydration products, thus playing the role of cementation [4,5,6,7]. Compared with OPC, AAS cement not only makes use of a large amount of industrial waste slag, but it also presents a simple preparation process without calcination. So, there is no CO2 produced by the limestone decomposition, which greatly reduces CO2 emissions. Therefore, AAS cement is considered a low-carbon and environmentally friendly cementitious material [8,9].
Activators will affect the hydration process and properties of AAS cement. NaOH (NH) and WG are usually considered to be strong activators. AAS cement prepared with them shows excellent mechanical properties, which has been investigated by numerous scholars. Shi et al. investigated the mechanical properties of AAS mortar activated by NH, and the 28-day compressive strength exceeded 40 MPa when the alkali equivalent was 4–8% [10]. Fang et al. studied the mechanical properties of WG-activated AAS mortar. When the alkali equivalent was 6% and the modulus was 1.2, the compressive strength reached 94.5 MPa at 28 days [11]. However, these strong activators activated AAS cement that sets and hardens quickly, which is not convenient for engineering applications. There is also the problem of large shrinkage. Those problems pose a threat to the long-term property and durability of AAS concrete [12,13,14]. When the alkali equivalent is 4%, the initial setting time of the AAS paste prepared by WG with modulus 1.0 and NH was 15 min and 21 min, respectively [15]. The drying shrinkage of the AAS mortar activated by WG and NH was three times and six times that of the OPC mortar, respectively [15]. In addition, NH is mainly produced by the electrolysis of a saturated NaCl solution, while WG is mainly produced by the hydrothermal method or high-temperature calcination, both of which require a large amount of energy consumption and have low industrial added value. Due to the strong alkalinity of NH and WG, they are highly corrosive and do not have good operability and safety properties in engineering applications [16,17].
Some researchers have added citrogypsum to GBFS-based AAS cement activated with NH or Na2SiO3 and found that it has a negative effect on the performance [18]. However, it was found that the addition of alkaline activators and citrogypsum to the binding system separately in both cases (AAS cement activated with NH or Na2SiO3) helps to reduce the initial and final setting times [19]. This provides a new way to adjust the setting time of AAS cement. Furthermore, the possibility of recycling calcined phosphogypsum as a partial replacement for fly ash (FA) in alkali-activated FA (AAFA) paste was studied. The results show that high content of calcined phosphogypsum has a negative effect on the performance of alkali-activated FA [20].
Sodium sulfate (Na2SO4) and sodium carbonate (Na2CO3) are weakly alkaline activators compared to WG and NH. Na2SO4 is a neutral salt and shows a weak excitation effect on AAS. Na2CO3 is a weakly alkaline salt in its aqueous solution. Rashad found that the mechanical strength of AAS mortar activated by Na2SO4 is lower than that of OPC [21]. AAS cement prepared with Na2CO3 shows slow strength development in the early stages and significant strength improvement in the late stages [22,23]. Li and Sun et al. prepared AAS mortar activated by Na2CO3. The AAS mortar was still in a plastic state at 3 days, while the strength reached 60 MPa at 28 days [23]. The pore solution of AAS mortar activated by Na2CO3 is less alkaline, so the early hydration is low, while the late strength development is attributed to the formation of carbonate compounds [24]. Although AAS cement activated by Na2SO4 or Na2CO3 shows a slow strength development in the early stages, its slow hydration process is conducive to keeping AAS concrete in a plastic state for a long time, facilitating the workability adjustment and construction of an AAS concrete mixture. Moreover, its small shrinkage also contributes to the durability of AAS concrete [15,17].
To enhance the early hydration and mechanical properties of AAS cement activated by Na2SO4 and Na2CO3, many scholars have carried out research. The authors’ preliminary tests showed that the AAS paste activated by Na2SO4 or Na2CO3 alone did not set and harden and remained in a plastic state after 24 h [25]. When the amount of reactive MgO was 4–6%, the initial setting time of the Na2SO4 or Na2CO3-activated AAS paste decreased greatly and the 28-day compressive strength of the Na2SO4 and Na2CO3-activated AAS mortar was more than 30 MPa and 45 MPa, respectively [25]. After the incorporation of reactive MgO, the pH of the Na2SO4 and Na2CO3-activated AAS suspension can exceed 12. Reactive MgO elevates the pH of the paste and can significantly promote the hydration process of AAS cement activated with Na2SO4 and Na2CO3. The formation of hydration products, C-(A)-S-H gel, hydrotalcite, and ettringite (AFt), enhances the compactness of the AAS structure, thus improving the mechanical properties [25]. Abdalqader et al. studied the effect of reactive MgO on a Na2CO3-activated fly ash–slag composite system. The authors concluded that reactive MgO had a positive effect on the strength development of this cementitious material system and attributed it to the formation of hydrotalcite [26]. Yang et al. blended calcined dolomite (mainly composed of reactive MgO and CaO) into AAS cement activated with Na2CO3 and found that it accelerated the dissolution of CO32− and promoted the formation of the Mg-Al hydrotalcite phase. When 15% Na2CO3 was mixed with 10% calcined dolomite, the setting time of the AAS paste was 24 min and the 28-day compressive strength of the AAS mortar was about 40 MPa [27].
The influence of Ca(OH)2 on the mechanical properties of AAS cement activated by Na2SO4 and Na2CO3 was also studied in the authors’ preliminary experiments. The results showed that the mechanical strength of the AAS mortar activated by Na2SO4 increased first and then decreased with the increase in Ca(OH)2. When Ca(OH)2 was 3%, the mechanical properties were the best. The flexural and compressive strength at 28 days were 8.8 MPa and 40.6 MPa, respectively [28], while flash setting occurred when Ca(OH)2 was mixed into the Na2CO3-activated AAS cement [28].The authors concluded that Ca(OH)2 reacts with Na2CO3 to form calcium carbonate, resulting in the abnormally rapid setting of AAS cement. However, when Gao et al. used 8% Na2CO3 and 2.5% calcium carbide slag (mainly Ca(OH)2) as the composite activator, the 1-day and 28-day compressive strengths of the mortar were 21.8 MPa and 37.7 MPa. This indicates that Ca(OH)2 and Na2CO3 can be properly matched to prepare AAS cement to meet the demand [29].
Based on the previous study, the authors used Na2SO4, Na2CO3, reactive MgO, and Ca(OH)2 as the composite activators and studied the influence of the activators on the setting time and mechanical properties of AAS cement. The main and secondary effects of each activator on setting time and mechanical properties were analyzed by an orthogonal test. A good range for the composition of the composite activators was obtained. Then, the hydration products and microstructure of AAS cements with good mechanical properties were studied using XRD and SEM. Compared with OPC, AAS cement activated by NH and WG, the production cost, CO2 emission, and energy consumption were analyzed. It is expected that the research results of the paper will provide a theoretical basis for promoting the engineering applications of AAS cements activated by a weakly alkaline activator.

2. Experimentation

2.1. Materials

GBFS was used as the precursor and its main chemical composition is shown in Table 1. Its density is 2.87 g/cm3 and the specific surface is 435 m2/kg measured by the Blaine method. The basicity coefficient (M = (CaO + MgO)/(SiO2 + Al2O3)) is 1.08. According to GB/T 18046-2017 “Granulated blast furnace slag powder for cement, mortar and concrete” [30], its 7-day and 28-day activity indices were measured to be 85% and 105%. The XRD pattern of GBFS is shown in Figure 1. There is a large dispersion peak at 2θ between 20° and 40°, which indicates that GBFS is mainly composed of a glass phase.
Na2CO3, Na2SO4, reactive MgO, and Ca(OH)2 were combined as activators. Among them, Na2CO3, Na2SO4, and Ca(OH)2 are analytically pure reagents in powder form. Reactive MgO is a light-yellow powder and its chemical composition is shown in Table 1. According to YB/T 4019-2006 “Test methods for chemical activity of caustic burned magnesia” [31], its activity value was determined to be 150s. The sand used for the test is natural river sand with maximum particle size and a fineness modulus of 4.75 mm and 2.57. The sand was cleaned and air-dried before use. The water used in the test was tap water.

2.2. Experimental Procedures

2.2.1. Experimental Designs

An orthogonal test was used in the experiment, and an orthogonal table of L25(56) with six factors and five levels was selected. As shown in Table 2 and Table 3, the factors considered are Na2SO4, Na2CO3, reactive MgO, Ca(OH)2 and the interaction of Na2SO4 and Ca(OH)2, and the interaction of sNa2CO3 and Ca(OH)2. Each factor has five levels, and the fifth level is the pseudo level. The selected level (activator content) is based on the authors’ preliminary experimental data. The content of the activator (factor) is measured as a percentage of the total amount of GBFS and activator. Table 3 shows that there are 25 combinations of activators. When preparing AAS pastes, the water–binder ratio (W/B) is 0.30. When preparing AAS mortars, the ratio of cementitious material, sand, and water is 1:3:0.5.

2.2.2. Experimental Methods

The AAS paste was prepared according to the Chinese national standard (GB/T 1346-2011) [32]. All powder materials, that is to say GBFS and activator, were first mixed, then mixing water was added, and this was continuously stirred until a homogeneous paste was obtained. The setting time of the AAS paste is determined by Vicat apparatus. The initial setting time is the time from the addition of water to the time when the initial setting needle sinks into the paste 4 ± 1 mm from the bottom of the mold. The final setting time is the time required for the ring attachment to begin to fail to leave a mark on the paste surface. The final results were evaluated using three specimens.
AAS mortar was prepared according to the Chinese national standard (GB/T 17671-2021) [33]. Sand and all powder materials were first mixed, then mixing water was added and continuously stirred until a homogeneous mortar was obtained. The fresh AAS mortar was poured into a mold of size 40 mm × 40 mm × 160 mm and the mold surface was covered with plastic film. After 1 day of solidification at room temperature, the specimens were demolded and then cured at the condition of 20 ± 2 °C and 95 ± 5RH until the test age. Mechanical properties were carried out at 3 days and 28 days. Strength results were evaluated using three specimens.
X-ray diffraction (XRD) and scanning electron microscopy (SEM) tests were performed with the AAS paste. A paste specimen of 20 mm × 20 mm × 20 mm was prepared and cured at the condition of 20 ± 2 °C and 95 ± 5 RH for 1, 3, 7, and 28 days. Then, the AAS paste specimen was broken into small pieces and soaked in anhydrous ethanol for 3 days to terminate the hydration. Then, the specimen was baked to a constant weight in a vacuum drying oven at 60 °C. The specimen for XRD needs to be ground to pass through a 0.08 mm sieve. The XRD test was performed using a Rikaku D/Max2200 X-ray diffractometer with a Cu-Ka target at a scanning speed of 10°/min. The scanning range was 5° to 70° (2θ) with a resolution of 0.02/step. The dried specimen for SEM needs to be coated with Pt. The SEM test was performed with a ZEISS Gemini 300 SEM equipped with an Oxford X-Max50 energy spectrometer.

3. Results and Discussions

3.1. Setting Time of AAS Paste

The results of the setting time and mechanical properties of the 25 groups are summarized in Table 4. It can be seen that the initial setting time of the AAS paste is between 43–81 min and the final setting time is between 53–151 min. N15 shows the shortest initial setting time of 43 min and N7 shows the shortest final setting time of 53 min. Both the initial and final setting times of N19 are the longest, which are 81 min and 151 min, respectively.
The range analysis of the setting time of the AAS paste is shown in Table 5. The correction range value (R′) is calculated according to the following formula:
R = d × R × r
where: R′—correction range value;
d—correction factor. This is 0.45;
R—Range before correction;
R—The average number of trial replicates per level of a factor. This is 6.
Table 5. Correction range value (R′) of setting time for each factor.
FactorsR′ of Initial Setting TimeR′ of Final Setting Time
A (Na2SO4)12.0134.61
B (Na2CO3)6.6127.12
C (Reactive MgO)11.2421.38
D(Ca(OH)2)17.8639.24
A × D (Na2SO4 × Ca(OH)2)3.2214.49
B × D (Na2CO3 × Ca(OH)2)12.1624.33
It can be seen that the primary and secondary influencing factors of the initial setting time are Ca(OH)2 > Na2CO3 × Ca(OH)2 > Na2SO4 > Reactive MgO > Na2CO3 > Na2SO4 × Ca(OH)2. The content of Ca(OH)2 is the main influencing factor for the initial setting time of the AAS paste, followed by the interaction between Ca(OH)2 and Na2CO3. The interaction between Ca(OH)2 and Na2SO4 has the weakest effect on the initial setting time. The effect of the interaction between Ca(OH)2 and Na2CO3 on the initial setting time is shown in Table 6. It can be seen that the initial setting time is the longest at 80 min with the lowest content of both, and with the highest content of both, the initial setting time is the shortest at 44 min. When the Na2CO3 content is lowest at 2% at level 1, the initial setting time decreases significantly with the increase in Ca(OH)2. When the content of Na2CO3 is high, the initial setting time does not decrease significantly with the increase in Ca(OH)2. When Ca(OH)2 content is lowest at 3% at level 1, the initial setting time is shortened significantly with the increase in Na2CO3. When a high content of Ca(OH)2 is added, the initial setting time is shortened with the increase in Na2CO3. However, when 4% Ca(OH)2 at level 2 is added, the initial setting time is extended with the increase in Na2CO3.
The main order of influencing factors for the final setting time of the AAS paste is Ca(OH)2 > Na2SO4 > Na2CO3 > Na2CO3 × Ca(OH)2 > Reactive MgO > Na2SO4 × Ca(OH)2. The content of Ca(OH)2 is also the main influencing factor for the final setting time, while the effects of the interaction between Ca(OH)2 and Na2CO3 or Na2SO4 are weaker than their respective effects.
The trend chart of factors influencing the setting time for the AAS paste is shown in Figure 2. It can be seen that the initial and final setting times decrease first and then increase with the increase in Na2SO4 and Na2CO3, and they gradually decrease with the increase in Ca(OH)2. The effect of reactive MgO on the setting time is small, and the setting time is significantly shortened only when the content is high, that is, the content is 5% at level 4.
When GBFS, the activators, and water are mixed into the AAS paste, although the solubility of the different activators is different, they will be partially or completely dissolved in the mixing water to form ions, and then chemical reactions will occur. As is shown in Equations (1)–(5), since Ksp (CaSO4)/Ksp (CaCO3) > 100, Ca2+ dissolved by Ca(OH)2 will preferentially react with CO32− dissolved by Na2CO3 to precipitate CaCO3, resulting in the loss of plasticity of the AAS paste. The excess Ca2+ reacts with SO42− dissolved by Na2SO4 to form CaSO4 precipitate. The molar ratios of Ca(OH)2 to Na2CO3 and Na2SO4 of 25 combinations of activators are shown in Table 3. Except N2, N3, N4, N6, N7, N9, and N21, nCa(OH)2/n Na2CO3 > 1, nCa(OH)2/(n Na2CO3 + n Na2SO4) < 1. At this point, all the Na2CO3 participates in the reaction of Ca(OH)2 and Na2CO3, and the excess Ca(OH)2 reacts with part of the Na2SO4 until it is exhausted. The Figure 5 in Section 3.3.1 shows that much calcite is formed at 1 day, along with thenardite, while there are no diffraction peaks of the slaked lime. Therefore, Ca(OH)2 is a significant factor affecting the initial and final setting time of the AAS paste, while the interaction between Ca(OH)2 and Na2CO3 shows a stronger effect on setting time than the interaction between Ca(OH)2 and Na2SO4. Moreover, its effect on the initial setting time is more significant. As can be seen from Equations (1)–(5), the reaction between activators simultaneously enhances the alkalinity of the AAS paste system and promotes the destruction, decomposition, and repolymerization of the GBFS vitreous body. So, in summary, with the increase in Na2SO4, Na2CO3 content, the setting time decreases. However, with the formation of the more reactive products CaCO3 and CaSO4, the precipitation will wrap around the slag particles, reducing the hydration rate of the slag. So, when the amount of Na2SO4 and Na2CO3 is further increased, the setting time of the AAS paste is prolonged instead.
Na 2 CO 3   Aqueous Na + + CO 3 2
Na 2 SO 4 Aqueous Na + + SO 4 2
Ca ( OH ) 2   A q u e o u s Ca 2 + + OH
Ca 2 + + CO 3 2   A q u e o u s CaCO 3
Ca 2 + + SO 4 2   A q u e o u s CaSO 4
Considering the cost, construction, and mechanical properties of AAS cement activated by a weakly alkaline activator, the content of Na2SO4 and Na2CO3 should be slightly higher, while the content of reactive MgO and Ca(OH)2 should be slightly lower. It is recommended that the content of Na2SO4, Na2CO3, reactive MgO, and Ca(OH)2 should be 7–9%, 4–5%, 2–4%, and 3–5%, respectively.

3.2. Mechanical Properties of AAS Mortar

The results of the mechanical properties of the AAS mortar are shown in Table 4. The 3-day flexural strength is 5–8 MPa, and compressive strength is 18–31 MPa. The 28-day flexural strength is 6–9 MPa, and the compressive strength is 24–45 MPa. The AAS mortar shows good mechanical properties at 3 days. At 28 days of age, the compressive strength of specimens N8, N23, N24, and N25 exceeds 40MPa, and the flexural strength of specimens N23, N24, and N25 is about 9MPa. The range analysis of the mechanical properties is shown in Table 7. It can be seen that the primary and secondary influencing factors of 3-day flexural strength are Na2SO4 > Na2CO3 > Ca(OH)2 > Na2CO3 × Ca(OH)2 > Reactive MgO > Na2SO4 × Ca(OH)2, and that of 28-day flexural strength are Na2SO4 > Na2CO3 > Ca(OH)2> Reactive MgO > Na2CO3 × Ca(OH)2 = Na2SO4 × Ca(OH)2. The main factor influencing the flexural strength of the AAS mortar is Na2SO4, followed by Na2CO3. The interaction effects of Ca(OH)2 with Na2CO3 or Na2SO4 are weaker than their respective effects.
The order of influencing factors on the 3-day compressive strength of the AAS mortar is Na2CO3 > Ca(OH)2 > Na2CO3 × Ca(OH)2 > Na2SO4 > Na2SO4 × Ca(OH)2 > Reactive MgO, and that on 28-day compressive strength is Na2CO3 > Reactive MgO > Na2SO4 > Ca(OH)2 > Na2SO4 × Ca(OH)2 > Na2CO3 × Ca(OH)2. The main factor affecting compressive strength is Na2CO3. Ca(OH)2 is the next factor affecting the 3-day compressive strength, and the next factor affecting the 28-day compressive strength is reactive MgO. The interaction effect of Ca(OH)2 and Na2CO3 on the compressive strength of the 3-day is higher than that of the 28-day.
The trend chart of factors influencing the compressive strength of the AAS mortar is shown in Figure 3 and Figure 4. It can be seen that with the increase in Na2SO4 and Na2CO3, the mechanical strength (both flexural and compressive strength) of 3 days of AAS mortar increases, while that of 28 days increases first and then decreases. With the increase in reactive MgO from 2% to 5%, the mechanical properties increase gently except for the obvious increase in compressive strength at 28 days. With the increase in Ca(OH)2, the flexural and compressive strengths of the AAS mortar increase first and then decrease.
When the AAS cement comes into contact with the mixing water, calcium carbonate and calcium sulfate are formed due to the reaction between the ions of the activators. The alkalinity of the AAS paste rises, which promotes the destruction and decomposition of the GBFS vitreous, releasing Ca2+, Mg2+, AlO45−, and SiO44−, which further reacts to form AFt, gaylussite, C-(A)-S-H gel, and hydrotalcite. So, the AAS cement paste slowly gains mechanical strength. The form of CaCO3 contributes a lot to the compressive strength, which has a great influence on the compressive strength both at an early stage and 28 days. Ca(OH)2, especially, has a great influence on the 3-day compressive strength.
With the increase in Na2SO4 and Na2CO3, the reaction between the ions of the activators is enhanced, and the increase in system alkalinity also promotes the hydration of GBFS, so the mechanical strength increases. As the content of Na2SO4 and Na2CO3 continues to increase, products of CaCO3, Aft, et al., form a dense protective film on the slag surface, which causes the hydration to be smooth and the hydration degree to decrease, resulting in the reduction of the mechanical strength [34]. With the increase in Ca(OH)2 content, the excess Ca(OH)2 exists in the form of hexagonal platelet portlandite crystals, which will also cause the reduction of mechanical strength of the AAS mortar [35].
The incorporation of reactive MgO is conducive to the formation of hydrotalcite, which is a substance with a dense microstructure and a slightly increased volume [25]. The formation of hydrotalcite increases the compactness of the matrix, which helps to improve the mechanical properties of the AAS mortar. In general, hydrotalcite is formed when the hydration degree is high. Therefore, the effect of reactive MgO on the setting time is weak, while the improvement of the mechanical properties at 28 days is obvious. The setting time can be greatly reduced only when the content of reactive MgO is high.
According to the range analysis and the variation trend of influencing factors, the content of Na2SO4 is recommended to be 7% according to the flexural strength. The content of Na2CO3 is recommended to be 4–5% according to the compressive strength. Considering both the flexural and compressive strength, the content of Ca(OH)2 is 3–5% and that of reactive MgO is 2–4%. As can be seen from Section 3.3.1, after reactive MgO is involved in the formation of hydrotalcite, there is still a surplus. So, its content may be lower. The test results of several groups within the content range are summarized as shown in Table 8. It can be seen that the setting time of the five groups of specimens is reasonable, and the mechanical strength is high. Na2SO4 in N8 is 5%, and the reactive MgO content is 5%, but it also shows good properties, which are included in Table 8. High reactive MgO makes N8 show high 28-day compressive strength.

3.3. The Microstructure of AAS Paste

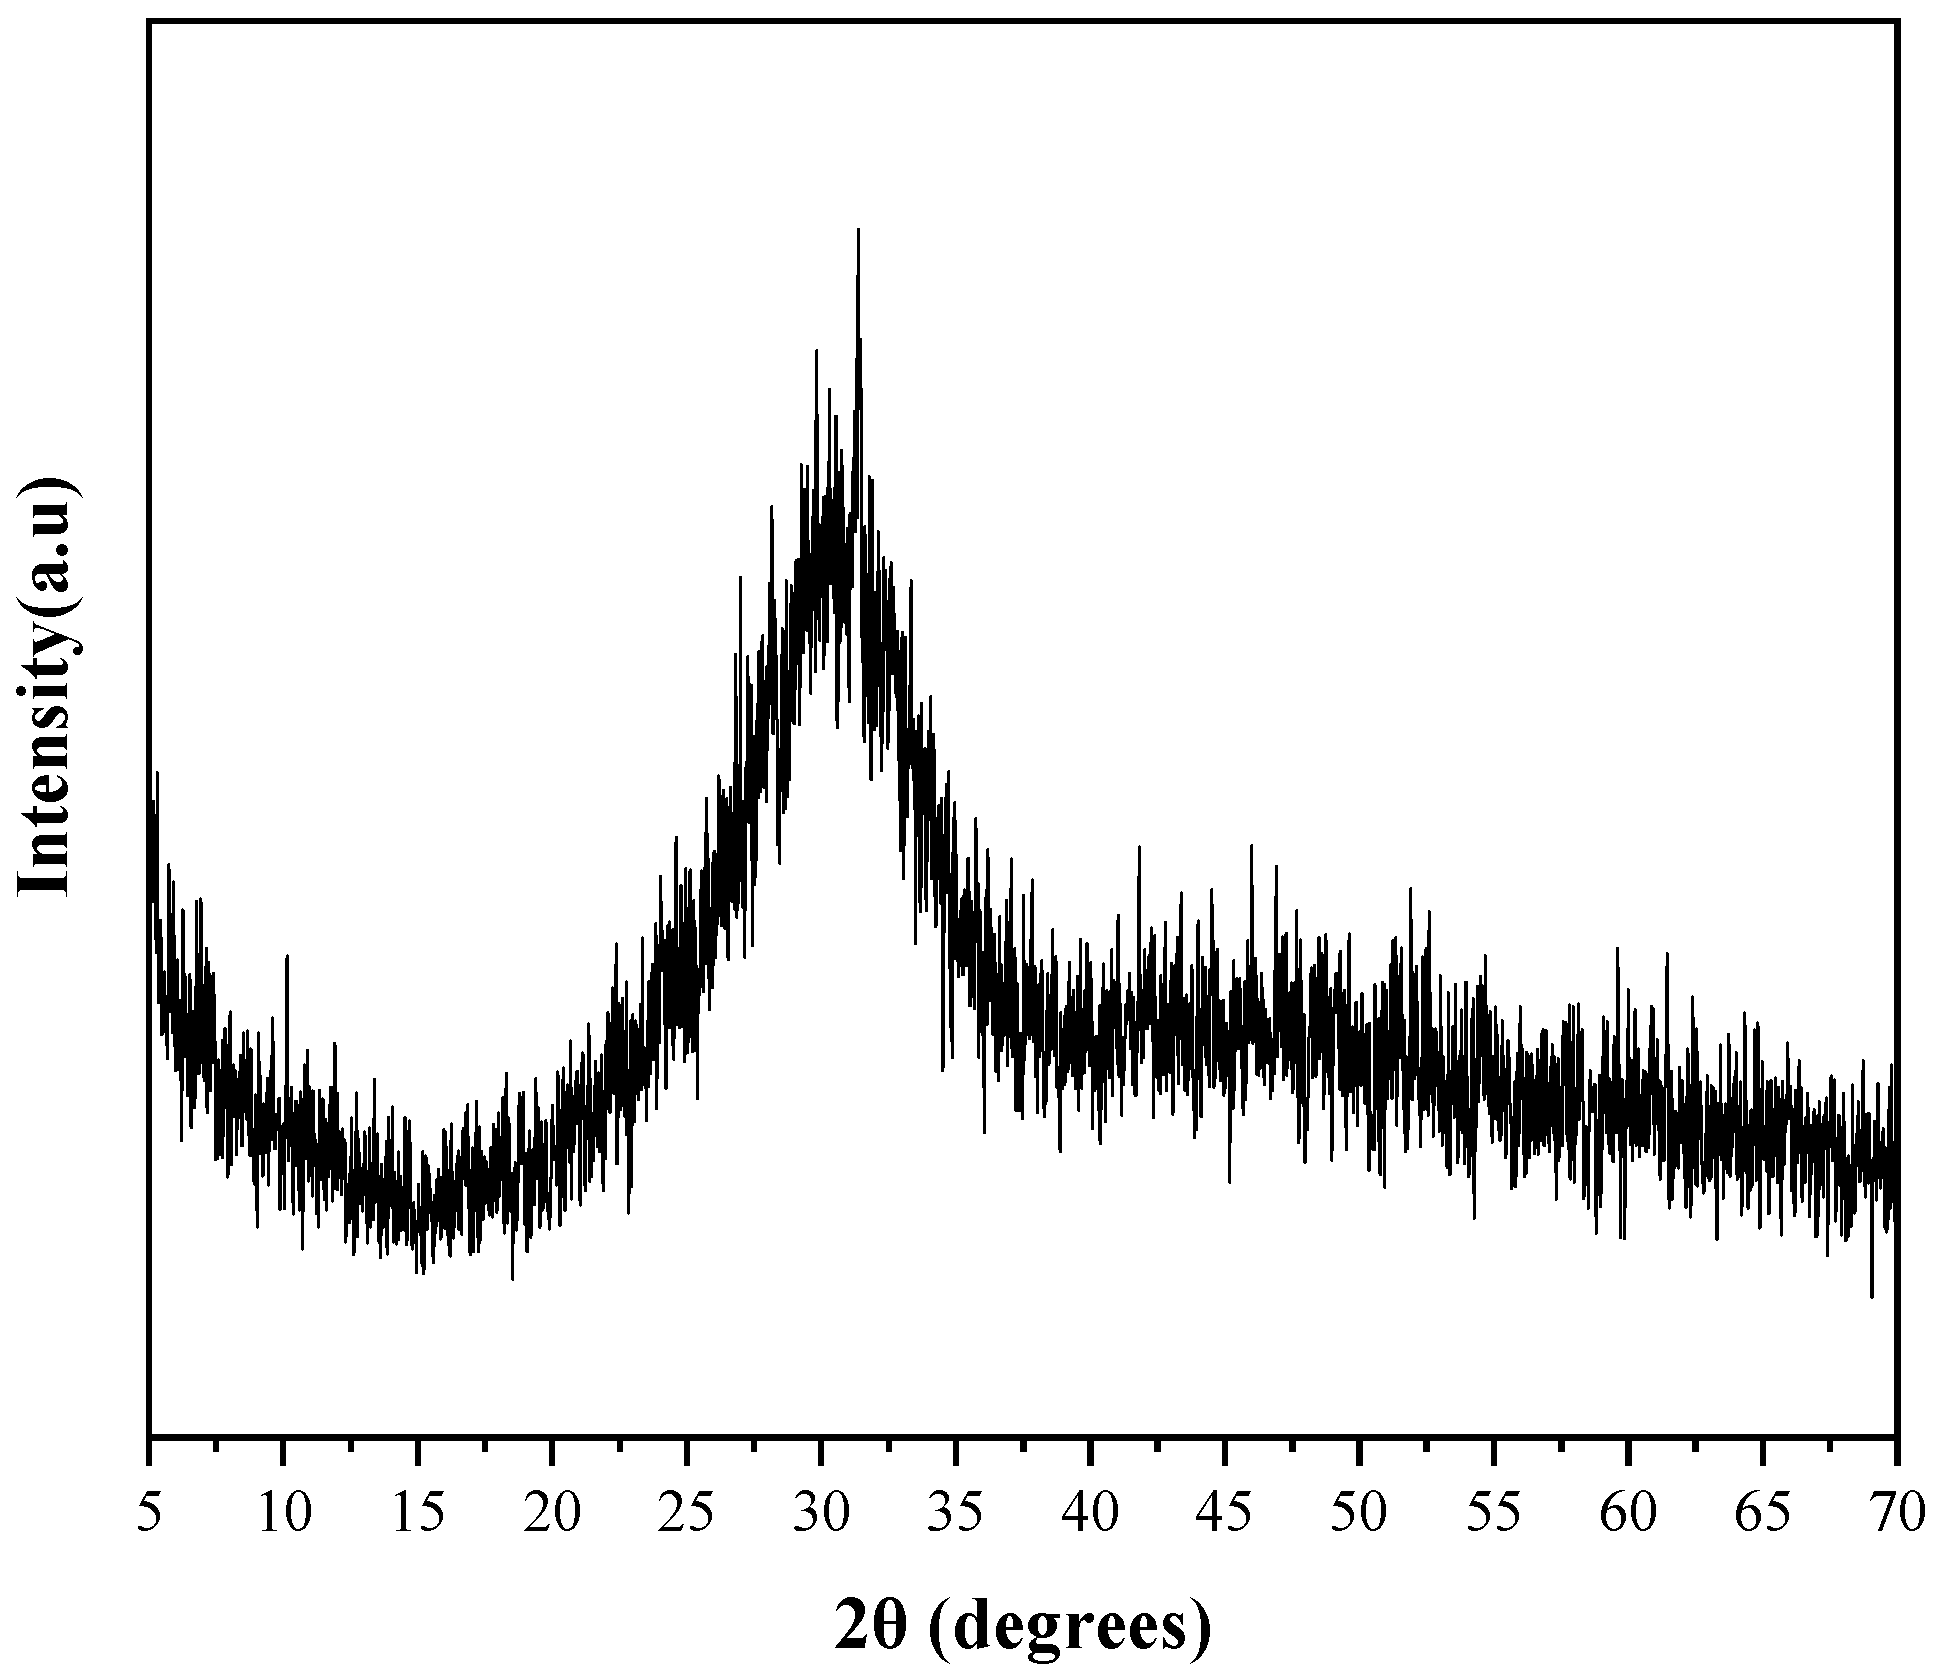
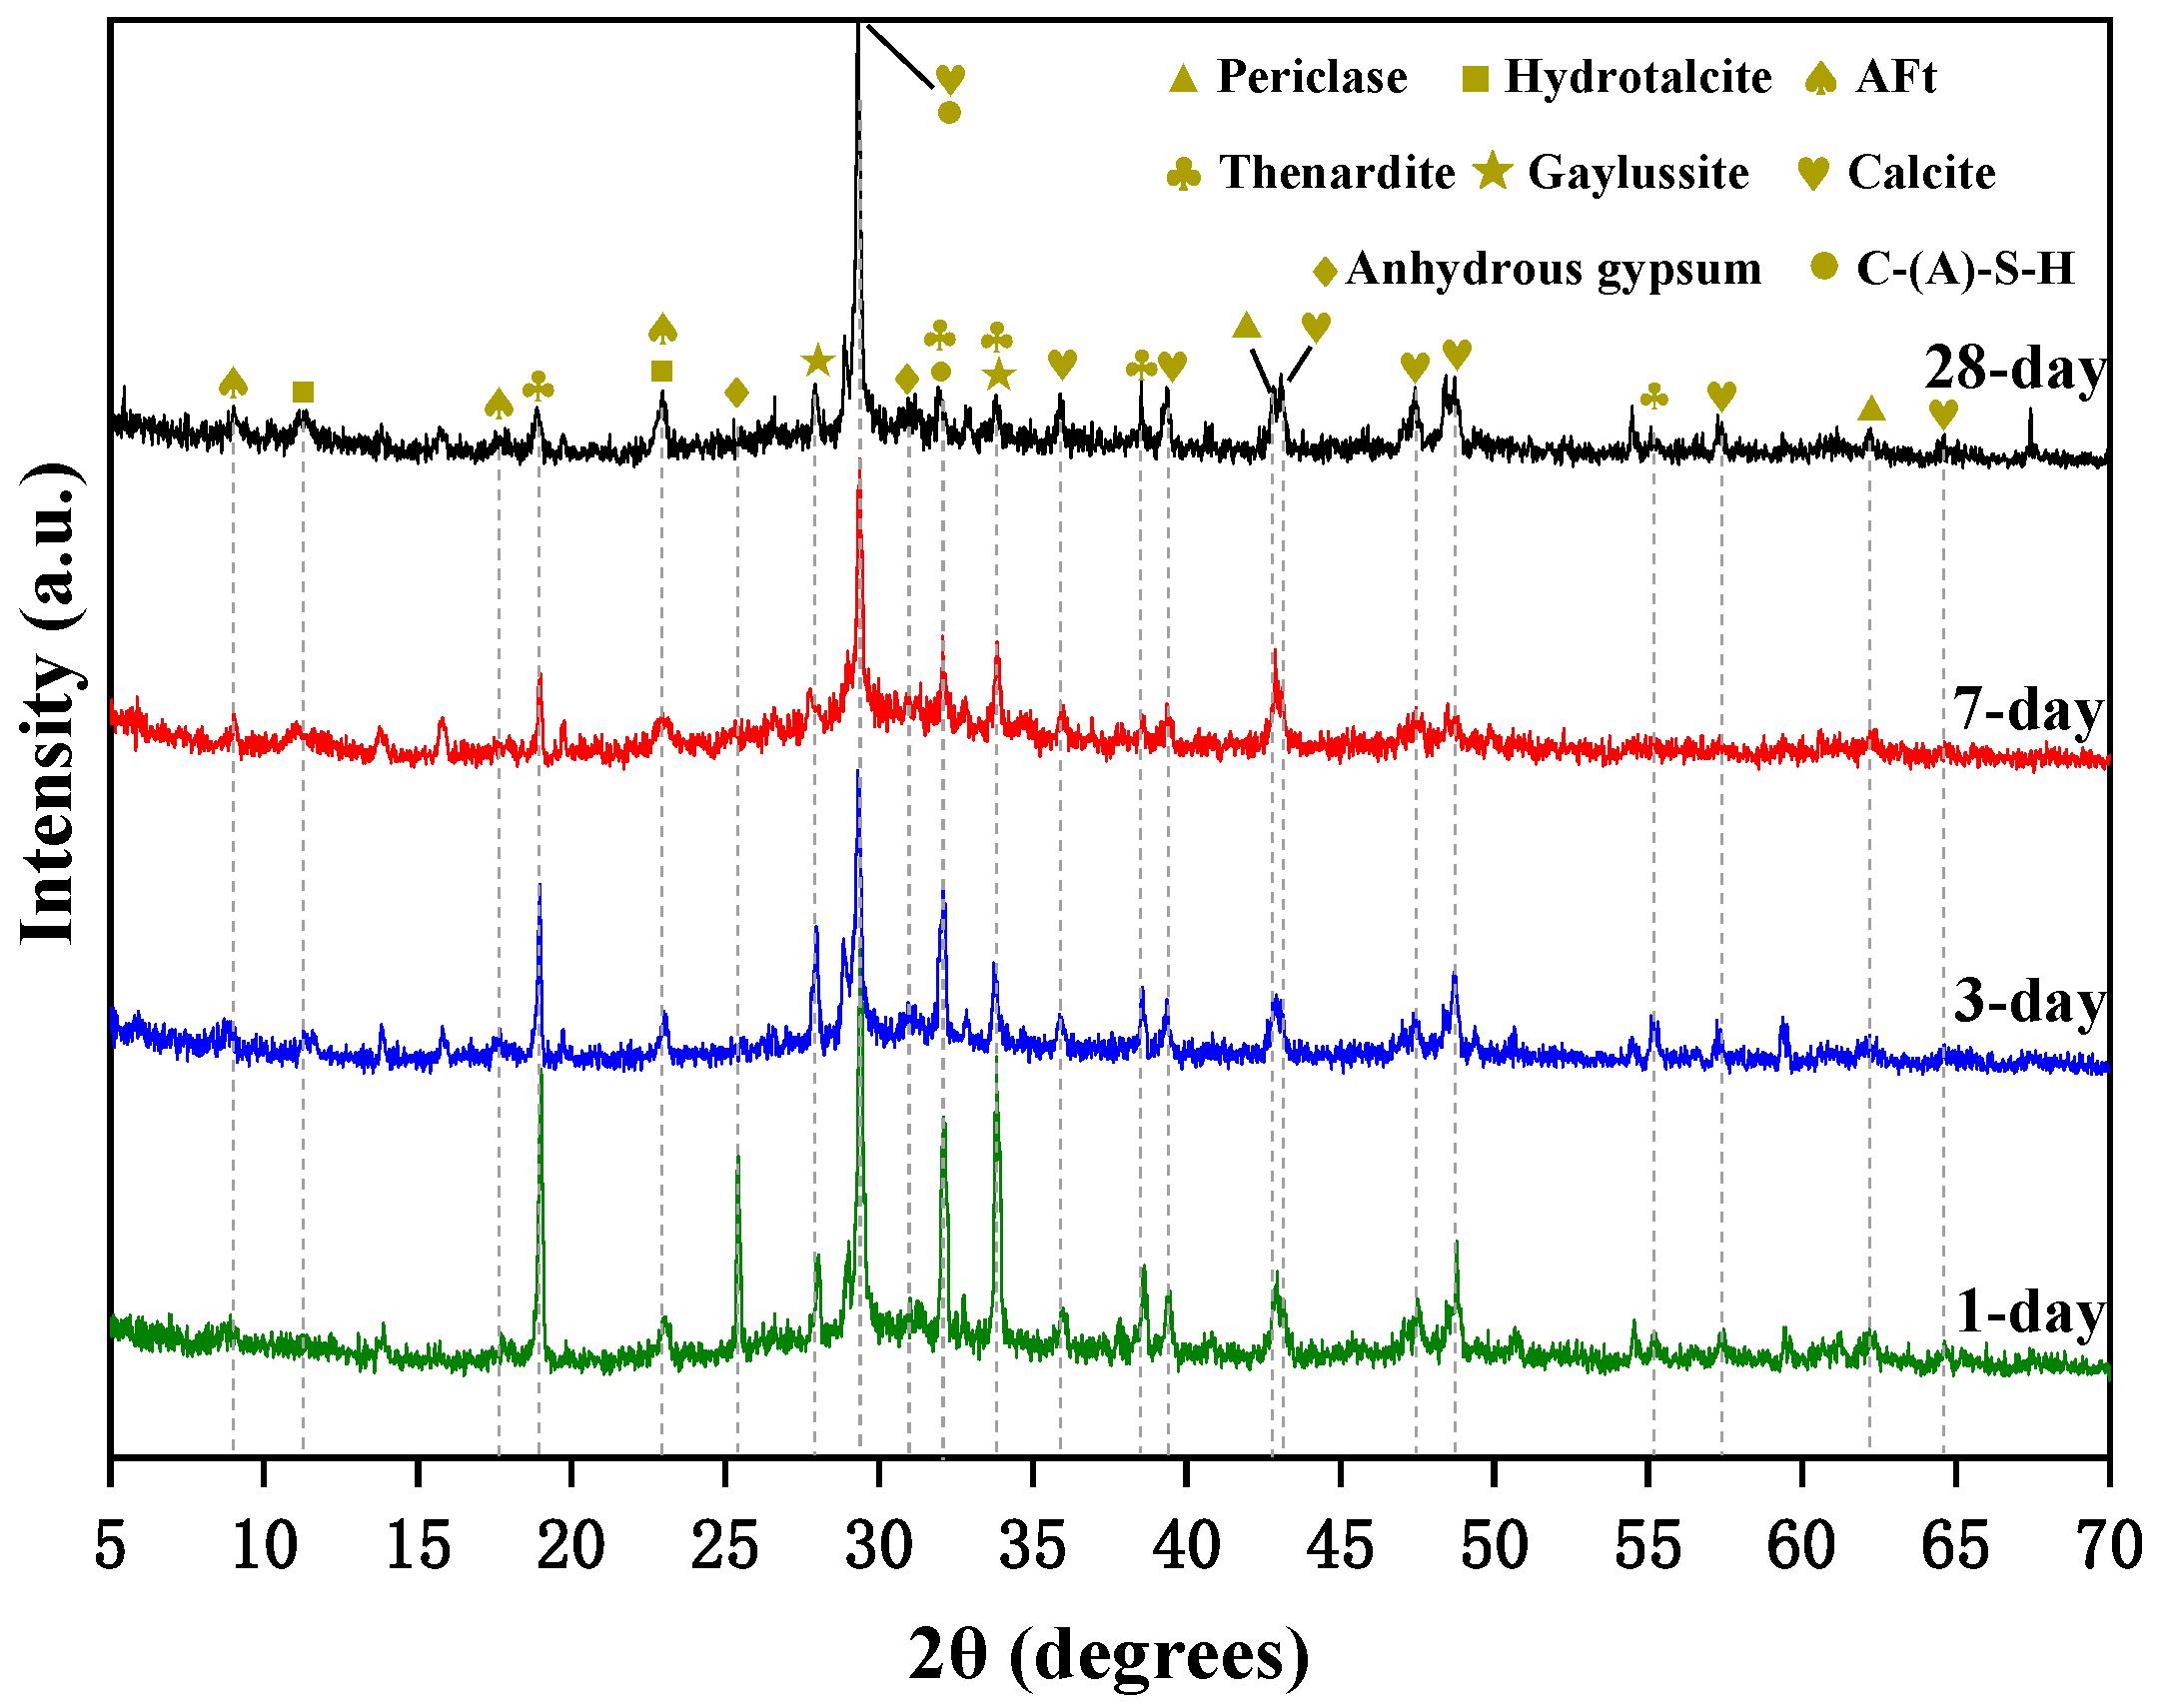
3.3.1. XRD of AAS Paste

The XRD pattern of specimen N25 is shown in Figure 5. It can be seen that the main hydration products are C-(A)-S-H gel, calcite (CaCO3), Aft (CaO·Al2O3·3CaSO4·31H2O), and hydrotalcite (Mg6Al2(OH)16CO3·4H2O). The unreacted reactive MgO and Na2SO4 appear as periclase (MgO) and thenardite (Na2SO4). Compared with the AAS cement activated by WG and NH, there are more crystal phases in the hydration products of AAS cement activated by a weakly alkaline activator.
At the age of 1 day, a high diffraction peak of calcite appears until the age of 28 days. This is due to the precipitation of CaCO3 formed by the reaction of Ca(OH)2 with Na2CO3. The diffraction peak of thenardite and anhydrous gypsum is due to the reaction of part of Na2SO4 with Ca(OH)2 to form anhydrous gypsum, and part of Na2SO4 still exists in the form of thenardite. With the age from 1 to 28 days, the diffraction peak of thenardite decreases, and that of anhydrous gypsum decreases until it disappears, while that of AFt gradually increases. This is because with the increase in age, AFt is formed by the reaction between sulfate and AlO45− decomposed from GBFS. No diffraction peak of Ca(OH)2 is found from the first day to 28 days, indicating that Ca(OH)2 is fully involved in the reaction at an early stage. So, it has a significant effect on setting time. The diffraction peak of hydrotalcite is very weak at 1 day, and its peak gradually increases with the increase in age. The diffraction peak of periclase (MgO) decreases with age and is still observed at 28 days. This indicates that the high hydration degree is beneficial to the formation of hydrotalcite, and reactive MgO is surplus, so its content can be reduced. In addition, it is also found that the diffraction peak of gaylussite (Na2Ca(CO3)2·5H2O) decreases with the increase in age because the gaylussite may be converted into a more stable calcite [21].

3.3.2. SEM of AAS Paste

The SEM images of specimen N25 are shown in Figure 6, Figure 7, Figure 8 and Figure 9. As can be seen from Figure 6, at the first day of hydration, many layered materials are intertwined with flocculated materials. The EDS shows that the substance is composed of Ca, C, O. Combined with the XRD analysis, the layered material is incomplete crystallized CaCO3, and the flocculated material was C-(A)-S-H gel. At 3 days of hydration, well-crystallized calcite appears (See Figure 7a). It can be seen from the EDS in Figure 7b that the substance is mainly composed of Na, S, O, which is thenardite that is not involved in the reaction. In addition, there are poorly crystallized gaylussites, as shown in Figure 7c. At 7 days of hydration (See Figure 8), the needle-like AFt, flocculent C-(A)-S-H gel, and lamellar hydrotalcite intersperse and overlap together. At 28 days of hydration (See Figure 9), the lamellar hexagonal crystalline hydrotalcite is interspersed in the honeycomb or reticular gel structure, forming a relatively dense hardened cement matrix.

3.4. Production Cost, CO2 Emission, and Energy Consumption

P·O 42.5 of OPC and AAS cement activated by NH and WG with the same alkali equivalent of 5.4% were selected and the production cost, CO2 emission, and energy consumption were compared with specimen N25. The mortars were prepared according to the ratio of cementitious material:sand:water = 1:3:0.5. The compressive strength was measured to calculate the cost, CO2 emission, and energy consumption per unit strength. The production cost, CO2 emission, and the energy consumption of constituent raw materials of cementitious materials are shown in Table 9. The composition of the four cementitious materials is shown in Table 10. Based on Table 9 and Table 10, production cost, CO2 emission, and energy consumption for the preparation of 1 t cementitious materials are calculated, as shown in Figure 10. For simplifying the calculation, the transportation of raw materials, mixing, and hydration of mixtures were not quantified.
As shown in Figure 10a, the highest cost of preparing 1 t cementitious material is WG, while the lowest is N25. Compared with P·O 42.5, NH, and WG, the production cost of N25 is reduced by 12.7%, 20.0%, and 41.2%, respectively. As shown in Figure 10b, the highest CO2 emission of 1 t of cementitious material is P·O 42.5 and the lowest is NH. Compared with P·O 42.5, NH, and WG, the CO2 emission of N25 decreased by 77.6% and increased by 80.0% and 9.5%. As shown in Figure 10c, the highest energy consumption in the preparation of 1 t cementitious materials is P·O 42.5 and the lowest is N25. Compared with P·O 42.5, NH, and WG, the energy consumption of N25 decreased by 87.7%, 11.0%, and 61.1%.
The 28-day compressive strength of the mortar prepared by P·O 42.5 and the AAS cement by N25, NH, and WG, according to the same mix proportion, is shown in Table 11. Based on the amount of cementitious material used in preparing a group of mortar specimens, and the cost, CO2 emission, and energy consumption of 1t cementitious material, the cost, CO2 emission, and energy consumption of a group of mortar was calculated. These data are then divided by the strength value to get the cost, CO2 emission, and energy consumption per unit strength. This is shown in Table 11. It can be seen that the 28-day compressive strength of WG-activated AAS mortar is the highest, and NH-activated AAS mortar is the lowest. The highest cost per unit strength is NH and the lowest is N25. Compared with P·O 42.5, NH, and WG, the cost per unit strength of N25 is reduced by 14.9%, 31.9%, and 10.3%. The highest CO2 emission per unit strength is P·O 42.5 and the lowest is NH. Compared with P·O 42.5, NH, and WG, the CO2 emission per unit strength of N25 decreased by 78.1% and increased by 53.3% and 66.9%. The highest energy consumption per unit strength is P·O 42.5 and the lowest is N25. Compared with P·O 42.5, NH, and WG, the energy consumption of N25 is reduced by 88.0%, 24.1% and 40.7%.
Compared with NH and WG, the CO2 emission of N25 is higher. The main reason is that Ca(OH)2 and reactive MgO are used to improve the performance of the AAS cement activated by a weakly alkaline activator. The preparation of Ca(OH)2 and reactive MgO will emit a lot of CO2. In addition, the content of Ca(OH)2 and reactive MgO in the specimen of N25 are both at the highest value of 5%. Since the content of Ca(OH)2 and reactive MgO has little effect on the performance of AAS cement, except that a low content of Ca(OH)2 obviously prolongs the final setting time, adding a low content of Ca(OH)2 and reactive MgO can significantly reduce the CO2 emission.

4. Conclusions

(1)
Ca(OH)2 was the significant factor affecting the setting time of AAS cement activated by a weakly alkaline activator. Na2SO4 and Na2CO3 are significant factors affecting the flexural strength and compressive strength of AAS mortar, respectively. The interaction between Ca(OH)2 and Na2CO3 has a greater effect on the initial setting time than on the final setting time. That interaction has a greater effect on the 3-day compressive strength than that on the 28-day compressive strength.
(2)
The reaction between the activators of Ca(OH)2 and Na2CO3 to form CaCO3 crystals is the main reason that affects the initial setting time and the early strength of AAS cement. The rapid reaction of Ca(OH)2 with Na2CO3 and Na2SO4 enhances the alkalinity of the AAS system and further promotes the hydration of GBFS. When an activator is composed of 7% Na2SO4, 4–5% Na2CO3, 3–5% Ca(OH)2, and 2–4% reactive MgO, the setting time of the AAS cement is reasonable and the mechanical property is good.
(3)
There are more crystal phases in hydration products, namely calcite, AFt, and hydrotalcite. Na2SO4 and reactive MgO contribute to the formation of AFt and hydrotalcite, respectively. The effect of the crystal phases on dry shrinkage needs to be further studied.
(4)
Compared with P·O 42.5 of OPC and AAS cement activated by NH and WG with the same alkali equivalent of 5.4%, the cost of producing 1 ton of cementitious material is reduced by 12.7%, 20.0%, and 41.2%, and energy consumption is reduced by 87.7%, 11.0%, and 61.1%. Compared with P·O 42.5, CO2 emission is reduced by 77.6%. The engineering application of AAS cement activated by weakly alkaline activators will bring good economic and environmental benefits.

Author Contributions

Conceptualization, J.H. (Juan He); funding acquisition, J.H. (Juan He) and Z.C.; data curation, S.Y.; formal analysis, S.Y. and J.W.; writing—original draft, S.Y.; writing—review & editing, S.Y. and J.H. (Juan He); project administration, G.S.; supervision, G.S. and Z.C.; visualization, J.H. (Junhong He); methodology, J.H. (Junhong He); investigation, J.W. All authors have read and agreed to the published version of the manuscript.

Funding

The financial help from National Natural Science Foundation of China (NSFC, 52078420) and National Natural Science Foundation of Shaanxi Province (2021JM-293) are gratefully acknowledged.

Institutional Review Board Statement

Not applicable.

Informed Consent Statement

Not applicable.

Data Availability Statement

Not applicable.

Conflicts of Interest

The authors declare no conflict of interest.

References

  1. Shilar, F.A.; Ganachari, S.V.; Patil, V.B.; Neelakanta Reddy, I.; Shim, J. Preparation and validation of sustainable metakaolin based geopolymer concrete for structural application. Constr. Build. Mater. 2023, 371, 130688. [Google Scholar] [CrossRef]
  2. Zhang, P.; Sun, X.; Wang, F.; Wang, J. Mechanical Properties and Durability of Geopolymer Recycled Aggregate Concrete: A Review. Polymers 2023, 15, 615. [Google Scholar] [CrossRef] [PubMed]
  3. Marvila, M.T.; Garcez de Azevedo, A.R.; Tostes Linhares Júnior, J.A.; Fontes Vieira, C.M. Activated alkali cement based on blast furnace slag: Effect of curing type and concentration of Na2O. J. Mater. Res. Technol. 2023, 23, 4551–4565. [Google Scholar] [CrossRef]
  4. Fu, Q.; Bu, M.; Zhang, Z.; Xu, W.; Yuan, Q.; Niu, D. Hydration Characteristics and Microstructure of Alkali-Activated Slag Concrete: A Review. Engineering 2021, 20, 162–179. [Google Scholar] [CrossRef]
  5. Hassan, A.; Arif, M.; Shariq, M. Use of geopolymer concrete for a cleaner and sustainable environment—A review of mechanical properties and microstructure. J. Clean. Prod. 2019, 223, 704–728. [Google Scholar] [CrossRef]
  6. Pacheco-Torgal, F.; Castro-Gomes, J.; Jalali, S. Alkali-activated binders: A review. Constr. Build. Mater. 2008, 22, 1305–1314. [Google Scholar] [CrossRef]
  7. Pacheco-Torgal, F.; Castro-Gomes, J.; Jalali, S. Alkali-activated binders: A review. Part 2. About materials and binders manufacture. Constr. Build. Mater. 2008, 22, 1315–1322. [Google Scholar] [CrossRef]
  8. Duxson, P.; Provis, J.L.; Lukey, G.C.; van Deventer, J.S.J. The role of inorganic polymer technology in the development of ‘green concrete’. Cem. Concr. Res. 2007, 37, 1590–1597. [Google Scholar] [CrossRef]
  9. Yang, K.-H.; Cho, A.-R.; Song, J.-K.; Nam, S.-H. Hydration products and strength development of calcium hydroxide-based alkali-activated slag mortars. Constr. Build. Mater. 2012, 29, 410–419. [Google Scholar] [CrossRef]
  10. Shi, Z.; Shi, C.; Wan, S.; Ou, Z. Effect of alkali dosage on alkali-silica reaction in sodium hydroxide activated slag mortars. Constr. Build. Mater. 2017, 143, 16–23. [Google Scholar] [CrossRef]
  11. Fang, S.; Lam, E.S.S.; Li, B.; Wu, B. Effect of alkali contents, moduli and curing time on engineering properties of alkali activated slag. Constr. Build. Mater. 2020, 249, 118799. [Google Scholar] [CrossRef]
  12. Aydın, S.; Baradan, B. Effect of activator type and content on properties of alkali-activated slag mortars. Compos. Part B Eng. 2014, 57, 166–172. [Google Scholar] [CrossRef]
  13. Rajabipour, F.; Giannini, E.; Dunant, C.; Ideker, J.H.; Thomas, M.D.A. Alkali–silica reaction: Current understanding of the reaction mechanisms and the knowledge gaps. Cem. Concr. Res. 2015, 76, 130–146. [Google Scholar] [CrossRef]
  14. Van Deventer, J.S.J.; Provis, J.L.; Duxson, P.; Brice, D.G. Chemical Research and Climate Change as Drivers in the Commercial Adoption of Alkali Activated Materials. Waste Biomass Valorization 2010, 1, 145–155. [Google Scholar] [CrossRef]
  15. Duran Atiş, C.; Bilim, C.; Çelik, Ö.; Karahan, O. Influence of activator on the strength and drying shrinkage of alkali-activated slag mortar. Constr. Build. Mater. 2009, 23, 548–555. [Google Scholar] [CrossRef]
  16. Bernal, S.A. Advances in near-neutral salts activation of blast furnace slags. RILEM Tech. Lett. 2016, 1, 39–44. [Google Scholar] [CrossRef]
  17. Ma, C.; Zhao, B.; Wang, L.; Long, G.; Xie, Y. Clean and low-alkalinity one-part geopolymeric cement: Effects of sodium sulfate on microstructure and properties. J. Clean. Prod. 2019, 252, 119279. [Google Scholar] [CrossRef]
  18. Kozhukhova, N.I.; Alfimova, N.I.; Kozhukhova, M.I.; Nikulin, I.S.; Glazkov, R.A.; Kolomytceva, A.I. The Effect of Recycled Citrogypsum as a Supplementary Mineral Additive on the Physical and Mechanical Performance of Granulated Blast Furnace Slag-Based Alkali-Activated Binders. Recycling 2023, 8, 22. [Google Scholar] [CrossRef]
  19. Kozhukhova, N.I.; Shurakov, I.M.; Kozhukhova, M.I.; Yu Elistratkin, M.; Alfimova, N.I. Understanding the relationship between composition and rheology in alkali-activated binders. J. Phys. Conf. Ser. 2021, 2124, 012004. [Google Scholar] [CrossRef]
  20. Rashad, A.M. Potential use of phosphogypsum in alkali-activated fly ash under the effects of elevated temperatures and thermal shock cycles. J. Clean. Prod. 2015, 87, 717–725. [Google Scholar] [CrossRef]
  21. Rashad, A.M.; Bai, Y.; Basheer, P.A.M.; Milestone, N.B.; Collier, N.C. Hydration and properties of sodium sulfate activated slag. Cem. Concr. Compos. 2013, 37, 20–29. [Google Scholar] [CrossRef]
  22. Chen, W.; Brouwers, H.J.H. The hydration of slag, part 1: Reaction models for alkali-activated slag. J. Mater. Sci. 2006, 42, 428–443. [Google Scholar] [CrossRef]
  23. Li, Y.; Sun, Y. Preliminary study on combined-alkali-slag paste materials. Constr. Build. Mater. 2000, 30, 963–966. [Google Scholar] [CrossRef]
  24. Fernández-Jiménez, A.; Palomo, J.G.; Puertas, F. Alkali-activated slag mortars Mechanical strength behaviour. Cem. Concr. Res. 1999, 29, 1313–1321. [Google Scholar] [CrossRef]
  25. Huo, J.-H.; Yu, B.-S.; Peng, Z.-G.; Wu, Z.-S.; Zhang, L.-H. Thermal control effects and mechanism of slag and fly ash on heat development of cement slurry used in hydrate formation. J. Nat. Gas Sci. Eng. 2021, 91, 103967. [Google Scholar] [CrossRef]
  26. Abdalqader, A.F.; Jin, F.; Al-Tabbaa, A. Characterisation of reactive magnesia and sodium carbonate-activated fly ash/slag paste blends. Constr. Build. Mater. 2015, 93, 506–513. [Google Scholar] [CrossRef]
  27. Yang, T.; Zhang, Z.; Zhu, H.; Zhang, W.; Gao, Y.; Zhang, X.; Wu, Q. Effects of calcined dolomite addition on reaction kinetics of one-part sodium carbonate-activated slag cements. Constr. Build. Mater. 2019, 211, 329–336. [Google Scholar] [CrossRef]
  28. He, J.; Bai, W.; Zheng, W.; He, J.; Sang, G. Influence of hydrated lime on mechanical and shrinkage properties of alkali-activated slag cement. Constr. Build. Mater. 2021, 289, 123201. [Google Scholar] [CrossRef]
  29. Gao, X.; Yao, X.; Yang, T.; Zhou, S.; Wei, H.; Zhang, Z. Calcium carbide residue as auxiliary activator for one-part sodium carbonate-activated slag cements: Compressive strength, phase assemblage and environmental benefits. Constr. Build. Mater. 2021, 308, 125015. [Google Scholar] [CrossRef]
  30. GB/T 18046-2017; Ground Granulated Blast Furnace Slag Used for Cement, Mortar and Concrete. SAC: Beijing, China, 2017.
  31. YB/T 4019-2006; Test Methods for Chemical Activity of Caustic Burned Magnesia. SAC: Beijing, China, 2006.
  32. GB/T 1346-2011; Test Methods for Water Requirement of Normal Consistency, Setting Time and Soundness of the Portland Cement. SAC: Beijing, China, 2011.
  33. GB/T 17671-2022; Method of Testing Cements-Determination of Strength. SAC: Beijing, China, 2021.
  34. Sujin Song, H.M.J. Pore solution chemistry of alkali-activated ground granulated blast-furnace slag. Cem. Concr. Res. 1999, 29, 159–170. [Google Scholar] [CrossRef]
  35. Jeong, Y.; Oh, J.E.; Jun, Y.; Park, J.; Ha, J.-H.; Sohn, S.G. Influence of four additional activators on hydrated-lime [Ca(OH)2] activated ground granulated blast-furnace slag. Cem. Concr. Compos. 2016, 65, 1–10. [Google Scholar] [CrossRef]
  36. Moseson, A.J.; Moseson, D.E.; Barsoum, M.W. High volume limestone alkali-activated cement developed by design of experiment. Cem. Concr. Compos. 2012, 34, 328–336. [Google Scholar] [CrossRef]
  37. Hangxing, D.; Shiyu, Z.; Xiaolong, Z.; Zhaohao, Z.; Yingliang, Z. Low carbon cementitious composites: Calcined quarry dust modified lime/sodium sulfate-activated slag. Constr. Build. Mater. 2021, 282, 122521. [Google Scholar] [CrossRef]
  38. Sahu, P.; Upadhyay, S.C.; Bhatti, S.; Mahey, J.K.; Sanghavi, R.J.; Kumar, A. Sodium-sulphate production from sulphate-rich bittern: A parametric study and economic evaluation. J. Environ. Chem. Eng. 2021, 9, 105632. [Google Scholar] [CrossRef]
  39. Nguyen, L.; Moseson, A.J.; Farnam, Y.; Spatari, S. Effects of composition and transportation logistics on environmental, energy and cost metrics for the production of alternative cementitious binders. J. Clean. Prod. 2018, 185, 628–645. [Google Scholar] [CrossRef]
  40. Yang, K.-H.; Song, J.-K.; Song, K.-I. Assessment of CO2 reduction of alkali-activated concrete. J. Clean. Prod. 2013, 39, 265–272. [Google Scholar] [CrossRef]
  41. Fawer, M.; Concannon, M.; Rieber, W. Life cycle inventories for the production of sodium silicates. Int. J. Life Cycle Assess. 1999, 4, 207–212. [Google Scholar] [CrossRef]
Figure 1. XRD pattern of GBFS.
Materials 16 03871 g001
Figure 2. Trend chart of factors influencing setting time of AAS paste.
Materials 16 03871 g002
Figure 3. Trend chart of factors influencing flexural strength of AAS mortar.
Materials 16 03871 g003
Figure 4. Trend chart of factors influencing compressive strength of AAS mortar.
Materials 16 03871 g004
Figure 5. X-ray diffraction patterns of specimen N25.
Materials 16 03871 g005
Figure 6. Micrographs of specimen N25 cured for 1 day.
Materials 16 03871 g006
Figure 7. (ac) Micrographs of specimen N25 cured for 3 days.
Materials 16 03871 g007aMaterials 16 03871 g007b
Figure 8. Micrographs of specimen N25 cured for 7 days.
Materials 16 03871 g008
Figure 9. Micrographs of specimen N25 cured for 28 days.
Materials 16 03871 g009
Figure 10. (a) Cost, (b) CO2 emission, (c) energy consumption of P·O 42.5, N25, NH, and WG.
Materials 16 03871 g010
Table 1. Chemical composition of GBFS and reactive MgO (%).
CompositionGBFSReactive MgO
CaO41.155.07
MgO7.6787.00
Al2O314.410.58
Fe2O30.490.99
SiO230.915.21
SO31.610.86
Na2O0.750.02
K2O0.570.06
Loss of ignition2.440.21
Table 2. Factor level table.
LevelABCDEF
Na2SO4
(%)
Na2CO3
(%)
Reactive MgO (%)Ca(OH)2
(%)
Na2SO4
×Ca(OH)2
Na2CO3
×Ca(OH)2
1322311
2533422
3744533
4955644
5743455
Table 3. Orthogonal experimental design table.
Serial NumberNa2SO4
(%)
Na2CO3
(%)
Reactive
MgO(%)
Ca(OH)2
(%)
Na2SO4
×Ca(OH)2
Na2CO3
×Ca(OH)2
nCa(OH)2
/nNa2CO3
nCa(OH)2
/nNa2SO4
nCa(OH)2
/(nNa2SO4 + nNa2CO3)
N13223112.11.91
N23334221.92.61.1
N33445331.83.21.1
N43556441.73.81.2
N53434551.42.60.9
N65235453.61.91.2
N75346512.92.31.3
N85454121.41.50.7
N95533230.91.20.5
N105424341.41.50.7
N117244242.91.10.8
N127353351.40.80.5
N137434411.41.10.6
N147525521.41.40.7
N157436132.11.60.9
N169254532.90.90.7
N179335142.41.10.7
N189426252.11.30.8
N199534311.10.90.5
N209443421.10.60.4
N217236324.31.61.2
N227324431.91.10.7
N237433541.10.80.5
N247544151.11.10.6
N257455211.81.40.8
Table 4. Setting time of AAS paste and mechanical strength of AAS mortar.
Serial NumberInitial
Setting Time
(min)
Final
Setting Time
(min)
3-Day
Flexural Strength (MPa)
3-Day Compressive Strength (MPa)28-Day
Flexural Strength (MPa)
28-Day Compressive Strength (MPa)
N1801405.1 21.9 6.2 26.9
N258835.6 27.0 7.3 33.2
N349775.9 26.9 7.6 34.7
N444675.9 25.3 6.9 35.5
N5711056.1 27.4 7.7 35.0
N649666.0 18.3 7.4 28.4
N747536.7 25.8 7.6 36.8
N849796.4 26.2 7.7 44.4
N959776.6 31.5 7.8 36.7
N1049687.2 30.1 7.9 37.6
N1151736.2 19.4 7.3 29.6
N1247696.5 25.7 8.5 34.3
N1351887.2 27.8 8.0 39.0
N1450876.8 29.0 8.2 37.2
N1543666.7 30.1 7.6 35.6
N1644686.9 28.0 8.2 37.6
N1745767.7 27.5 8.5 34.8
N1847776.6 23.7 7.5 32.2
N19811517.3 29.8 7.7 36.2
N20791286.8 29.1 8.0 39.2
N2152726.2 18.0 8.2 31.5
N2256727.2 27.2 8.8 38.2
N2349997.0 28.0 8.9 41.1
N2449947.5 31.9 9.1 43.0
N2547647.9 30.6 9.0 44.6
Table 6. Interaction of B (Na2CO3) × D (Ca(OH)2) on initial setting time (min).
D (Ca(OH)2)D1D2D3D4
B (Na2CO3)
B180484952
B247574547
B364554845
B459655044
Table 7. Correction range value (R′) of mechanical strength of AAS mortar.
FactorsR′ of 3-Day Flexural StrengthR′ of 3-Day Compressive StrengthR′ of 28-Day Flexural StrengthR′ of 28-Day Compressive Strength
A (Na2SO4)1.482.121.344.79
B (Na2CO3)0.829.240.758.31
C (Reactive MgO)0.150.860.375.36
D (Ca(OH)2)0.513.200.643.37
A × D (Na2SO4
×Ca(OH)2)
0.111.880.302.40
B × D (Na2CO3
×Ca(OH)2)
0.432.990.302.25
Table 8. Results of specimens with good properties.
Serial NumberInitial
Setting
Time (min)
Final
Setting
Time (min)
3-Day
Flexural Strength (MPa)
3-Day Compressive Strength (Mpa)28-Day
Flexural Strength (Mpa)
28-Day Compressive Strength (Mpa)
N1351887.2 27.8 8.0 39.0
N2349997.0 28.0 8.9 41.1
N2449947.531.99.143.0
N2547647.9 30.6 9.0 44.6
N849796.4 26.2 7.7 44.4
Table 9. Production cost, CO2 emission, and energy consumption of constituent raw materials.
Cost
(CNY/t) c
CO2 Emission
(kg/t) d
Energy Consumption
(GJ/t) d
Reference
Na2CO315801111.3[36]
Na2SO47206400.3[37,38]
NH38007509.5[39]
Ca(OH)27008304[36]
Reactive MgO a45012006.3
P·O 42.55259445.5[17,40]
GBFS330700.1[39]
WG b11004254.6[41]
a This information was provided by the manufacturer. b The modulus of WG was 3.2. c Cost data obtained from Chinese market. d CO2 emission and energy consumption data obtained from [17,36,37,38,39,40,41].
Table 10. The composition of P·O 42.5 and AAS cement of N25, NH, WG (%).
Cementitious MaterialGBFSNa2SO4Na2CO3Ca(OH)2Reactive MgOP·O 42.5NHWG
P·O 42.5 100
N25797455
NH-AAS cement93 7
WG AAS cement a73.6 9.117.3
a The modulus of raw WG was 3.2, adjusted to 1.2 by adding NH.
Table 11. Compressive strength and the cost, CO2 emission, and energy consumption per unit strength.
Cementitious
Material
28-Day Compressive
Strength (MPa)
Cost/Strength
(CNY/(MPa))
CO2 Emission/Strength
(kg/(MPa))
Energy Consumption/Strength
(GJ/(MPa))
P·O 42.543.50.00549.770.057
N25-AAS cement44.60.00462.140.007
NH-AAS cement38.00.00681.390.009
WG68.00.00521.280.011
Disclaimer/Publisher’s Note: The statements, opinions and data contained in all publications are solely those of the individual author(s) and contributor(s) and not of MDPI and/or the editor(s). MDPI and/or the editor(s) disclaim responsibility for any injury to people or property resulting from any ideas, methods, instructions or products referred to in the content.

