
Analysis of Electrical Resistivity Characteristics and Damage Evolution of Soil–Rock Mixture under Triaxial Shear


Abstract
:1. Introduction
2. Materials and Methods
2.1. Experimental Setup
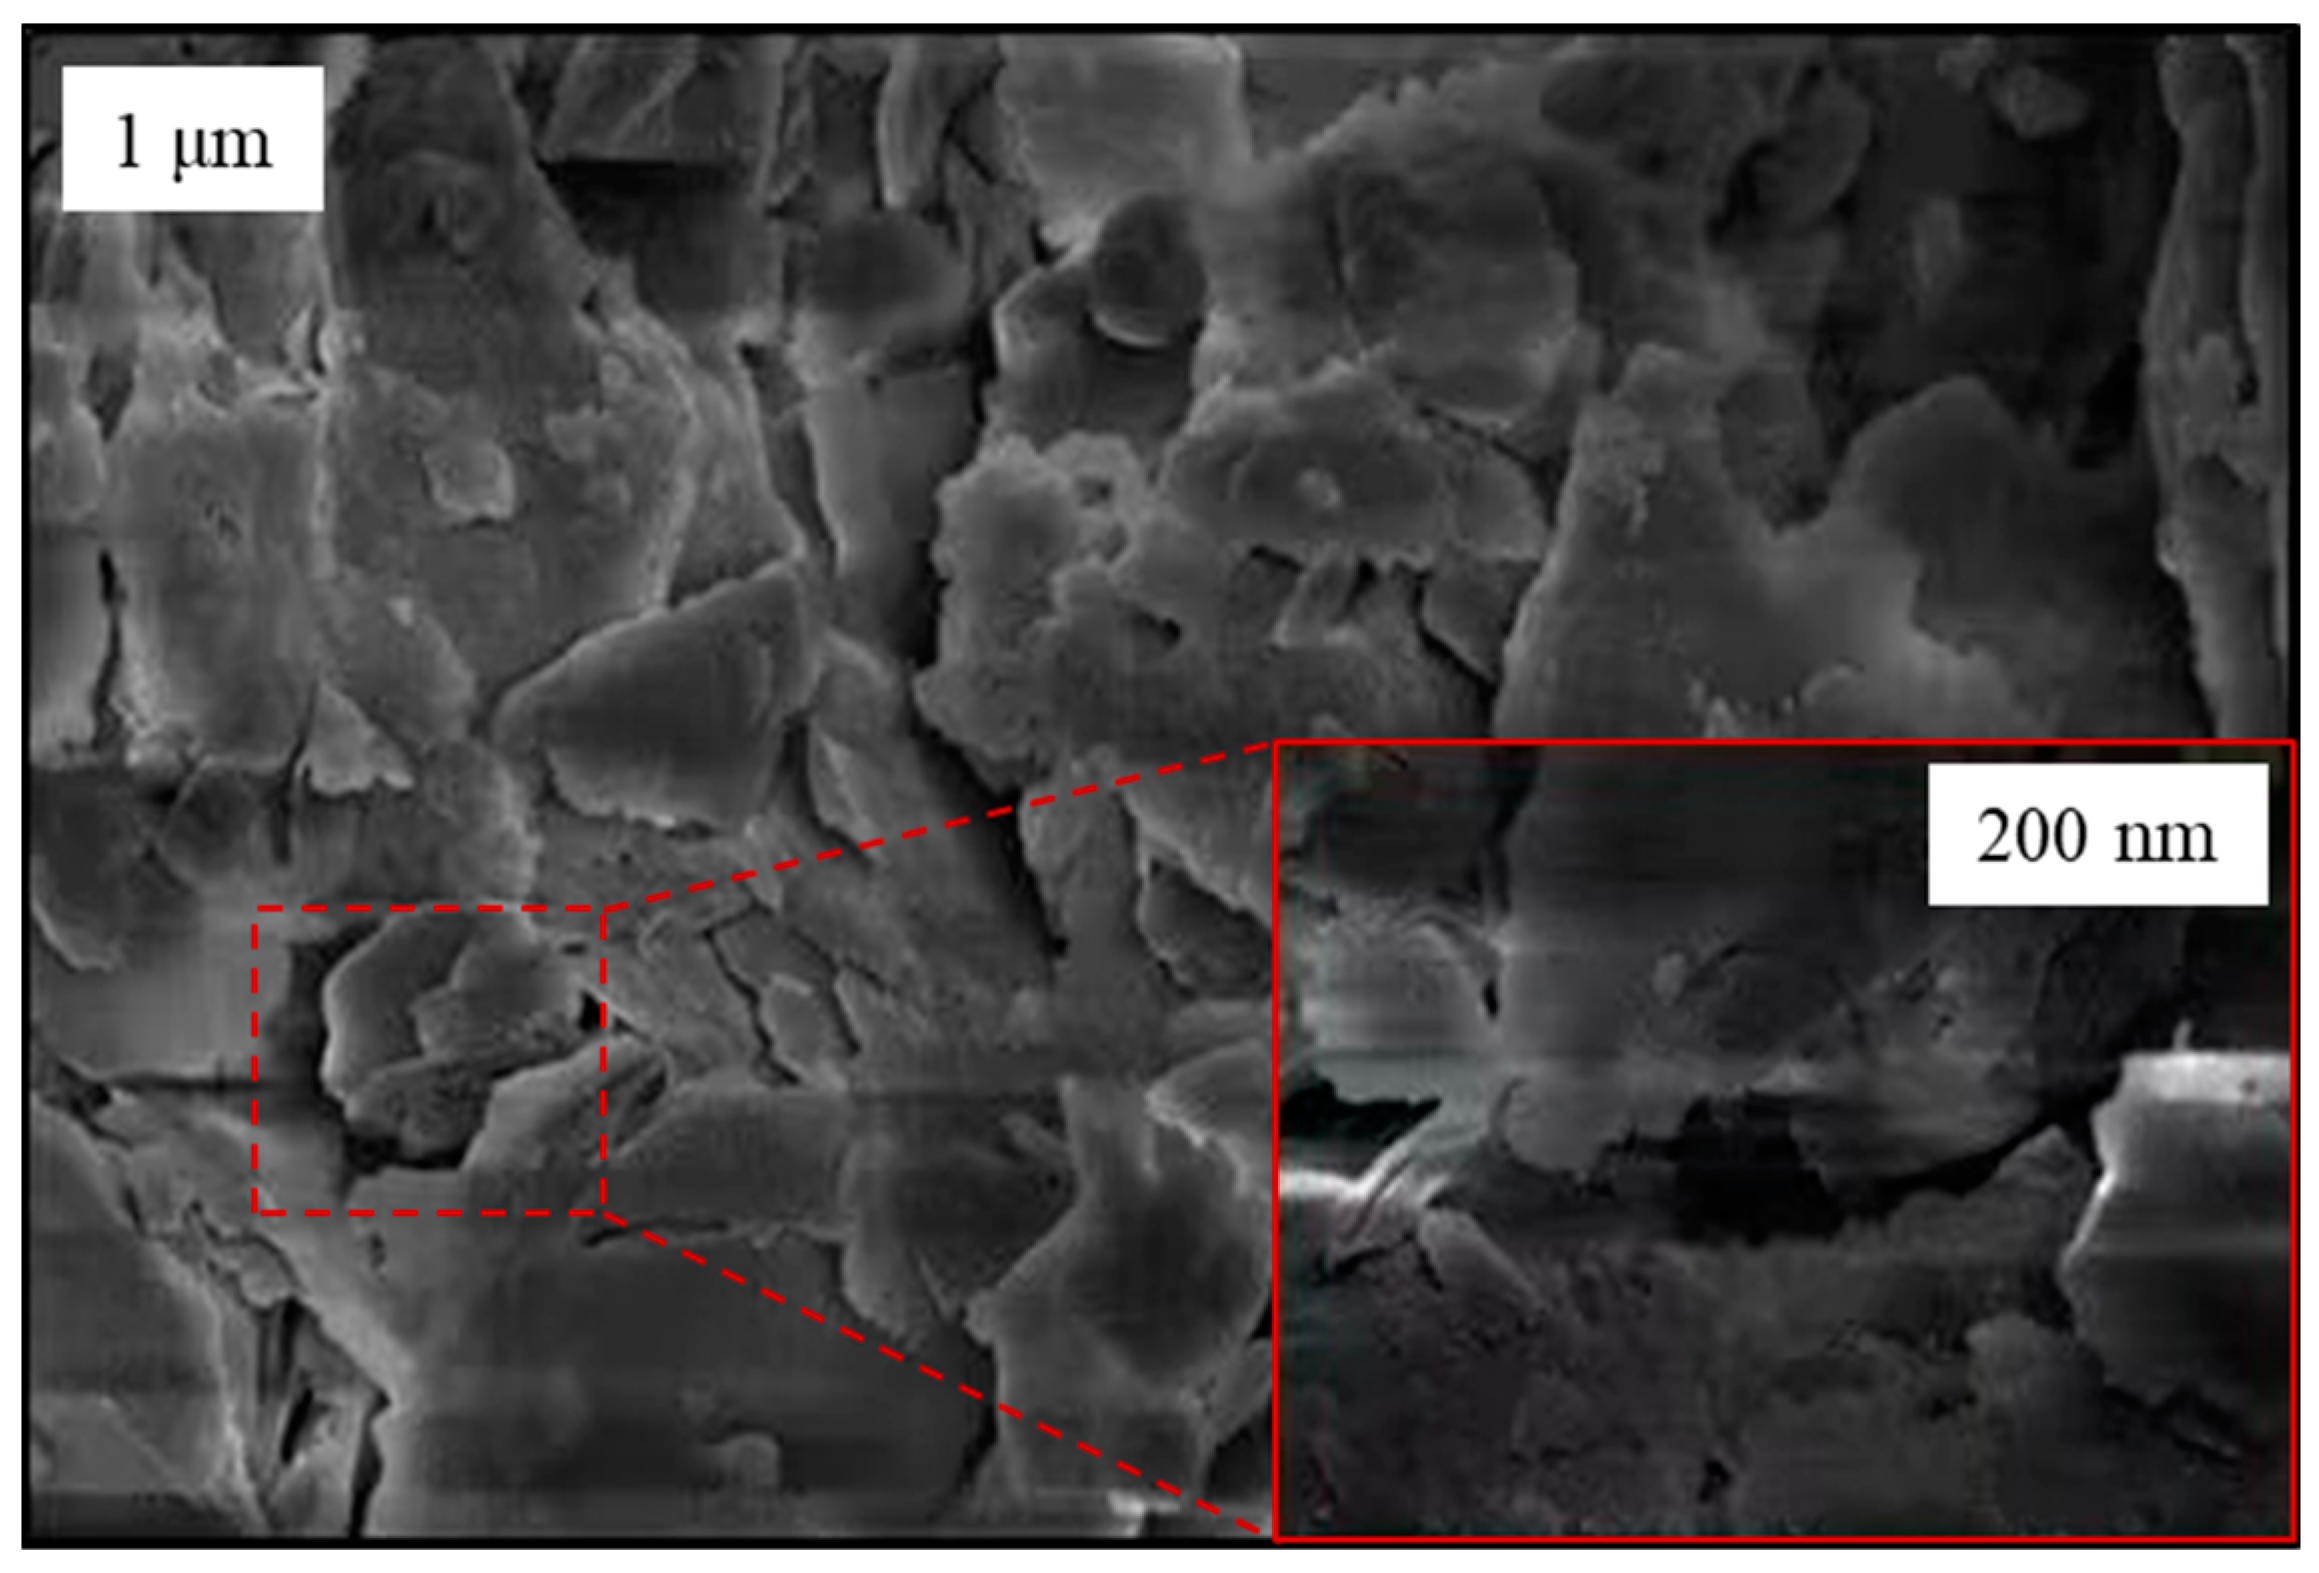
2.2. Materials
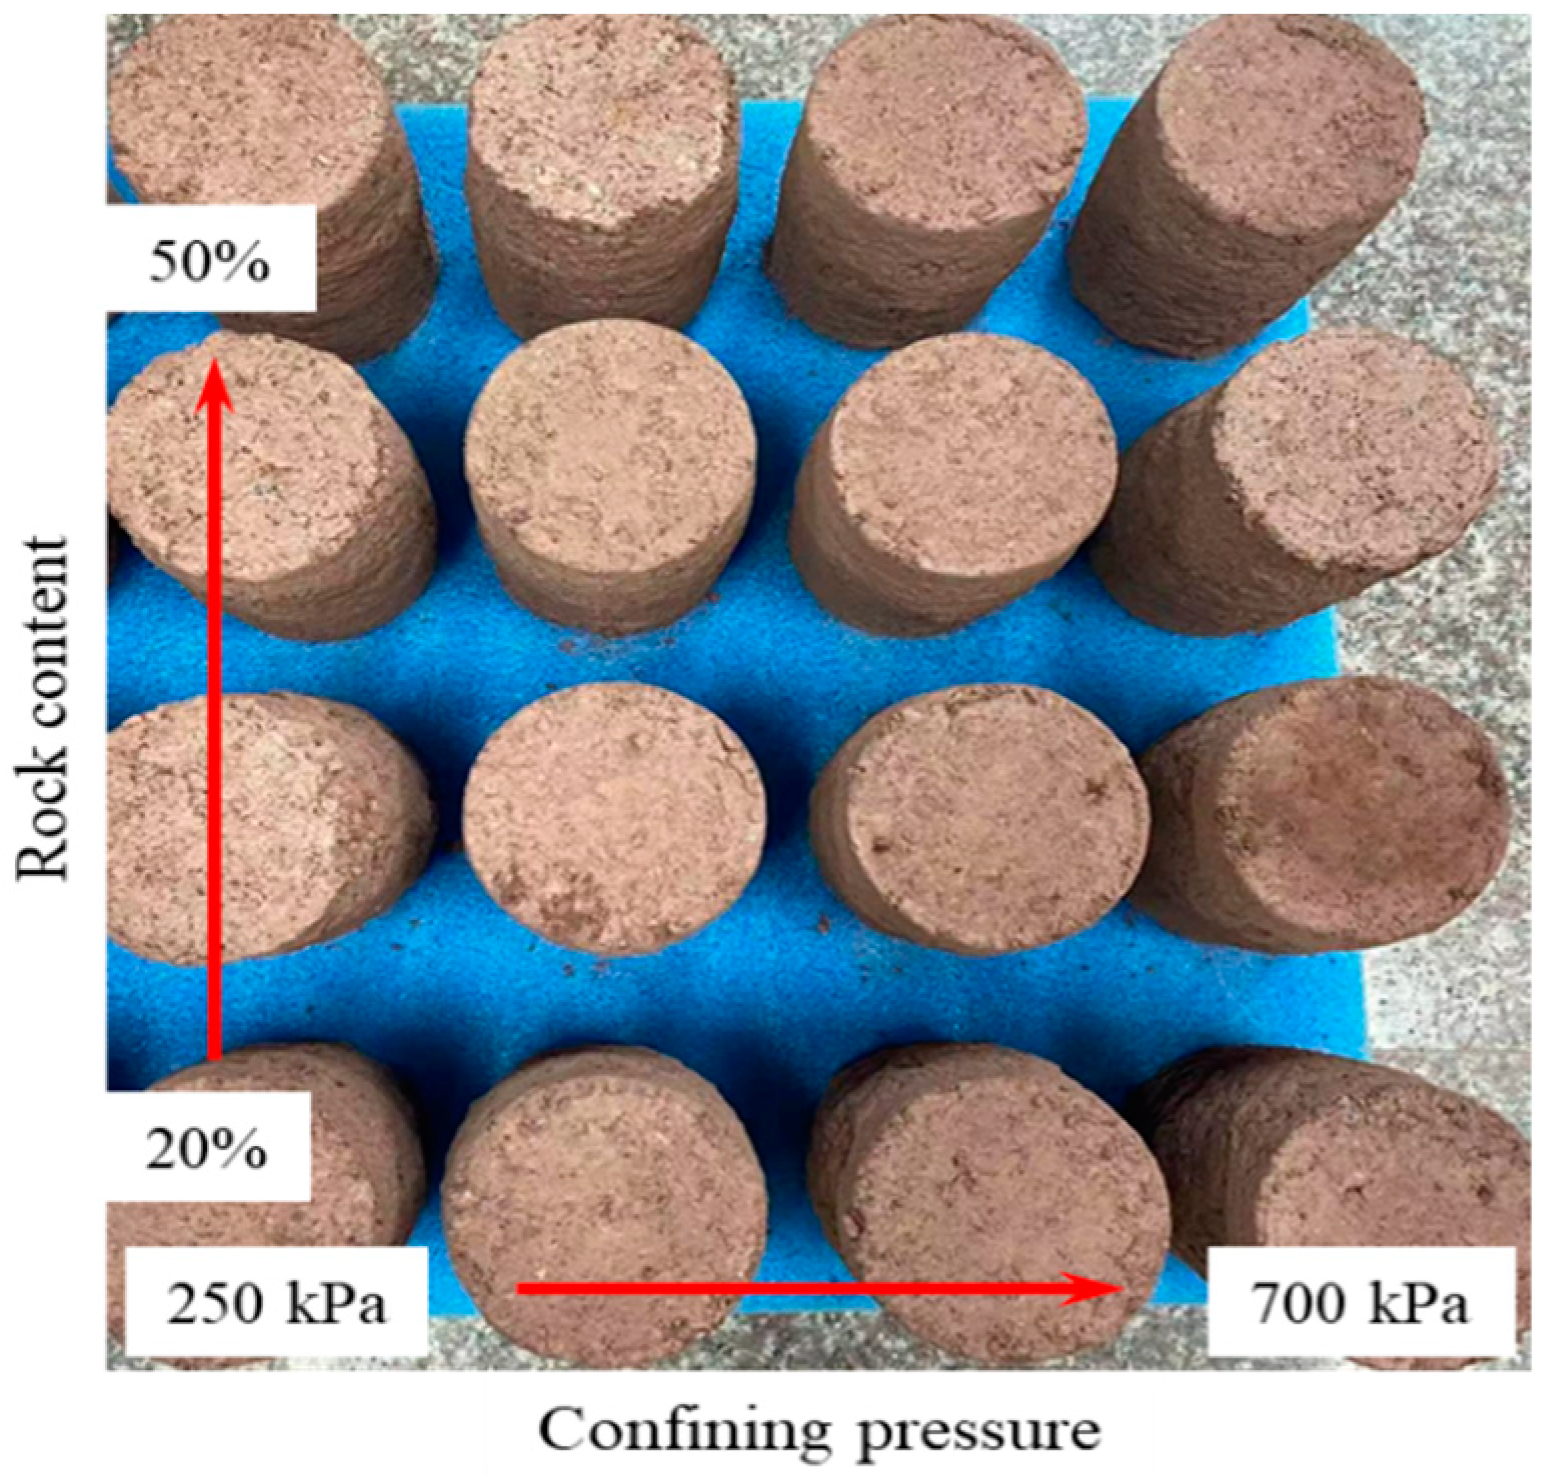
2.3. Test Procedure
3. Experimental Results and Discussion
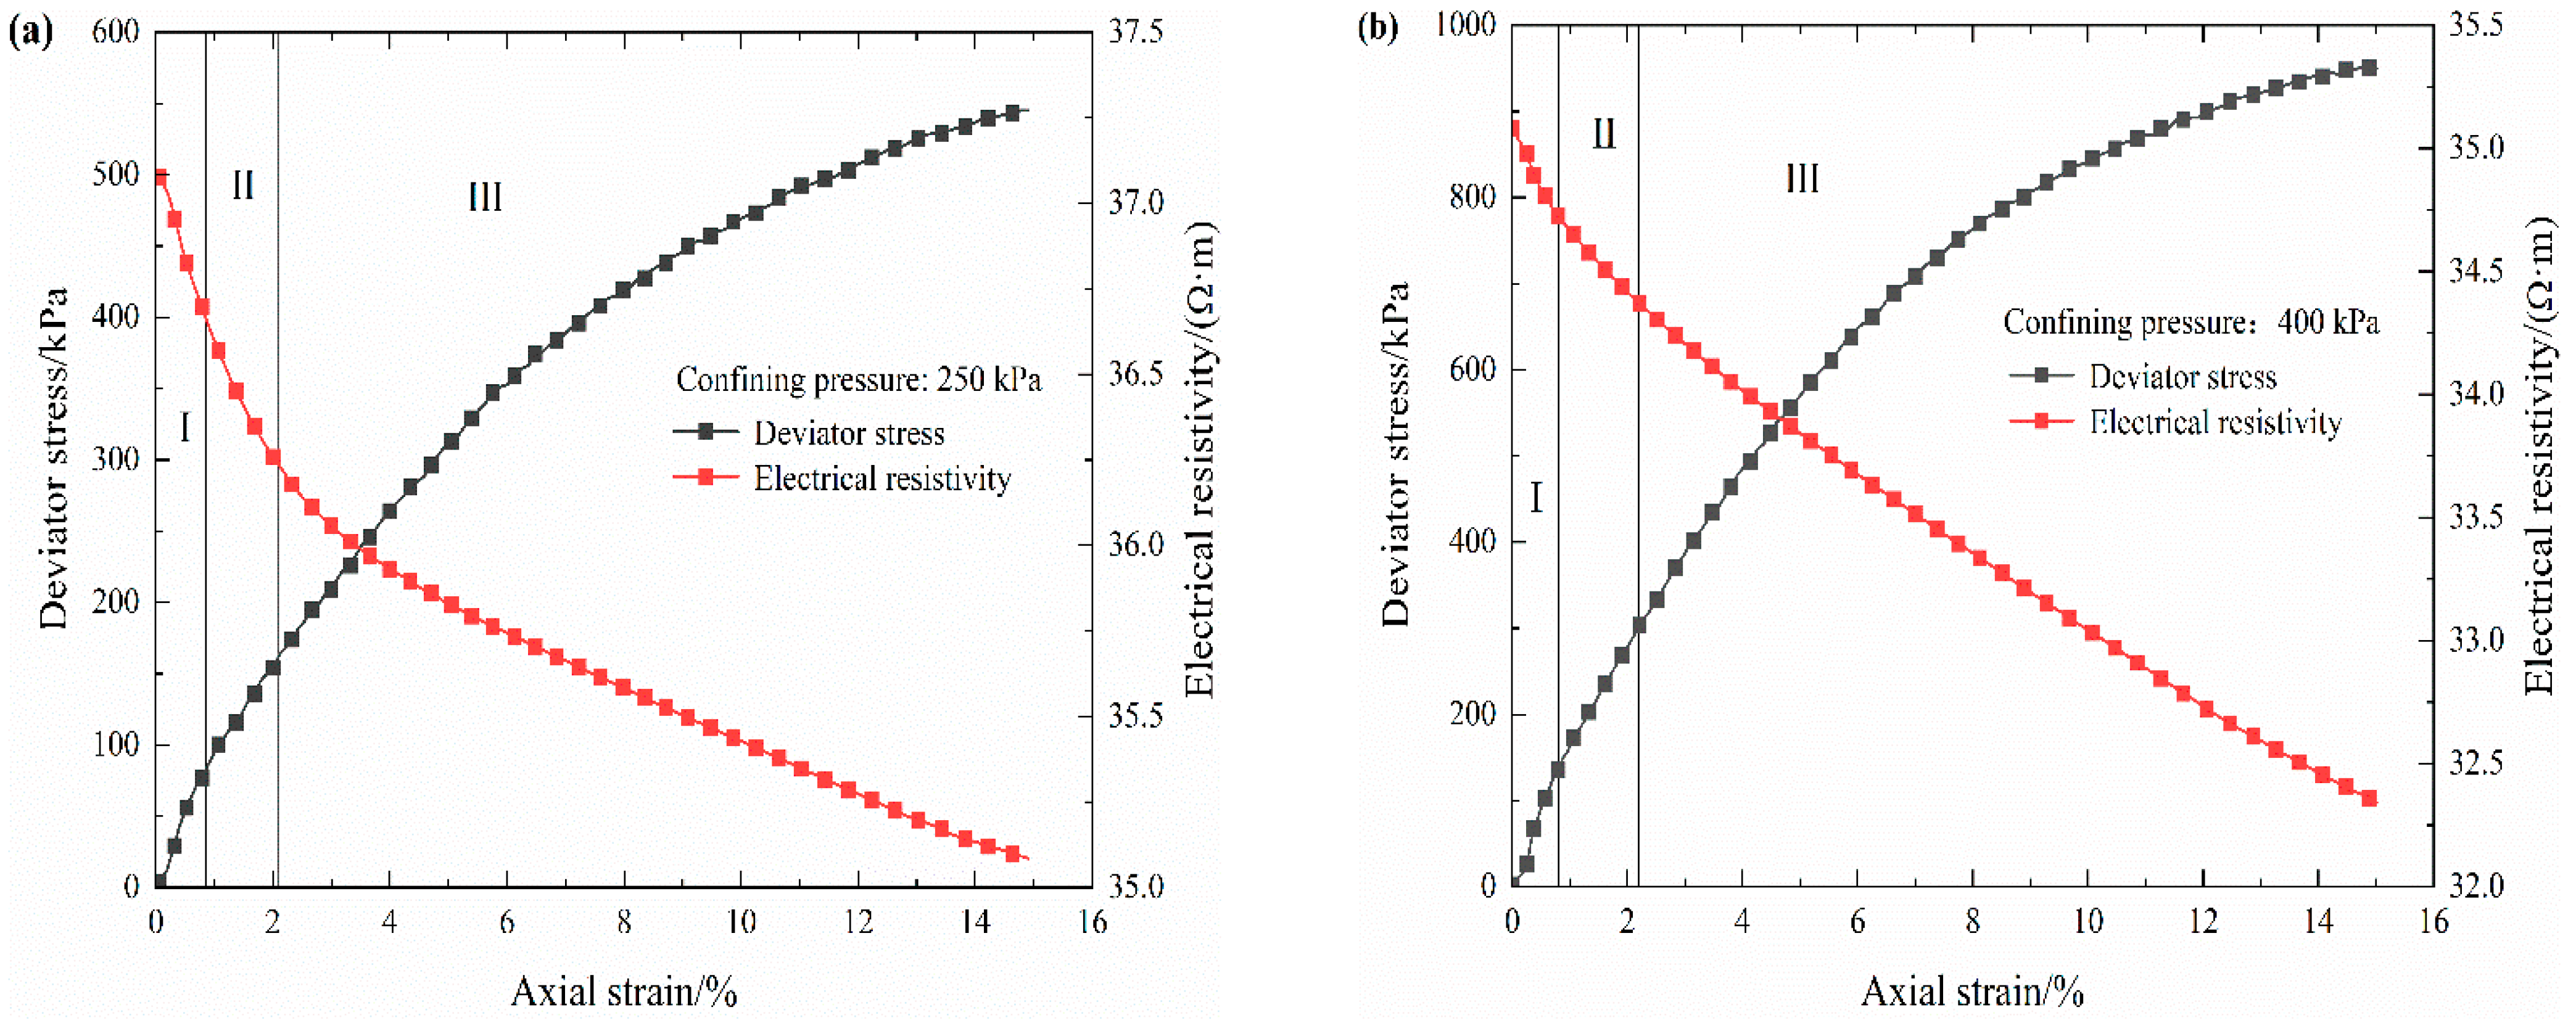
3.1. Stress–Strain–Electrical Resistivity Curve
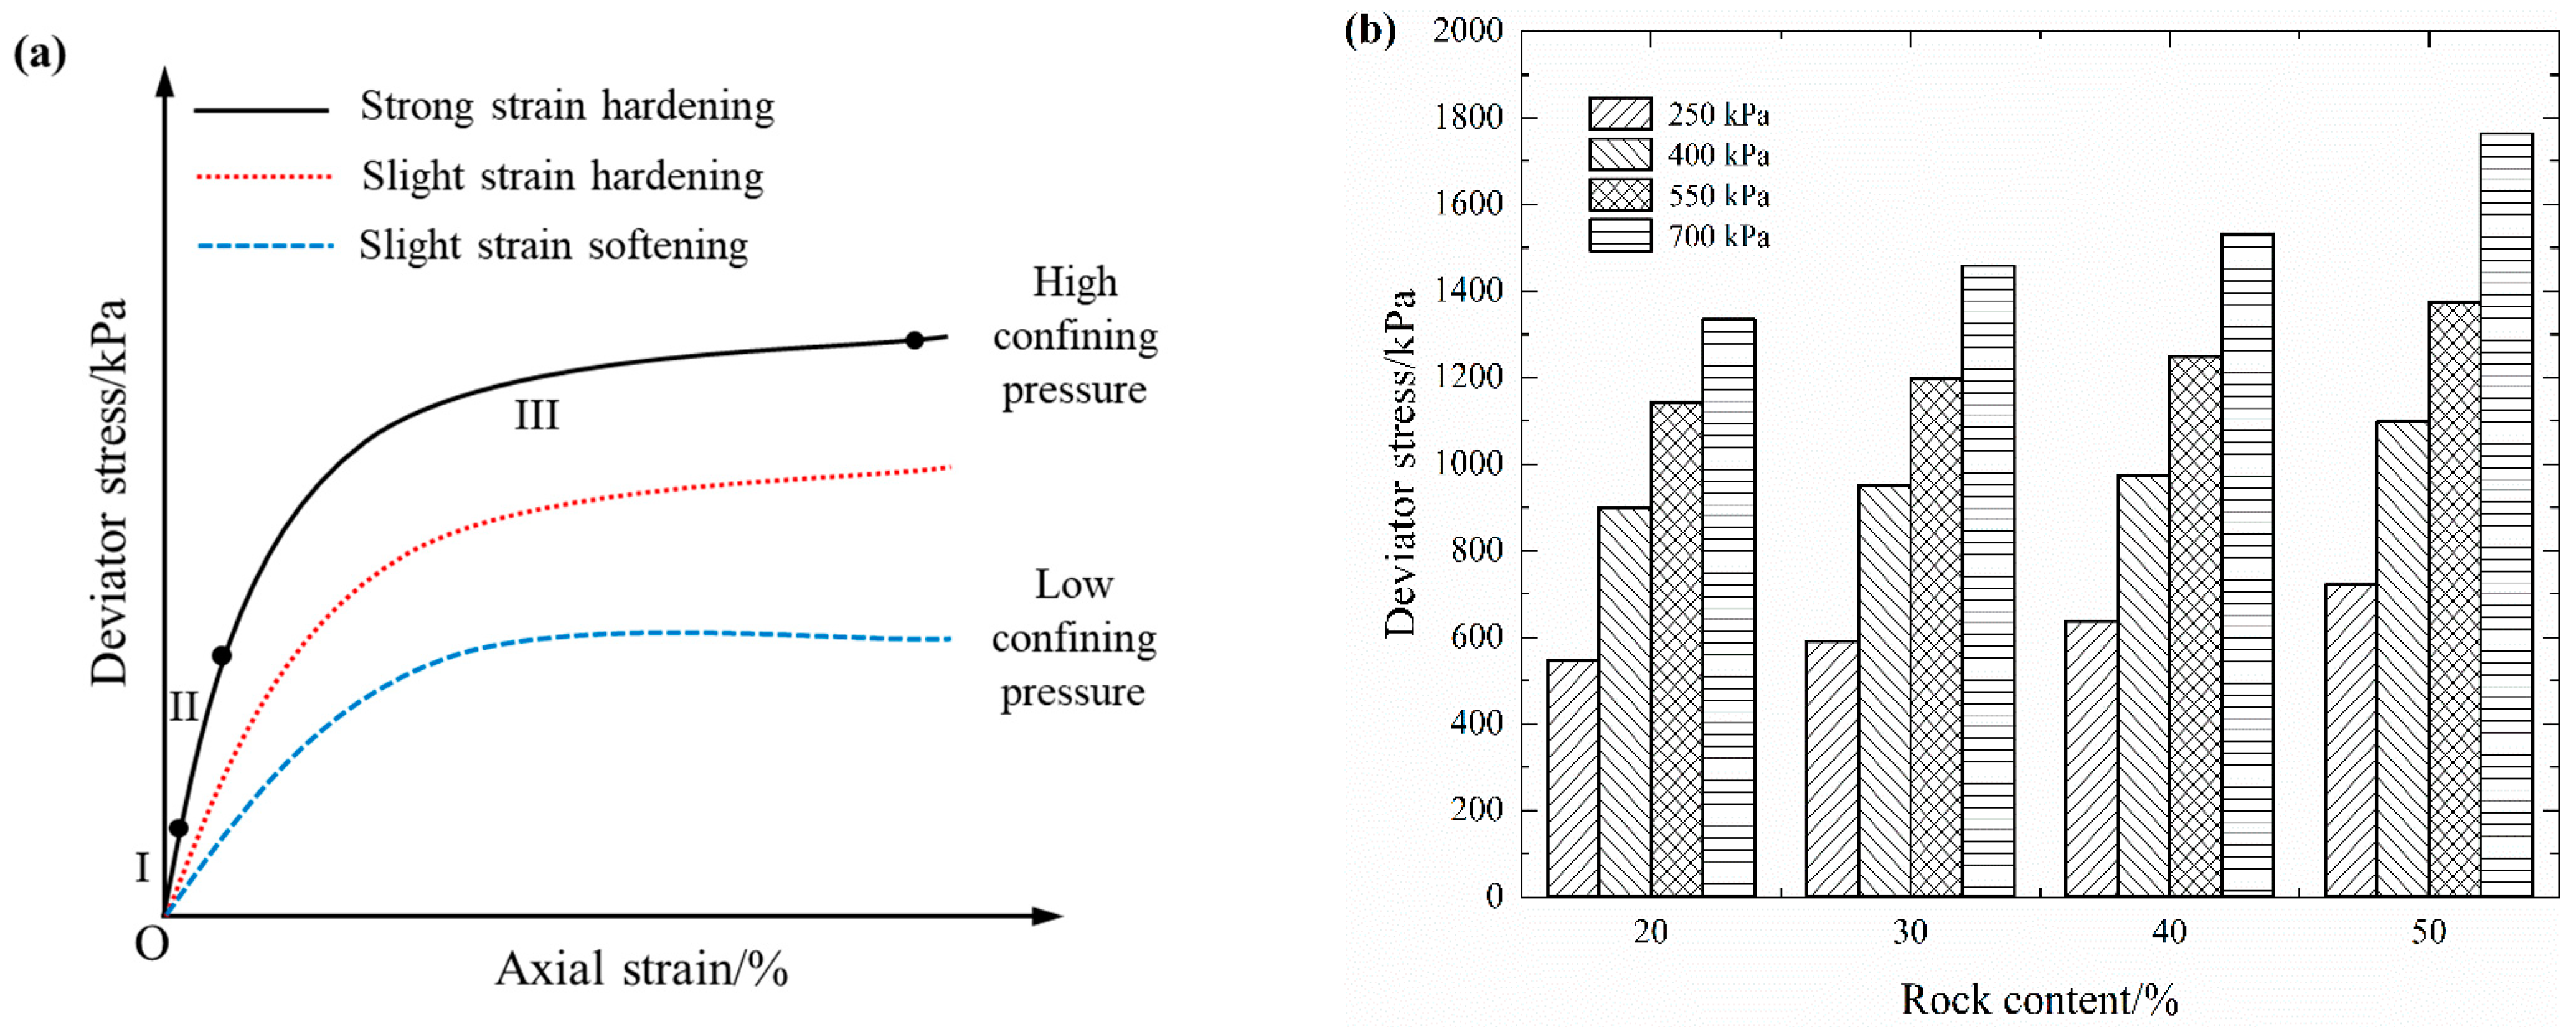
3.2. Stress–Strain Characteristics of S-RM
3.3. Establishment of Mechanical Damage Model
3.4. Damage Evolution Analysis of S-RM
3.5. Modification of Effect of Rock Content Difference
4. Conclusions
- (1)
- During the triaxial loading process the electrical resistivity of S-RM varies in stages with the axial strain, which follows the following variation regularity: it initially decreases rapidly, then declines slowly and finally reduces gently. The response mechanisms of electrical resistivity under different deformation stages are distinct.
- (2)
- The stress–strain characteristics of S-RM gradually change from a slight strain softening to a strong strain hardening as the confining pressure increases. Under the same confining pressure, the deviator stress that S-RM samples can withstand is not the same; the more the rock content, the higher deviator stress is. With the increase in confining pressure, the corresponding deviator stress of the samples with the same rock contents increases gradually.
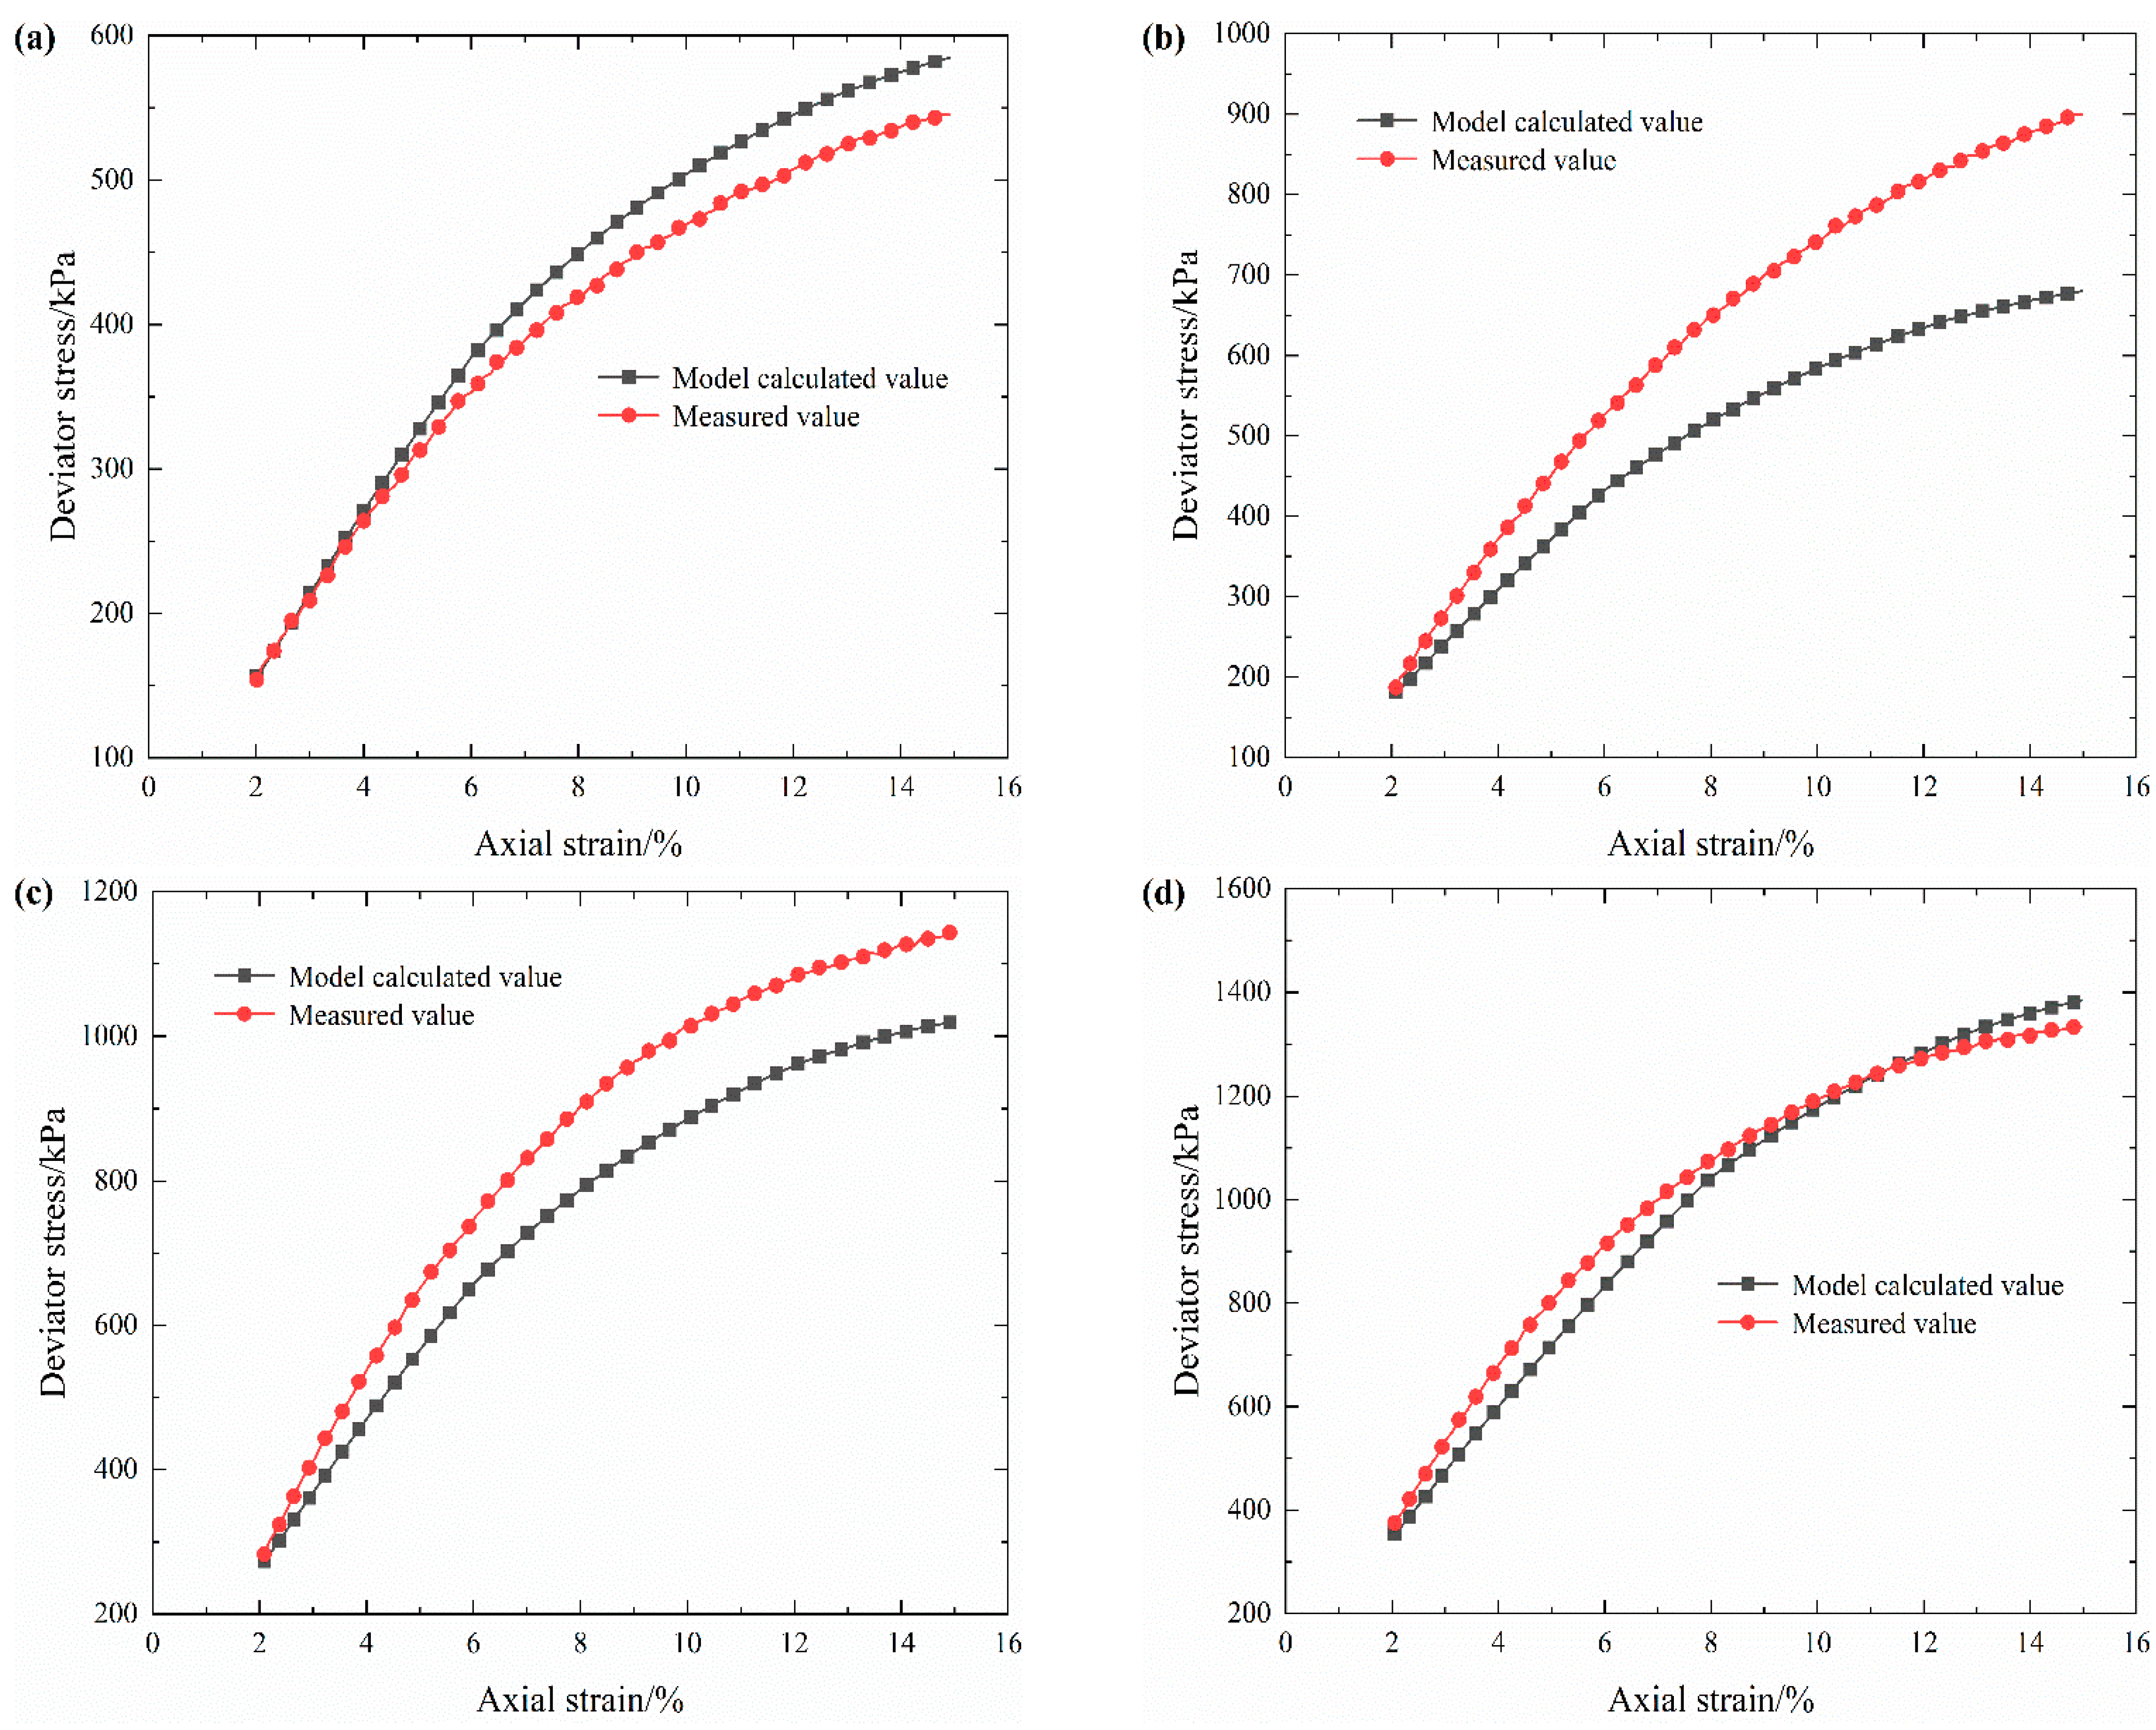
- (3)
- The electrical-resistivity-based mechanical damage model for S-RM can accurately characterize the degree of structure damage. This mathematical model agrees with the experimental results. The damage evolution of S-RM under triaxial shear can be divided into three stages: a non-damage stage, a rapid damage stage and a stable damage stage. In addition, the modified model can accurately predict the mechanical behavior of S-RM with different rock contents. These discoveries can provide a basis for further research on the application of electrical resistivity.
Author Contributions
Funding
Institutional Review Board Statement
Informed Consent Statement
Data Availability Statement
Conflicts of Interest
References
- Xu, W.J.; Yue, Z.Q.; Hu, R.L. Study on the mesostructure and mesomechanical characteristics of the soil–rock mixture using digital image processing based finite element method. Int. J. Rock Mech. Min. 2008, 45, 749–762. [Google Scholar] [CrossRef]
- Xu, W.J.; Xu, Q.; Hu, R.L. Study on the shear strength of soil-rock mixture by large scale direct shear test. Int. J. Rock Mech. Min. 2011, 48, 1235–1247. [Google Scholar] [CrossRef]
- Afifipour, M.; Moarefvand, P. Mechanical behavior of bimrocks having high rock block proportion. Int. J. Rock Mech. Min. 2014, 65, 40–48. [Google Scholar] [CrossRef]
- Wang, Y.; Li, X.; Wu, Y.F. Damage evolution analysis of SRM under compression using X-ray tomography and numerical simulation. Eur. J. Environ. Civ. Eng. 2014, 19, 400–417. [Google Scholar] [CrossRef]
- Liu, Z.R.; Ye, W.M.; Zhang, Z.; Wang, Q.; Chen, Y.G.; Cui, Y.J. A nonlinear particle packing model for multi-sized granular soils. Constr. Build. Mater. 2019, 221, 274–282. [Google Scholar] [CrossRef]
- Yao, Y.S.; Li, J.; Ni, J.J.; Liang, C.H.; Zhang, A.S. Effects of gravel content and shape on shear behaviour of soil-rock mixture: Experiment and DEM modelling. Comput. Geotech. 2022, 141, 104476. [Google Scholar] [CrossRef]
- Samouëlian, A.; Cousin, I.; Tabbagh, A.; Bruand, A.; Richard, G. Electrical resistivity survey in soil science: A review. Soil Tillage Res. 2005, 83, 173–193. [Google Scholar] [CrossRef]
- Wayal, V.; Sitharam, T.G. Geo-electric assessment of the compacted sand-bentonite mixes. Int. J. Geotech. Eng. 2019, 16, 74–89. [Google Scholar] [CrossRef]
- Kibria, G.; Hossain, M.S. Investigation of geotechnical parameters affecting electrical resistivity of compacted clays. J. Geotech. Geoenviron. Eng. 2012, 138, 1520–1529. [Google Scholar] [CrossRef]
- Sun, Q.; Zhu, S.Y.; Xue, L. Electrical resistivity variation in uniaxial rock compression. Arab. J. Geosci. 2015, 8, 1869–1880. [Google Scholar] [CrossRef]
- Li, X.C.; Zhang, Q.; An, Z.X.; Chen, X.L.; Zhang, F. Experimental research on electrical resistivity variation of coal under different loading modes. Arab. J. Geosci. 2020, 13, 1068. [Google Scholar] [CrossRef]
- Chen, P.; Yang, T.; Chen, X.X.; Liu, Y.J.; Li, X.L.; Zhang, K.X. Experimental study on electrical characteristics of gassy coal during extrusion process in different stage. Arab. J. Geosci. 2019, 12, 430–438. [Google Scholar] [CrossRef]
- Zhou, C.S.; Li, K.F.; Han, J.G. Characterizing the effect of compressive damage on transport properties of cracked concretes. Mater. Struct. 2012, 45, 381–392. [Google Scholar] [CrossRef]
- Khurshid, I.; Afgan, I. Geochemical investigation of electrical conductivity and electrical double layer based wettability alteration during engineered water injection in carbonates. J. Petrol. Sci. Eng. 2022, 215, 110627. [Google Scholar] [CrossRef]
- Zhao, M.J.; Li, G.; Huang, W.D.; Li, J. Experiment on electrical resistivity properties of polyphase soil-stone mediums. J. Chongqing Jiaotong Univ. (Nat. Sci.) 2010, 29, 928–933. [Google Scholar]
- Wang, K.; Zhao, M.J. Characteristics and application of electrical resistivity of soil-stone composite medium. J. Chongqing Jiaotong Univ. (Nat. Sci.) 2014, 33, 90–94. Available online: http://xbzk.cqjtu.edu.cn/EN/abstract/abstract510.shtml (accessed on 3 May 2023).
- Wang, R.S.; Zhao, M.J.; Wang, R.Q. Experimental research on variation of resistivity in soil rock composite media. J. Build. Mater. 2019, 22, 94–100. [Google Scholar] [CrossRef]
- Wang, K.; Xia, Z.T.; Li, X. Matrix suction evaluation of soil-rock mixture based on electrical resistivity. Water 2021, 13, 2937. [Google Scholar] [CrossRef]
- Wang, Y.H.; Liu, Y.F.; Ma, H.T. Changing regularity of rock damage variable and resistivity under loading condition. Safe. Sci. 2012, 50, 718–722. [Google Scholar] [CrossRef]
- Zhang, Y.B.; Wu, W.R.; Yao, X.L.; Liang, P.; Tian, B.Z.; Huang, Y.L.; Liang, J.L. Acoustic emission, infrared characteristics and damage evolution of granite under uniaxial compression. Rock Soil Mech. 2020, 41, 139–146. [Google Scholar] [CrossRef]
- Khurshid, I.; Fujii, Y. Geomechanical analysis of formation deformation and permeability enhancement due to low-temperature CO2 injection in subsurface oil reservoirs. J. Pet. Explor. Prod. 2021, 11, 1915–1923. [Google Scholar] [CrossRef]
- Chung, D.D.L. Damage in cement-based materials, studied by electrical resistance measurement. Mater. Sci. Eng. 2003, 42, 1–40. [Google Scholar] [CrossRef]
- Cao, J.Y.; Chung, D.D.L. Defect dynamics and damage of concrete under repeated compression, studied by electrical resistance measurement. Cem. Concr. Res. 2001, 31, 1639–1642. [Google Scholar] [CrossRef]
- Zeng, X.H.; Liu, H.C.; Zhu, H.S.; Ling, C.B.; Liang, K.; Umar, H.A.; Xie, Y.J.; Long, G.C.; Ma, C. Study on damage of concrete under uniaxial compression based on electrical resistivity method. Constr. Build. Mater. 2020, 254, 119270. [Google Scholar] [CrossRef]
- Li, X.C.; Zhang, Q. Study on damage evolution and resistivity variation regularities of coal mass under multi-stage loading. Appl. Sci. 2019, 9, 4124. [Google Scholar] [CrossRef]
- Jia, Z.Q.; Xie, H.P.; Zhang, R.; Li, C.B.; Wang, M.; Gao, M.Z.; Zhang, Z.P.; Zhang, Z.T. Acoustic emission characteristics and damage evolution of coal at different depths under triaxial compression. Rock Mech. Rock Eng. 2020, 53, 2063–2076. [Google Scholar] [CrossRef]
- An, R.; Kong, L.W.; Bai, W.; Li, C.S. The resistivity damage model of residual soil under uniaxial load and the law of drying-wetting effects. Chin. J. Rock Mech. Eng. 2020, 39, 3159–3167. [Google Scholar] [CrossRef]
- Chen, Y.L.; Wei, Z.A.; Irfan, M.; Xu, J.J.; Yang, Y.H. Laboratory investigation of the relationship between electrical resistivity and geotechnical properties of phosphate tailings. Measurement 2018, 126, 289–298. [Google Scholar] [CrossRef]
- Medley, E.W. The Engineering Characterization of Melanges and Similar Block-in-Matrix Rocks (Bimrocks); University of California: Berkeley, CA, USA, 1994. [Google Scholar]
- Zhang, H.Y.; Xu, W.J.; Yu, Y.Z. Triaxial tests of soil-rock mixtures with different rock block distributions. Soils Found. 2016, 56, 44–56. [Google Scholar] [CrossRef]
- Tu, Y.L.; Chai, H.J.; Liu, X.R.; Wang, J.B.; Zeng, B.; Fu, X.; Yu, J.Y. An experimental investigation on the particle breakage and strength properties of soil-rock mixture. Arab. J. Geosci. 2021, 14, 840. [Google Scholar] [CrossRef]
- Wayal, V.; Sitharam, T.G.; Anjali, M. Geo-electrical characterization of physical and mechanical properties of zinc tailing. J. Appl. Geophys. 2021, 188, 104315. [Google Scholar] [CrossRef]
- Yuan, G.L.; Che, A.L.; Tang, H. Evaluation of soil damage degree under freeze–thaw cycles through electrical measurements. Eng. Geol. 2021, 293, 106297. [Google Scholar] [CrossRef]
- Zhang, Y.Q.; Jing, H.J.; Dai, J.Y. Experimental analysis on the mechanical properties of soil-rock mixed fillers with different rock contents on a high embankment. DYNA-Ing. E Ind. 2021, 96, 478–483. [Google Scholar] [CrossRef] [PubMed]
- Wang, Y.; Li, C.H.; Hu, Y.Z. Use of X-ray computed tomography to investigate the effect of rock blocks on meso-structural changes in soil-rock mixture under triaxial deformation. Constr. Build. Mater. 2018, 164, 386–399. [Google Scholar] [CrossRef]


| R/% | wna/% | Gs | wop/% | ρd max/(g·cm−3) |
|---|---|---|---|---|
| 47.29 | 2.57 | 2.72 | 7.94 | 1.91 |
| Quartz | Illite | Albite | Kaolinite | Chlorite | Calcite | Hematite |
|---|---|---|---|---|---|---|
| 48.8 | 22.0 | 17.9 | 2.7 | 5.5 | 1.8 | 1.2 |
| R/% | n | w/% | ρd max/(g·cm−3) | ρt/(g·cm−3) |
|---|---|---|---|---|
| 20 | 0.353 | 5 | 1.71 | 1.65 |
| 30 | 0.318 | 5 | 1.78 | 1.75 |
| 40 | 0.283 | 5 | 1.87 | 1.85 |
| 50 | 0.249 | 5 | 1.98 | 1.95 |
| R/% | ER/(Ω·m) | Range/(Ω·m) | Mean/(Ω·m) | SD/(Ω·m) | CV/% |
|---|---|---|---|---|---|
| 20 | 47.18, 46.85, 47.25, 47.56 | 0.71 | 47.21 | 0.25 | 0.53 |
| 30 | 44.07, 44.28, 43.92, 44.45 | 0.53 | 44.18 | 0.20 | 0.46 |
| 40 | 39.90, 40.47, 40.55, 39.88 | 0.67 | 40.20 | 0.31 | 0.77 |
| 50 | 38.42, 38.16, 37.87, 38.07 | 0.55 | 38.13 | 0.19 | 0.50 |
Disclaimer/Publisher’s Note: The statements, opinions and data contained in all publications are solely those of the individual author(s) and contributor(s) and not of MDPI and/or the editor(s). MDPI and/or the editor(s) disclaim responsibility for any injury to people or property resulting from any ideas, methods, instructions or products referred to in the content. |
© 2023 by the authors. Licensee MDPI, Basel, Switzerland. This article is an open access article distributed under the terms and conditions of the Creative Commons Attribution (CC BY) license (https://creativecommons.org/licenses/by/4.0/).
Share and Cite
Zhao, M.; Chen, S.; Wang, K.; Liu, G. Analysis of Electrical Resistivity Characteristics and Damage Evolution of Soil–Rock Mixture under Triaxial Shear. Materials 2023, 16, 3698. https://doi.org/10.3390/ma16103698
Zhao M, Chen S, Wang K, Liu G. Analysis of Electrical Resistivity Characteristics and Damage Evolution of Soil–Rock Mixture under Triaxial Shear. Materials. 2023; 16(10):3698. https://doi.org/10.3390/ma16103698
Chicago/Turabian StyleZhao, Mingjie, Songlin Chen, Kui Wang, and Gang Liu. 2023. "Analysis of Electrical Resistivity Characteristics and Damage Evolution of Soil–Rock Mixture under Triaxial Shear" Materials 16, no. 10: 3698. https://doi.org/10.3390/ma16103698