Article

Co-Pyrolysis for Pine Sawdust with Potassium Chloride: Insight into Interactions and Assisting Biochar Graphitization

1
Joint International Research Laboratory of Biomass Energy and Materials, Co-Innovation Center of Efficient Processing and Utilization of Forest Resources, College of Materials Science and Engineering, Nanjing Forestry University, Nanjing 210037, China
2
College of Materials Science and Engineering, Nanjing Forestry University, Nanjing 210037, China
*
Author to whom correspondence should be addressed.
These authors contributed equally to this work.
Materials 2023, 16(10), 3667; https://doi.org/10.3390/ma16103667
Submission received: 22 March 2023 / Revised: 4 May 2023 / Accepted: 9 May 2023 / Published: 11 May 2023

Abstract

:
This effort aimed to explore the activation and catalytic graphitization mechanisms of non-toxic salts in converting biomass to biochar from the perspective of pyrolysis kinetics using renewable biomass as feedstock. Consequently, thermogravimetric analysis (TGA) was used to monitor the thermal behaviors of the pine sawdust (PS) and PS/KCl blends. The model-free integration methods and master plots were used to obtain the activation energy (E) values and reaction models, respectively. Further, the pre-exponential factor (A), enthalpy (ΔH), Gibbs free energy (ΔG), entropy (ΔS), and graphitization were evaluated. When the KCl content was above 50%, the presence of KCl decreased the resistance to biochar deposition. In addition, the differences in the dominant reaction mechanisms of the samples were not significant at low (α ≤ 0.5) and high (α ≥ 0.5) conversion rates. Interestingly, the lnA value showed a linearly positive correlation with the E values. The PS and PS/KCl blends possessed positive ΔG and ΔH values, and KCl was able to assist biochar graphitization. Encouragingly, the co-pyrolysis of the PS/KCl blends allows us to target-tune the yield of the three-phase product during biomass pyrolysis.

1. Introduction

Biomass is abundant, clean, and renewable, so great efforts have been made to develop and utilize biomass energy to achieve the “dual-carbon” goal [1,2,3]. Pyrolysis can convert biomass feedstock into biochar through an advanced conversion mode [4]. As is known, the specific surface area, cation exchange capacity, electrical conductivity, and pH values of biochars synthesized by pyrolysis affect their application [5,6]. Of these, the specific surface area is one of the most critical parameters affecting their performance. Unfortunately, biochars prepared by pyrolysis have low specific surface areas, which limits their use in many applications (e.g., electrode materials, catalysts, and adsorbents). As an example, Cen and co-workers produced rice straw-based biochars by pyrolysis, and the specific surface area of these rice straw-based biochars was in the range from ~68 m2/g to ~99 m2/g [7]. Similarly, Wang et al. [8] obtained coconut shell-based biochar with a specific surface area of 160 m2/g by pyrolysis of coconut shells. The specific surface areas recorded for the mentioned biochars were below 200 m2/g, which makes them under-valorized.
To solve the above problems, activation has aroused growing attention because the existence of activators can enhance the specific surface area [9,10]. Accordingly, a series of activators for activation processes have been investigated, including H3PO4 [11], KOH [12], and ZnCl2 [13]. However, KOH and ZnCl2 can pollute the environment, which limits the large-scale production of activated carbon. To match the activation process with the green development, non-toxic salts (e.g., NaCl and KCl) have been gradually used as activators in recent years with the following virtues: (1) non-toxic, low-corrosive, easily removed by water, recoverable from waste liquids, and suitable for large-scale preparation; and (2) have a template effect and can produce pores with regular pore size [14,15]. Unfortunately, the mechanism of interaction between non-toxic salts and biomass, especially how non-toxic salts affect the activation energy (E), pre-exponential factor (A), enthalpy (ΔH), Gibbs free energy (ΔG), and entropy (ΔS) of biomass during the activation process, has not been fully revealed. As is known, co-pyrolysis can assist in understanding the interaction of two matters. For instance, Li et al. [16] investigated the catalytic behavior of alkali metals and alkaline earth metals during the pyrolysis of lignocellulosic biomass. The results indicated that the dehydration capacity of alkaline earth metals induced the repolymerization between phenolic products. Similarly, Saynik et al. [17] studied the effect of alkali and alkaline earth metals on in situ catalytic fast pyrolysis of lignocellulosic biomass. The results suggested that alkaline earth metals accelerated pathways and increased yields of thermally derived char and non-condensable gases. Encouragingly, the activation process can be considered as the co-pyrolysis of biomass/activator blends under a nitrogen atmosphere. This is a highly critical fact as it allows us to evaluate the mechanism of activator–biomass interaction from the perspective of pyrolysis kinetics.
By comparison, in addition to the specific surface area, electrical conductivity is one of the most valuable parameters of biochar, especially when it is used as an electrode material [18,19]. As is known, the electrical conductivity of biochar is mainly influenced by its graphitization. Good electronic conductivity provides a low resistance channel for electron transport [20]. Further, extremely high temperatures are usually employed to enhance the graphitization of biochars [21,22]. Unfortunately, extremely high temperatures also result in the collapse of the pore structure of biochars and a significant decrease in yield; in other words, the specific surface area and graphitization are mutually constrained. Catalytic graphitization is an effective strategy to improve the conductivity of carbon materials [23]. Among these, metal (Fe, Co, and Ni) salts are particularly effective as catalysts for producing graphitized structures in carbon materials at temperatures below 1000 °C. This catalytic process makes it possible to convert non-graphitized precursors into graphitized carbon, thus expanding its applicability to a broader range of applications [24,25]. However, to the best of our knowledge, few studies have systematically focused on the mechanism of catalytic graphitization. It is well known that the mechanisms of interaction between two biomasses at elevated temperatures are usually unraveled using the co-pyrolysis method [26]. Interestingly, the catalytic graphitization of biochar represents a biomass/catalyst interaction under elevated temperatures. A variation consists of the replacement of one of the biomasses with a catalyst. This leads us to believe that the method used to study the co-pyrolysis mechanism of the two biomasses can be used to investigate the action mechanism of catalytic graphitization. Thus, this work aimed to explore the activation and catalytic graphitization mechanisms of non-toxic salts in converting biomass to biochar from the perspective of pyrolysis kinetics using renewable biomass as feedstock.
As such, low-cost and highly widely available pine sawdust (PS) and non-toxic KCl were used as raw materials for the case study. To reveal the interaction mechanism between PS and KCl, the weightless behaviors of PS, KCl, and PS/KCl mixtures were evaluated by thermogravimetric analysis (TGA). Moreover, the reaction model recorded for the samples was evaluated using Criado master plots [27]. Finally, the A, ΔH, ΔG, and ΔS values were studied using the obtained E values. Of note is that the lnA varies linearly with apparent activation energy. The appropriate amount of KCl improved the graphitization of the pyrolysis residue by reducing the E, ΔS, and ΔH values of the PS/KCl blends.

2. Experimental Section

2.1. Material Preparation

Pine sawdust (PS) samples were sourced from Jiangxi province in China, washed and dried, then ground into powder samples with a particle size ranging from 45 to 71 μm. Potassium chloride (analytical grade), namely, KCl, was supplied by Sinopharm Chemical Reagent (Shanghai, China). Mixing of KCl with PS was undertaken using the solid phase ball-milling method. Herein, the PSKCl-21 sample was obtained via mixing PS and KCl featuring a 2:1 weight ratio. The PSKCl-11 sample was manufactured by mixing PS and KCl in a 1:1 weight ratio. Similarly, the PSKCl-12 sample was fabricated by mixing PS and KCl in a 1:2 weight ratio. Alternatively, the principal symbols and acronyms are exhibited in Abbreviations.

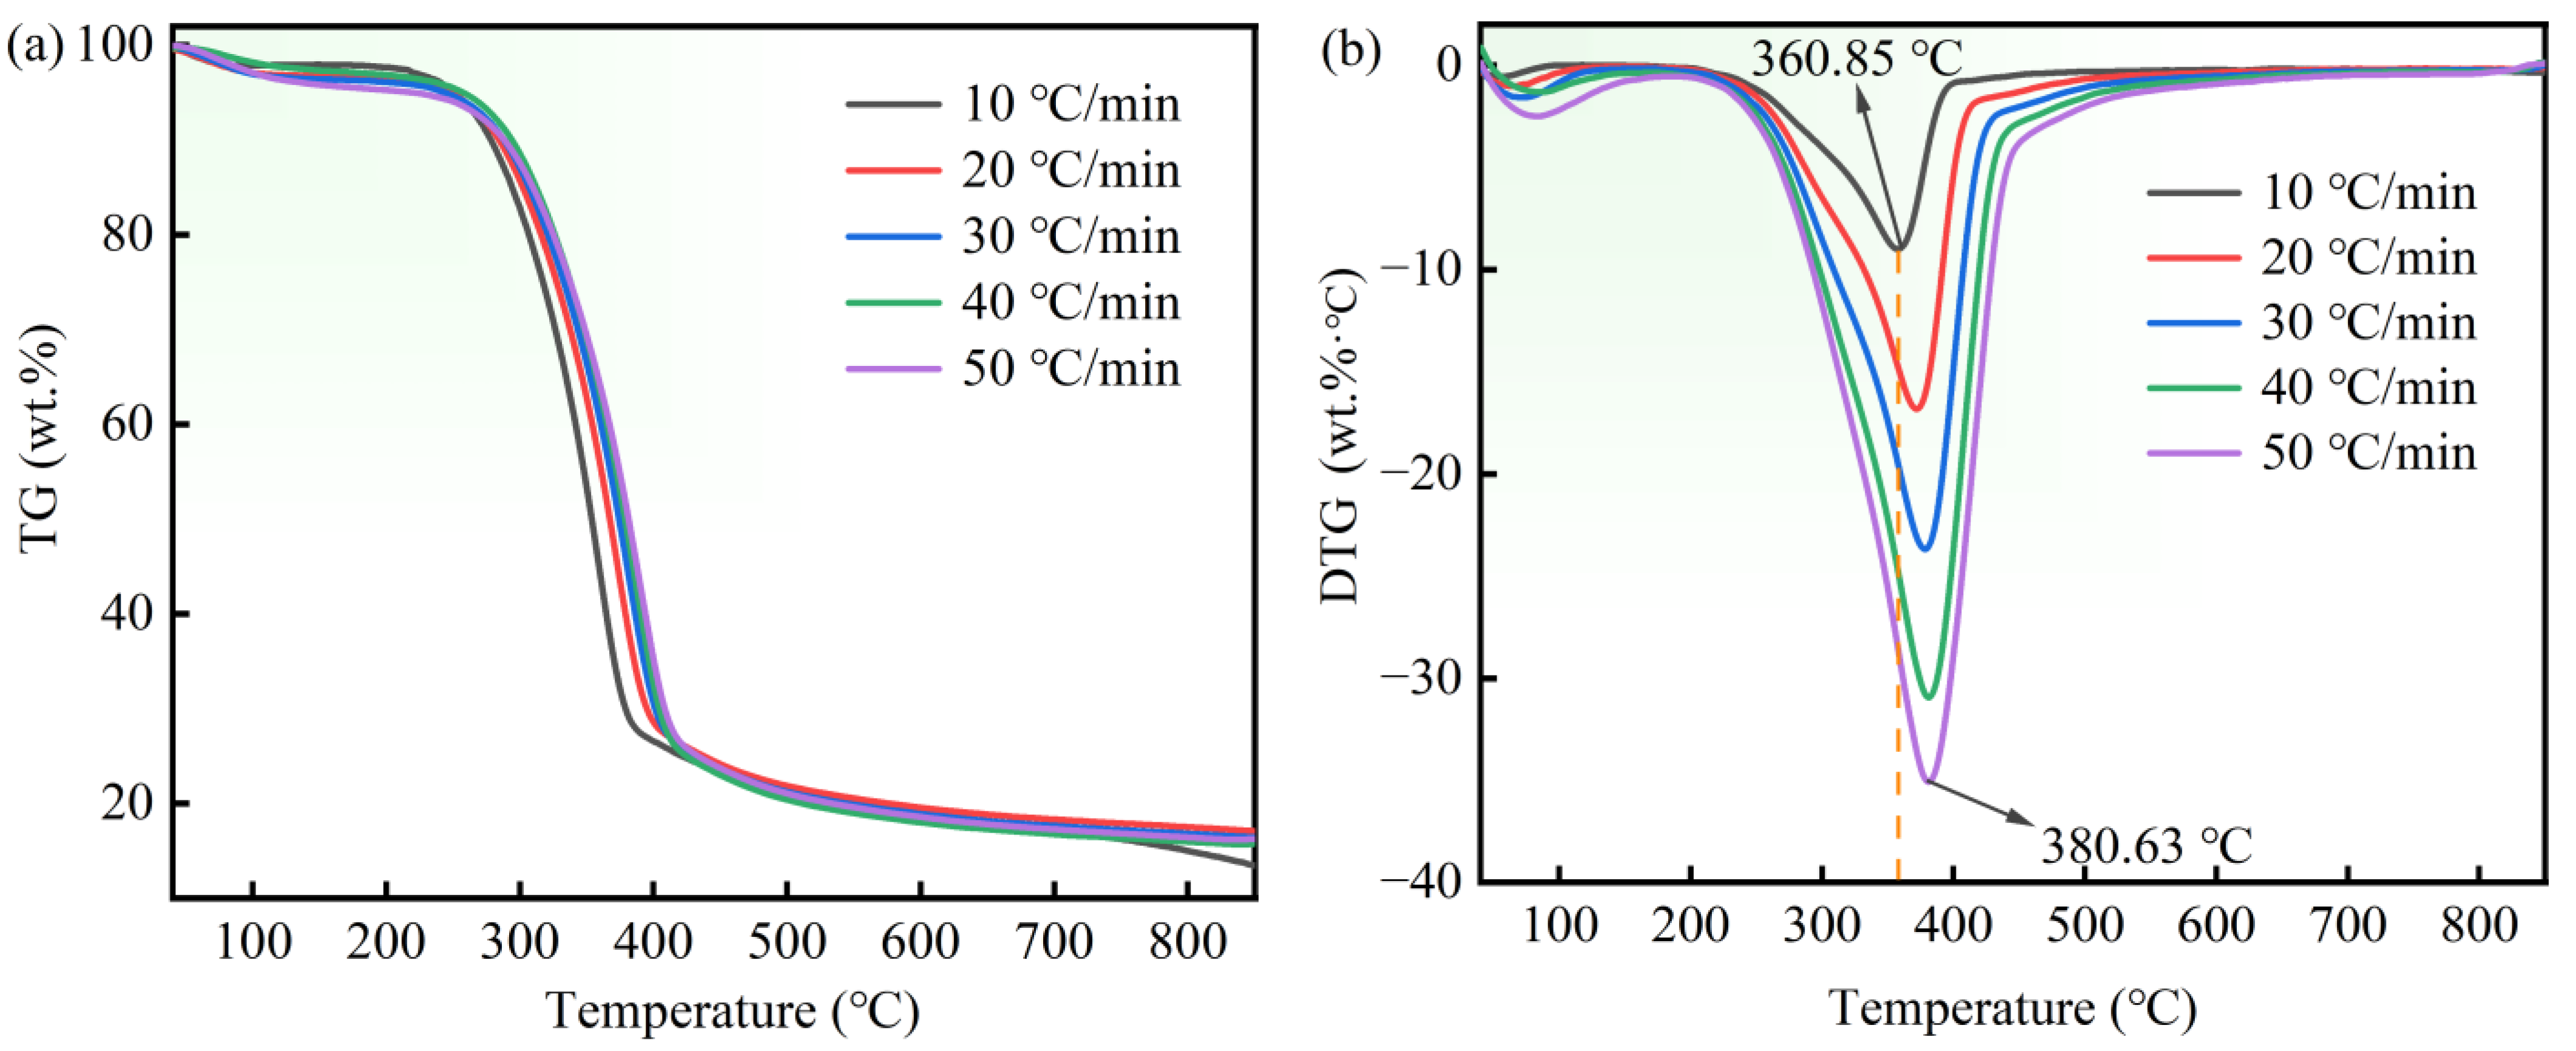
2.2. Thermogravimetric Analysis

Weightless behavior of samples was analyzed using thermogravimetric analysis (TGA) in an N2 atmosphere. More information regarding the thermogravimetric (TG) analyzer is available in a previous work [28]. The temperature was gradually raised from room temperature to 850 °C by steps of 10, 20, 30, 40, and 50 °C/min, sequentially. Finally, the weightless behaviors of the samples were determined. Additionally, the calculation formulas of the reaction kinetics, activation energy, reaction model, and thermodynamic parameters are recorded in a previous work [29]. In addition, Raman spectroscopy (DXR532) with a wavelength of 532 nm was employed to analyze the defect or graphitization information of samples.

3. Results and Discussion

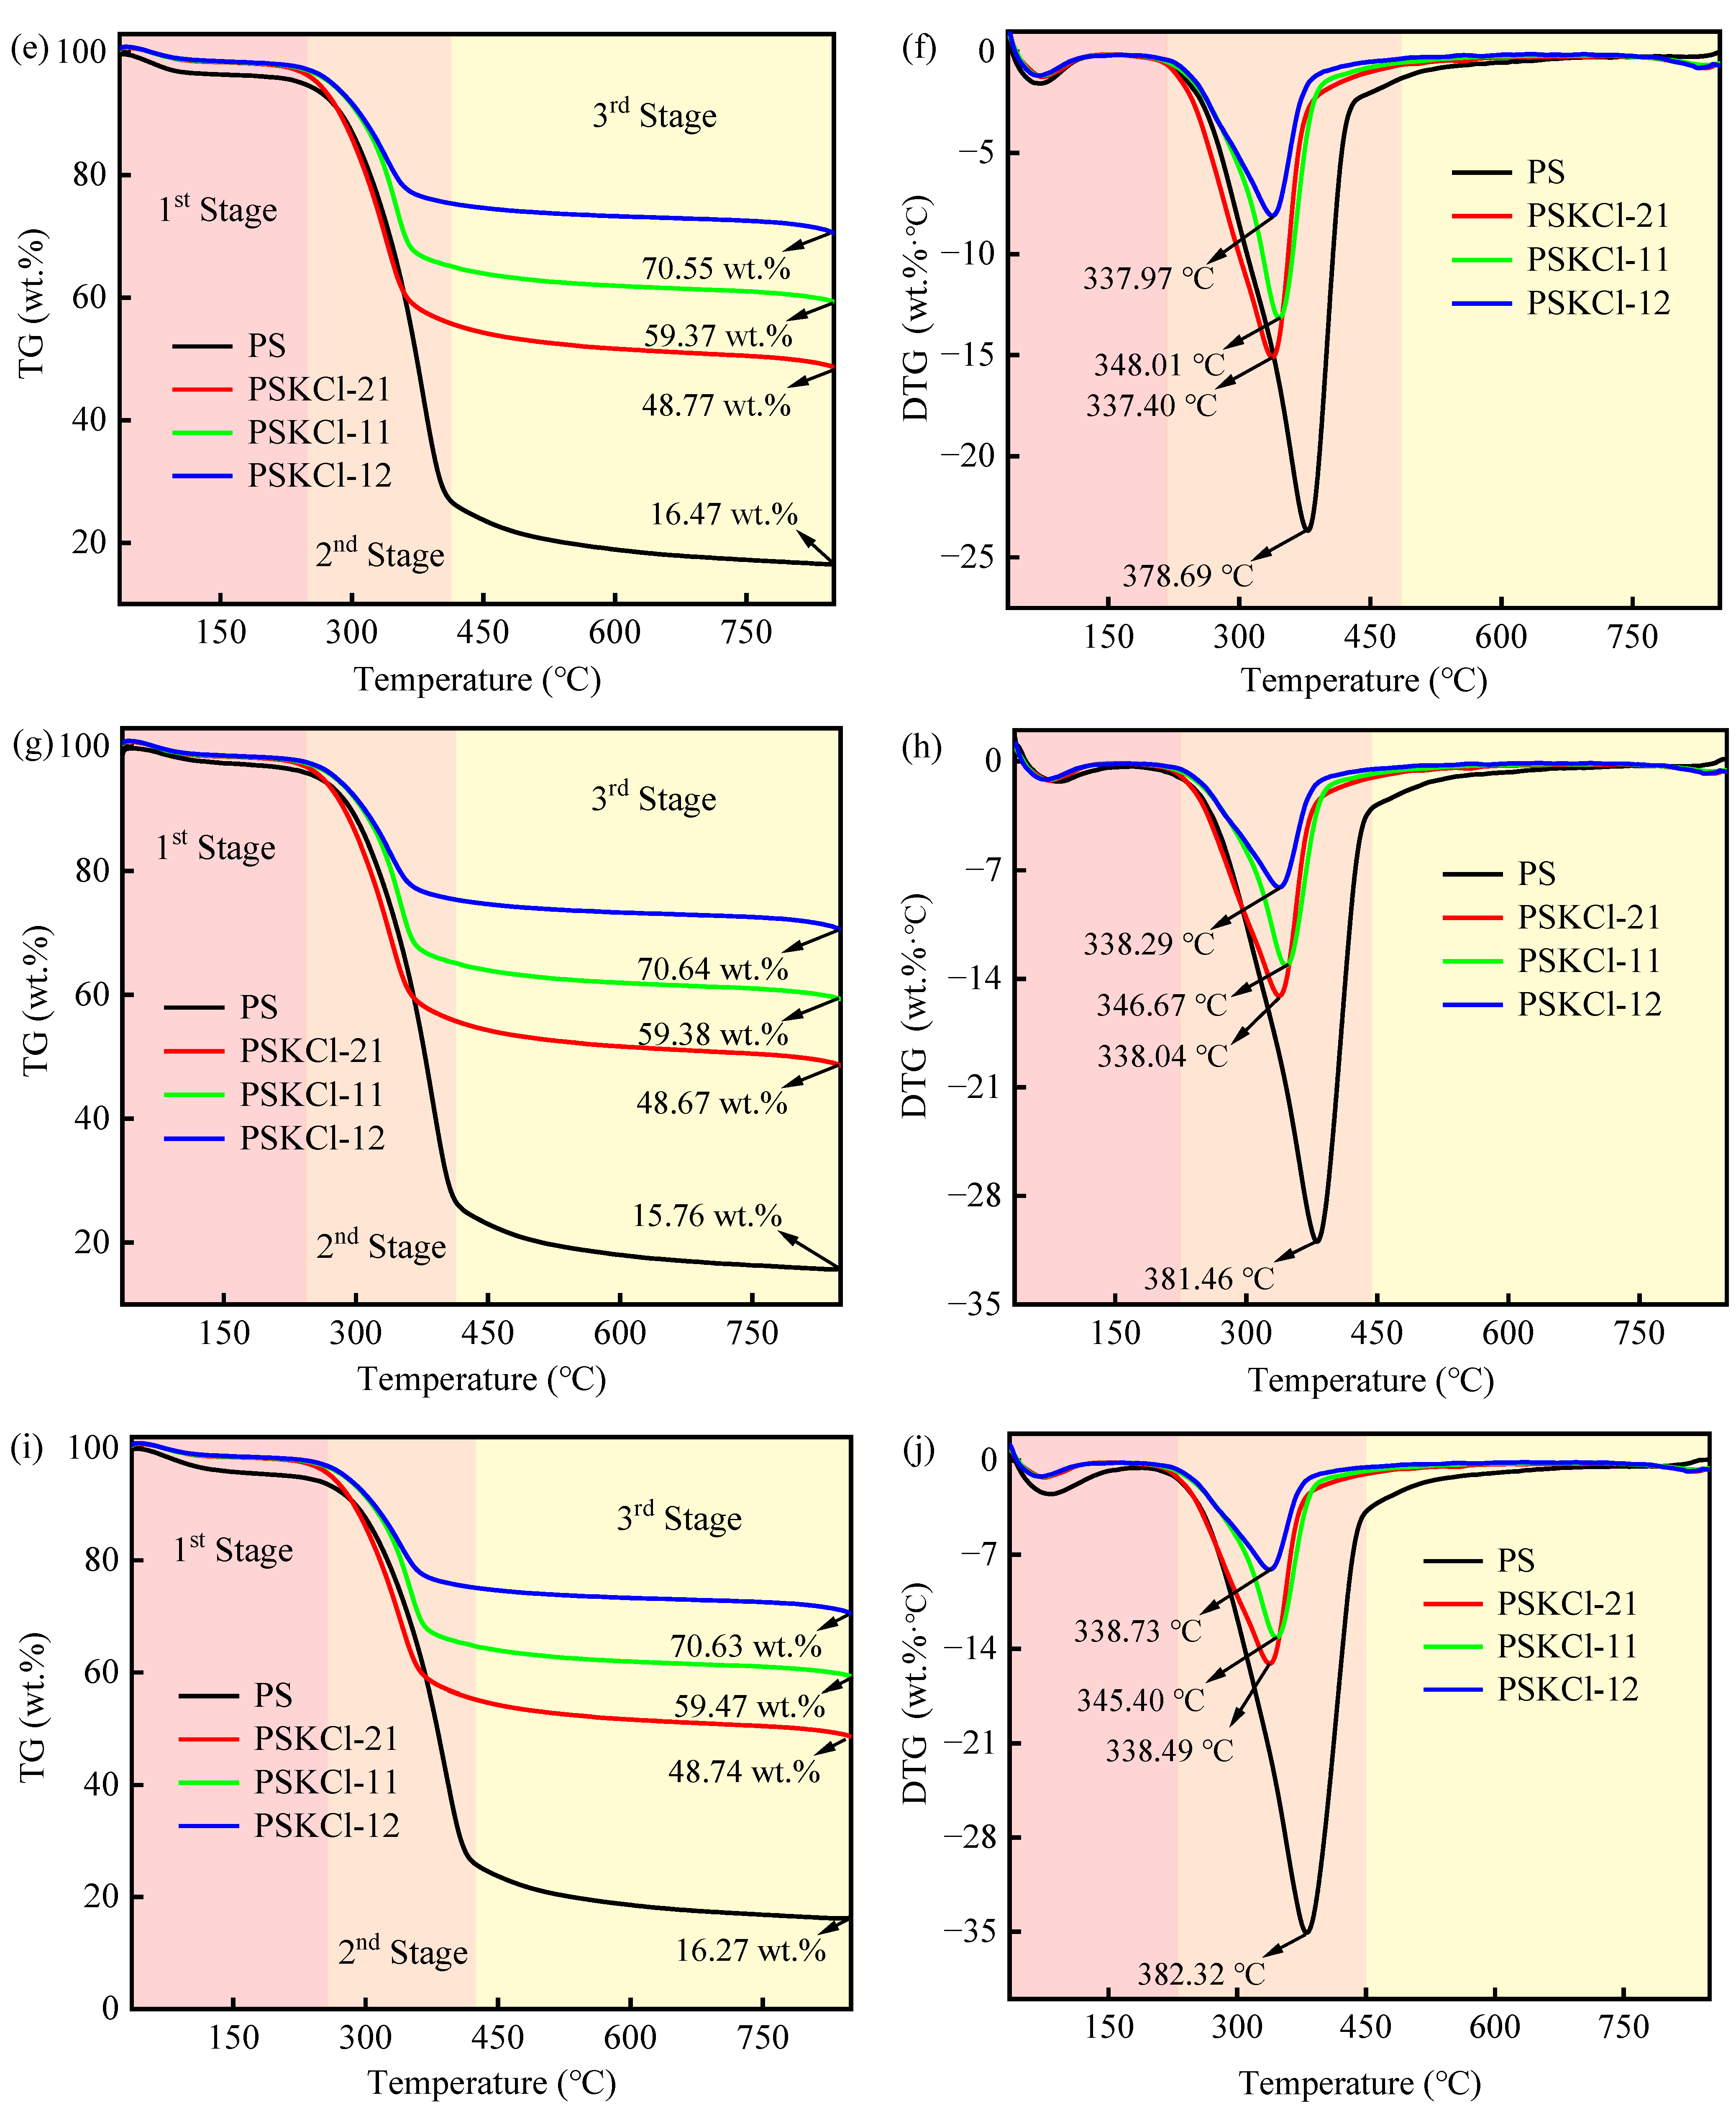
3.1. Weightless Behavior

Figure 1a–j reveals the weightless behaviors of the samples at 10, 20, 30, 40, and 50 °C/min. Noticeable differences were found in the weightlessness behaviors of the samples. As an example, at 10 °C, the second stage of PSKCl-12 ended significantly earlier than that of PS. In addition, the pyrolysis residue weight (13.54 wt.%) of PS was considerably lower than that of PSKCl-12 (68.95 wt.%). Regarding PS, the pyrolysis process was composed of the dry dehydration stage (45–226 °C), pyrolysis stage (226–390 °C), and carbonization stage (>390 °C). Therein, dry dehydration represents a slow-weight-loss stage, and the second stage was the fast generation stage of small molecule compounds [30]. Consequently, the sample exhibited an outstanding weight-loss peak in the second stage (Figure 1b). That is, 180–450 °C could be defined as the pyrolysis temperature range of the sample, and this result was similar to that recorded for rice straw and rice husk [31,32]. Notably, all curves (Figure 1b,d,f,h,j) presented a weight-loss peak in the first and second stages, regardless of the heating rate and composition of the samples, which was similar to other biomasses (e.g., corn straw, wheat straw, and grape stem) that presented a weight-loss peak in the first and second stages [28,33,34]. As expected, the size of the weight-loss peaks and the time of appearance varied, suggesting that the component content influences the weight-loss behaviors. In reviewing the literature, the melting point of KCl was 770 °C [35]; from this, we can infer that there was almost no weight loss of KCl in the range of 200–500 °C. Similarly, Jones et al. [36] indicated that KCl showed almost no weight loss in the range of 0–770 °C and a significant weight loss ranging from 770 to 950 °C with a weight loss of 70 wt.% at 950 °C. This is a crucial conclusion because if no interaction occurs between the two raw materials, they maintain their pyrolysis behaviors during the pyrolysis process. Fortunately, PSKCl-21, PSKCl-11, and PSKCl-12 had different pyrolysis behaviors (e.g., the position of the weight-loss peak) compared with PS (Figure 1b,d,f,h,j). Specifically, the significant weight-loss peak of PSKCl-21, PSKCl-11, and PSKCl-12 showed a shift to the left using the position of the maximum weight-loss peak of PS as the baseline. It follows that PS interacted with KCl during the pyrolysis process. In other words, the presence of KCl (the synergistic or catalytic) facilitates the decomposition of PS below 500 °C. Moreover, Jones et al. [36] suggested that the pyrolysis residue of KCl at 850 °C was ~77 wt.% at a heating rate of 20 °C/min. If this was used as the basis, assuming no interaction between PS and KCl, the pyrolysis residues of PSKCl-21, PSKCl-11, and PSKCl-1 were ~37.08, ~47.06, and ~57.04 wt.%, respectively (the pyrolysis residue of PS was obtained from Figure 1c). As shown in Figure 1c, the pyrolysis residues of PSKCl-21, PSKCl-11, and PSKCl-1 were 47.01, 55.77, and 68.95 wt.%, respectively. Notably, the pyrolysis residues of PSKCl-21, PSKCl-11, and PSKCl-12 obtained in Figure 1c were significantly higher than those of PSKCl-21, PSKCl-11, and PSKCl-12 calculated based on the above hypothesis. It follows that the presence of KCl is beneficial to increasing the yield of pyrolysis residue.
The pyrolysis process at 10 °C/min was used as a case study for specific analysis. The loss of 1–4 wt.% of weight in the first stage was due to the removal of free water. The consecutive decomposition of the sample in the second stage was accompanied by a significant weight loss, leading to the formation of weight-loss peaks. For instance, ~69.36 wt.% weight loss was recorded for PS, ~41.46 wt.% weight loss was recorded for PSKCl-21, ~33.43 wt.% weight loss was recorded for PSKCl-11, and ~21.98 wt.% weight loss was recorded for PSKCl-12. In the third stage, the samples were deeply pyrolyzed, e.g., the pyrolysis residue of PS was diminished from 27.30 wt.% (the second stage) to 13.61 wt.% (the third stage). To further understand the effect of the heating rate on the pyrolysis behaviors, a systematic comparison of the TG/DTG curves at different heating rates (10, 20, 30, 40, and 50 °C/min) was carried out using PS as a case study (Figure 2).
The point maximum weight-loss rate of both TG and DTG curves shifted toward the high temperature. For instance, 360.85 °C recorded at 10 °C/min increased to 380.63 °C recorded at 50 °C/min (Figure 2b). This phenomenon could be attributed to the difference between the reference (viz., furnace) and sample temperatures, and is due to the heat and mass transfer limitations in the sample [37]. In addition, the biomasses’ own poor thermal conductivity equally leads to temperature gradients in the sample particles. The core temperature of biomass particles may be lower than the temperature of their surface [33,38]. Furthermore, the maximum weight loss in the DTG curve decreased as the heating rate increased, as influenced by mass transfer (with an increase in the heating rate, the heat transfer from the exterior to the interior of particles requires a longer time). As such, pyrolysis at higher heating rates was inadequate at the sample temperature, especially for biomass containing highly volatile components, a finding consistent with that of Lah and coworkers [39].

3.2. Theoretical and Experimental TG Curves

The two samples decomposed independently, implying that there is no interaction between the two samples during the pyrolysis procedure. Thus, the calculated values are the sum of individual sample values, which is proportional to their mixing weight ratios. Unfortunately, the thermogravimetric behaviors of KCl were not given as crucible fragmentation resulted under the action of high temperature. To further explain the interaction of KCl with PS, the theoretical TG curves of the samples need to be calculated. In this work, PSKCl-12 contained considerable amounts of KCl. Assuming no interaction between PS and KCl, it follows that the theoretical TG curves of PSKCl-11 and PSKCl-21 can be calculated from the TG curves of PS and PSKCl-12 with the following theoretical equations (PSKCl-11: TGtheoretical = 1/4 TGPS + 3/4 TGPSKCl-12; PSKCl-21: TGtheoretical = 1/2 TGPS + 1/2 TGPSKCl-12. Notably, TGPS and TGPSKCl-12 stand for the experimental TG curves of PS and PSKCl-12, respectively). Overall, the theoretical TG curves resembled the experimental TG curves (Figure 3a,b). Notwithstanding this, the theoretical TG curves also exhibited pyrolysis behaviors that were quite different from the experimental TG curves. For instance, PSKCl-21 had 41.17 wt.% theoretical pyrolysis residue, which was significantly lower than its experimental pyrolysis residue (48.79 wt.%). A similar phenomenon was equally recorded in Figure 3b. Consequently, the presence of KCl decreased the resistance to biochar deposition. A plausible explanation for this result can be given as follows: at low temperatures, the solid KCl salt was uniformly mixed with the PS residue, whereas at elevated temperatures, the KCl salt melted and then the carbon block was sealed to prevent the intense combustion by the N2 atmosphere. By comparison, the theoretical and experimental TG curves recorded by PSKCl-21 and PSKCl-11 exhibited noticeable crossover points over 365.68 °C and 378.05 °C, respectively. In other words, the interaction between PS and KCl in PSKCl-11 and PSKCl-21 occurred after 365.68 °C and 378.05 °C, respectively. Notably, 378.05 °C > 365.68 °C; that is, the cross-point temperature gradually increased with improving the KCl content in the PS/KCl blends, which was related to the high melting point of KCl. It is worth noting that the equations used to estimate interactions in this work are not recommended if the thermogravimetric curves of individual samples can be determined. Despite the limitations of the equations used to assess the interactions in the present work, the equations suggest the existence of interactions between PS and KCl within a range.

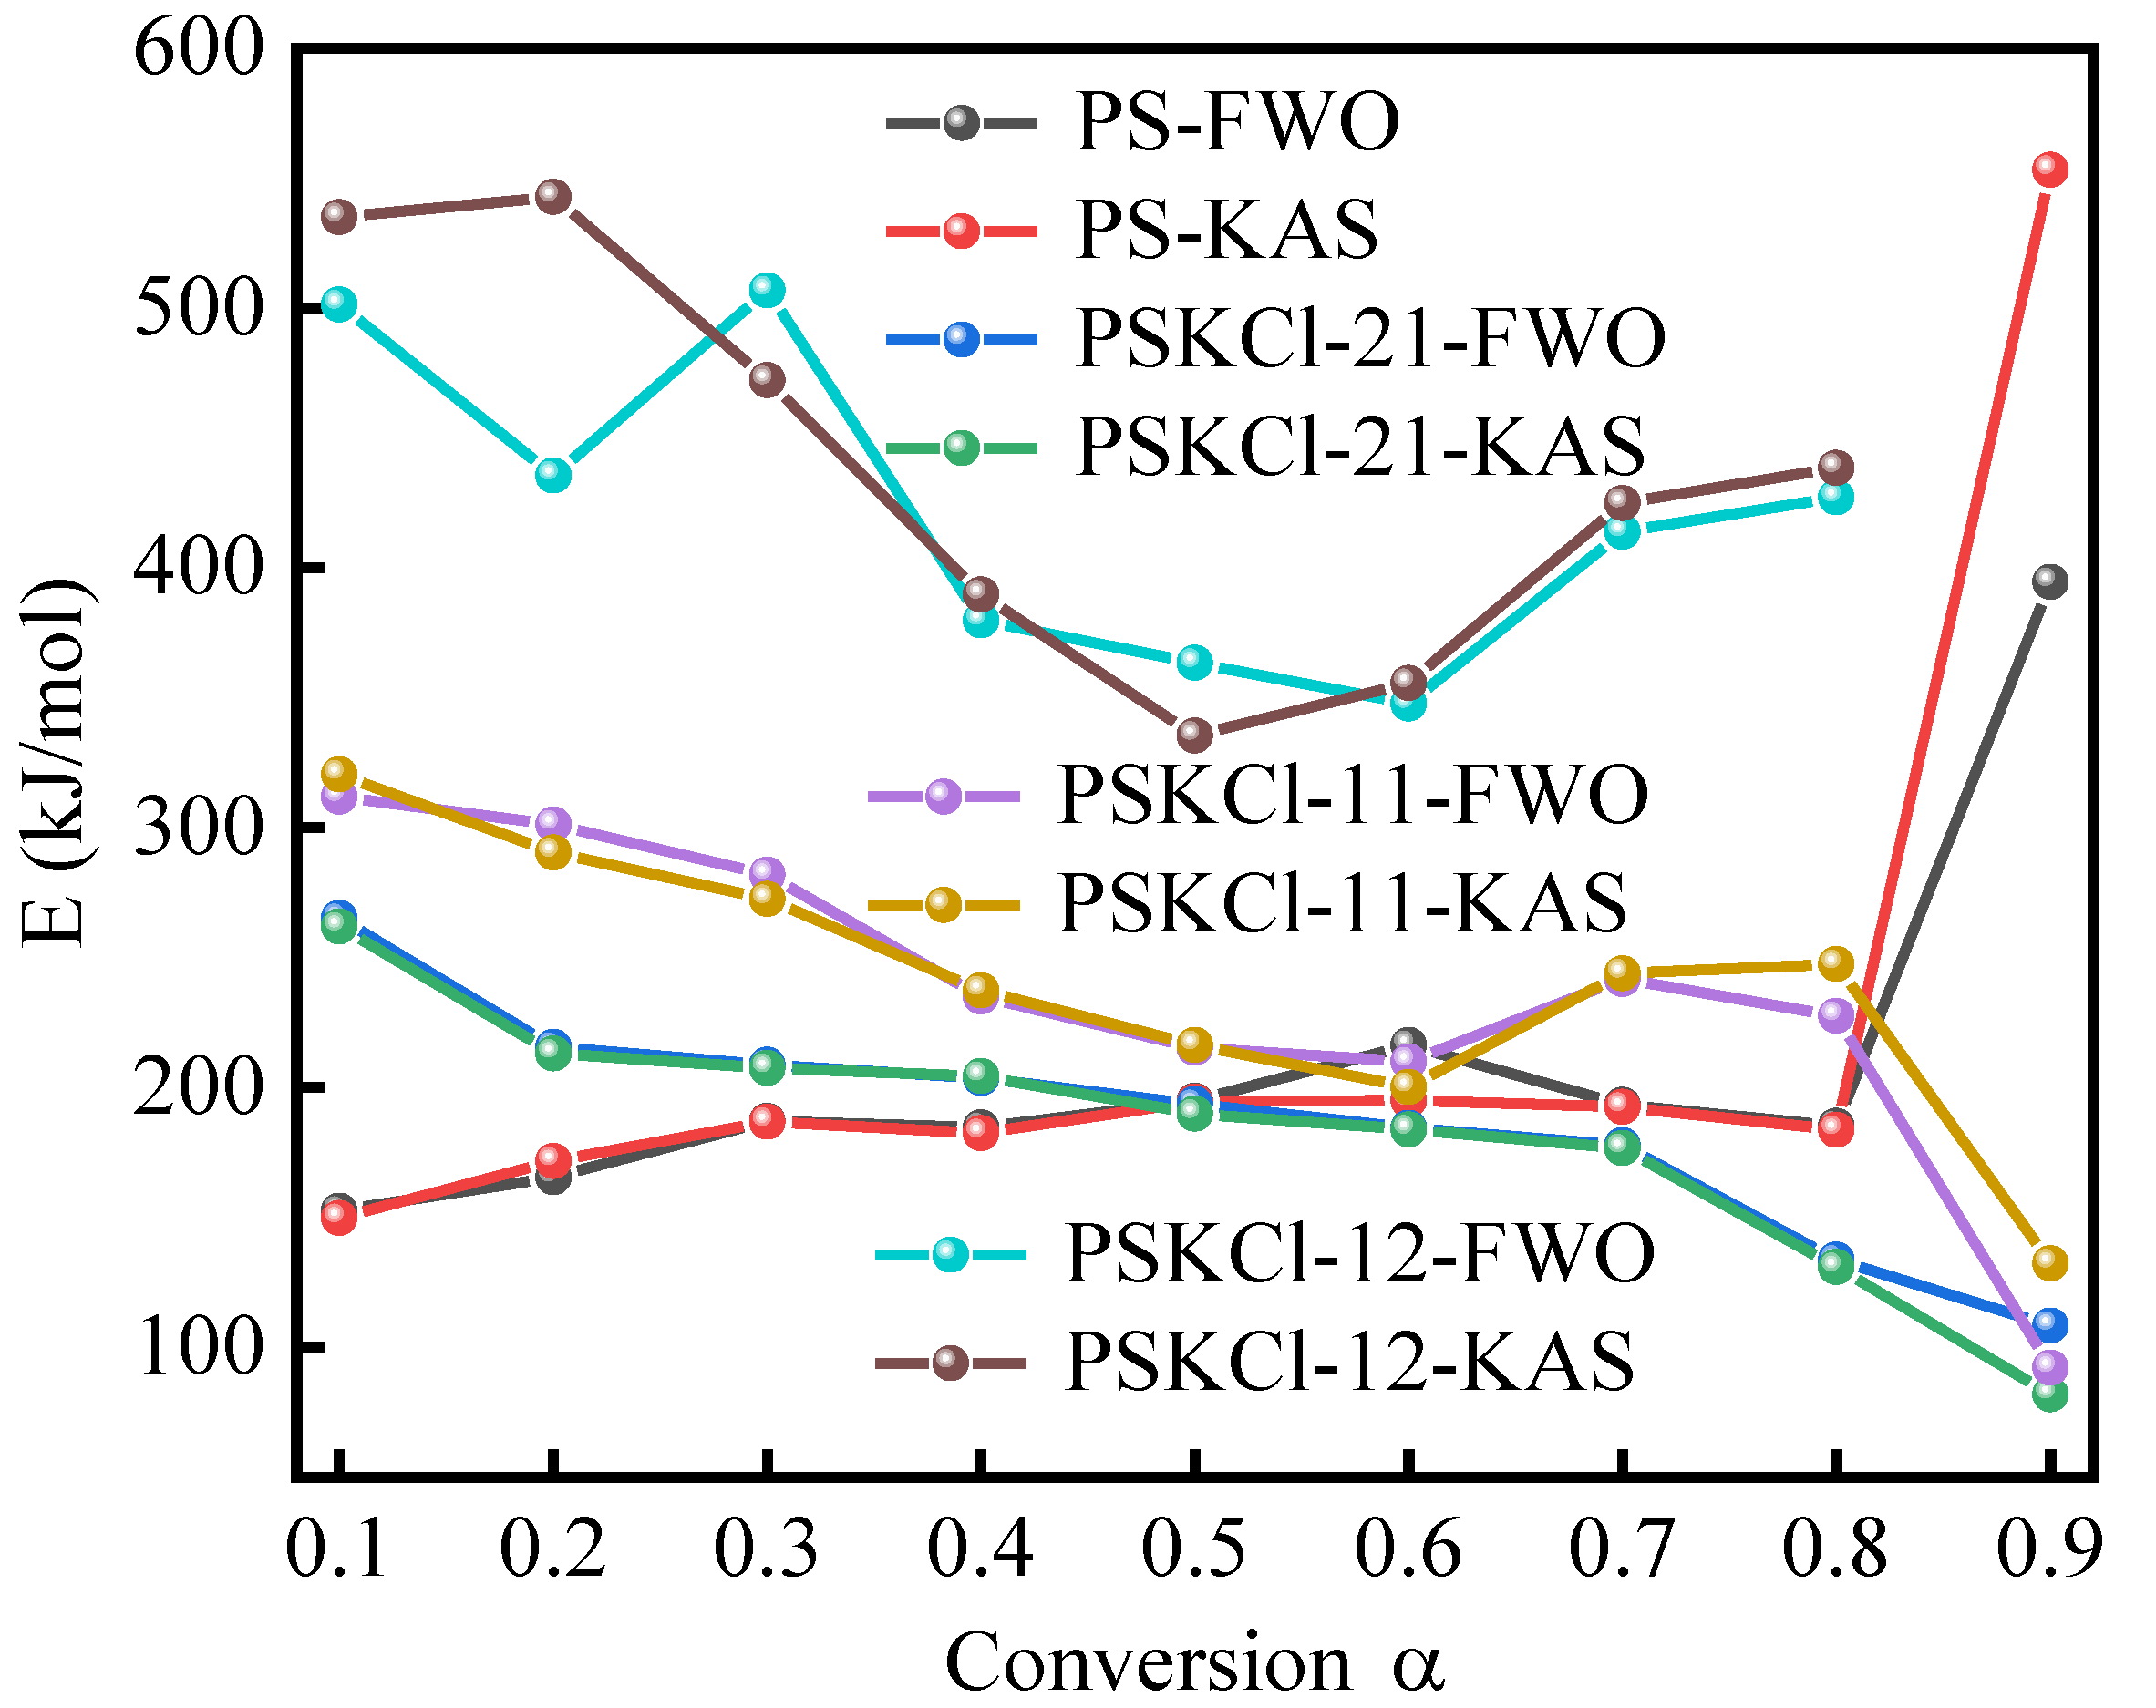
3.3. Pyrolysis Mechanism

The TGA data can be analyzed to obtain the kinetic and thermodynamics (E, ΔG, ΔS, and ΔH) parameters in a transient process (i.e., the thermal decomposition of the solids). For instance, Mallick et al. [40] calculated the thermodynamics (E, ΔG, ΔS, and ΔH) parameters of biomass blends using TGA data. The results suggested that positive ΔG and ΔH were obtained for pyrolysis for all biomass blends. Similarly, Tabal et al. [29] obtained the thermodynamics (E, ΔG, ΔS, and ΔH) values of ficus wood and then indicated the thermodynamics parameters that were beneficial in assimilating the thermal decomposition of ficus wood for its use in bioenergy. Meanwhile, to gain physical insight into the interactions occurring in the co-pyrolysis of KCl and PS, TGA data of 10, 20, 30, 40, and 50 °C/ min were evaluated by two model-free (FWO and KAS) methods, respectively (Figure 4a–h). It is well known that samples have no significant weight loss after 550 °C, which produces considerable noise and leads to deviations in activation energy [41]. Consequently, the conversion α range for PS, PSKCl-11, and PSKCl-21 in this work was 0.1–0.9. Nevertheless, PSKCl-12 contained a large amount of KCl, which led to no significant weight loss after 500 °C; thus, the conversion α range of PSKCl-12 herein was 0.1–0.8. The plots of the FWO and KAS methods used to calculate the E values of PS, PSKCl-11, PSKCl-12, and PSKCl-21 showed similar trends and similar phenomena were recorded in the previous studies [42,43,44]. Table 1 lists the E value/conversion α relationship of various samples. Moreover, the mean E values recorded by PS, PSKCl-21, PSKCl-11, and PSKCl-12 were calculated using FWO and KAS methods: 208.24 kJ/mol and 223.31 kJ/mol for PS; 187.91 kJ/mol and 183.37 kJ/mol for PSKCl-21; 235.22 kJ/mol and 240.13 kJ/mol for PSKCl-11; and 421.96 kJ/mol and 436.78 kJ/mol for PSKCl-12. Thus, the E values recorded for PS were comparable to those of the reported samples characterized by similar compositions [45,46]. As an example, Yao and coworkers obtained the mean activation energies (α = 0.1–0.6) of 163, 167, and 162 kJ/mol recorded for bamboo, rice, and pinewood, respectively, by the FWO method [47]. Mallick and coworkers suggested the mean activation energies of 170.01 kJ/mol and 168.21 kJ/mol recorded for rice husk + sawdust blends evaluated by the KAS and FWO methods, respectively [40]. Notwithstanding this, it is vital to analyze the entire thermal degradation process since the E value relies on the conversion α.
The E value trends of PS, PSKCl-21, PSKCl-11, and PSKCl-12 were determined using the FWO and KAS methods characterized by various conversion α (Figure 5). From Figure 5, it is observed that the values of E were different for all the conversion points. Variation in E values with degree of conversion (or pyrolysis) is essentially a consequence of the decomposition of different components of biomass with increasing temperature. Hemicellulose is known to degrade in the temperature range of 220–315 °C, while cellulose decomposes in the higher temperature range of 315–400 °C due to its crystalline nature. Lignin undergoes decomposition in the wide temperature range of 150–900 °C because of its complex structure. As discussed above, KCl showed basically no weight loss between room temperature and 770 °C. Accordingly, if there was no interaction between KCl and PS, the E value of the PS/KCl blends could be approximated as the E value of PS multiplied by the proportion of PS in the PS/KCl blends. As expected, the trend of E values with the conversion rate for PSKCl-12, PSKCl-11, and PSKCl-21 was not consistent with the trend of E values with the conversion rate for PS. From this, we can infer KCl interacts with PS in the pyrolysis temperature range. In general, the E profiles calculated for the FWO and KAS methods overlapped tightly, and a similar phenomenon was equally found in previous works [28,48]. The whole process can be divided into three stages. In the first stage (conversion α values: 0.1–0.3), the E values of PSKCl-11 and PSKCl-21 decreased with increasing conversion α, except for PSKCl-12 and PS. In the second stage (conversion α values: 0.3–0.7), the E values recorded for PS gradually increased as conversion α increased. Notably, at a conversion α of 0.7–0.8, the E values recorded for PSKCl-12 and PSKCl-11 were significantly higher than that of PS, whereas the E values of PSKCl-21 were lower than that of PS. As is known, the increase in E value indicates a more difficult degradation process, and this phenomenon can be ascribed to the generation of biochar characterized by a dense carbon-rich structure that possesses low degradation activity. From this, we can infer that when the KCl content in the PS/KCl blends was below 34%, the presence of KCl promoted the decomposition of PS. However, when the KCl content was above 50%, the presence of KCl increased the biochar yield. This phenomenon is crucial as it allows us to target-tune the yield of the three-phase product during biomass pyrolysis. The activation energy profiles of PS intersected with the activation energy profiles of PSKCl-21 when the conversion α was ~0.5. Similarly, the activation energy profiles of PS intersected with the activation energy profiles of PSKCl-11 when the conversion α was ~0.6; that is, as the KCl content in the PS/KCl blend increased, the intersection of its activation energy with the PS activation energy shifted to the right. The existence of KCl was more favorable for the degradation of PS in a range. The E values calculated by the FWO and KAS methods were very close to each other; so, in this work, the FWO method was used as a case study to investigate the master plots and pyrolysis thermodynamics.
The kinetic models are defined to understand the reaction kinetics. Furthermore, the integral master plots can be used to estimate the kinetic models when E is specified (Figure 6a–d). Additionally, Table 2 provides the kinetic models used for the reactions in non-homogeneous solid-state systems.
The similarity of the experimental master plots of P u P u 0.5 vs. α for various heating rates (Figure 6a–d) suggests that the pyrolysis kinetics of PS, PSKCl-21, PSKCl-11, and PSKCl-12 can be described by a single kinetic model. The discussion was split into two parts in the present work, as exhibited below: (1) α ≤ 0.5, the experimental master plots of PSKCl-21, PSKCl-11, and PSKCl-12 decomposition more closely followed the P2, P3, and P3 profiles, respectively. Accordingly, the kinetic processes of PSKCl-21, PSKCl-11, and PSKCl-12 decomposition can be characterized by the nucleation model. Additionally, the experimental master plots recorded for PS decomposition more closely followed the D3 profile, which was similar to the experimental master plots for the reported biomasses (e.g., corn straw and grass) [49,50,51]. Notably, the D3 mechanism is related to the solid-state reaction, where diffusion acts as a key player [52]; (2) α ≥ 0.5, the experimental master plots for PS, PSKCl-21, PSKCl-11, and PSKCl-12 decomposition more closely followed the P2, P2, P3, and P3 profiles, respectively. Accordingly, the kinetic processes of PS, PSKCl-21, PSKCl-11, and PSKCl-12 decomposition can be characterized by the nucleation model.
To further understand the thermodynamics, A, ΔH, ΔG, and ΔS values were analyzed. The variation of A values with conversion α is listed in Table 3. Several factors, including complex composition and thermal behavior, are known to cause changes in A values [29]. The A values of the samples are as follows: 3.49 × 10¹⁰ to 9.54 × 1030 recorded for PS; 1.98 × 10⁷ to 2.90 × 10²¹ recorded for PSKCl-21; 5.18 × 10⁵ to 2.14 × 1025 recorded for PSKCl-11; and 6.68 × 1030 to 4.58 × 1047 recorded for PSKCl-12. Notably, PS possessed lower A values at a conversion α value of 0.1–0.8, indicating that PS had simpler composition than PSKCl-11, PSKCl-12, and PSKCl-21. These results agree with the fact that the composition of the PS/KCl blends was more complex compared to that of PS. Higher values of frequency factor (A ≥ 109 s−1) essentially indicate a highly reactive system with a simple complex at different conversion rates. In addition, the A values were found to increase with conversion rates (α = 0.1–0.8), indicating increasing collision intensity between the reacting molecules with temperature [40]. Interestingly, a positive linear correlation between lnA values and E values is shown in Table 1 and Table 3. Similar findings were reported in previous literature [29].
Enthalpy (ΔH) is the total energy content of the system, and in the present context, it is essentially the internal energy of the PS/KCl blends. For the reaction system of biomass pyrolysis, the change in ΔH values represents the difference between the total energy of the formation of products and the reactants. That is, ΔH is the total energy consumed by the biomass for decomposition into various solid, liquid, and gaseous products. Similarly, ΔG and ΔS values represent the increase in total reaction energy during the formation of activated complexes and the degree of disorder associated with the production of activated complexes, respectively [53,54,55]. Figure 7a–c shows the ΔH, ΔG, and ΔS values at various conversion α values. PSKCl-12 and PSKCl-11 had higher ΔH values than PS at a conversion α value of 0.1–0.8 (Figure 7a). Meanwhile, the ΔH values of PSKCl-21 were higher than those of PS at α < 0.5. It is noteworthy that this trend corresponds to the change in activation energy. Despite this, the E and ΔH values showed several differences; for instance, the mean E and mean ΔH values of PS were 208.24 kJ/mol (the FWO method) and 203.18 kJ/mol, respectively. The smaller difference in energy shows that the products are formed thanks to the low potential energy, that is, the ease of activating complex formation (or the low potential barriers to activating complex formation) to convert the reactants into products. Except for PSKCl-21, the G values of the other samples showed insignificant changes (Table 4 and Figure 7b). As is known, the ΔG values indicate the quantity of energy that could be turned into usable energy through the pyrolysis of biomass. Remarkably, PS exhibited a mean ΔG value of 182.49 kJ/mol (Table 4). Based on this, it could be deduced that PS offers promising bioenergy potential via pyrolysis.
Several samples (i.e., PS, PSKCl-21, and PSKCl-11), except for PSKCl-12, had positive and negative ΔS values (Figure 7c). It is well known that a negative ΔS value demonstrates the change of the reaction system from a disordered state to an ordered state, which is crucial for converting biomass into biofuels and chemical feedstocks [56]. In addition, the lower ΔS values represent materials that recently underwent several physical and chemical variations, bringing them nearer to thermodynamic equilibrium. A positive value of ΔS indicates that the system is far from thermal equilibrium, which also affects the reactivity of the system. In conclusion, the comparative complexity of the thermal decomposition of PSKCl-21, PSKCl-11, and PSKCl-12 corresponds to the fact that they were compositionally complex.

3.4. Disorder Analysis

Raman spectra (Figure 8) were applied to determine the defect or disorder information of pyrolysis residue. As is known, peaks at ~1340 cm−1 and ~1590 cm−1 represent the D-band (amorphous sp3 carbon) and G-band (ascribed to the graphitic sp2 carbon), respectively. Typically, the ID/IG value is utilized to assess the disorder degree of samples [57]. The pre-oxidation inhibits the graphitization of carbon materials [58]. The graphite layers of the pre-oxidized samples tend to bend and twist randomly during subsequent carbonization rather than grow and rearrange, resulting in larger layer spacing [59]. Conversely, the ID/IG values of PS, PSKCl-21, PSKCl-11, and PSKCl-12 were 0.74, 0.73, 0.63, and 0.61, respectively. Interestingly, Wang et al. [60] demonstrated that the carbon material structure, nitrogen species, and graphitization degree are effectively controlled by adjusting the KCl dosage and pyrolysis temperature. Notably, this work equally relates to the enhancement of graphitization on the pyrolysis of a zinc-containing ionic liquid. It follows that KCl does have a positive impact, but that does not mean that it would do the same on biomass (e.g., PS). In this context, it is desirable to investigate the effect of KCl on graphitization during biomass pyrolysis. In addition, Zhao et al. [61] indicated that manganese ions assisted in catalytic carbonization and precisely tuned the degree of graphitization. Encouragingly, the order of graphitization degrees for the samples was established: PSKCl-12 > PSKCl-11 > PSKCl-21 > PS. Notably, the ID/IG values of PS and PSKCl-21 were higher than in the previous work (ID/IG: 0.71 [62]), implying that PS and PSKCl-21 possessed more disordered carbon. In addition, PSKCl-12 and PSKCl-11 possessed lower ID/IG values than those of the previous work (ID/IG: 0.90 [62] and 0.97 [63]), suggesting that PSKCl-12 and PSKCl-11 had more ordered graphitic structures. More encouraging, with increasing KCl content in the PS/KCl blends, the graphitization of their pyrolysis residues gradually increased. When the pyrolysis temperature was over 700 °C (conversion α value > 0.8), the appropriate amount of KCl improved the graphitization of the pyrolysis residue by reducing the E, ΔS, and ΔH values of the PS/KCl blends. From this, we can infer that KCl can assist biochar graphitization. In conclusion, this work showed that the presence of KCl during biomass pyrolysis can improve the yield and graphitization of biochar. Of note is that this work did not examine the devolatilization of KCl, the preparation of porous carbon in a tube furnace, or the characterization of porous carbon, or discuss the effect of chlorine content on the electrical conductivity and adsorption properties of porous carbon; thus, the study does not indicate that the devolatilization of KCl, the preparation of porous carbon in a tube furnace, the characterization of porous carbon, or the discussion of the effect of chlorine content on the electrical conductivity and adsorption properties of porous carbon are not crucial. Notwithstanding its limitations, this study does provide a large amount of critical data for understanding the co-pyrolysis of PS with KCl.

4. Conclusions

In the present work, TGA was applied to probe the interaction mechanism of the PS/KCl blends. The PSKCl-21, PSKCl-11, and PSKCl-12 samples possessed various pyrolysis behaviors compared with PS. In addiiton, the cross-point temperature gradually increased with improving the KCl content in the PS/KCl blends, which was related to the high melting point of KCl. When the KCl content in the PS/KCl blends was below 34%, the presence of KCl promoted the decomposition of PS. However, when the KCl content was above 50%, the presence of KCl increased the biochar yield. Within a range, as the KCl content in the PS/KCl blend increased, the intersection of its activation energy with the PS activation energy shifted to the right. At lower conversion α values (α ≤ 0.5), the experimental master plots of PSKCl-21, PSKCl-11, and PSKCl-12 showed decomposition near the P2, P3, and P3 profiles, respectively. Notably, the lnA value was linearly positively related to the E value. Moreover, negative and positive ΔS values were calculated from the pyrolysis of PS, PSKCl-11, and PSKCl-21. In short, the present work indicated that the presence of KCl during biomass pyrolysis can enhance the yield and graphitization of biochar within a range.

Author Contributions

L.X.: Writing—original draft. L.W.: Conceptualization, Formal analysis, Data curation, Writing—original draft. J.Z.: Supervision, Funding acquisition, and Editing. H.M.: Writing—reviewing and editing, Data curation, Visualization, and Supervision. All authors have read and agreed to the published version of the manuscript.

Funding

This work was jointly supported by the National Promotion Project of China (No. 2020133136) and the National Key Research and Development Plan of China (2016YFE0201800).

Informed Consent Statement

Not applicable.

Data Availability Statement

Not applicable.

Conflicts of Interest

The authors declare no competing financial interest.

Abbreviations

AcronymMeaning
PSPine sawdust
PSKCl-21The sample was obtained by mixing PS and KCl with a weight ratio of 2:1
PSKCl-11The sample was obtained by mixing PS and KCl with a weight ratio of 1:1
PSKCl-12The sample was obtained by mixing PS and KCl with a weight ratio of 1:2
TGAThermogravimetric analysis
APre-exponential factor
ΔHEnthalpy
ΔGGibbs free energy
ΔSEntropy
FWOFlynn-Wall-Ozawa
KASKissinger-Akahira-Sunose
EActivation energy
TAbsolute temperature
R2Correlation coefficient
KBoltzmann constant
TmThe peak temperature for the DTG curve
hPlank constant

References

  1. Chen, D.Y.; Zhuang, X.Z.; Gan, Z.Y.; Cen, K.H.; Ba, Y.P.; Jia, D.X. Co-pyrolysis of light bio-oil leached bamboo and heavy bio-oil: Effects of mass ratio, pyrolysis temperature, and residence time on the biochar. Chem. Eng. J. 2022, 437, 135253. [Google Scholar] [CrossRef]
  2. Chen, D.Y.; Chen, F.; Cen, K.H.; Cao, X.B.; Zhang, J.; Zhou, J.B. Upgrading rice husk via oxidative torrefaction: Characterization of solid, liquid, gaseous products and a comparison with non-oxidative torrefaction. Fuel 2020, 275, 117936. [Google Scholar] [CrossRef]
  3. Wang, L.C.; Li, X.; Zhou, J.B.; Ma, H.H.; Wang, H.L. Tailoring texture properties in porous carbon for enhanced capacitive performance: Towards investigating the CO2 activation behaviors of carbonaceous matter. Colloid. Surf. A 2022, 652, 129810. [Google Scholar] [CrossRef]
  4. Chen, D.Y.; Cen, K.H.; Cao, X.B.; Chen, F.; Zhang, J.; Zhou, J.B. Insight into a new phenolic-leaching pretreatment on bamboo pyrolysis: Release characteristics of pyrolytic volatiles, upgradation of three phase products, migration of elements, and energy yield. Renew. Sust. Energy Rev. 2021, 136, 110444. [Google Scholar] [CrossRef]
  5. Singh, S.V.; Chaturvedi, S.; Dhyani, V.C.; Kasivelu, G. Pyrolysis temperature influences the characteristics of rice straw and husk biochar and sorption/desorption behaviour of their biourea composite. Bioresour. Technol. 2020, 314, 123674. [Google Scholar] [CrossRef]
  6. Almeida, L.S.; Oreste, E.Q.; Maciel, J.V.; Heinemann, M.G.; Dias, D. Electrochemical devices obtained from biochar: Advances in renewable and environmentally-friendly technologies applied to analytical chemistry. Trends Environ. Anal. 2020, 26, e00089. [Google Scholar] [CrossRef]
  7. Cen, K.H.; Zhang, J.; Ma, Z.Q.; Chen, D.Y.; Zhou, J.B.; Ma, H.H. Investigation of the relevance between biomass pyrolysis polygeneration and washing pretreatment under different severities: Water, dilute acid solution and aqueous phase bio-oil. Bioresour. Technol. 2019, 278, 26–33. [Google Scholar] [CrossRef]
  8. Wang, L.C.; Xie, L.E.; Feng, X.; Li, X.; Ma, H.H.; Han, G.L.; Yang, D.R.; Zhou, J.B. Optimization process of porous carbon derived from coconut shell: A novel preparation condition and investigation on pore surface roughness. Diam. Relat. Mater. 2022, 123, 108854. [Google Scholar] [CrossRef]
  9. Zhang, H.F.; He, X.J.; Wei, F.; Dong, S.A.; Xiao, N.; Qiu, J.S. Moss-covered rock-like hybrid porous carbons with enhanced electrochemical properties. ACS Sustain. Chem. 2020, 8, 3065–3071. [Google Scholar] [CrossRef]
  10. Wang, Q.; Yan, J.; Fan, Z.J. Carbon materials for high volumetric performance supercapacitors: Design, progress, challenges and opportunities. Energy Environ. Sci. 2016, 9, 729–762. [Google Scholar] [CrossRef]
  11. Wang, L.C.; Wu, J.L.; Gao, Y.; Sha, L.K.; Ma, H.H.; Li, X.; Zhou, J.B. H3PO4-assisted preparation of precursor-derived porous carbon: Construction of precursor/precursor-derived porous carbon texture properties relationship. Diam. Relat. Mater. 2021, 119, 108596. [Google Scholar] [CrossRef]
  12. Wang, L.C.; Feng, X.; Li, X.; Wang, H.L.; Wu, J.L.; Ma, H.H.; Zhou, J.B. Hydrothermal, KOH-assisted synthesis of lignin-derived porous carbon for supercapacitors: Value-added of lignin and constructing texture properties/specific capacitance relationships. J. Mater. Res. Technol. 2022, 16, 570–580. [Google Scholar] [CrossRef]
  13. Li, B.W.; Hu, J.C.; Xiong, H.; Xiao, Y. Application and properties of microporous carbons activated by ZnCl2: Adsorption behavior and activation mechanism. ACS Omega 2020, 5, 9398–9407. [Google Scholar] [CrossRef]
  14. Guo, S.S.; Chen, Y.X.; Shi, L.L.; Dong, Y.; Ma, J.; Chen, X.H.; Song, H.H. Nitrogen-doped biomass-based ultra-thin carbon nanosheets with interconnected framework for high-performance lithium-ion batteries. Appl. Surf. Sci. 2018, 437, 136–143. [Google Scholar] [CrossRef]
  15. Zhang, M.D.; Yu, C.; Li, Z.; Yu, J.H.; Li, S.F.; Zhao, C.T.; Huang, H.L.; Qiu, J.S. A recyclable route to produce biochar with a tailored structure and surface chemistry for enhanced charge storage. Green Chem. 2019, 21, 2095–2103. [Google Scholar] [CrossRef]
  16. Li, S.S.; Wang, C.; Luo, Z.J.; Zhu, X.F. Investigation on the catalytic behavior of alkali metals and alkaline earth metals on the biomass pyrolysis assisted with real-time monitoring. Energy Fuels 2020, 34, 12654–12664. [Google Scholar] [CrossRef]
  17. Mahadevan, R.; Adhikari, S.; Shakya, R.; Wang, K.; Dayton, D.; Lehrich, M.; Taylor, S.E. Effect of alkali and alkaline earth metals on in-situ catalytic fast pyrolysis of lignocellulosic biomass: A microreactor study. Energy Fuels 2016, 30, 3045–3056. [Google Scholar] [CrossRef]
  18. Zhang, X.H.; Li, H.X.; Zhang, K.; Wang, Q.; Qin, B.; Cao, Q.; Jin, L. Strategy for preparing porous graphitic carbon for supercapacitor: Balance on porous structure and graphitization degree. J. Electrochem. Soc. 2018, 165, A2084–A2092. [Google Scholar] [CrossRef]
  19. Zhang, X.H.; Li, H.X.; Qin, B.; Wang, Q.; Xing, X.H.; Yang, D.H.; Jin, L.; Cao, Q. Direct synthesis of porous graphitic carbon sheets grafted on carbon fibers for high-performance supercapacitors. J. Mater. Chem. A 2019, 7, 3298. [Google Scholar] [CrossRef]
  20. Xie, J.; Tong, L.; Su, L.W.; Xu, Y.W.; Wang, L.B.; Wang, Y.H. Good electronic conductivity provides a low resistance channel for electron transport. J. Power. Sources 2017, 342, 529–536. [Google Scholar] [CrossRef]
  21. Li, M.; He, J.J. Effect of stress state on graphitization behavior of diamond under high pressure and high temperature. Diam. Relat. Mater. 2021, 116, 108368. [Google Scholar] [CrossRef]
  22. Yoon, S.B.; Chai, G.S.; Kang, S.K.; Yu, J.S.; Gierszal, K.P.; Jaroniec, M. Graphitized pitch-based carbons with ordered nanopores synthesized by using colloidal crystals as templates. J. Am. Chem. Soc. 2005, 127, 4188–4189. [Google Scholar] [CrossRef]
  23. Krivoruchko, O.P.; Maksimova, N.I.; Zaikovskii, V.I.; Salanov, A.N. Study of multiwalled graphite nanotubes and filaments formation from carbonized products of polyvinyl alcohol via catalytic graphitization at 600–800 °C in nitrogen atmosphere. Carbon 2000, 38, 1075–1082. [Google Scholar] [CrossRef]
  24. Sevilla, M.; Sanchis, C.; Valdés-Solís, T.; Morallón, E.; Fuertes, A.B. Synthesis of graphitic carbon nanostructures from sawdust and their application as electrocatalyst supports. J. Phys. Chem. C 2007, 111, 9749–9756. [Google Scholar] [CrossRef]
  25. Oya, A.; Yoshida, S.; Alcaniz-Monge, J.; Linares-Solano, A. Formation of mesopores in phenolic resin-derived carbon fiber by catalytic activation using cobalt. Carbon 1995, 33, 1085–1090. [Google Scholar] [CrossRef]
  26. Uzoejinwa, B.B.; He, X.H.; Wang, S.; Abomohra, A.E.; Hu, Y.M.; He, Z.X.; Wang, Q. Co-pyrolysis of macroalgae and lignocellulosic biomass. J. Therm. Anal. Calorim. 2019, 136, 2001–2016. [Google Scholar] [CrossRef]
  27. Singh, S.; Prasad, C.J.; Kumar, M.M. Intrinsic kinetics, thermodynamic parameters and reaction mechanism of non-isothermal degradation of torrefied Acacia nilotica using isoconversional methods. Fuel 2020, 259, 116263. [Google Scholar] [CrossRef]
  28. Zhang, Y.M.; Wang, L.C.; Wu, Y.S.; Chen, Y.; Ma, H.H.; Zhou, H.; Zhu, Z.X.; Liu, S.H.; Zhou, J.B. Pyrolysis characteristics, kinetics, and its product characteristics of grape stem. Bioresources 2019, 14, 7901–7919. [Google Scholar] [CrossRef]
  29. Tabal, A.; Barakat, A.; Aboulkas, A.; Harfi, K.E. Pyrolysis of ficus nitida wood: Determination of kinetic and thermodynamic parameters. Fuel 2021, 283, 119253. [Google Scholar] [CrossRef]
  30. Wang, L.C.; Wu, J.L.; Ma, H.H.; Han, G.L.; Yang, D.R.; Chen, Y.; Zhou, J.B. H3PO4-assisted synthesis of apricot shell lignin-based activated carbon for capacitors: Understanding the pore structure/electrochemical performance relationship. Energy Fuel 2021, 35, 8303–8312. [Google Scholar] [CrossRef]
  31. Chen, D.Y.; Zhou, J.B.; Zhang, Q.S. Effects of torrefaction on the pyrolysis behavior and Bio-oil properties of rice husk by using TG-FTIR and Py-GC/MS. Energy Fuel 2014, 28, 5857–5863. [Google Scholar] [CrossRef]
  32. Chen, D.Y.; Wang, Y.; Liu, Y.X.; Cen, K.H.; Cao, X.B.; Ma, Z.Q.; Li, Y.J. Comparative study on the pyrolysis behaviors of rice straw under different washing pretreatments of water, acid solution, and aqueous phase bio-oil by using TG-FTIR and PY-GC/MS. Fuel 2019, 252, 1–9. [Google Scholar] [CrossRef]
  33. Kumar, A.; Wang, L.; Dzenis, Y.A.; Jones, D.D.; Hanna, M.A. Thermogravimetric characterization of corn stover as gasification and pyrolysis feedstock. Biomass Bioenerg. 2008, 32, 460–467. [Google Scholar] [CrossRef]
  34. Azargohar, R.; Nanda, S.; Kozinski, J.A.; Dalai, K.A. Effects of temperature on the physicochemical characteristics of fast pyrolysis bio-chars derived from Canadian waste biomass. Fuel 2014, 125, 90–100. [Google Scholar] [CrossRef]
  35. Xue, B.C.; Wang, Z.C.; Zhu, Y.C.; Wang, X.F.; Xiao, R. Sustainable and recyclable synthesis of porous carbon sheets from rice husks for energy storage: A strategy of comprehensive utilization. Ind. Crop. Prod. 2021, 170, 113724. [Google Scholar] [CrossRef]
  36. Jones, F.; Tran, H.; Lindberg, D.; Zhao, L.M.; Hupa, M. Thermal stability of Zinc compounds. Energy Fuels 2013, 27, 5663–5669. [Google Scholar] [CrossRef]
  37. Vyazovkin, S.; Burnham, A.K.; Favergeon, L.; Koga, N.; Moukhina, E.; Pérez-Maqueda, L.A.; Sbirrazzuoli, N. ICTAC kinetics committee recommendations for analysis of multi-step kinetics. Thermochim. Acta 2020, 689, 178597. [Google Scholar] [CrossRef]
  38. López-González, D.; Fernandez-Lopez, M.; Valverde, J.L.; Sanchez-Silva, L. Thermogravimetric-mass spectrometric analysis on combustion of lignocellulosic biomass. Bioresour. Technol. 2013, 143, 562–574. [Google Scholar] [CrossRef]
  39. Lah, B.; Klinar, D.; Likozar, B. Pyrolysis of natural, butadiene, styrene-butadiene rubber and tyre components: Modelling kinetics and transport phenomena at different heating rates and formulations. Chem. Eng. Sci. 2013, 87, 1–13. [Google Scholar] [CrossRef]
  40. Mallick, D.; Kumar, P.M.; Pinakeswar, M.; Vijayanand, S.M. Discernment of synergism in pyrolysis of biomass blends using thermogravimetric analysis. Bioresour. Technol. 2018, 261, 294–305. [Google Scholar] [CrossRef]
  41. Guo, D.B.; Hu, M.; Chen, Z.H.; Cui, B.H.; Zhang, Q.; Liu, Y.H.; Luo, S.Y.; Ruan, R.; Liu, Y. Catalytic pyrolysis of rain tree biomass with nano nickel oxide synthetized from nickel plating slag: A green path for treating waste by waste. Bioresour. Technol. 2020, 315, 123831. [Google Scholar] [CrossRef] [PubMed]
  42. Nisar, J.; Rahman, A.; Ali, G.; Shah, A.; Farooqi, Z.; Ahmad, I.; Iqbal, M.; Rehman, N.U. Pyrolysis of almond shells waste: Effect of zinc oxide on kinetics and product distribution. Biomass Convers. Bior. 2022, 12, 2583–2595. [Google Scholar] [CrossRef]
  43. Nisar, J.; Ali, G.; Shah, A.; Iqbal, M.; Khan, R.; Uddin, S.; Anwar, F.; Ullah, R.; Akhter, M.S. Fuel production from waste polystyrene via pyrolysis: Kinetics and products distribution. Waste Manag. 2019, 88, 236–247. [Google Scholar] [CrossRef]
  44. Nisar, J.; Ali, F.; Malana, M.A.; Ali, G.; Iqbal, M.; Shah, A.; Ahmad, I.; Khan, T.A.; Rashid, U. Kinetics of the pyrolysis of cobalt-impregnated sesame stalk biomass. Biomass Convers. Bior. 2020, 10, 1179–18710. [Google Scholar] [CrossRef]
  45. Ma, H.H.; Zhang, Y.M.; Wang, L.C.; Zhu, Z.X.; Chen, Y.; Wang, H.L.; Deng, C.J.; Zhou, J.B. Kinetic analysis of the pyrolysis of apricot stone and its main components via distributed activation energy mode. Bioresources 2020, 15, 1187–1204. [Google Scholar] [CrossRef]
  46. Yang, H.P.; Yan, R.; Chin, T.; Liang, D.T.; Chen, H.P.; Zheng, C.G. Thermogravimetric analysis-fourier transform infrared analysis of palm oil waste pyrolysis. Energy Fuel 2004, 18, 1814–1821. [Google Scholar] [CrossRef]
  47. Yao, F.; Wu, Q.L.; Lei, Y.; Guo, W.H.; Xu, Y.J. Thermal decomposition kinetics of natural fibers: Activation energy with dynamic thermogravimetric analysis. Polym. Degrad. Stabll. 2008, 93, 90–98. [Google Scholar] [CrossRef]
  48. Wang, L.C.; Xie, L.E.; Ma, H.H.; Zhou, J.B. Co-pyrolysis of pine sawdust with nickel formate for understanding interaction mechanisms and enhancing resistance toward biochar deposition. J. Mater. Res. Technol. 2022, 18, 3751–3763. [Google Scholar] [CrossRef]
  49. Min, F.F.; Zhang, M.X.; Chen, Q.R. Non-isothermal kinetics of pyrolysis of three kinds of fresh biomass. J. China Univ. Min. Technol. 2007, 17, 105–111. [Google Scholar] [CrossRef]
  50. Dhyani, V.; Kumar, J.; Bhaskar, T. Thermal decomposition kinetics of sorghum straw via thermogravimetric analysis. Bioresour. Technol. 2017, 245, 1122–1129. [Google Scholar] [CrossRef] [PubMed]
  51. Mishra, G.; Kumar, J.; Bhaskar, T. Kinetic studies on the pyrolysis of pinewood. Bioresour. Technol. 2015, 182, 282–288. [Google Scholar] [CrossRef] [PubMed]
  52. Khawam, A.; Flanagan, D.R. Solid-state kinetic models: Basics and mathematical fundamentals. J. Phys. Chem. B 2006, 110, 17315–17328. [Google Scholar] [CrossRef]
  53. Vlaev, L.; Georgieva, V.; Genieva, S. Products and kinetics of non-isothermal decomposition of vanadium oxide compounds. J. Therm. Anal. Calorim. 2007, 88, 805–812. [Google Scholar] [CrossRef]
  54. Xu, Y.L.; Chen, B.L. Investigation of thermodynamic parameters in the pyrolysis conversion of biomass and manure to biochars using thermogravimetric analysis. Bioresour. Technol. 2013, 146, 485–493. [Google Scholar] [CrossRef] [PubMed]
  55. Ahmad, M.S.; Mehmood, M.A.; Al-Ayed, O.S.; Ye, G.B.; Imededdine, N.; Qadir, G. Kinetic analyses and pyrolytic behavior of para grass for its bioenergy potential. Bioresour. Technol. 2017, 224, 708–713. [Google Scholar] [CrossRef]
  56. Huang, L.M.; Liu, J.Y.; He, Y.; Sun, S.Y.; Chen, J.C.; Sun, J.; Chang, K.L.; Kuo, J.H.; Ning, X.A. Thermodynamics and kinetics parameters of co-combustion between sewage sludge and water hyacinth in CO2/O2 atmosphere as biomass to solid biofuel. Bioresour. Technol. 2016, 218, 631–642. [Google Scholar] [CrossRef]
  57. Chen, L.; Wang, F.; Tian, Z.W.; Guo, H.T.; Cai, C.Y.; Wu, Q.J.; Du, H.J.; Liu, K.M.; Hao, Z.F.; He, S.J.; et al. Wood-derived high-mass-loading MnO2 composite carbon electrode enabling high energy density and high-rate supercapacitor. Small 2022, 18, 2201307. [Google Scholar] [CrossRef] [PubMed]
  58. Du, Y.F.; Sun, G.H.; Li, Y.; Cheng, J.Y.; Chen, J.P.; Song, G.; Kong, Q.Q.; Xie, L.J.; Chen, C.M. Pre-oxidation of lignin precursors for hard carbon anode with boosted lithium-ion storage capacity. Carbon 2021, 178, 243–255. [Google Scholar] [CrossRef]
  59. Lin, X.Y.; Liu, Y.Z.; Tan, H.; Zhang, B. Advanced lignin-derived hard carbon for Na-ion batteries and a comparison with Li and K ion storage. Carbon 2020, 157, 316–323. [Google Scholar] [CrossRef]
  60. Zou, L.Y.; Zhong, G.Y.; Nie, Y.J.; Tan, Z.X.; Liao, W.B.; Fu, X.B.; Pan, Z.C. Porous carbon nanosheets derived from ZIF-8 treated with KCl as highly efficient electrocatalysts for the oxygen reduction reaction. Energy Technol. 2021, 9, 210003. [Google Scholar] [CrossRef]
  61. Zhao, J.H.; He, X.X.; Lai, W.H.; Yang, Z.; Liu, X.H.; Li, L.; Qiao, Y.; Xiao, Y.; Li, L.; Wu, X.Q.; et al. Catalytic defect-repairing using manganese ions for hard carbon anode with high-capacity and high-initial-coulombic-efficiency in sodium-ion batteries. Adv. Energy Mater. 2023, 2300444. [Google Scholar] [CrossRef]
  62. Wang, M.L.; Zhang, T.Y.; Cui, M.Z.; Liu, W.F.; Liu, X.G.; Zhao, J.W.; Zhou, J.D. Sub-nanopores-containing N,O-codoped porous carbon from molecular-scale networked polymer hydrogel for solid-state supercapacitor. Chin. Chem. Lett. 2020, 32, 1111–1116. [Google Scholar] [CrossRef]
  63. Zhou, Y.; Jia, Z.X.; Shi, L.L.; Wu, Z.; Jie, B.Y.; Zhao, S.Y.; Wei, L.Y.; Zhou, A.G.; Zhu, J.W.; Wang, X.; et al. Pressure difference-induced synthesis of P-doped carbon nanobowls for high-performance supercapacitors. Chem. Eng. J. 2020, 385, 123858. [Google Scholar] [CrossRef]
Figure 1. TG curves of 10 °C/min (a), 20 °C/min (c), 30 °C/min (e), 40 °C/min (g), and 50 °C/min (i); DTG curves of 10 °C/min (b), 20 °C/min (d), 30 °C/min (f), 40 °C/min (h), and 50 °C/min (j).
Materials 16 03667 g001aMaterials 16 03667 g001b
Figure 2. TG (a) and DTG (b) for PS at various heating rates.
Materials 16 03667 g002
Figure 3. Theoretical and experimental TG curves for PSKCl-21 (a) and PSKCl-11 (b).
Materials 16 03667 g003
Figure 4. Linear plots for calculation of Arrhenius (E and A) for PS (a), PSKCl-21 (c), PSKCl-11 (e), and PSKCl-12 (g) applying the FWO method; linear plots for calculation of Arrhenius (E and A) for PS (b), PSKCl-21 (d), PSKCl-11 (f), and PSKCl-12 (h) employing the KAS method.
Materials 16 03667 g004aMaterials 16 03667 g004b
Figure 5. Activation energy/conversion α relationship of samples under various iso-conversional methods.
Materials 16 03667 g005
Figure 6. Theoretical and experimental master plots for the decomposition of (a) PS, (b) PSKCl-21, (c) PSKCl-11, and (d) PSKCl-12 at heating rates of 10, 20, 30, 40, and 50 °C/min.
Materials 16 03667 g006
Figure 7. (a) ΔH, (b) ΔG, and (c) ΔS at various conversion α values.
Materials 16 03667 g007aMaterials 16 03667 g007b
Figure 8. Raman spectra for samples.
Materials 16 03667 g008
Table 1. Activation energy/conversion α relationship.
Conversion αPSPSKCl-21PSKCl-11PSKCl-12
FWO
E (kJ/mol)
KAS
E (kJ/mol)
FWO
E (kJ/mol)
KAS
E (kJ/mol)
FWO
E (kJ/mol)
KAS
E (kJ/mol)
FWO
E (kJ/mol)
KAS
E (kJ/mol)
0.1152.52149.81265.27262.03311.86320.55501.38534.96
0.2165.55171.68215.58213.06301.23290.39435.48542.65
0.3187.10186.79208.74207.48281.86272.59506.78472.18
0.4184.58182.44203.65204.36235.12237.38379.85389.82
0.5194.97194.61193.57189.97215.34216.39363.42335.48
0.6216.37195.00184.51183.87210.02200.25347.79355.70
0.7193.28192.50177.82176.66241.73243.86413.86424.96
0.8185.18183.76133.73130.97227.65247.45427.12438.52
0.9394.61553.18108.3281.9492.16132.35n.dn.d
Activation energy that could not be evaluated was marked with n.d.
Table 2. Kinetic models for reactions in heterogeneous solid-state systems.
Model Differential   Form   f   ( α ) = 1 k d α d t Integral form G (α)
Nucleation models
Power lawP21/2α1/2
Power lawP32/3α1/3
Power lawP43/4α1/4
Avarami-ErofeyevA22(1 − α)[−ln(1 − α)]1/2[−ln(1 − α)]1/2
Avarami-ErofeyevA33(1 − α)[−ln(1 − α)]2/3[−ln(1 − α)]1/3
Avarami-ErofeyevA44(1 − α)[−ln(1 − α)]3/4[−ln(1 − α)]1/4
Geometrical contraction models
Contracting areaR22(1 − α)1/2[1 − (1 − α)1/2]
Contracting volumeR33(1 − α)2/3[1 − (1 − α)1/3]
Diffusion models
1-D diffusionD11/2αα2
2-D diffusionD2[−ln(1 − α)]−1[(1 − α)ln(1 − α)] + α
3-D diffusion, JanderD33(1 − α)2/3/[2(1 − (1 − α)1/3)][1 − (1 − α)1/3]2
Ginstling-BrounshteinD43/[2((1 − α)−1/3 − 1)]1 − (2α/3) − (1 − α)2/3
Reaction-order models
First-orderF1(1 − α)−ln(1 − α)
Second-orderF2(1 − α)2(1 − α)−1 − 1
Third-orderF3(1 − α)3[(1 − α)−2 − 1]/2
Fifth-orderF5(1 − α)5[(1 − α)−4 − 1]/4
Table 3. Variation for pre-exponential factor with conversion α.
Conversion αA (s−1)
PSPSKCl-21PSKCl-11PSKCl-12
0.13.49 × 10102.90 × 10212.14 × 10253.65 × 1044
0.24.58 × 10111.11 × 10172.46 ×10244.74 × 1038
0.32.96 × 10132.49 × 10164.79 × 10221.11 × 1045
0.41.80 × 10138.69 × 10153.48 × 10184.99 × 1033
0.51.38 × 10141.07 × 10156.08 × 10161.68 × 1032
0.69.08 × 10151.64 × 10142.05 × 10166.68 × 1030
0.79.93 × 10134.10 × 10131.34 × 10195.52 × 1036
0.82.03 × 10131.54 × 10137.54 × 10174.58 × 1047
0.99.54 × 10301.98 × 1075.18 × 105n.d
A that could not be evaluated are marked with n.d.
Table 4. Variation in thermodynamic parameters (calculated by the FWO method) with conversion α.
Conversion αPSPSKCl-21PSKCl-11PSKCl-12
ΔHΔGΔSΔHΔGΔSΔHΔGΔSΔHΔGΔS
0.1148.30183.91−5.65 × 10−2260.87424.8615.44 × 10−2307.42139.0726.11 × 10−2496.99145.3959.51 × 10−2
0.2161.12183.48−3.55 × 10−2211.40372.146.96 × 10−2296.56139.2424.33 × 10−2430.89146.0848.20 × 10−2
0.3182.18182.85−0.11 × 10−2204.03362.905.69 × 10−2277.05139.5721.15 × 10−2502.03145.3360.37 × 10−2
0.4179.53182.92−0.54 × 10−2198.84356.384.80 × 10−2230.21140.4813.48 × 10−2375.00146.7538.63 × 10−2
0.5189.82182.641.14 × 10−2188.68345.203.05 × 10−2210.36140.9210.22 × 10−2358.48146.9735.80 × 10−2
0.6211.14182.094.61 × 10−2179.54335.241.47 × 10−2204.98141.049.33 × 10−2342.76147.1833.10 × 10−2
0.7187.98182.680.84 × 10−2172.77327.790.31 × 10−2236.59140.3414.52 × 10−2408.70146.3344.40 × 10−2
0.8179.77182.91−0.50 × 10−2167.81322.41−0.55 × 10−2222.35140.6412.18 × 10−2530.62145.0665.25 × 10−2
0.9388.79178.9433.27 × 10−2101.88257.04−12.02 × 10−286.14145.16−10.48 × 10⁻²n.dn.dn.d
Herein, the units for ΔH, ΔG, and ΔS are all kJ/mol. Thermodynamic parameters that could not be evaluated are marked with n.d.
Disclaimer/Publisher’s Note: The statements, opinions and data contained in all publications are solely those of the individual author(s) and contributor(s) and not of MDPI and/or the editor(s). MDPI and/or the editor(s) disclaim responsibility for any injury to people or property resulting from any ideas, methods, instructions or products referred to in the content.

