
Cracking Behavior and Deflections in Recycled-Aggregate Beams Reinforced with Waste Fibers Subjected to Long-Term Constant Loading

Abstract
:1. Introduction
2. Review of the Literature
3. Materials and Methods
3.1. Testing Methods
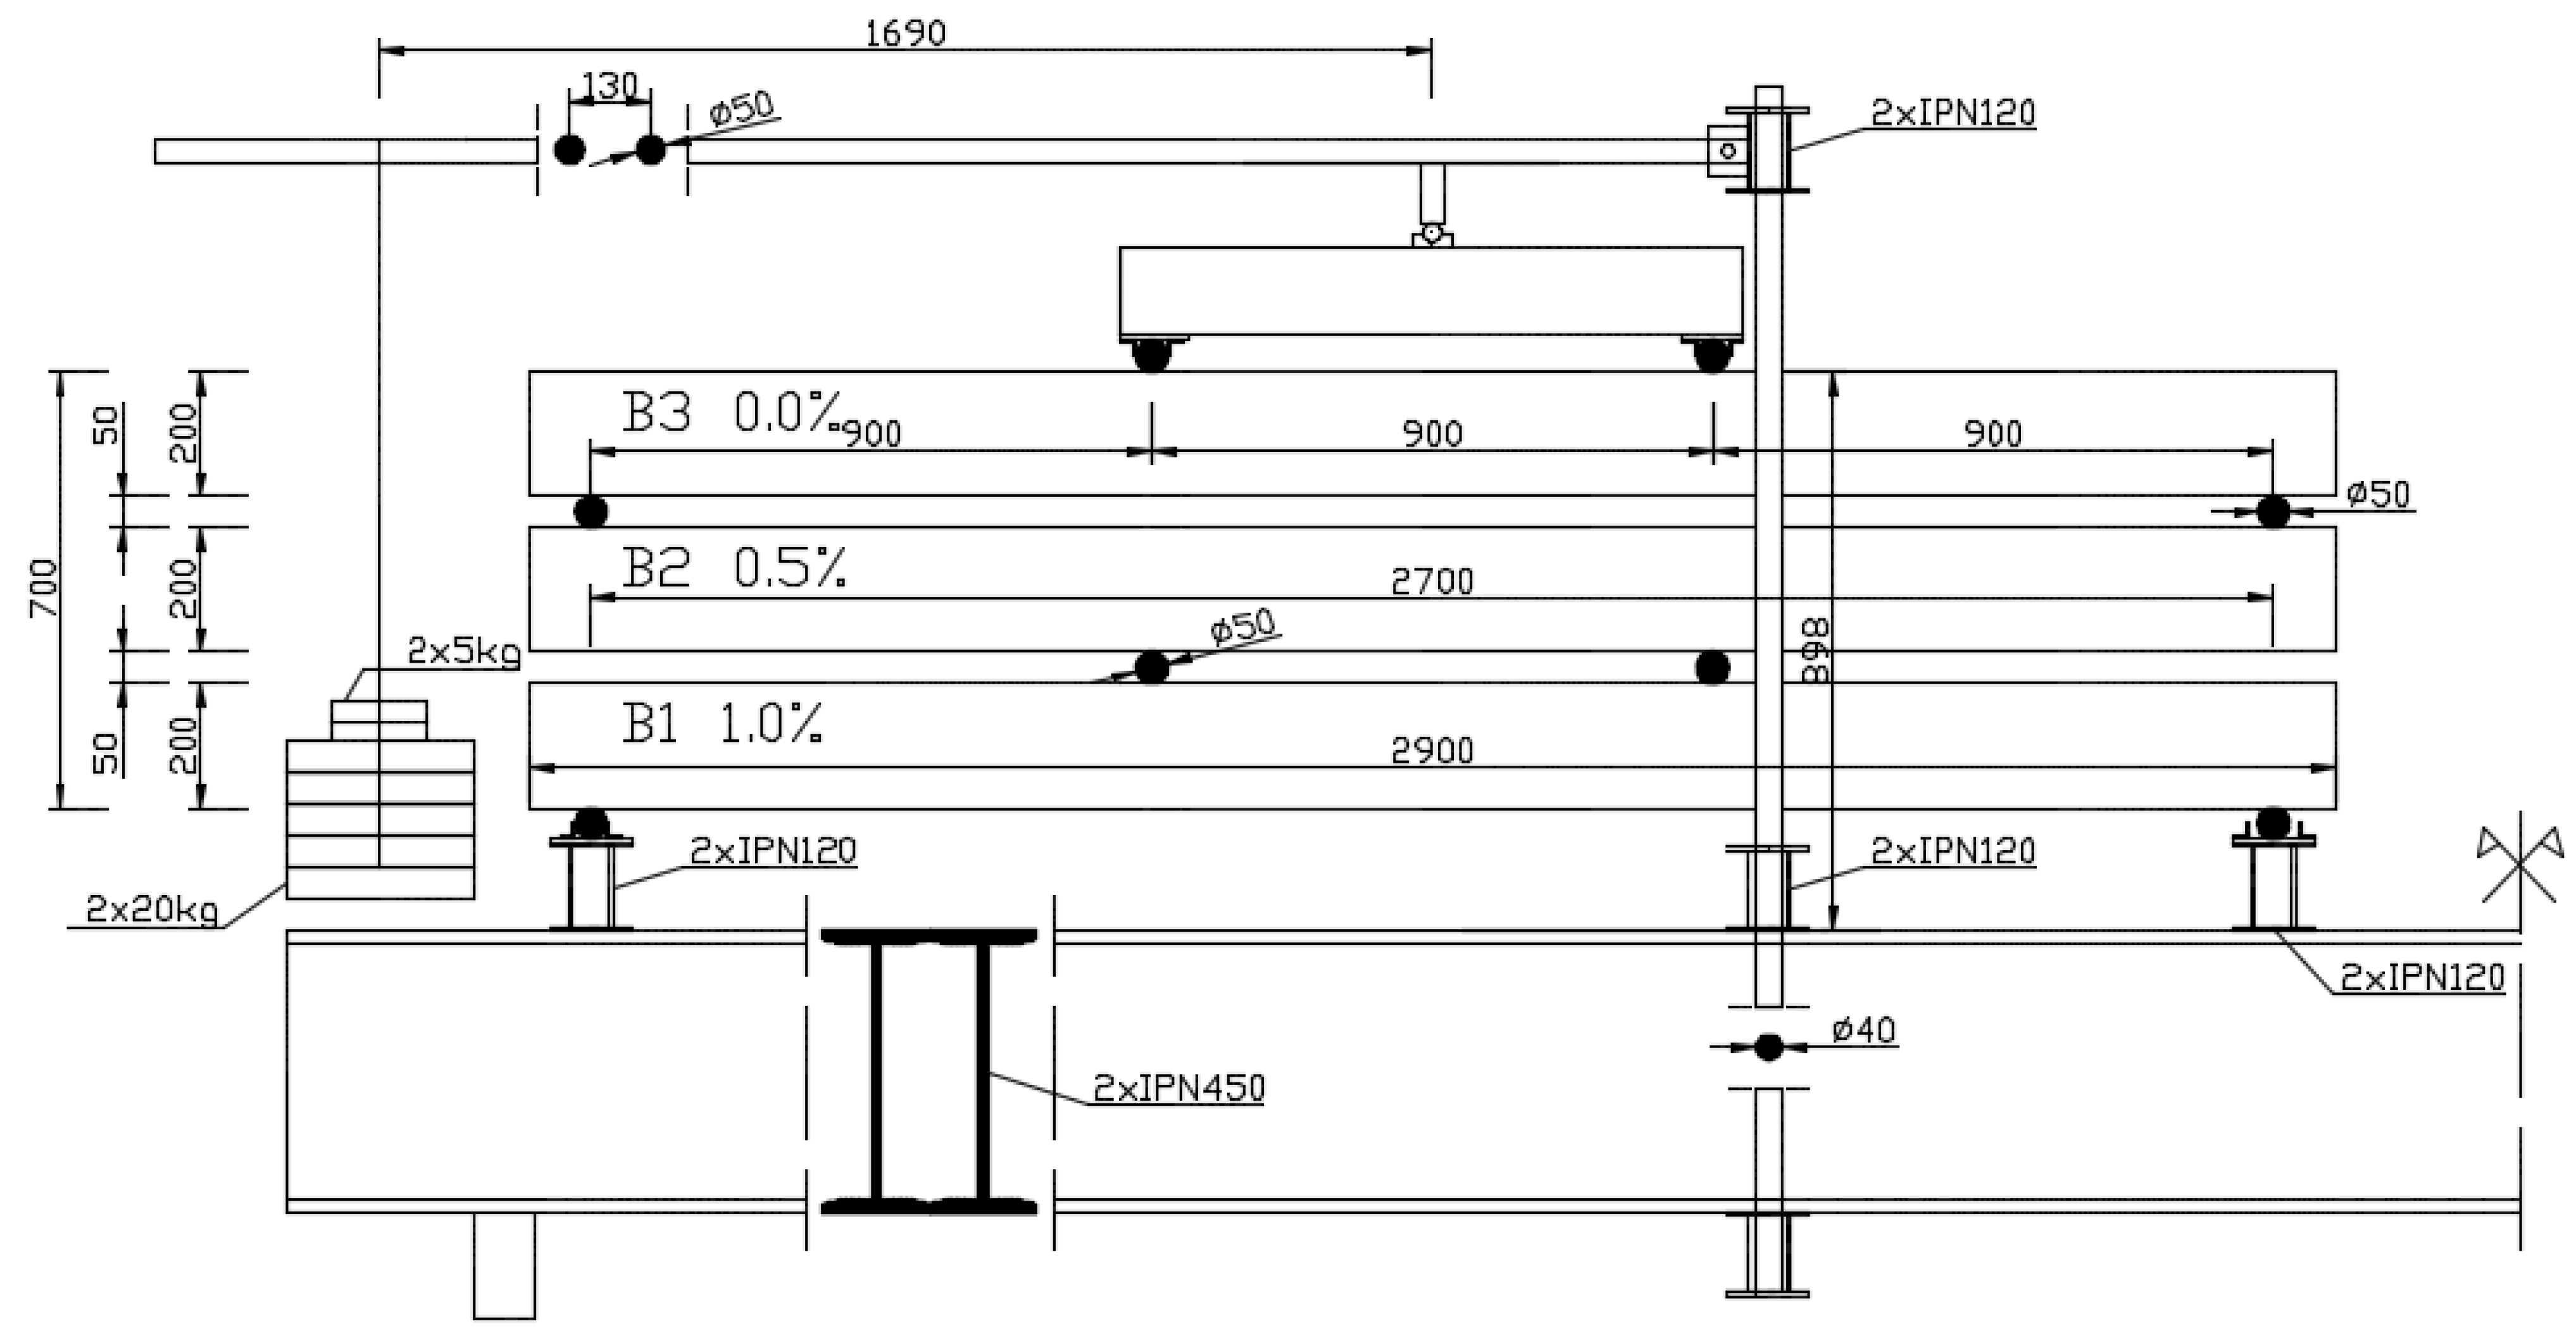
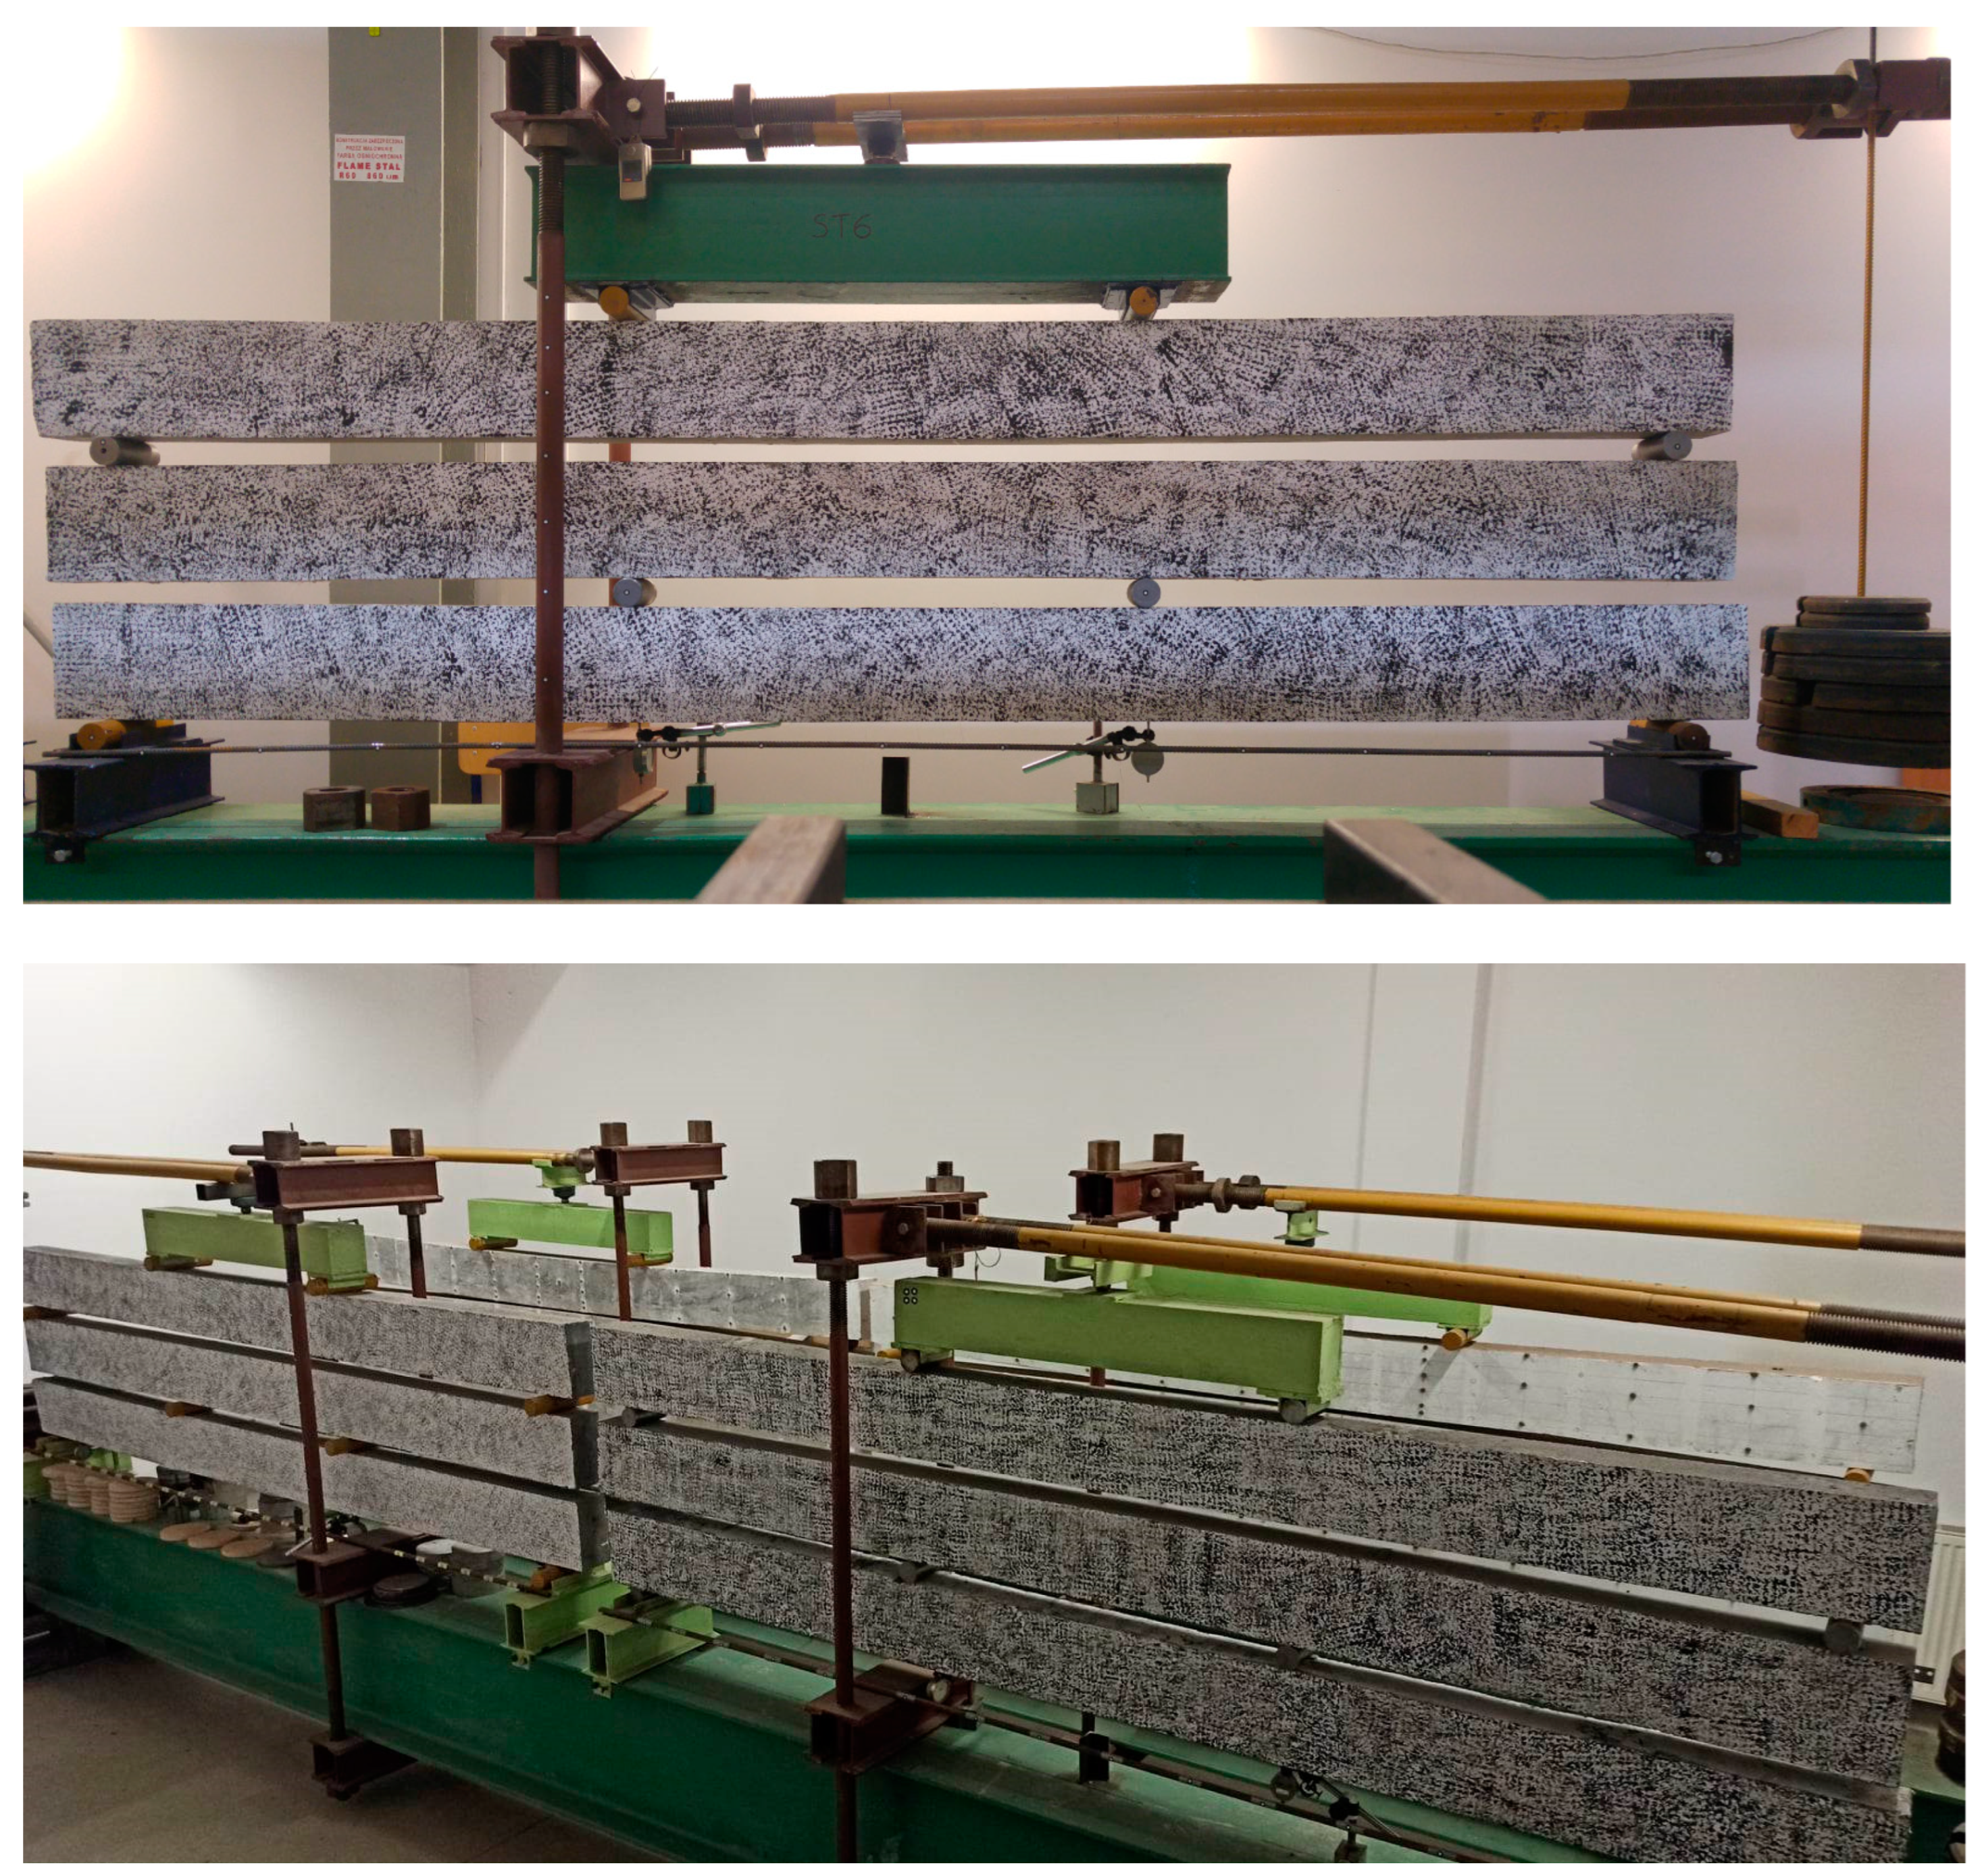
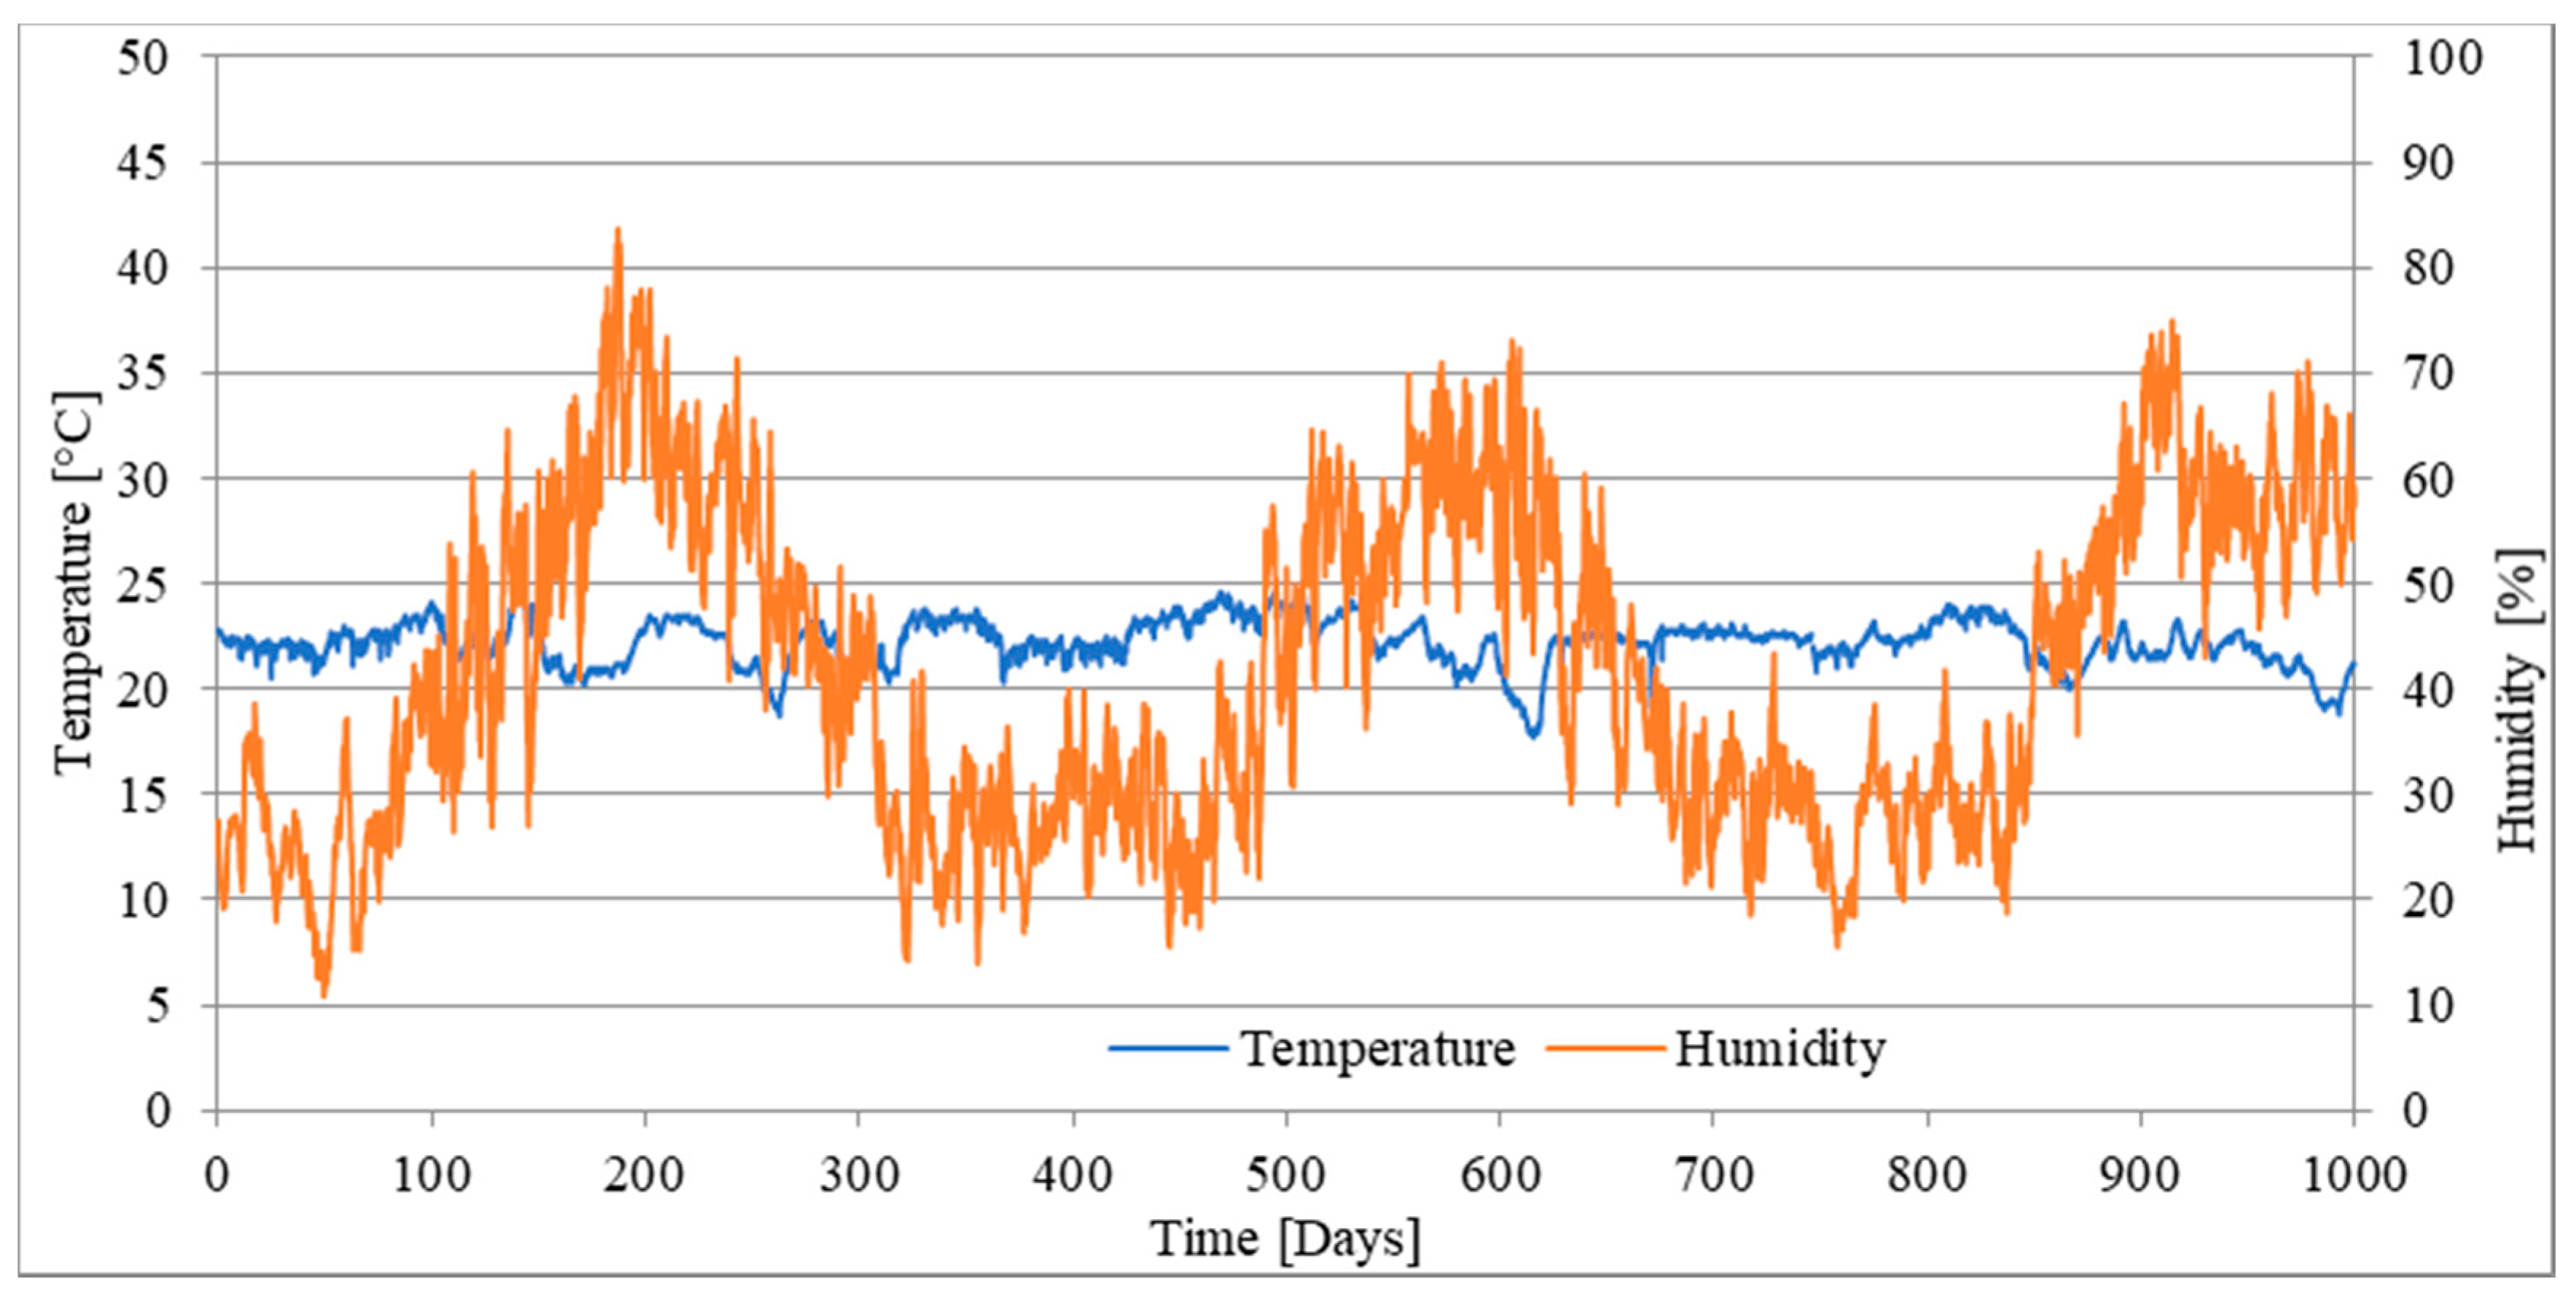
3.2. Long-Term Tests
4. Calculation Methods
5. Results
6. Discussion
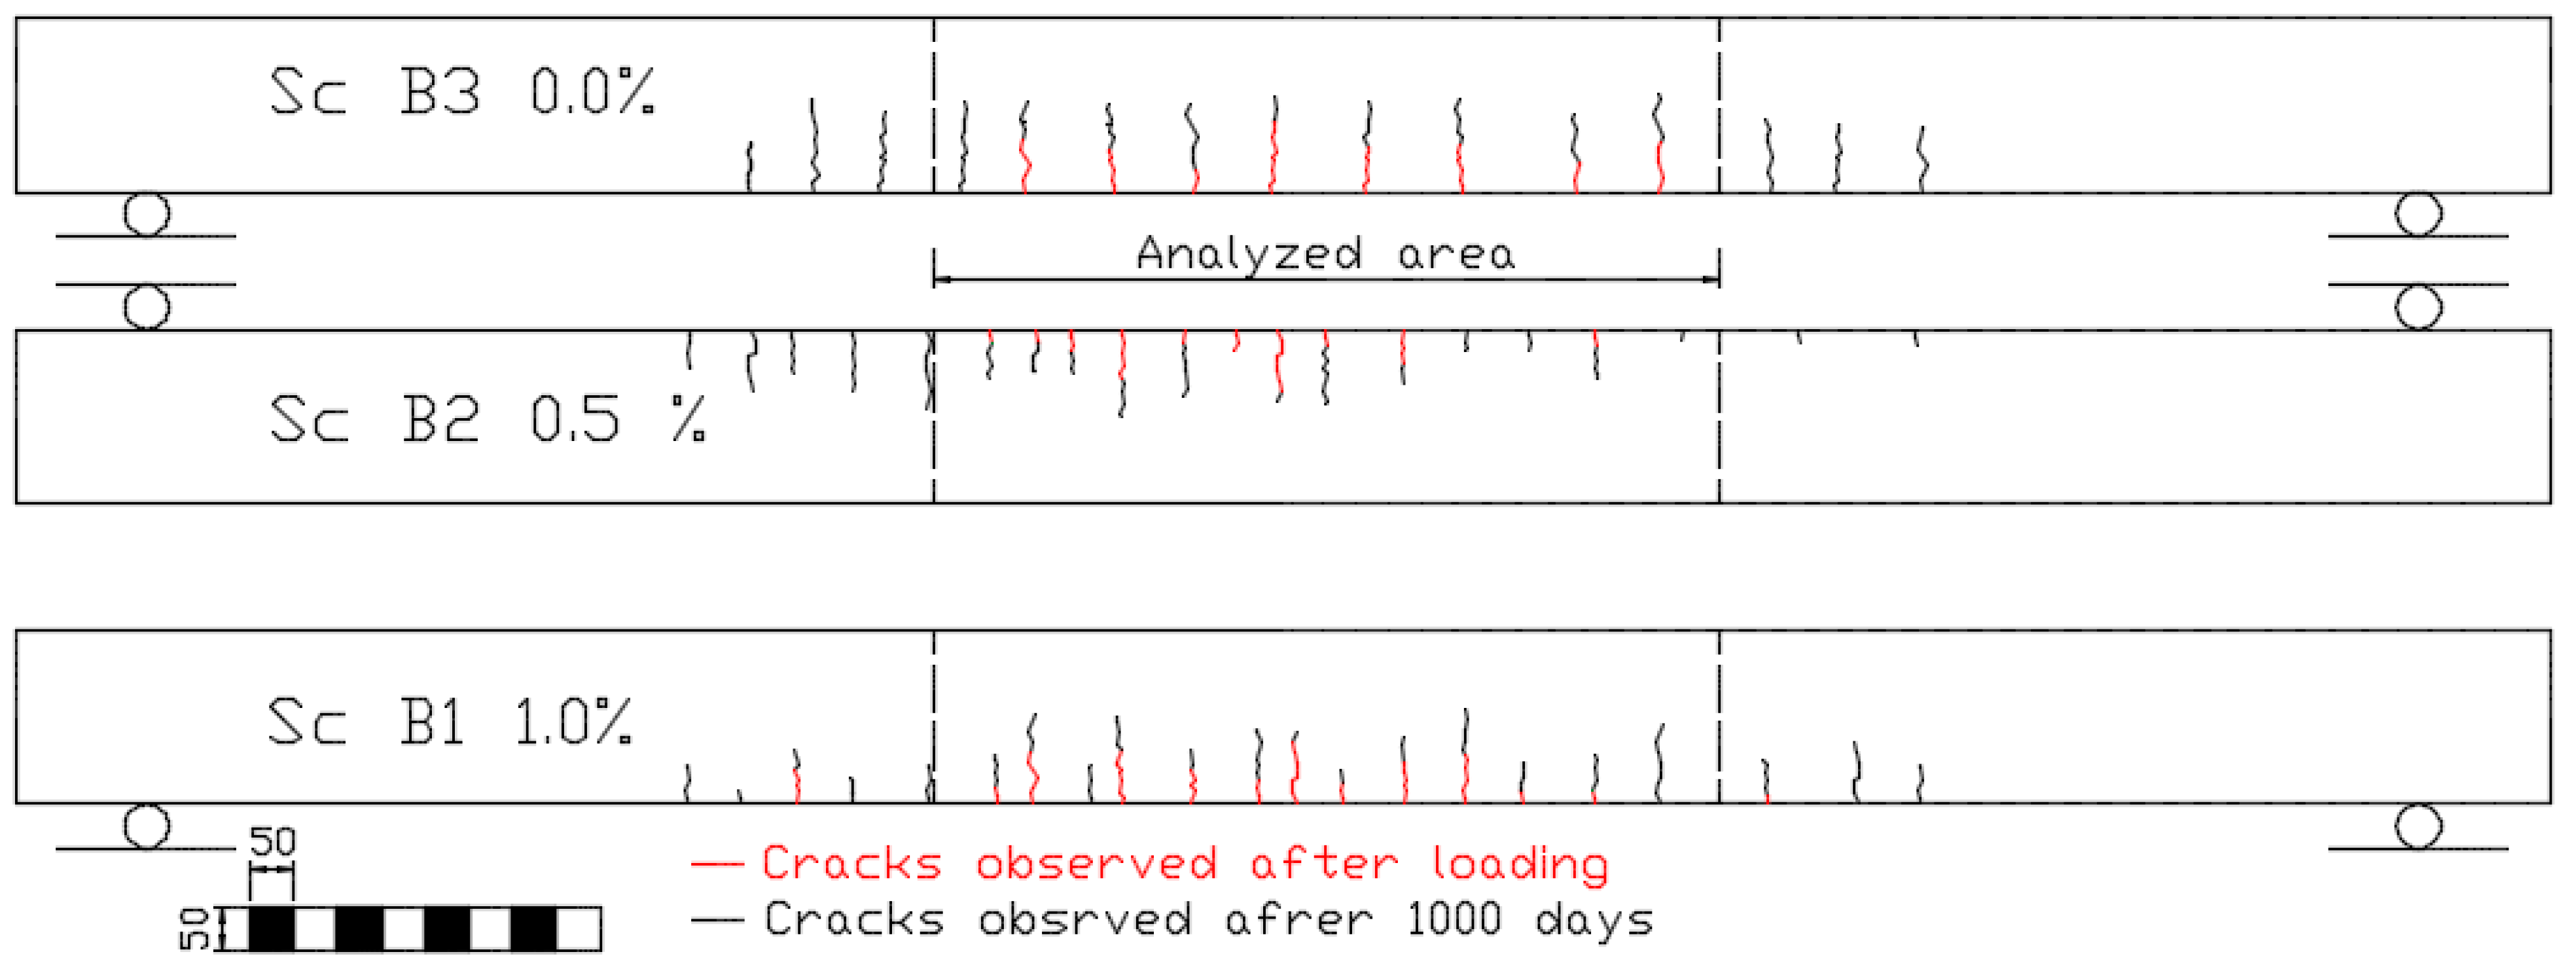
6.1. Cracks
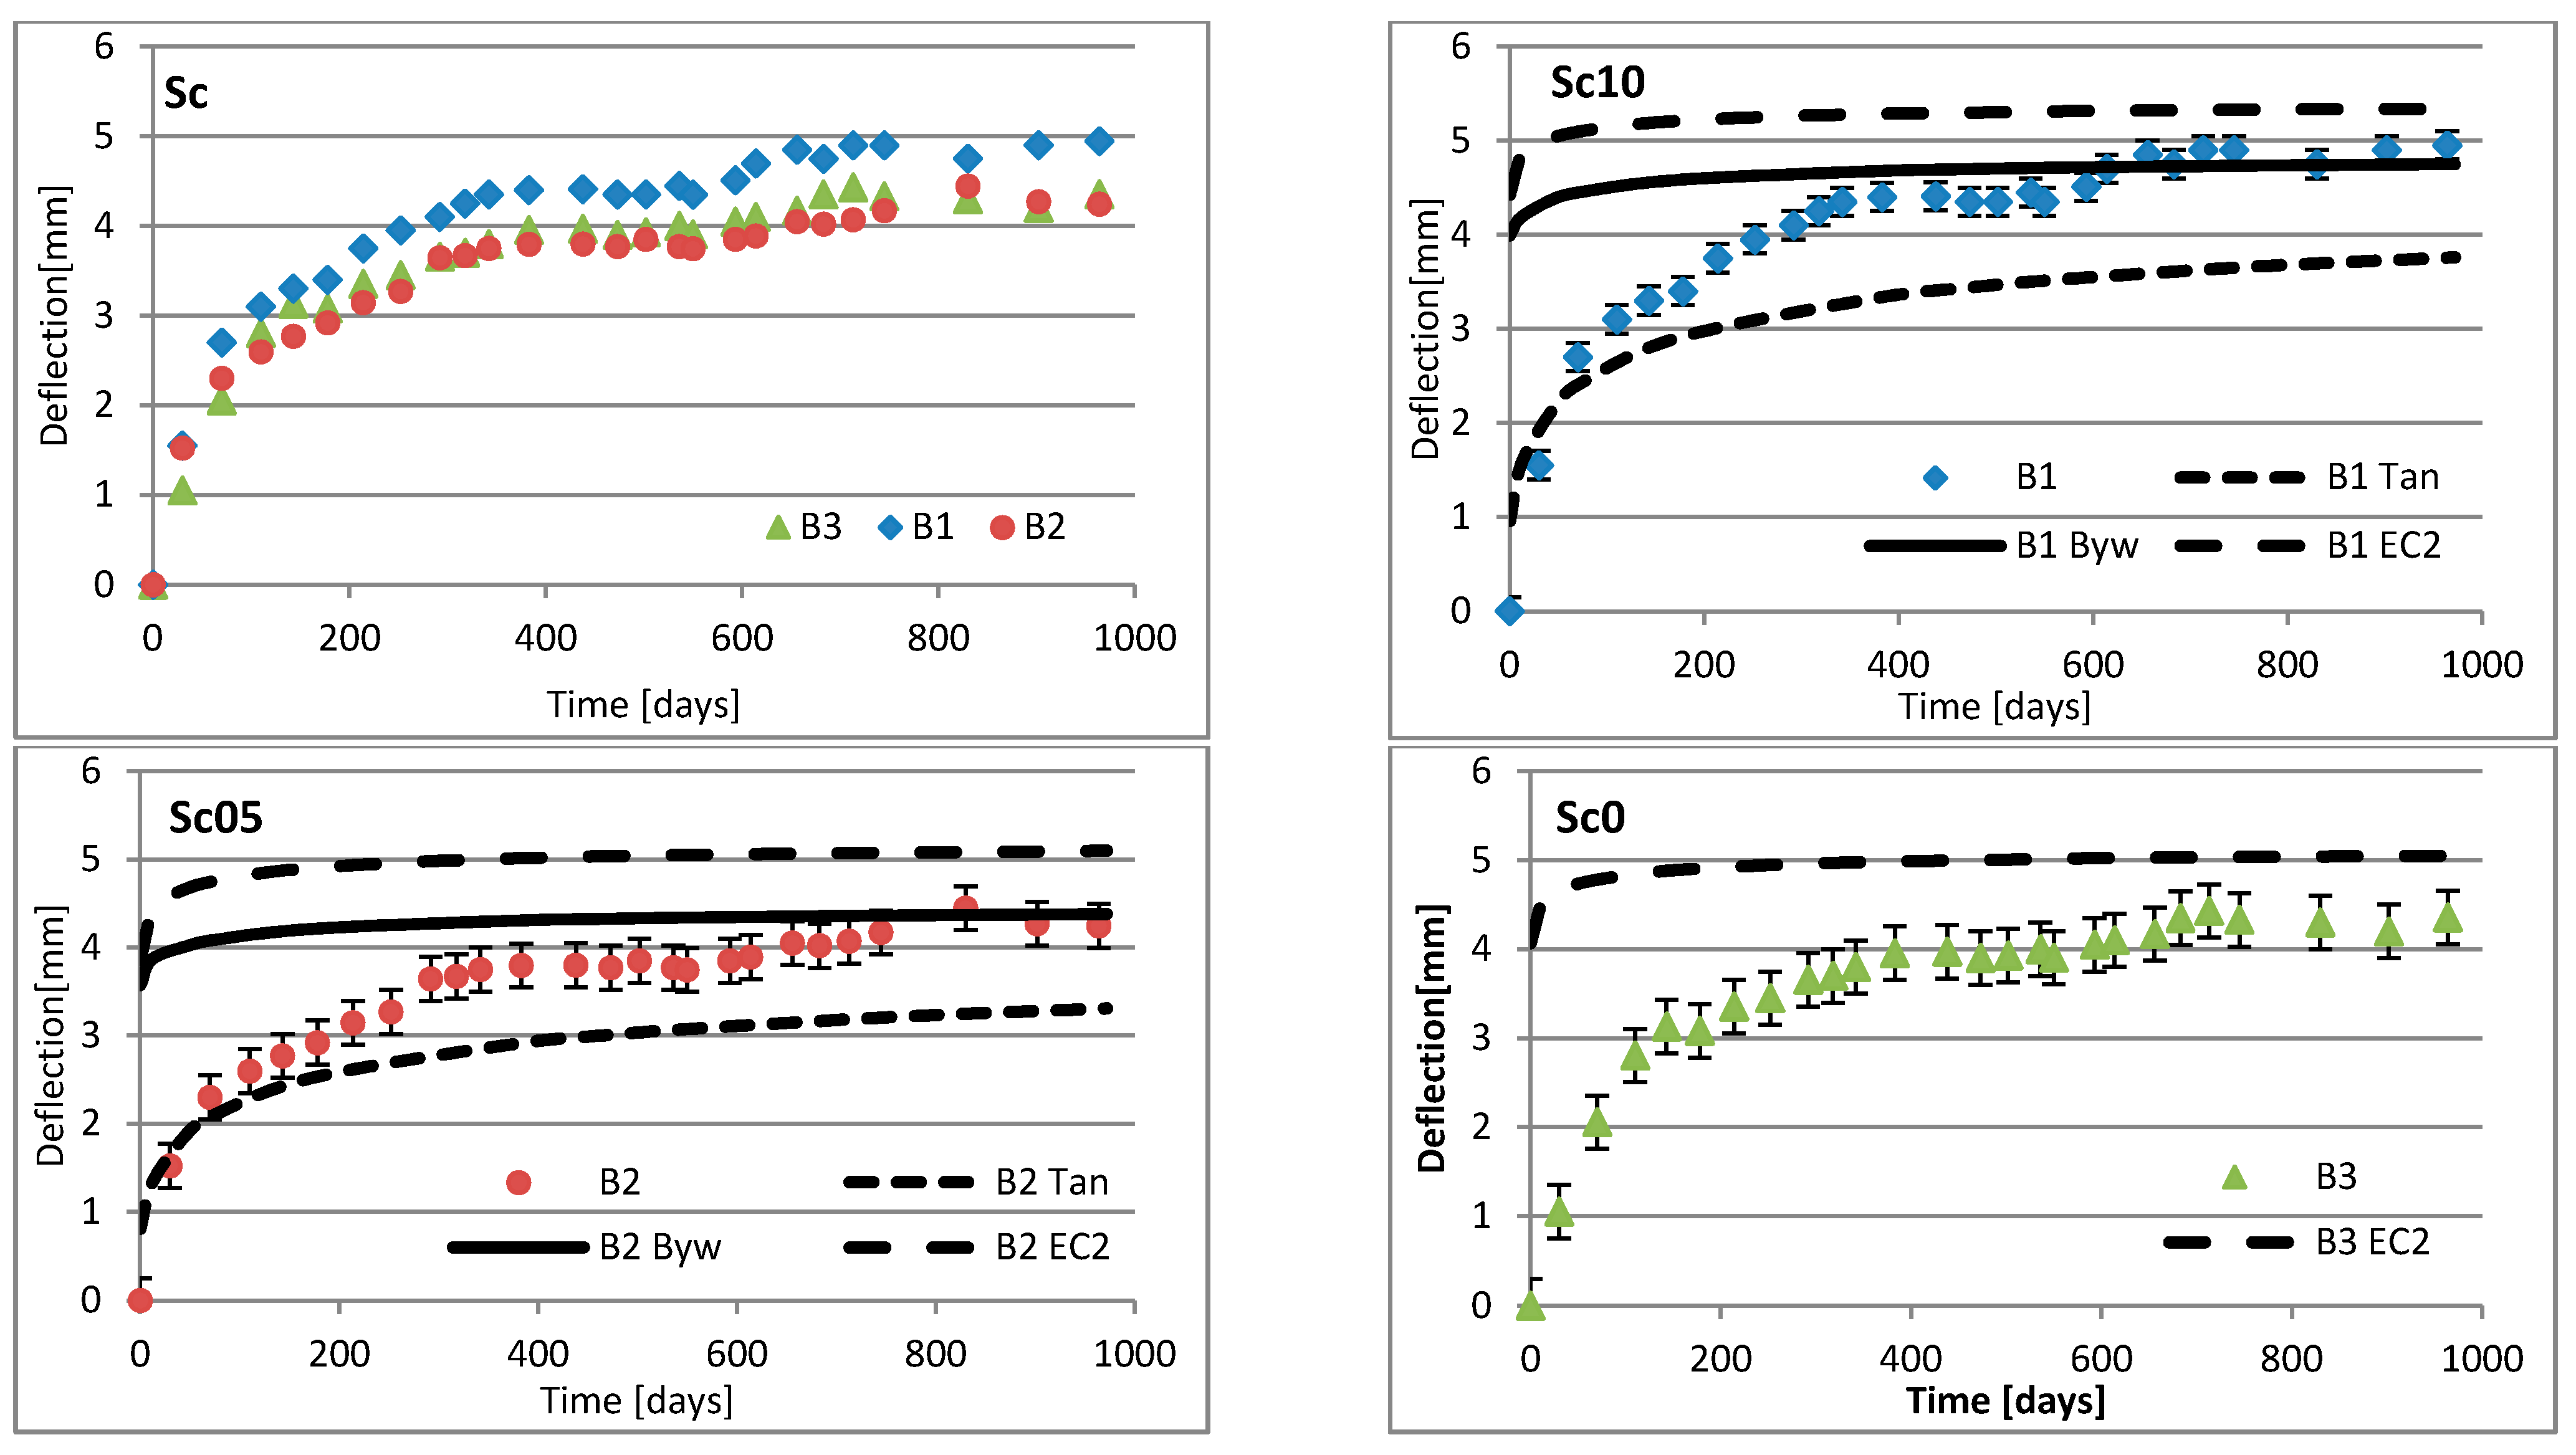
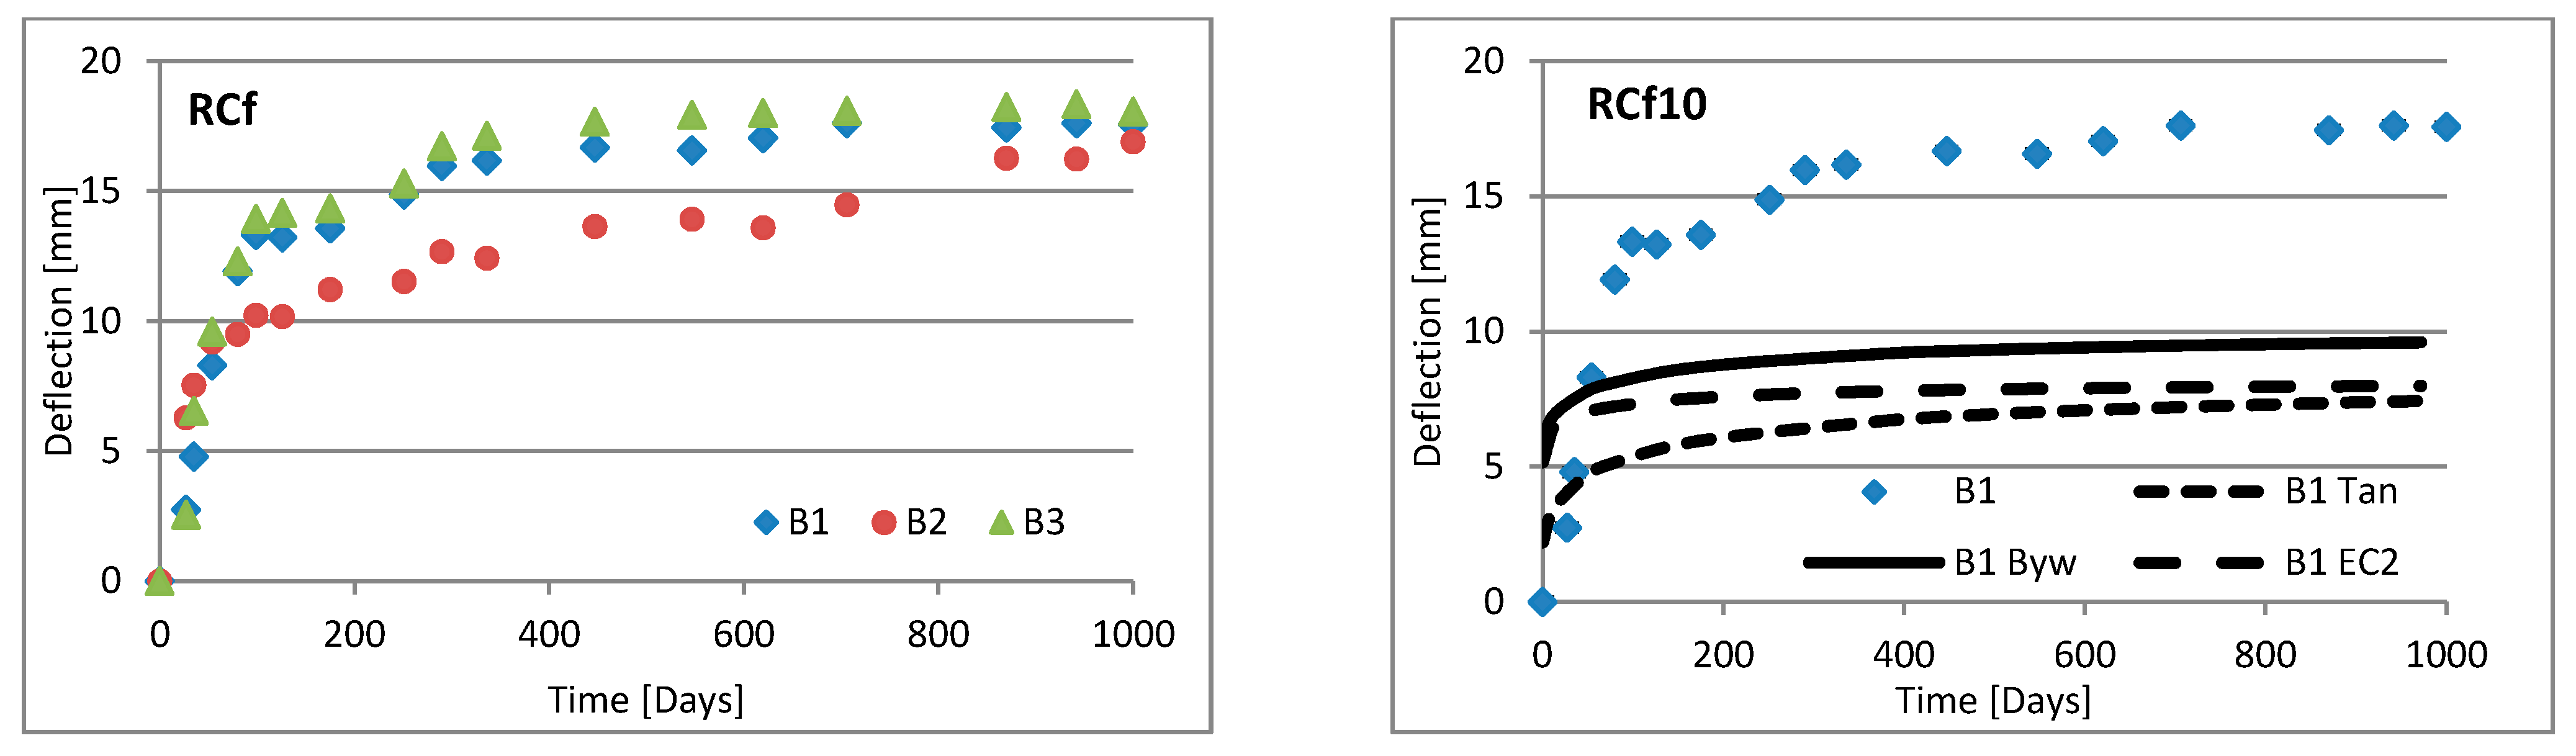
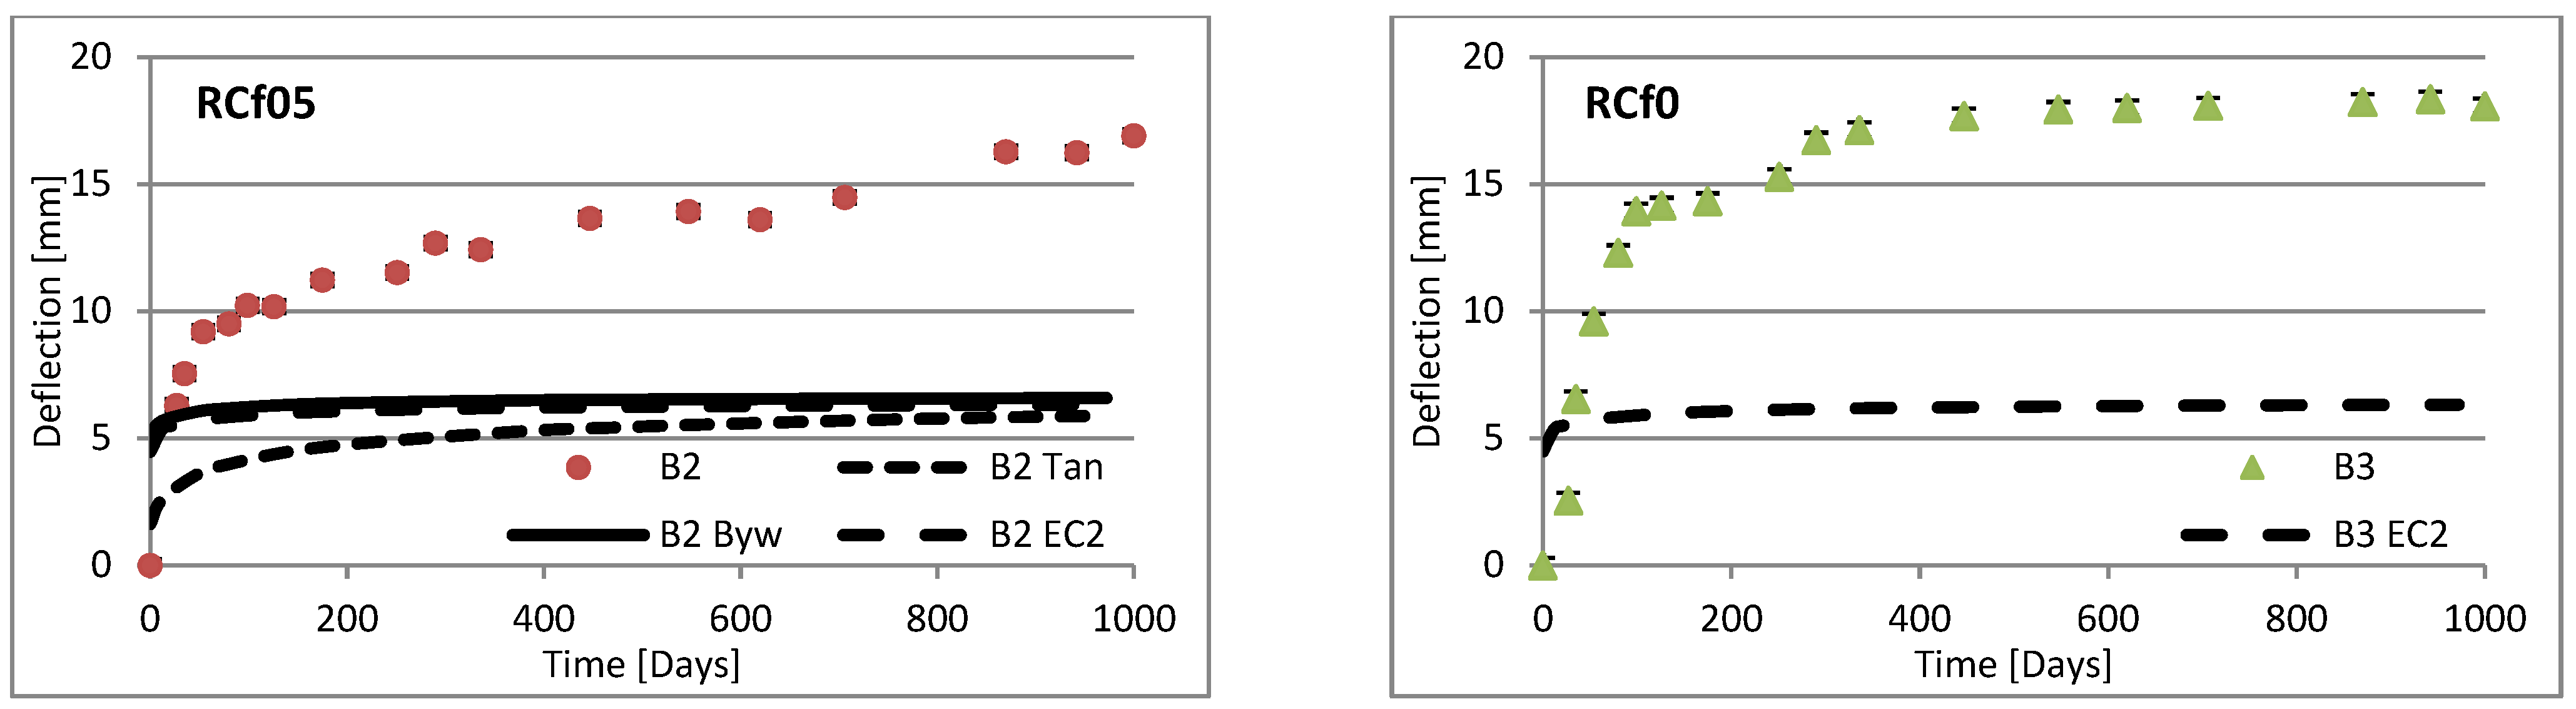
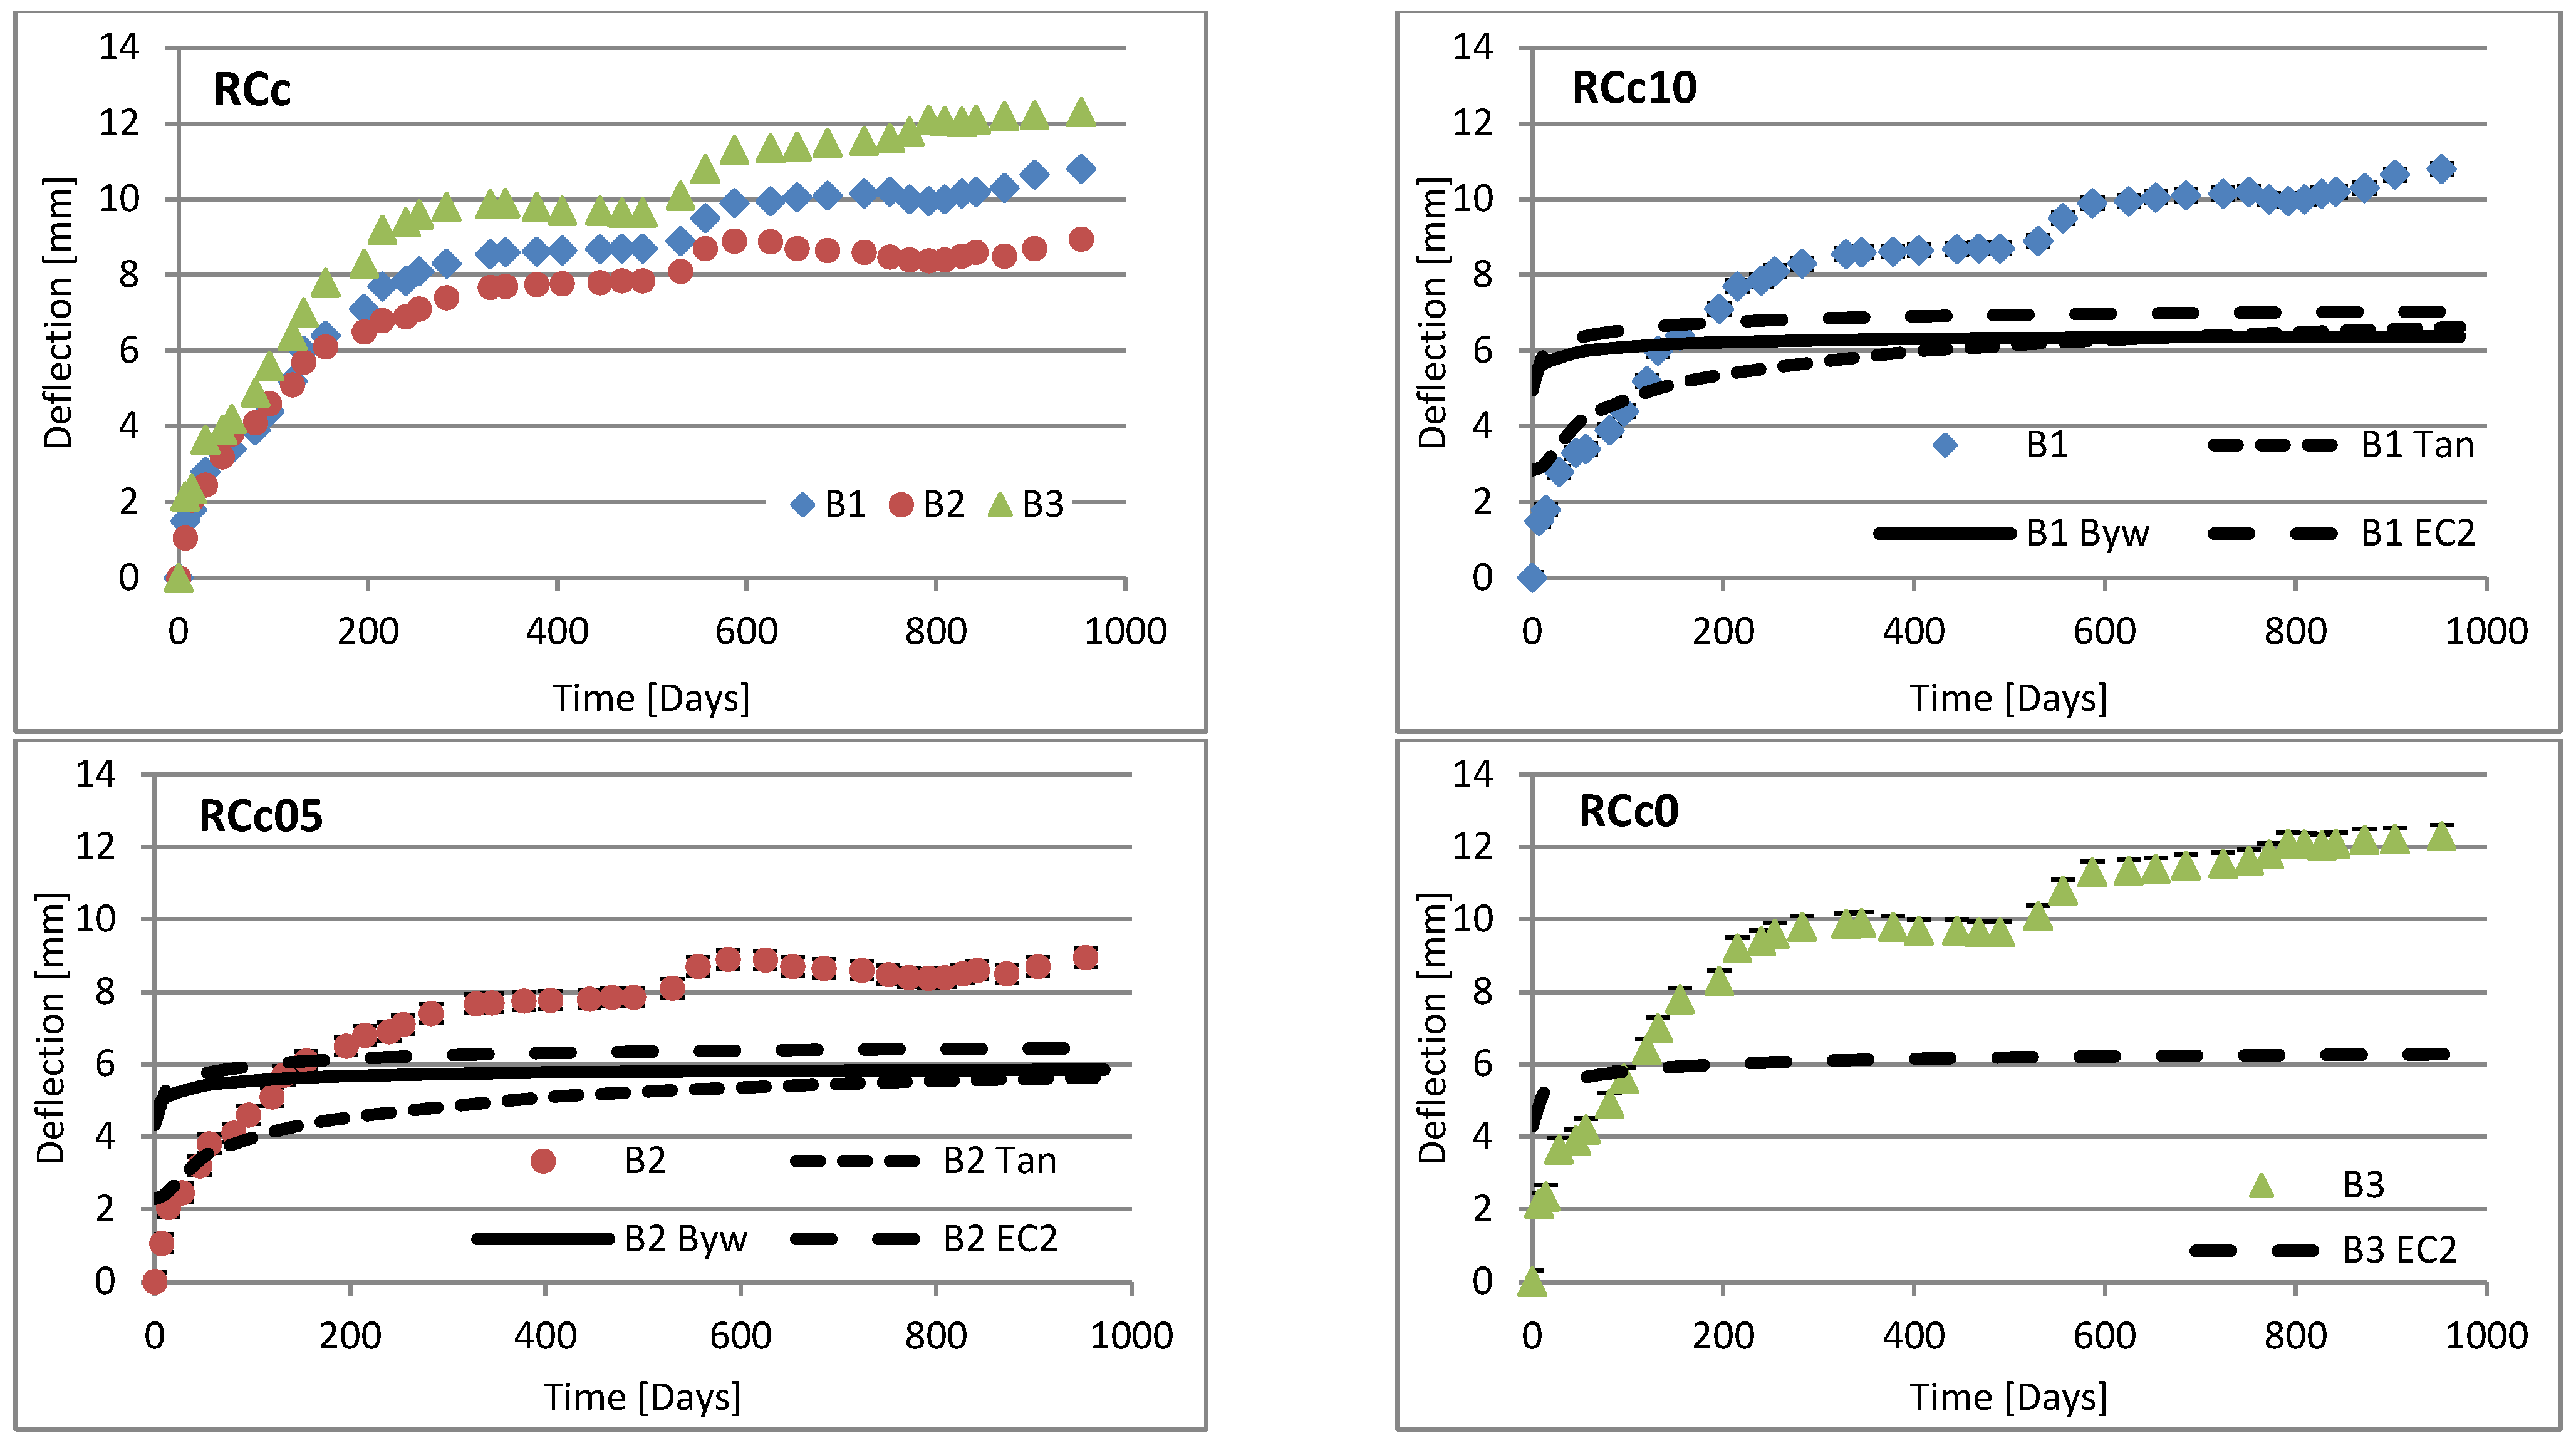
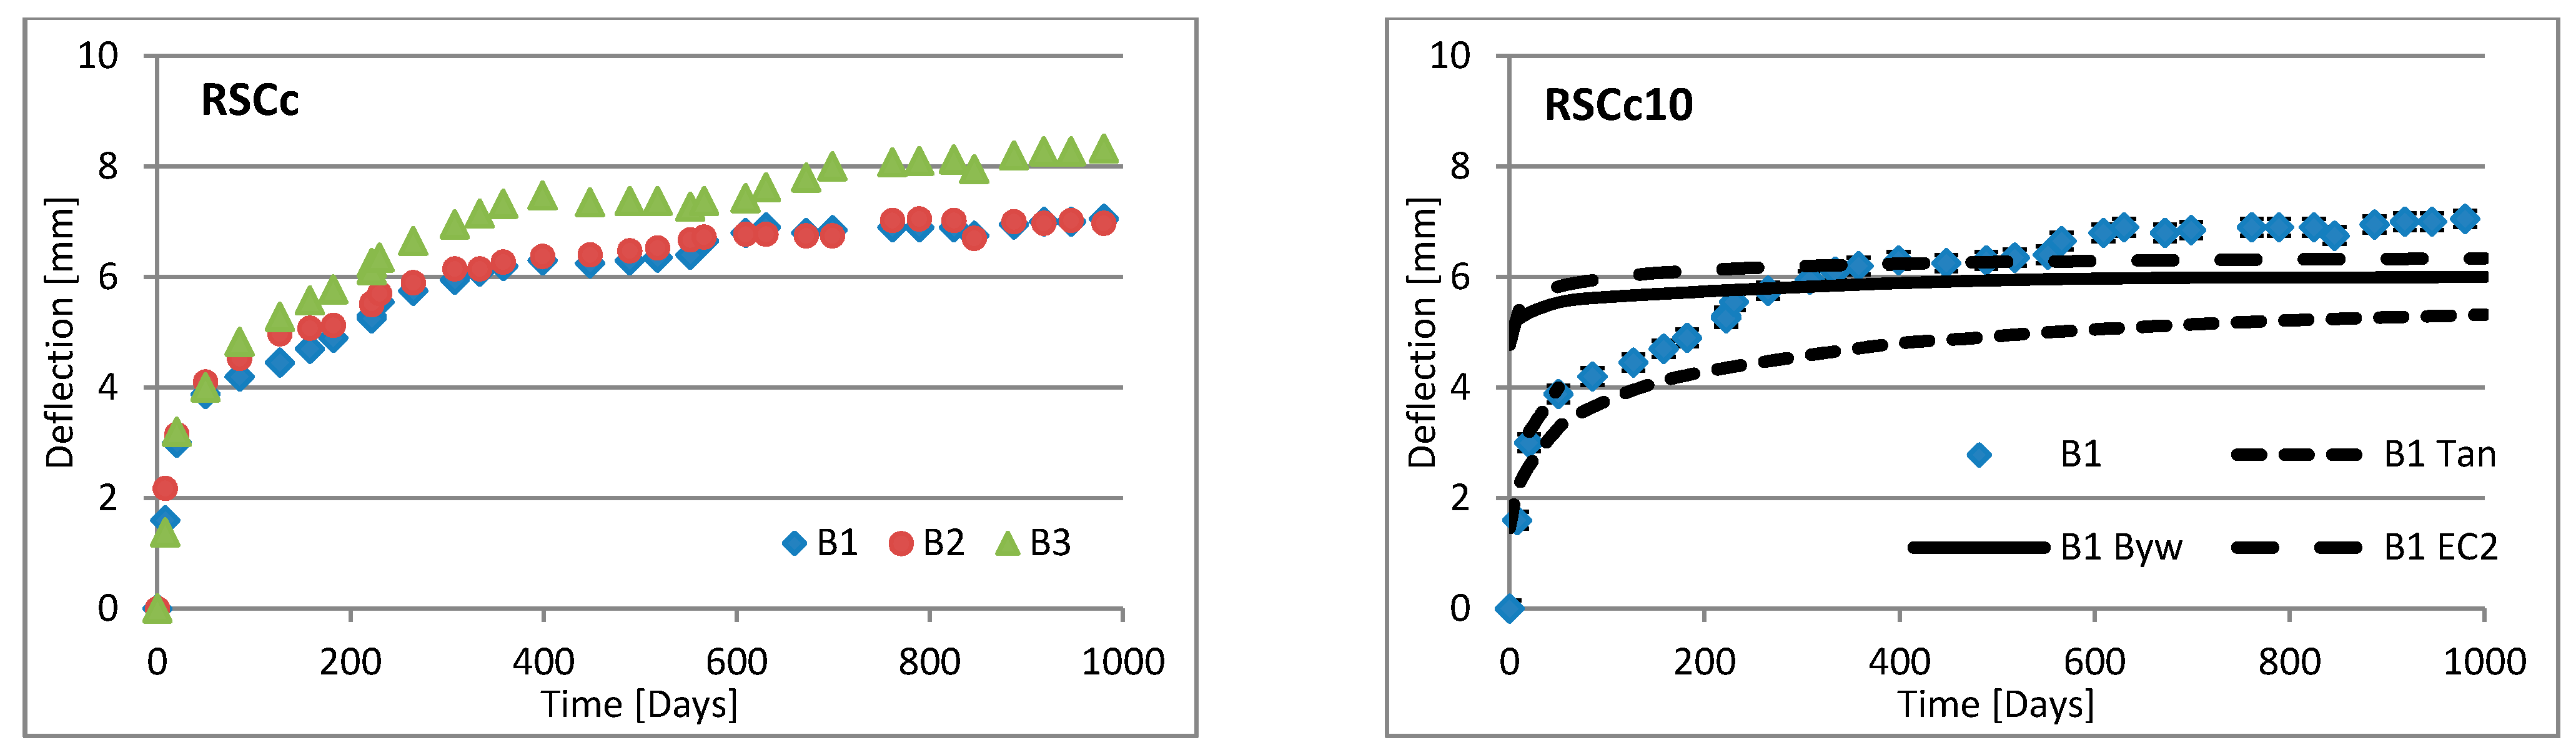
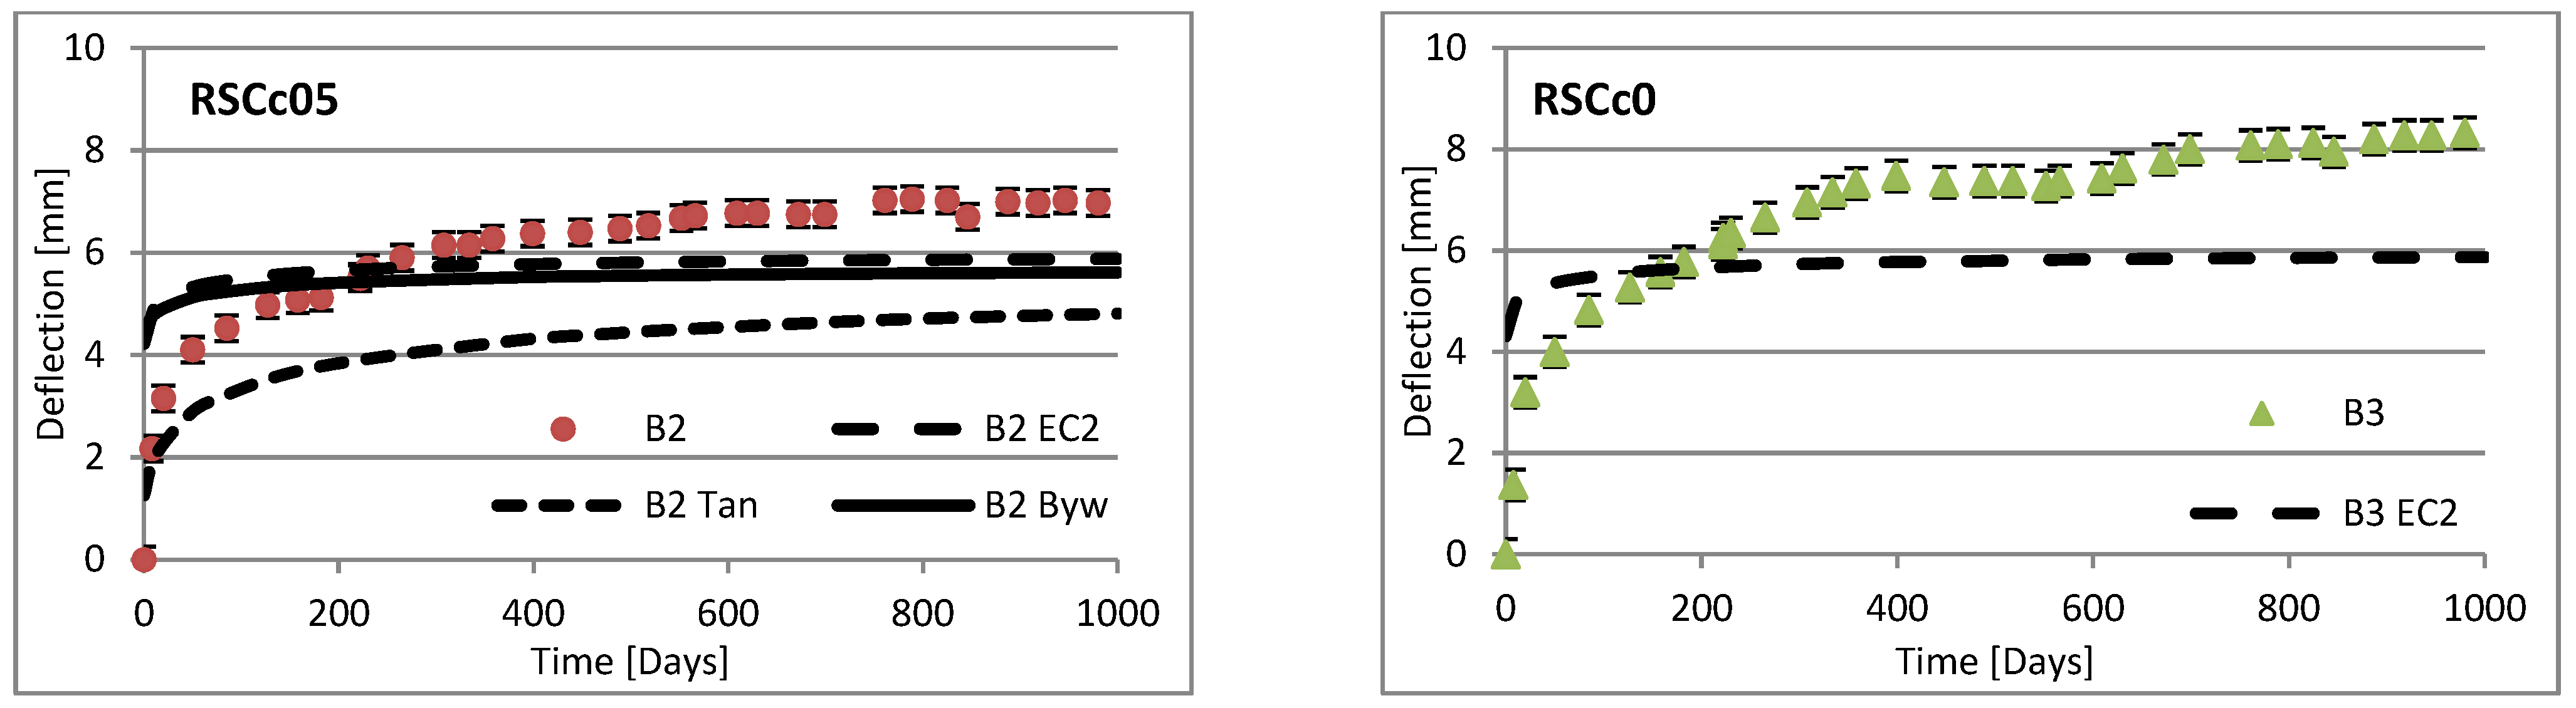
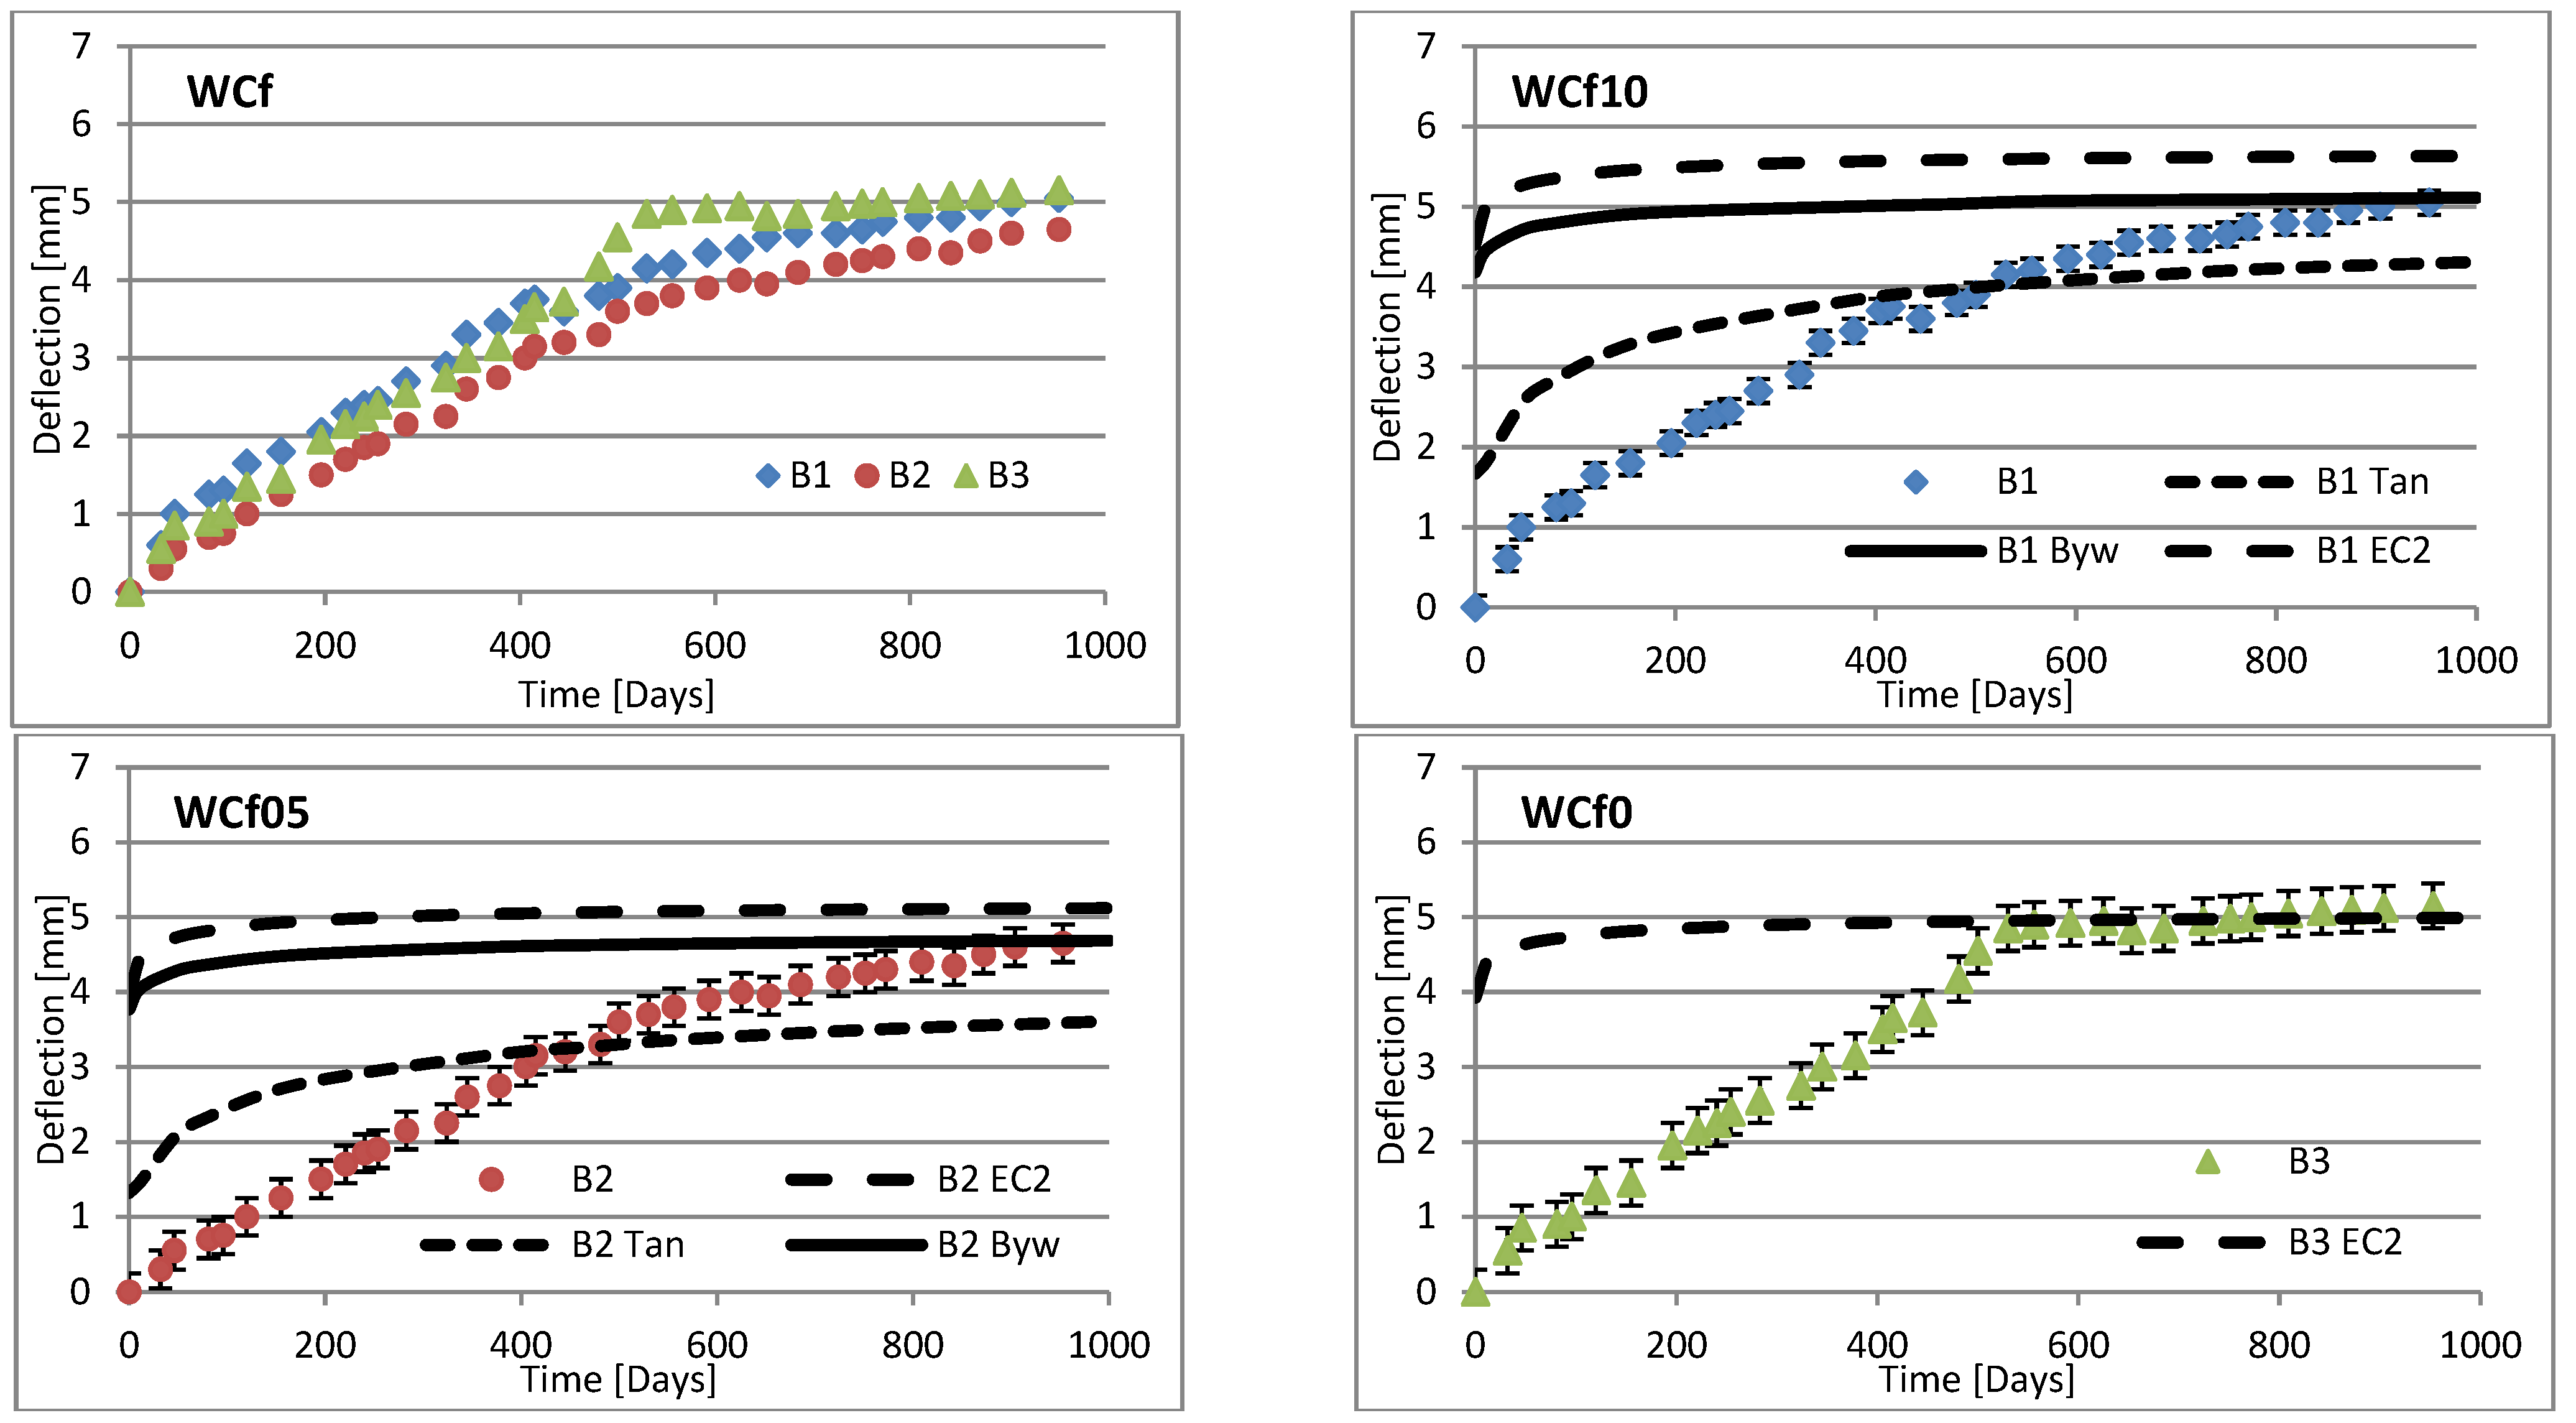
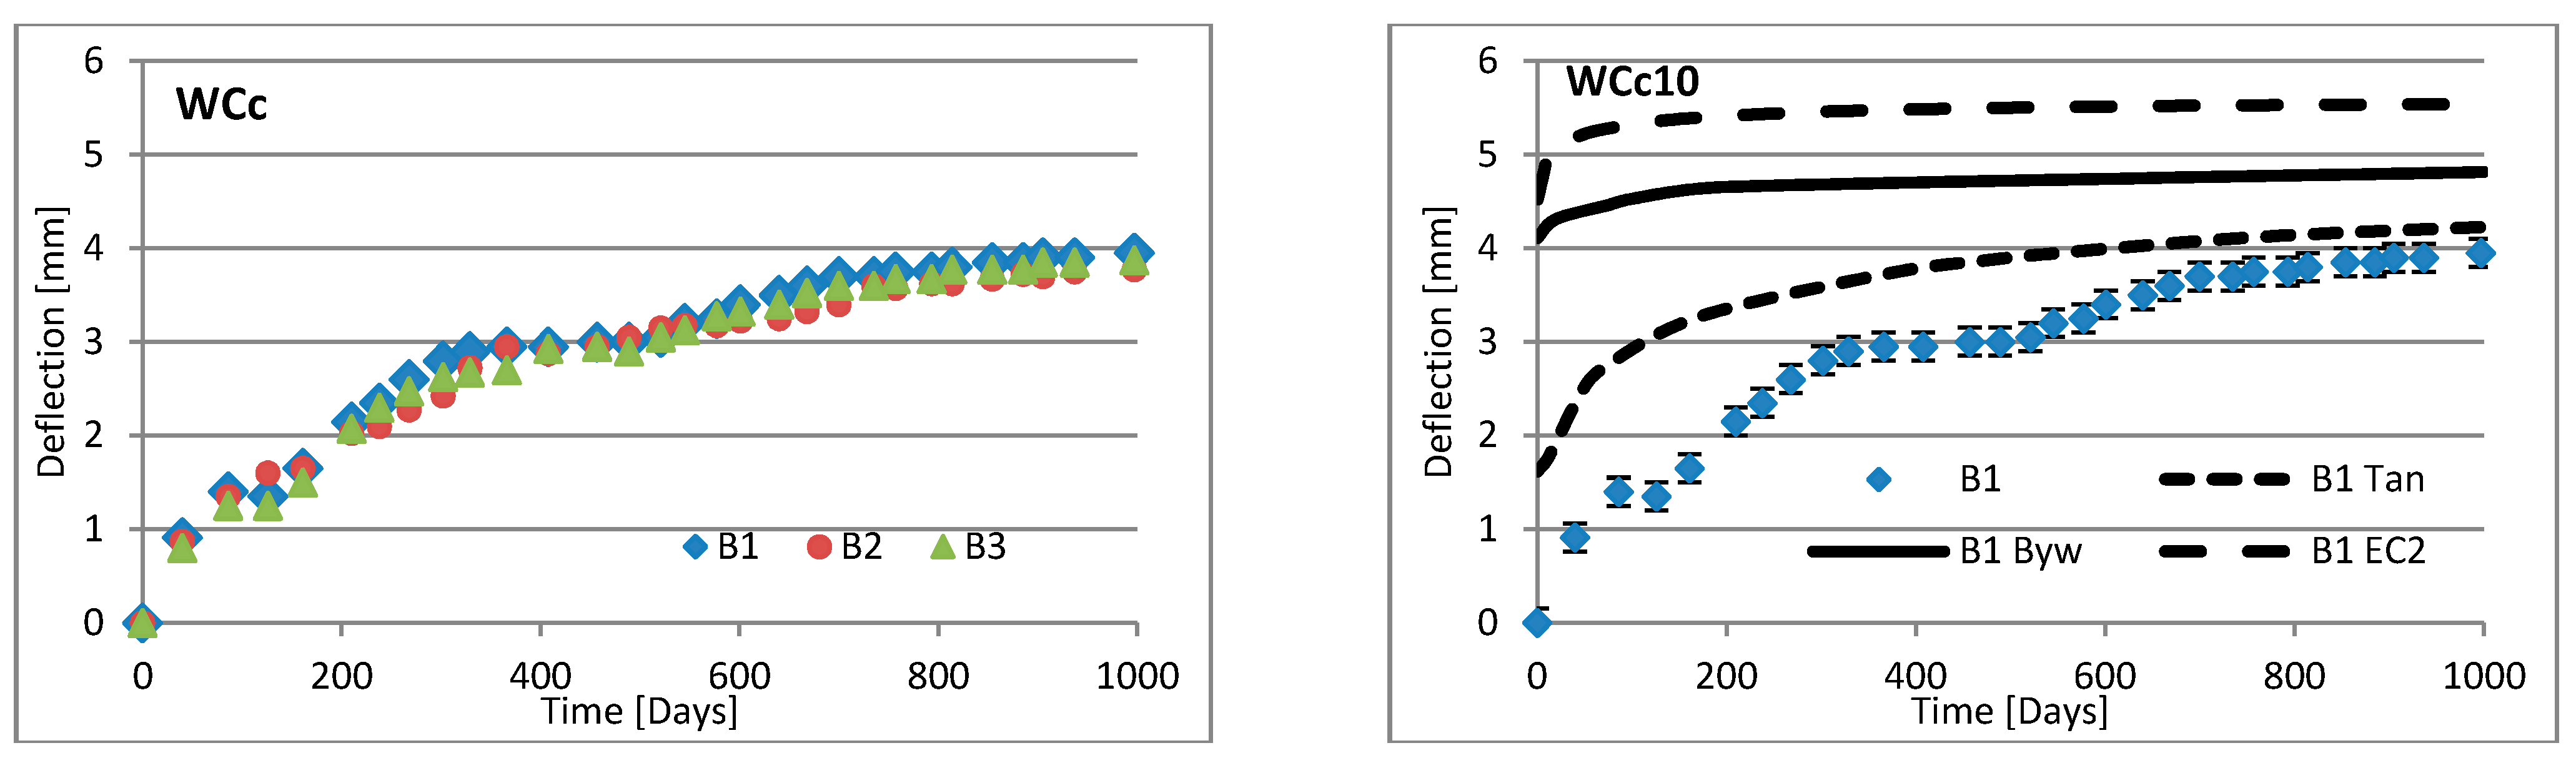
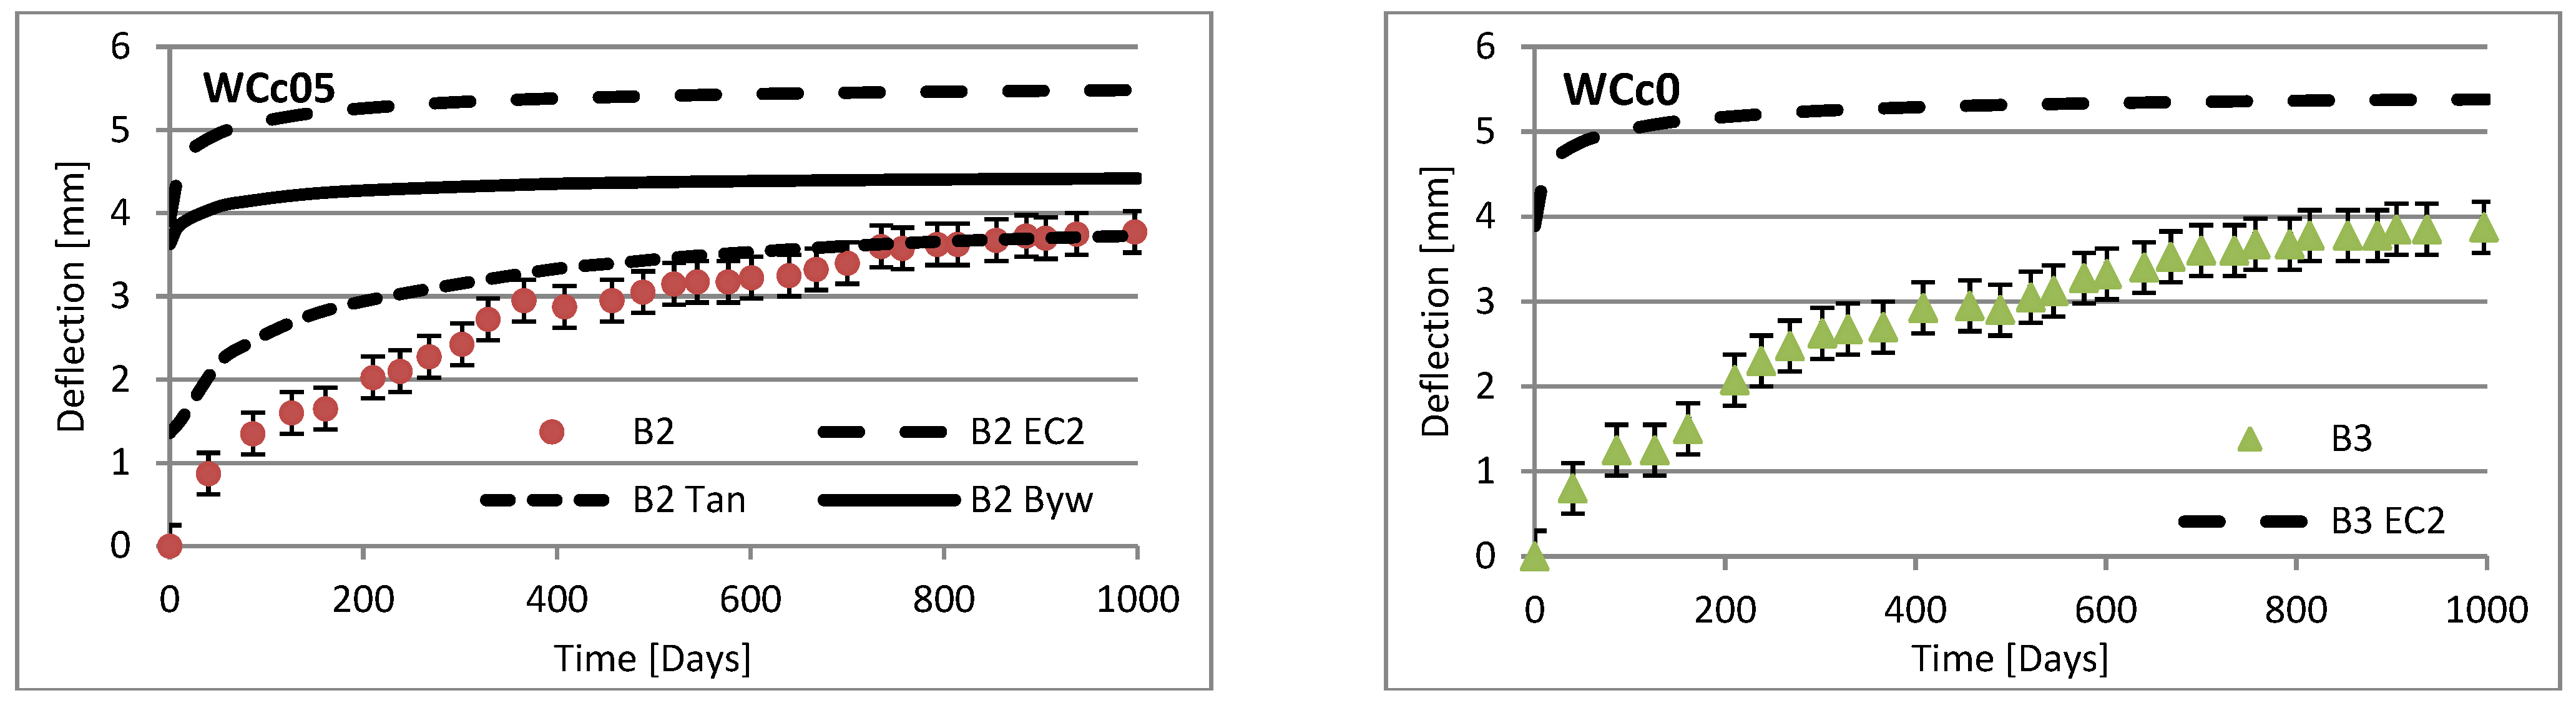
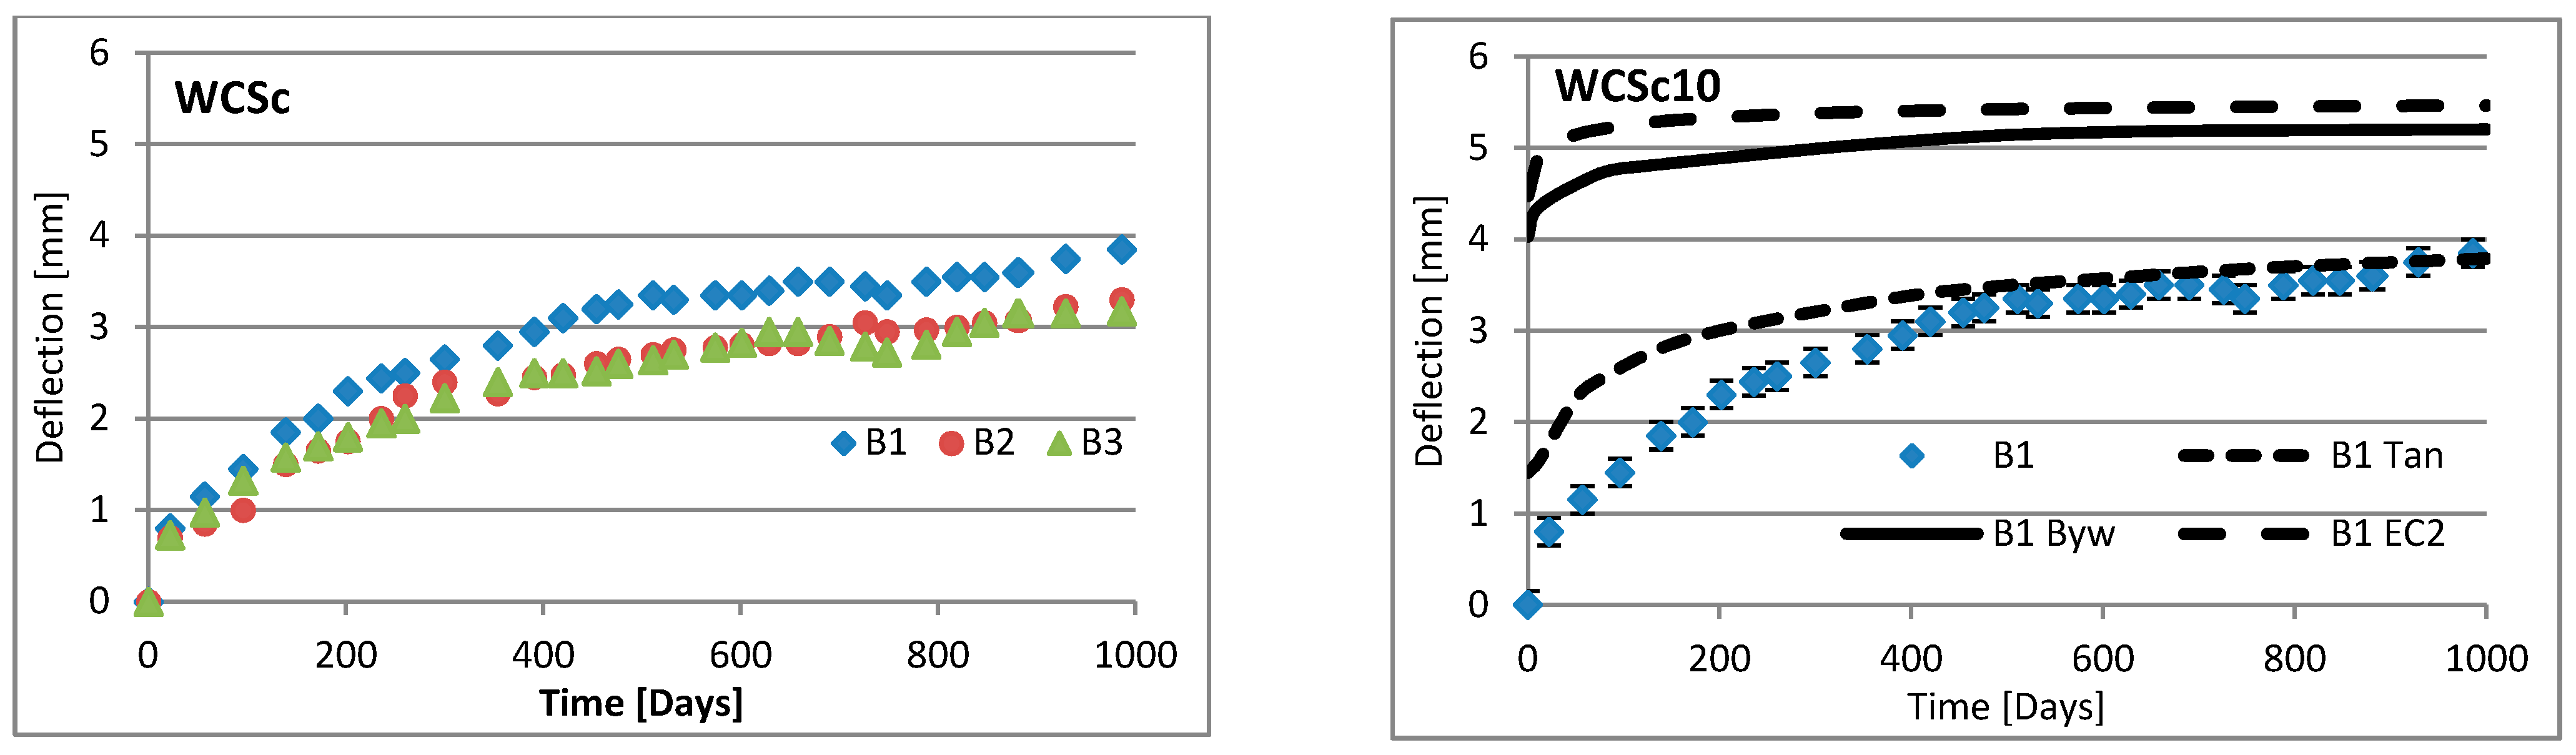
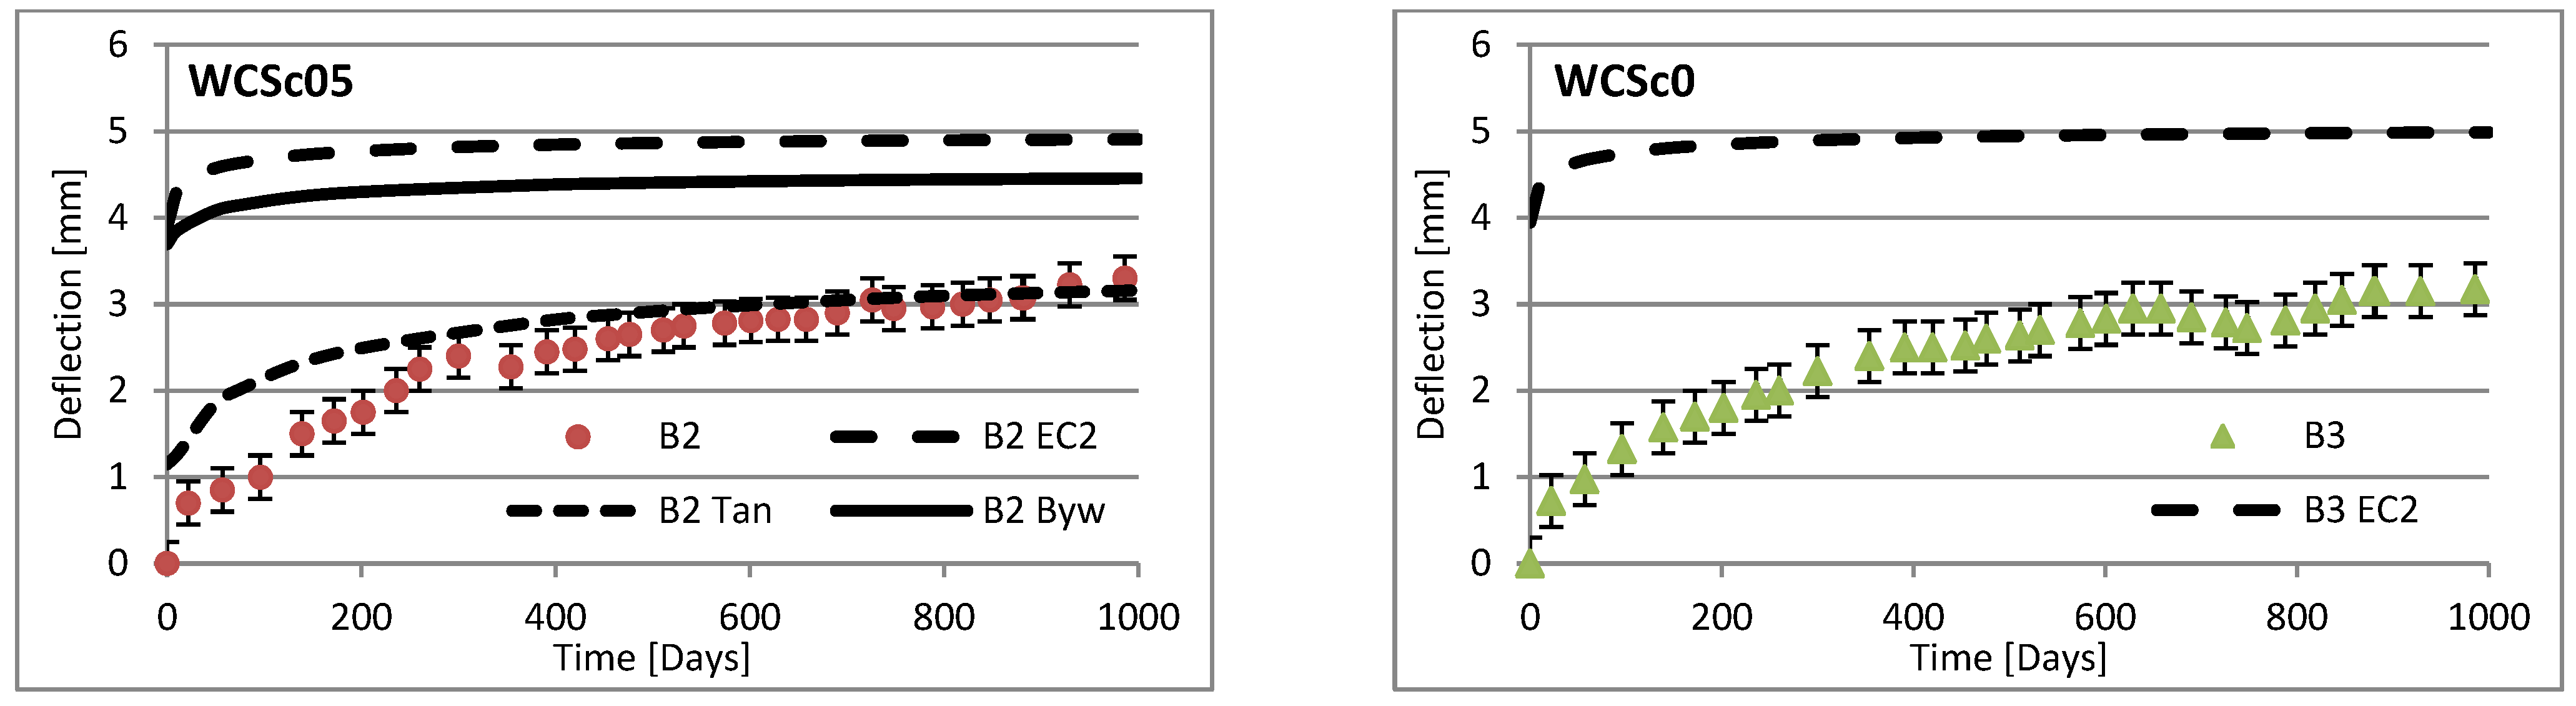
6.2. Deflection
6.3. Effect of Fibers on Long-Term Deflection
6.4. Calculating Methods
6.5. Parameters of Mixtures
7. Conclusions
- -
- Aggregates produced from white ceramic waste and from waste sand can both be used to produce concrete with properties corresponding to ordinary concrete.
- -
- The addition of steel cord to the concrete improved its compressive strength. However, the influence of steel cord on the modulus of elasticity must be determined using a higher number of specimens.
- -
- For mixtures with aggregates based on waste sand and red ceramic waste (Sc, RC, RSC), crack width can be calculated using the method contained in the PN-B standard; however, the values so obtained were slightly underestimated in most cases. Considering the safety of construction projects, this calculation method should be used, with appropriate factors.
- -
- For mixtures with aggregate based on white ceramic waste (WC, WSC), crack width can be calculated using the EC2 method, which predicts actual values very well. The method from the PN-B standard also gives satisfactory results; in addition, it allows a certain safety margin for constructors.
- -
- Calculation of average crack spacing is best carried out using the method presented by Vandewalle, which produces figures most similar to actual values. However, these values were still overestimated. In the case of crack spacing, this means that this method should not be favored without appropriate corrections, because of structural-safety considerations.
- -
- For mixtures with aggregate from red ceramic waste, the prediction of deflection requires appropriate corrections to all calculation methods because the values obtained by calculation are definitely lower than actual figures.
- -
- The deflection of the beams with porcelain waste (WC, WSC) is best represented by the method presented by Tan. Using this method, calculated deflection values after 1000 days are very close to or slightly lower than the test results. With a slight modification of the method, it could be used to design optimized structures.
Author Contributions
Funding
Institutional Review Board Statement
Informed Consent Statement
Data Availability Statement
Conflicts of Interest
References
- Dobiszewska, M.; Schindler, A.K.; Pichór, W. Mechanical properties and interfacial transition zone microstructure of concrete with waste basalt powder addition. Constr. Build. Mater. 2018, 177, 222–229. [Google Scholar] [CrossRef]
- Kumar, R.; Srivastava, A.; Lakhani, R. Industrial Wastes-Cum-Strength Enhancing Additives Incorporated Lightweight Aggregate Concrete (LWAC) for Energy Efficient Building: A Comprehensive Review. Sustainability 2022, 14, 331. [Google Scholar] [CrossRef]
- Çelik, A.I.; Özkılıç, Y.O.; Zeybek, Ö.; Karalar, M.; Qaidi, S.; Ahmad, J.; Burduhos-Nergis, D.D.; Bejinariu, C. Mechanical Behavior of Crushed Waste Glass as Replacement of Aggregates. Materials 2022, 15, 8093. [Google Scholar] [CrossRef] [PubMed]
- Karalar, M.; Özkılıç, Y.O.; Deifalla, A.F.; Aksoylu, C.; Arslan, M.H.; Ahmad, M.; Sabri, M. Improvement in Bending Performance of Reinforced Concrete Beams Produced with Waste Lathe Scraps. Sustainability 2022, 14, 12660. [Google Scholar] [CrossRef]
- Domski, J.; Zakrzewski, M. Deflection of Steel Fiber Reinforced Concrete Beams Based on Waste Sand. Materials 2020, 13, 392. [Google Scholar] [CrossRef] [PubMed]
- Taher, S.; Saadullah, S.; Haido, J.; Tayeh, B. Behavior of geopolymer concrete deep beams containing waste aggregate of glass and limestone as a partial replacement of natural sand. Case Stud. Constr. Mater. 2021, 15, e00744. [Google Scholar] [CrossRef]
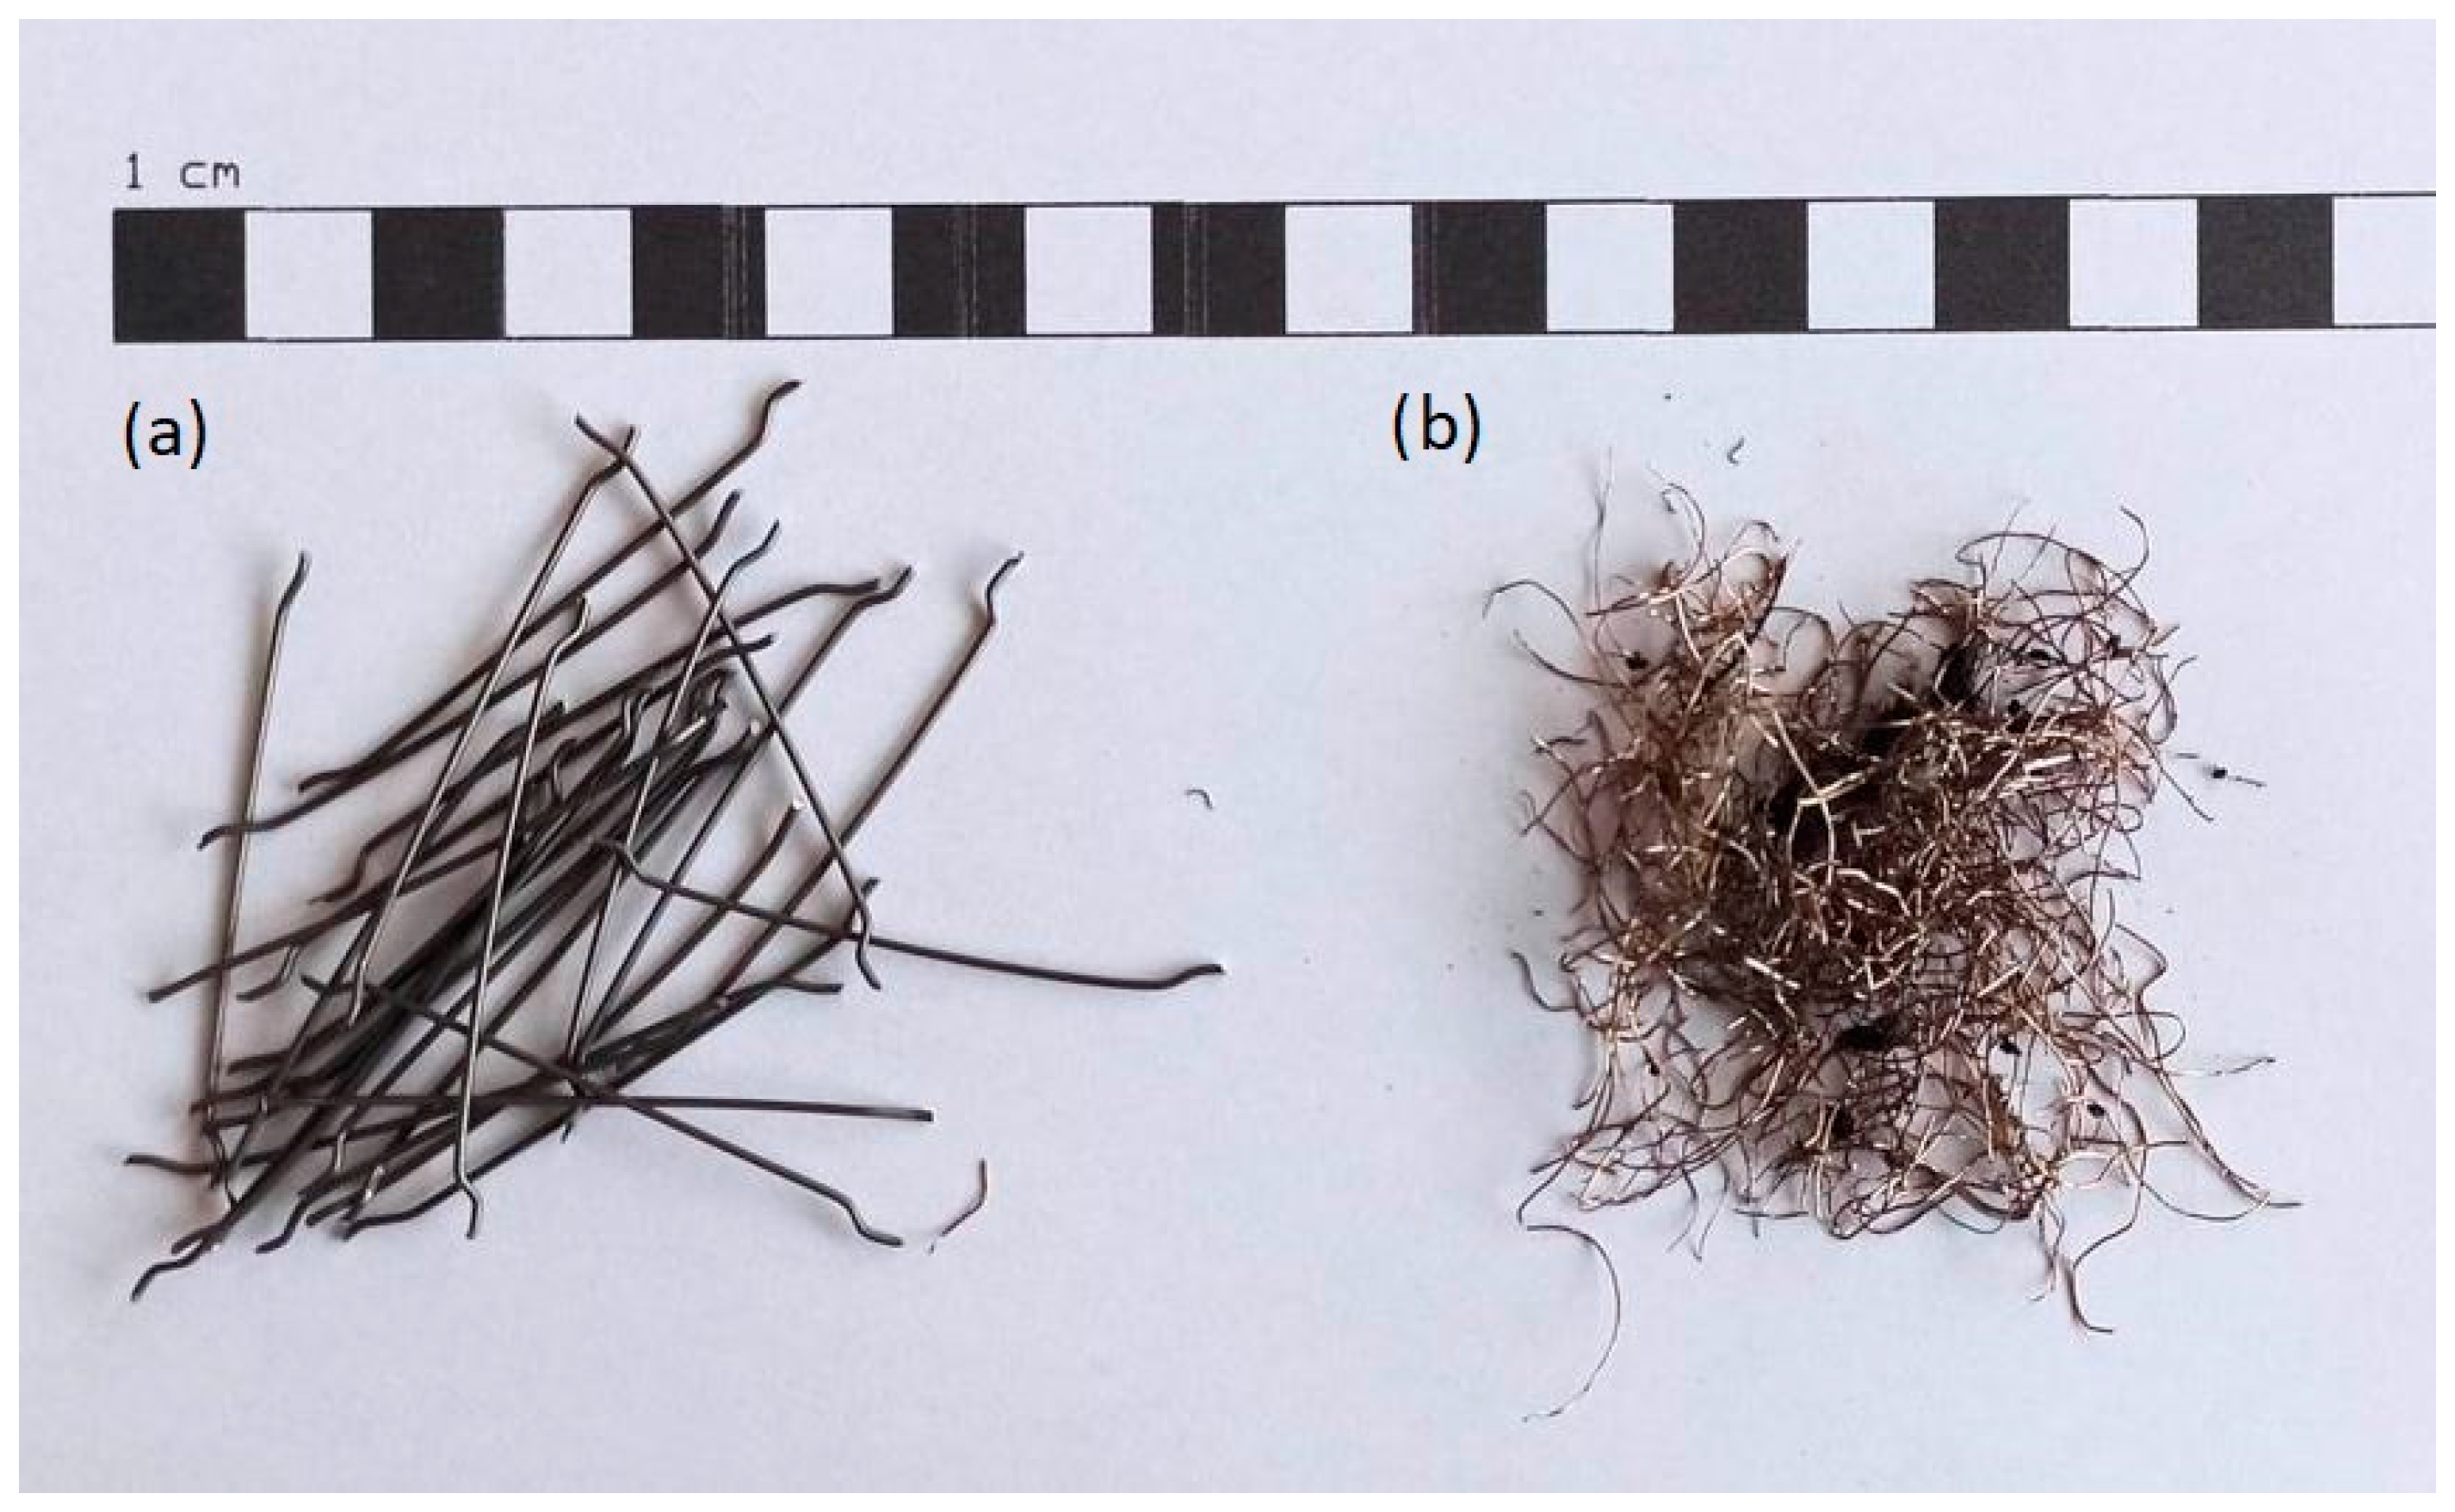
- Domski, J.; Katzer, J.; Zakrzewski, M.; Ponikiewski, T. Comparison of the Mechanical Characteristics of Engineered and Waste Steel Fiber Used as Reinforcement for Concrete. J. Clean. Prod. 2017, 158, 18–28. [Google Scholar] [CrossRef]
- Isa, M.N.; Pilakoutas, K.; Guadagnini, M.; Angelakopoulos, H. Mechanical performance of affordable and eco-efficient ultra-high performance concrete (UHPC) containing recycled tyre steel fibres. Constr. Build. Mater. 2020, 255, 119272. [Google Scholar] [CrossRef]
- Pająk, M.; Krystek, M.; Zakrzewski, M.; Domski, J. Laboratory investigation and numerical modelling of concrete reinforced with recycled fibers. Materials 2021, 14, 1828. [Google Scholar] [CrossRef]
- Zakrzewski, M.; Gancarz, M.; Tvrda, K.; Laskowska-Bury, J.; Domski, J. Comparative Analysis of Waste, Steel, and Polypropylene Microfibers as an Additive for Cement Mortar. Materials 2023, 16, 1625. [Google Scholar] [CrossRef]
- Ezeldin, A.S.; Shiah, T.W. Analytical immediate and long-term deflections of fibrereinforced concrete beams. ASCE J. Struct. Eng. 1995, 121, 727–738. [Google Scholar] [CrossRef]
- Ezeldin, A.S.; Balaguru, P.N. Normal- and high-strength fibre-reinforced concrete under compression. J. Mater. Civ. Eng. 1992, 4, 415–429. [Google Scholar] [CrossRef]
- ACI 318-02 and ACI 318R-02; Building Code Requirements for Structural Concrete and Commentary. American Concrete Institute: Farmington Hills, MI, USA, 2002.
- Tan, K.H.; Paramsivam, P.; Tan, K.C. Instantaneous and long-term deflections of steel fibre reinforced concrete beams. ACI Struct. J. 1994, 91, 384–393. [Google Scholar]
- Tan, K.H.; Saha, M.K. Ten-Year Study on Steel Fiber-Reinforced Concrete Beams under Sustained Loads. ACI Struct. J. 2005, 102, 472. [Google Scholar]
- Bywalski, C. Deflection of Long-Term Loaded Reinforced Concrete Beams Modified with Steel Fibers. Ph.D. Dissertation, Instytutu Budownictwa Politechniki Wrocławskiej, Wrocław, Poland, 2009. (In Polish). [Google Scholar]
- Bywalski, C.; Kamiński, M. Estimation of the bending stiffness of rectangular reinforced concrete beams made of steel fibre reinforced concrete. Arch. Civ. Mech. Eng. 2011, 11, 553–571. [Google Scholar] [CrossRef]
- EN 1992-1-1; Eurocode 2: Design of Concrete Structures—Part 1-1: General Rules and Rules for Buildings. European Union: Brussels, Belgium, 2004.
- Hong, S.; Park, S. Long-term behavior of fiber-reinforcement-plymer-plated concrete beams under sustained lading: Analytical and experimental study. Compos. Struct. 2016, 152, 140–157. [Google Scholar] [CrossRef]
- Choi, W.; Yun, H. Long-term deflection and flexural behavior of reinforced concrete beams with recycled aggregate. Mater. Des. 2013, 51, 742–750. [Google Scholar] [CrossRef]
- Kamiński, M.; Bywalski, C. Testing of Rheological Properties of Steel Fibre Reinforced Concrete Beams. 2008. Available online: https://www.dnibetonu.com/wp-content/pdfs/2006/kaminski_bywalski.pdf (accessed on 1 March 2023). (In Polish).
- Nemegeer, D.; Vandewalle, L.; Van Nieuwenburg, D.; Van Gysel, A.; Vyncke, J.; Deforche, E. Dramix guideline: Design of concrete structures—Steel wire fibre reinforced concrete structures with or without ordinary reinforcement. Infrastuct. Het Leefmilieu 1995, 4, 227–239. [Google Scholar]
- Frosch, R.J. Modeling and control of side face beam cracking. ACI Struct. J. 2002, 99, 276–385. [Google Scholar]
- Vandewalle, L. Cracking behaviour of concrete beams reinforced with a combination of ordinary reinforcement and steel fibers. Mater. Struct. 2000, 33, 164–170. [Google Scholar] [CrossRef]
- Tošić, N.; de la Fuente, A.; Marinković, S. Creep of recycled aggregate concrete: Experimental database and creep prediction model according to the fib Model Code 2010. Constr. Build. Mater. 2019, 195, 590–599. [Google Scholar] [CrossRef]
- Geng, Y.; Zhao, M.; Yang, H.; Wang, Y. Creep model of concrete with recycsled coarse and fine aggregates that accounts for creep development trend difference between recycled and natural aggregate concrete. Cem. Concr. Compos. 2019, 103, 303–317. [Google Scholar] [CrossRef]
- Silva, R.V.; de Brito, J.; Dhir, R.K. Comparative analysis of existing prediction models on the creep behaviour of recycled aggregate concrete. Eng. Struct. 2015, 100, 31–42. [Google Scholar] [CrossRef]
- Chen, P.; Zhou, X.; Zheng, W.; Wang, Y.; Bao, B. Influence of high sustained loads and longitudinal reinforcement on long-term deformation of reinforced concrete beams. J. Build. Eng. 2020, 30, 101241. [Google Scholar] [CrossRef]
- Wang, D.; Zhu, H. Monitoring of the strength gain of concrete using embedded PZT impedance transducer. Constr. Build. Mater. 2011, 25, 3703–3708. [Google Scholar] [CrossRef]
- Shin, S.W.; Qureshi, A.R.; Lee, J.; Yun, C.B. Piezoelectric sensor based nondestructive active monitoring of strength gain in concrete. Smart Mater. Struct. 2008, 17, 055002. [Google Scholar] [CrossRef]
- Dung, N.T.; Unluer, C. Carbonated MgO concrete with improved performance: The influence of temperature and hydration agent on hydration, carbonation and strength gain. Cem. Concr. Compos. 2017, 82, 152–164. [Google Scholar] [CrossRef]
- EN 1766:2017; Products and Systems for the Protection and Repair of Concrete Structures. Test Methods. Reference Concretes for Testing. European Union: Brussels, Belgium, 2017.
- Głodkowska, W.; Ziarkiewicz, M. Cracking Behavior of Steel Fiber Reinforced Waste Sand Concrete Beams in Flexure–Experimental Investigation and Theoretical Analysis. Eng. Struct. 2018, 176, 1–10. [Google Scholar] [CrossRef]
- Lehmann, M.; Głodkowska, W. Shear Capacity and Behaviour of Bending Reinforced Concrete Beams Made of Steel Fibre-Reinforced Waste Sand Concrete. Materials 2021, 14, 2996. [Google Scholar] [CrossRef]
- Zarzycki, P.K.; Katzer, J.; Domski, J. Fast classification of fibres for concretebased on multivariate statistics. Comput. Concr. 2017, 20, 23–29. [Google Scholar]
- Ponikiewski, T.; Gołaszewski, J.; Rudzki, M.; Bugdol, M. Determination of steel fibres distribution in self-compacting concrete beams using X-ray computed tomography. Arch. Civ. Mech. Eng. 2015, 15, 558–568. [Google Scholar] [CrossRef]
- EN 12390-3:2019; Testing Hardened Concrete—Part 3 Compressive Strength of Test Specimens. European Union: Brussels, Belgium, 2019.
- EN 12390-13:2013; Testing Hardened Concrete—Part 13: Determination of Secant Modulus of Elasticity in Compression. European Union: Brussels, Belgium, 2013.
- Sieńkowska, K.; Buda-Ożóg, L. Influence of random character of reinforcement cover in bending elements. Arch. Civ. Eng. 2021, LXVII, 123–137. [Google Scholar]
- PN-B-03264:2002; Concrete, Reinforced Concrete and Prestressed Structures. Static Calculations and Design. PKN: Warsaw, Poland, 2002. (In Polish)


| Aggregate fractions range [mm] | 0.125–0.25 | 0.25–0.50 | 0.50–1.00 | 1.00–2.00 | 2.00–4.00 | 4.00–8.00 |
| Quantity [%] | 10 | 15 | 12 | 15 | 20 | 28 |
| Symbol | Beam Number | Aggregate 0.125–2.00 | Aggregate 2.00–8.00 | Fiber-Reinforcement | Fiber-Reinforcement Ratio |
|---|---|---|---|---|---|
| Sc0 | B3 | Waste Sand | Natural aggregate | Steel cord | 0.0% |
| Sc05 | B2 | 0.5% | |||
| Sc10 | B1 | 1.0% | |||
| RCf0 | B3 | Red ceramic waste | Red ceramic waste | Steel fibers 50/1.0 | 0.0% |
| RCf05 | B2 | 0.5% | |||
| RCf10 | B1 | 1.0% | |||
| RCc0 | B3 | Red ceramic waste | Red ceramic waste | Steel cord | 0.0% |
| RCc05 | B2 | 0.5% | |||
| RCc10 | B1 | 1.0% | |||
| RCSc0 | B3 | Waste Sand | Red ceramic waste | Steel cord | 0.0% |
| RCSc05 | B2 | 0.5% | |||
| RCSc10 | B1 | 1.0% | |||
| WCf0 | B3 | White ceramic waste | White ceramic waste | Steel fibers 50/1.0 | 0.0% |
| WCf05 | B2 | 0.5% | |||
| WCf10 | B1 | 1.0% | |||
| WCc0 | B3 | White ceramic waste | White ceramic waste | Steel cord | 0.0% |
| WCc05 | B2 | 0.5% | |||
| WCc10 | B1 | 1.0% | |||
| WCSf0 | B3 | Waste Sand | White ceramic waste | Steel fibers 50/1.0 | 0.0% |
| WCSf05 | B2 | 0.5% | |||
| WCSf10 | B1 | 1.0% | |||
| WCSc0 | B3 | Waste Sand | White ceramic waste | Steel cord | 0.0% |
| WCSc05 | B2 | 0.5% | |||
| WCSc10 | B1 | 1.0% |
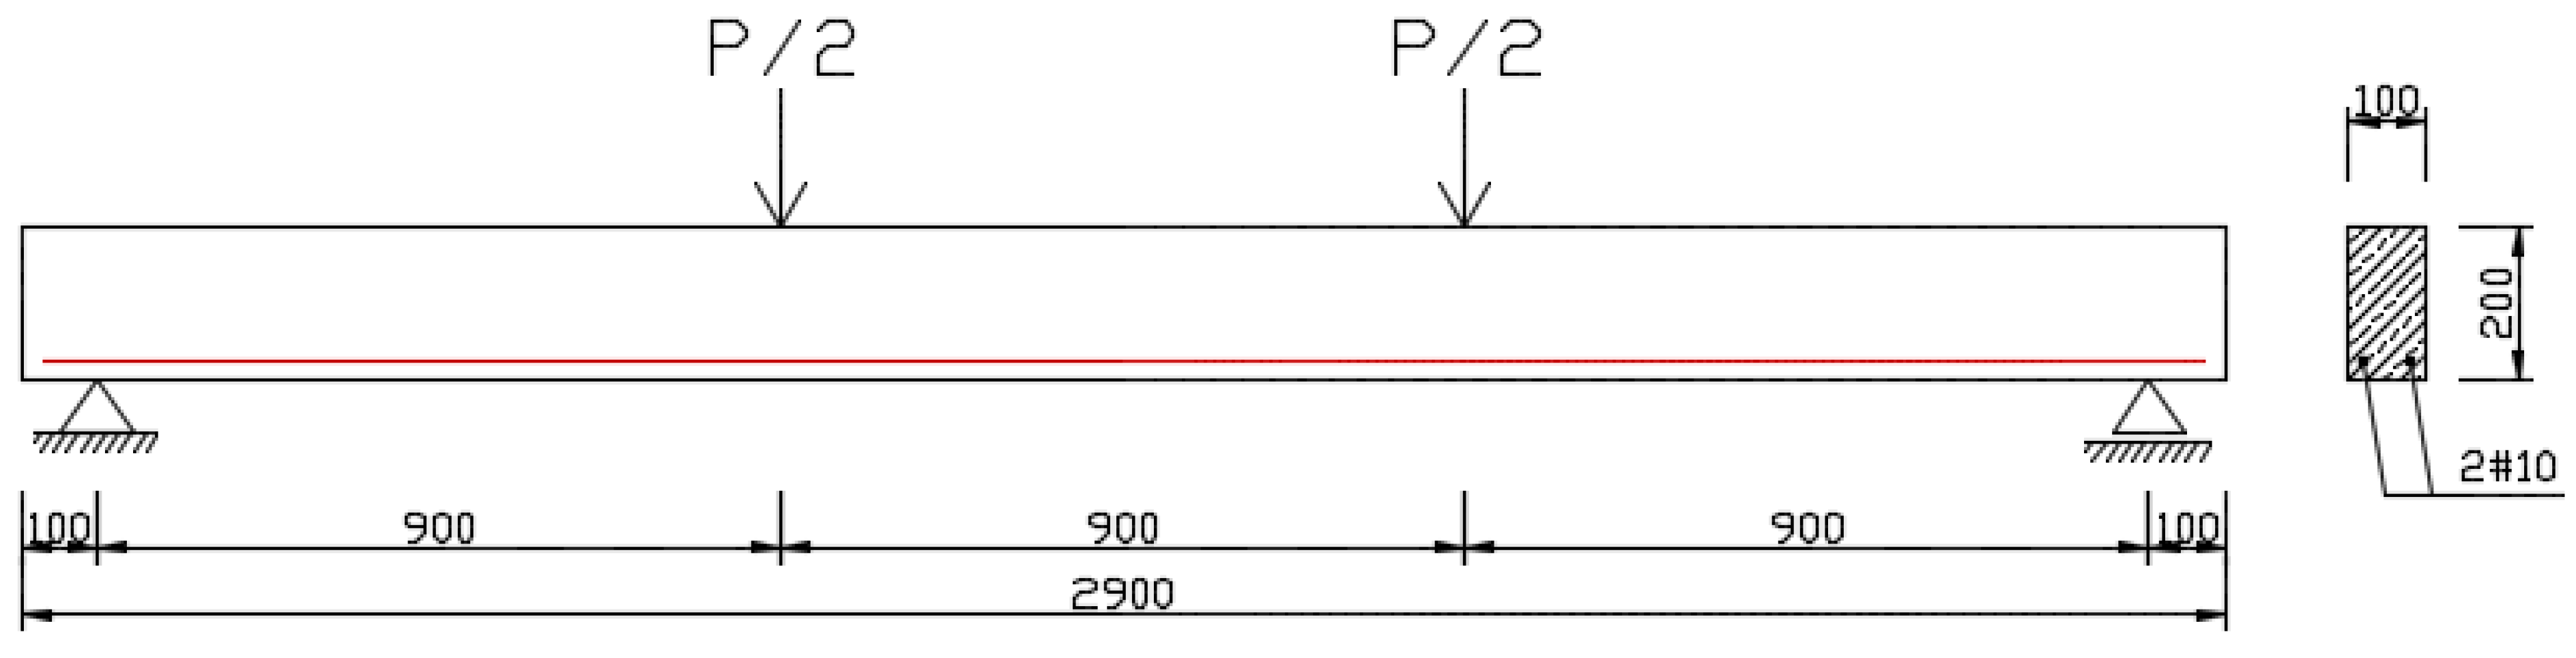
| Beams | Dimensions [mm] | Tensile Reinforcement [mm] | Fibre Reinforcement Ratio [%] | Load P [kN] | Bending Moment [kN·m] | |
|---|---|---|---|---|---|---|
| 1 | B1 | 100 × 200 × 2900 | 2#10 | 1.0% | 6.58 | 5.92 |
| 2 | B2 | 100 × 200 × 2900 | 2#10 | 0.5% | 5.82 | 5.24 |
| 3 | B3 | 100 × 200 × 2900 | 2#10 | 0.0% | 5.80 | 5.22 |
| Phase | Load |
|---|---|
| I | B1 (own weight) |
| II | B1 + B2 |
| III | B1 + B2 + B3 |
| IV | B1 + B2 + B3 + Lever |
| Mixture | Beam Number | Medium Secant Modulus of Elasticity [GPa] | Standard Deviation [GPa] | Compression Strength [MPa] | Standard Deviation [MPa] |
|---|---|---|---|---|---|
| Sc0 | B3 | 37.89 | 1.84 | 42.03 | 1.88 |
| Sc05 | B2 | 39.50 | 0.54 | 60.51 | 0.72 |
| Sc10 | B1 | 42.20 | 1.20 | 72.53 | 8.76 |
| RCf0 | B3 | 16.56 | 0.32 | 37.74 | 1.55 |
| RCf05 | B2 | 16.97 | 0.11 | 38.82 | 0.69 |
| RCf10 | B1 | 15.04 | 0.31 | 40.24 | 0.92 |
| RCc0 | B3 | 20.05 | 1.12 | 47.55 | 2.75 |
| RCc05 | B2 | 18.74 | 1.83 | 49.40 | 1.91 |
| RCc10 | B1 | 18.65 | 0.12 | 50.52 | 2.12 |
| RCSc0 | B3 | 21.43 | 2.63 | 40.92 | 9.16 |
| RCSc05 | B2 | 23.30 | 0.62 | 48.09 | 0.95 |
| RCSc10 | B1 | 25.53 | 1.94 | 49.45 | 4.79 |
| WCf0 | B3 | 39.10 | 1.69 | 37.74 | 1.55 |
| WCf05 | B2 | 34.97 | 0.13 | 38.82 | 0.69 |
| WCf10 | B1 | 35.02 | 1.20 | 40.24 | 0.92 |
| WCc0 | B3 | 35.98 | 0.24 | 47.55 | 2.75 |
| WCc05 | B2 | 34.53 | 0.74 | 49.40 | 1.91 |
| WCc10 | B1 | 36.66 | 0.99 | 50.52 | 2.12 |
| WCSf0 | B3 | 41.15 | 0.72 | 59.20 | 6.04 |
| WCSf05 | B2 | 39.52 | 2.58 | 65.21 | 4.01 |
| WCSf10 | B1 | 40.09 | 0.63 | 66.72 | 4.56 |
| WCSc0 | B3 | 40.41 | 0.20 | 51.20 | 9.89 |
| WCSc05 | B2 | 40.91 | 0.22 | 56.12 | 8.23 |
| WCSc10 | B1 | 41.32 | 0.70 | 59.18 | 3.96 |
| Mixture | Beam Number | Crack Spacing [mm] | Max Crack Width [mm] | Number of Cracks | |||||||
|---|---|---|---|---|---|---|---|---|---|---|---|
| Average | Average | Average | Maximum | ||||||||
| Tests | PN-B | Van. | EC2 | Instantaneous | After 1000 Days | EC2 | PN-B | Van. | |||
| Sc0 | B3 | 93.8 | 76.18 | 69.25 | 95.50 | 0.09 | 0.12 | 0.074 | 0.097 | 0.054 | 10 |
| Sc05 | B2 | 72.9 | 77.64 | 70.58 | 97.99 | 0.09 | 0.14 | 0.069 | 0.092 | 0.049 | 14 |
| Sc10 | B1 | 64.1 | 78.28 | 71.16 | 99.08 | 0.05 | 0.08 | 0.082 | 0.108 | 0.059 | 14 |
| RCf0 | B3 | 46.6 | 70.00 | 63.69 | 85.11 | 0.09 | 0.12 | 0.063 | 0.090 | 0.047 | 19 |
| RCf05 | B2 | 47.7 | 70.32 | 63.93 | 85.54 | 0.09 | 0.12 | 0.063 | 0.090 | 0.047 | 19 |
| RCf10 | B1 | 48.8 | 69.68 | 63.35 | 84.46 | 0.10 | 0.10 | 0.073 | 0.103 | 0.055 | 19 |
| RCc0 | B3 | 44.3 | 72.48 | 65.89 | 89.22 | 0.08 | 0.10 | 0.064 | 0.090 | 0.047 | 22 |
| RCc05 | B2 | 58.1 | 72.17 | 65.61 | 88.68 | 0.09 | 0.10 | 0.062 | 0.089 | 0.046 | 15 |
| RCc10 | B1 | 49.6 | 78.60 | 65.66 | 88.79 | 0.10 | 0.12 | 0.075 | 0.112 | 0.055 | 21 |
| RCSc0 | B3 | 67.7 | 72.29 | 65.72 | 88.90 | 0.09 | 0.12 | 0.067 | 0.091 | 0.05 | 13 |
| RCSc05 | B2 | 52.3 | 73.50 | 66.76 | 90.85 | 0.06 | 0.12 | 0.066 | 0.091 | 0.049 | 19 |
| RCSc10 | B1 | 46.4 | 74.14 | 67.40 | 92.04 | 0.07 | 0.14 | 0.08 | 0.106 | 0.059 | 13 |
| WCf0 | B3 | 66.5 | 77.20 | 70.18 | 97.24 | 0.02 | 0.08 | 0.07 | 0.091 | 0.051 | 14 |
| WCf05 | B2 | 71.2 | 76.69 | 69.72 | 96.37 | 0.02 | 0.08 | 0.069 | 0.093 | 0.05 | 13 |
| WCf10 | B1 | 69.8 | 77.00 | 69.25 | 95.5 | 0.03 | 0.08 | 0.079 | 0.107 | 0.057 | 14 |
| WCc0 | B3 | 63.3 | 77.14 | 70.12 | 97.13 | 0.02 | 0.06 | 0.068 | 0.092 | 0.049 | 14 |
| WCc05 | B2 | 77.8 | 77.20 | 70.18 | 97.24 | 0.04 | 0.08 | 0.067 | 0.091 | 0.048 | 11 |
| WCc10 | B1 | 61.1 | 77.71 | 70.64 | 98.1 | 0.07 | 0.10 | 0.079 | 0.106 | 0.057 | 14 |
| WCSf0 | B3 | 76.9 | 77.83 | 70.76 | 98.32 | 0.08 | 0.10 | 0.069 | 0.092 | 0.05 | 12 |
| WCSf05 | B2 | 66.1 | 77.90 | 70.82 | 98.43 | 0.05 | 0.08 | 0.068 | 0.092 | 0.049 | 15 |
| WCSf10 | B1 | 57.6 | 78.02 | 70.93 | 98.64 | 0.03 | 0.04 | 0.081 | 0.105 | 0.058 | 14 |
| WCSc0 | B3 | 90.3 | 77.20 | 70.18 | 97.24 | 0.03 | 0.06 | 0.071 | 0.095 | 0.052 | 11 |
| WCSc05 | B2 | 71.8 | 77.52 | 70.47 | 97.78 | 0.04 | 0.08 | 0.07 | 0.093 | 0.05 | 11 |
| WCSc10 | B1 | 64.8 | 77.77 | 70.7 | 98.21 | 0.04 | 0.08 | 0.082 | 0.108 | 0.059 | 14 |
| Mixture | Beam Number | Δ Average Crack Spacing [%] | Δ Max Crack Width [%] | |||
|---|---|---|---|---|---|---|
| PN-B | Van. | EC2 | PN-B | Van. | ||
| Sc0 | B3 | 18.78 | 26.17 | 40.80 | 22.40 | 56.80 |
| Sc05 | B2 | −6.50 | 3.18 | 50.71 | 34.29 | 65.00 |
| Sc10 | B1 | −22.12 | −11.01 | −17.14 | −54.29 | 15.71 |
| RCf0 | B3 | −50.21 | −36.67 | 47.50 | 25.00 | 60.83 |
| RCf05 | B2 | −47.42 | −34.03 | 47.50 | 25.00 | 60.83 |
| RCf10 | B1 | −42.79 | −29.82 | 27.00 | −3.00 | 45.00 |
| RCc0 | B3 | −63.61 | −48.74 | 36.00 | 10.00 | 53.00 |
| RCc05 | B2 | −24.22 | −12.93 | 38.00 | 11.00 | 54.00 |
| RCc10 | B1 | −58.47 | −32.38 | 37.50 | 6.67 | 54.17 |
| RCSc0 | B3 | −6.78 | 2.92 | 44.17 | 24.17 | 58.33 |
| RCSc05 | B2 | −40.54 | −27.65 | 45.00 | 24.17 | 59.17 |
| RCSc10 | B1 | −59.78 | −45.26 | 38.46 | 18.46 | 54.62 |
| WCf0 | B3 | −16.09 | −5.53 | 0.00 | −30.00 | 27.14 |
| WCf05 | B2 | −7.71 | 2.08 | 13.75 | −16.25 | 37.50 |
| WCf10 | B1 | −10.32 | 0.79 | 1.25 | −33.75 | 28.75 |
| WCc0 | B3 | −21.86 | −10.77 | −13.33 | −53.33 | 18.33 |
| WCc05 | B2 | 0.77 | 9.79 | 16.25 | −13.75 | 40.00 |
| WCc10 | B1 | −27.18 | −15.61 | 28.18 | 3.64 | 48.18 |
| WCSf0 | B3 | −1.21 | 7.98 | 31.00 | 8.00 | 50.00 |
| WCSf05 | B2 | −17.85 | −7.14 | 2.86 | −31.43 | 30.00 |
| WCSf10 | B1 | −35.45 | −23.14 | −102.50 | −162.50 | −45.00 |
| WCSc0 | B3 | 14.51 | 22.28 | −18.33 | −58.33 | 13.33 |
| WCSc05 | B2 | −7.97 | 1.85 | 12.50 | −16.25 | 37.50 |
| WCSc10 | B1 | −20.02 | −9.10 | −2.50 | −35.00 | 26.25 |
| Mixture | Beam Number | Test | Calculation Methods | Δ (Deflection) [%] | ||||
|---|---|---|---|---|---|---|---|---|
| Deflection after 1000 Days [mm] | Deflection after 1000 Days [mm] | EC2 | Tan | Byw | ||||
| EC2 | Tan | Byw | ||||||
| Sc0 | B3 | 4.35 | 5.05 | - | - | −16.09 | - | - |
| Sc05 | B2 | 4.24 | 5.10 | 3.31 | 4.38 | −20.28 | 21.93 | −3.20 |
| Sc10 | B1 | 4.95 | 5.34 | 3.76 | 4.75 | −7.88 | 24.04 | 4.21 |
| RCf0 | B3 | 18.07 | 6.32 | - | - | 65.02 | - | - |
| RCf05 | B2 | 16.90 | 6.32 | 5.89 | 6.58 | 62.60 | 65.15 | 156.84 |
| RCf10 | B1 | 17.58 | 7.99 | 7.44 | 9.60 | 54.55 | 57.68 | 83.13 |
| RCc0 | B3 | 12.30 | 6.27 | - | - | 49.02 | - | - |
| RCc05 | B2 | 8.95 | 6.44 | 5.64 | 5.85 | 28.04 | 36.98 | 52.99 |
| RCc10 | B1 | 10.80 | 7.03 | 6.62 | 6.38 | 34.91 | 38.70 | 69.28 |
| RCSc0 | B3 | 8.32 | 5.87 | - | - | 29.45 | - | - |
| RCSc05 | B2 | 6.97 | 5.88 | 4.81 | 5.61 | 15.64 | 30.99 | 24.24 |
| RCSc10 | B1 | 7.05 | 6.34 | 5.32 | 6.00 | 10.07 | 24.54 | 17.50 |
| WCf0 | B3 | 5.15 | 4.99 | - | - | 3.11 | - | - |
| WCf05 | B2 | 4.65 | 5.12 | 3.61 | 4.69 | −10.11 | 22.37 | −0.85 |
| WCf10 | B1 | 5.05 | 5.63 | 4.31 | 5.11 | −11.49 | 14.65 | −1.17 |
| WCc0 | B3 | 3.87 | 5.38 | - | - | −39.02 | - | - |
| WCc05 | B2 | 3.77 | 5.48 | 3.73 | 4.42 | −45.36 | 1.06 | −14.71 |
| WCc10 | B1 | 3,95 | 5.54 | 4.23 | 4.82 | −40.25 | −7.09 | −18.05 |
| WCSf0 | B3 | 3.87 | 4.83 | - | - | −24.81 | - | - |
| WCSf05 | B2 | 3.77 | 4.80 | 3.36 | 4.27 | −27.32 | 10.88 | −11.71 |
| WCSf10 | B1 | 3.75 | 5.38 | 3.90 | 5.06 | −43.47 | −4.00 | −25.89 |
| WCSc0 | B3 | 3.17 | 4.99 | - | - | −57.41 | - | - |
| WCSc05 | B2 | 3.30 | 4.91 | 3.16 | 4.46 | −48.79 | 4.24 | −26.01 |
| WCSc10 | B1 | 3.85 | 5.47 | 3.79 | 5.12 | −42.08 | 1.56 | −24.80 |
Disclaimer/Publisher’s Note: The statements, opinions and data contained in all publications are solely those of the individual author(s) and contributor(s) and not of MDPI and/or the editor(s). MDPI and/or the editor(s) disclaim responsibility for any injury to people or property resulting from any ideas, methods, instructions or products referred to in the content. |
© 2023 by the authors. Licensee MDPI, Basel, Switzerland. This article is an open access article distributed under the terms and conditions of the Creative Commons Attribution (CC BY) license (https://creativecommons.org/licenses/by/4.0/).
Share and Cite
Zakrzewski, M.; Domski, J. Cracking Behavior and Deflections in Recycled-Aggregate Beams Reinforced with Waste Fibers Subjected to Long-Term Constant Loading. Materials 2023, 16, 3622. https://doi.org/10.3390/ma16103622
Zakrzewski M, Domski J. Cracking Behavior and Deflections in Recycled-Aggregate Beams Reinforced with Waste Fibers Subjected to Long-Term Constant Loading. Materials. 2023; 16(10):3622. https://doi.org/10.3390/ma16103622
Chicago/Turabian StyleZakrzewski, Mateusz, and Jacek Domski. 2023. "Cracking Behavior and Deflections in Recycled-Aggregate Beams Reinforced with Waste Fibers Subjected to Long-Term Constant Loading" Materials 16, no. 10: 3622. https://doi.org/10.3390/ma16103622