4. Discussion
The results of the conducted research suggest that obtaining a homogeneous mixture with ER properties, made of hydrocarbon oil as an insulating liquid and ionic liquid as an electrically active additive, is complicated. First, it is very difficult to select an ionic liquid that is fully miscible with a hydrocarbon liquid, which is a good electrical insulator. There is no major problem with selecting a hydrocarbon liquid with excellent insulating properties (e.g., PAO6 and GP1 oils selected in these tests). It is more difficult to choose an ionic liquid, a small amount of which will allow the production of a homogeneous mixture (solution or colloidal emulsion of liquid components) with ER properties. Such a liquid should have, among others: low viscosity in the condition of no action of the electric field, a large increase in shear stress as a result of the action of the direct electric field, short reaction time to the action of the electric field, the ability to work in a wide temperature range. Inhomogeneous liquids, there are no unfavorable phenomena typical for heterogeneous liquids, such as coagulation and sedimentation, related to the presence of solid particles in the liquid. However, a significant limitation in the practical application of homogeneous ER liquids is their high sensitivity to contamination and tendency to electrical breakdown (short circuit). Two mixtures selected for ER research, i.e., GP1 + CJ001 and PAO6 + Cj008, met almost all the requirements (
Section 3.2), but it turned out that both ionic liquids had too high electrical conductivity (
Section 3.4—
Figure 5a,b) which, with their higher content in the base oil, was the cause of breakdown during the action of an electric field. However, reducing the content of the ionic liquid in the oil to 2% (
v/
v) made it possible to obtain mixtures with ER properties, but the obtained ER effect was short-lived and unique for the same liquid sample, which suggested irreversible changes in the internal structure of these mixtures under the influence of an external electric field. A better effect of ER (higher values of
τ and
η during the action of the external electric field-
Table 3 and
Table 4) was obtained for the PAO6 + CJ008 mixture.
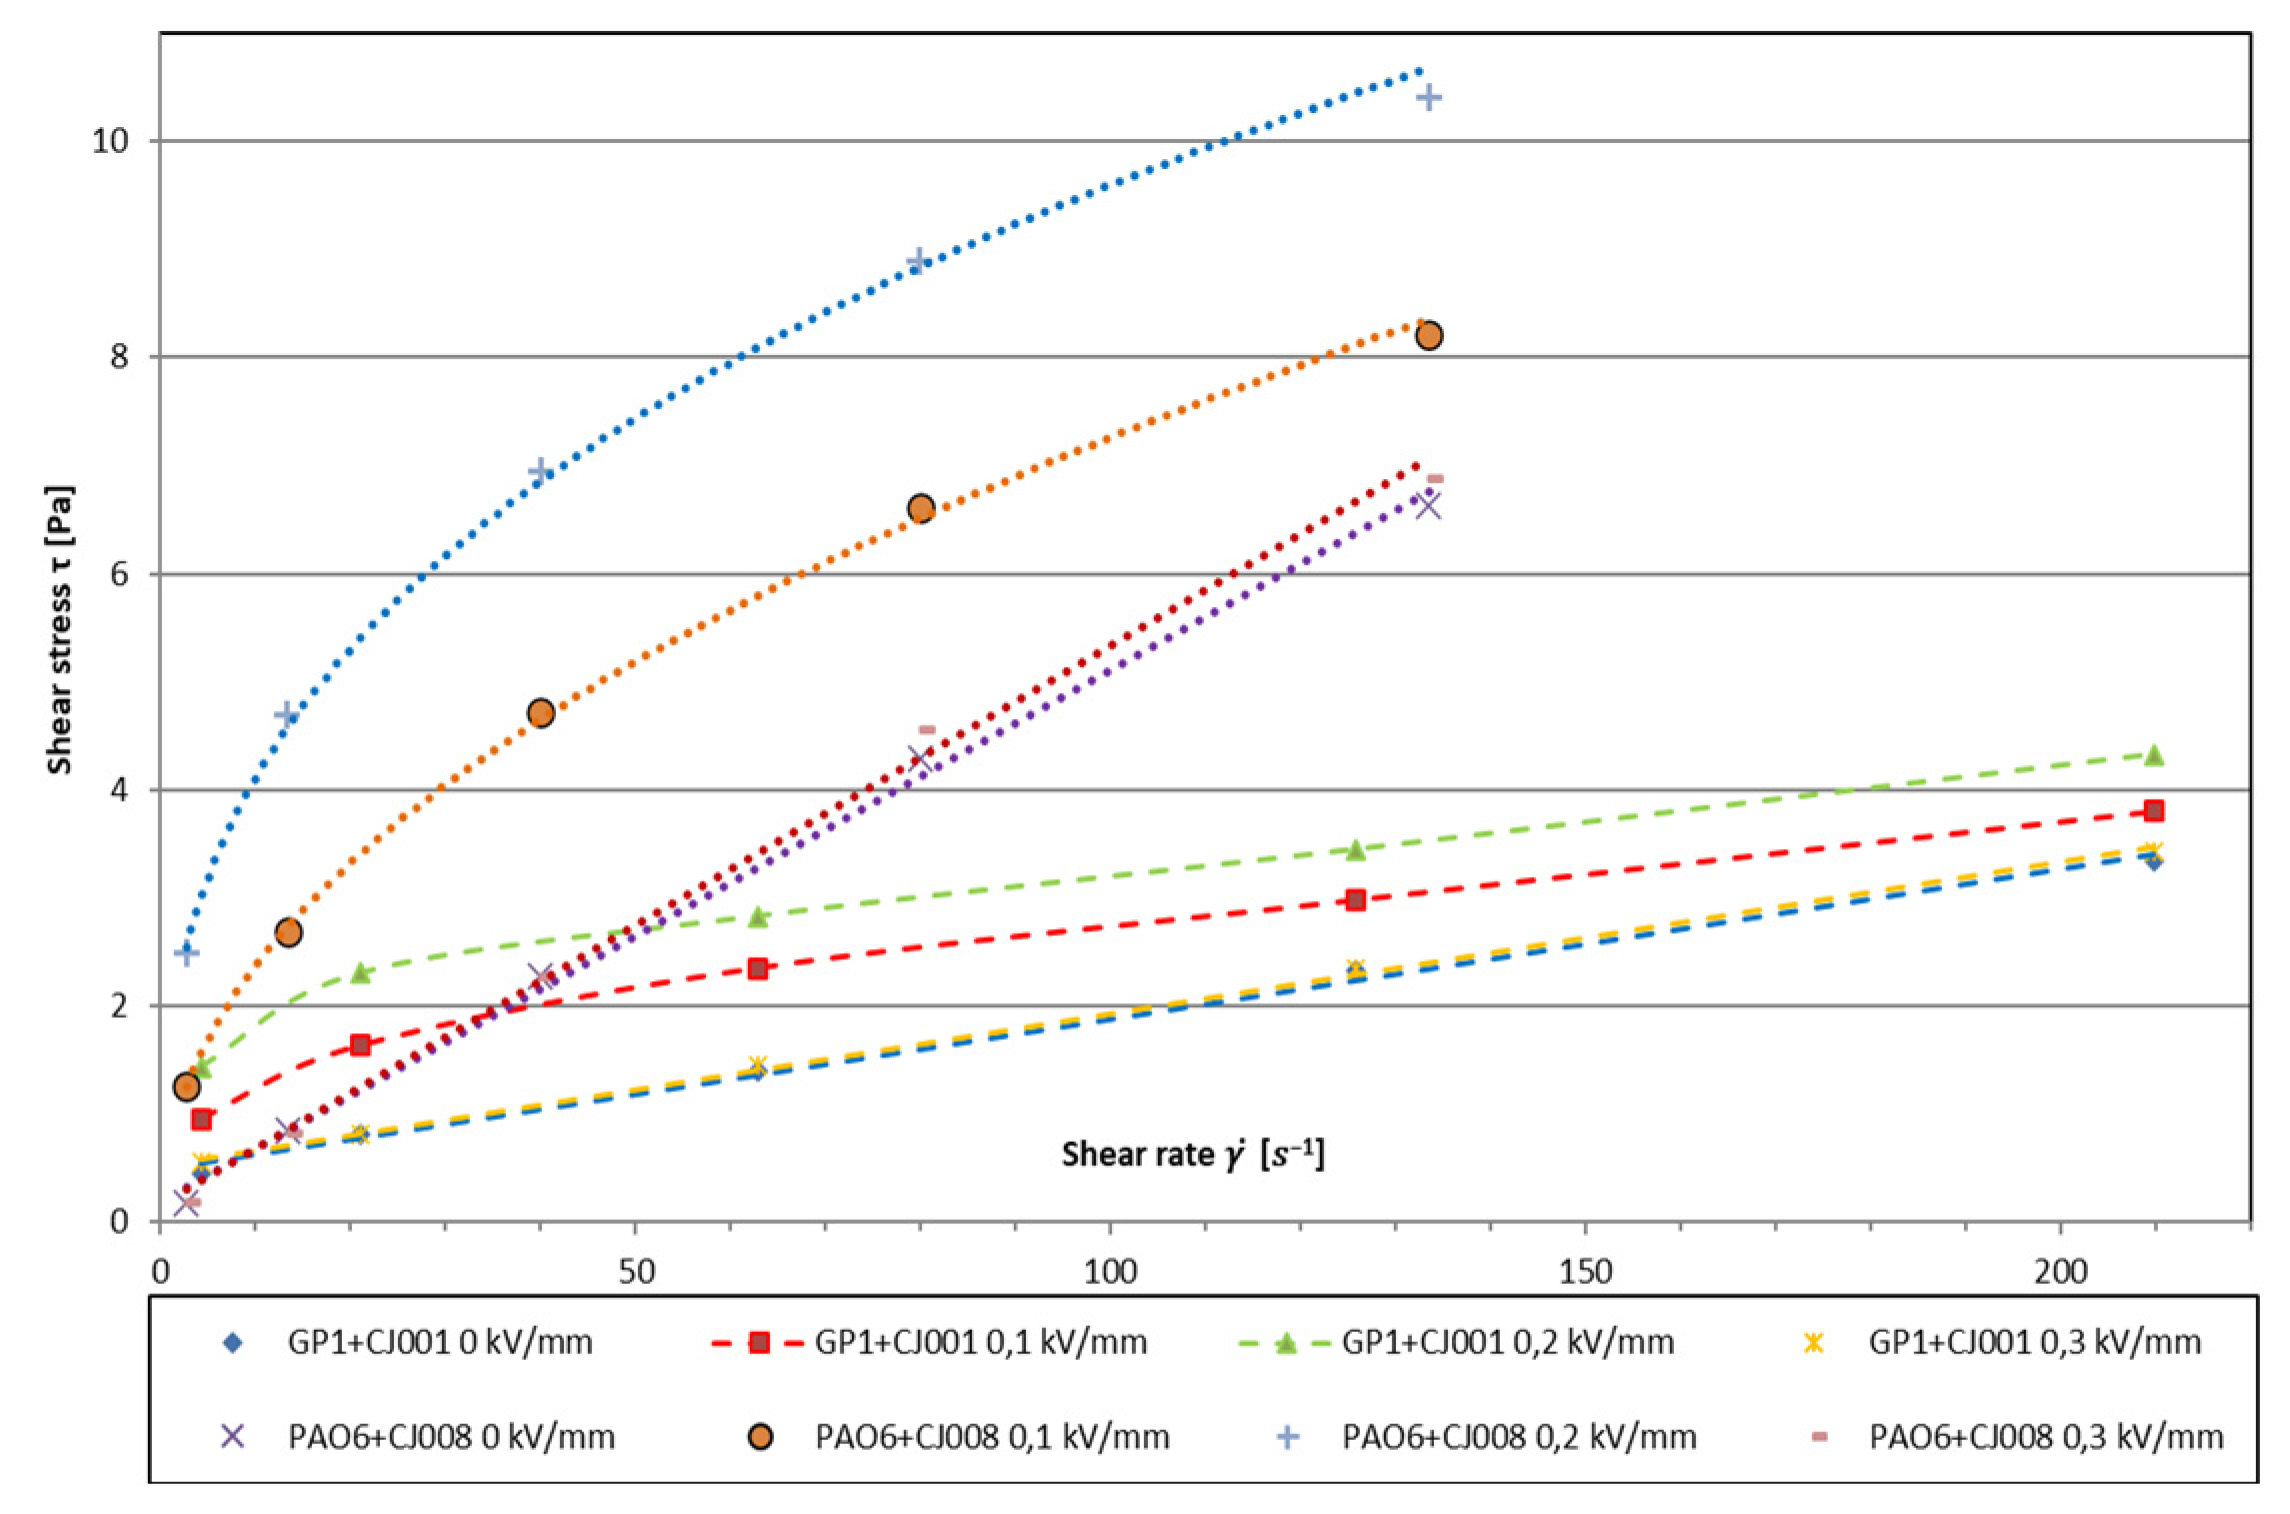
The tested mixtures showed different rheological characteristics of
τ = f(
), both in the absence of an external electric field and in the presence of this field (
Figure 4). The GP1 + CJ001 mixture, in the absence of an electric field, behaved similar to Bingham’s liquid (
τ = η·(
) +
τo), but its limit stress (
τo) had a low value (approx. 0.5 Pa). In the presence of an electric field, up to the value of
E = 0.2 kV·mm
−1, the rheological characteristics of this liquid could be described by Herschel-Bulkley equation
τ = m1·(
)
n1 +
τo with
n < 1 typical for a viscoplastic pseudoplastic liquid. The second mixture, i.e., PAO6 + CJ008 at
E = 0 V behaved similar to a Newtonian liquid
τ = m2·(
)
n2 with
n < 1 typical for viscous pseudoplastic liquid (
Figure 4). After increasing the electric field strength to a value of
E = 0.3 kV·mm
−1, the rheological characteristics of both mixtures corresponded to those of the mixtures without the influence of the electric field, i.e., the mixture GP1 + CJ001 to the Bingham characteristics and the mixture PAO6 + CJ008 to the Newton characteristics. It should be remembered at this point that the measurements of the ER properties of these mixtures with the modernized Brookfield DV-III Ultra viscometer were carried out at the lowest possible shear rate for the GP1 + CJ001 mixture it was (
)
min = 4.20 s
−1 (
Table 3), and for the PAO6 + CJ008 mixture it was (
)
min = 2.67 (
Table 4). Obtaining even lower shear rates, with the determined selection of the “spindle/cylinder” sets, was impossible. Therefore, the real course of the rheological characteristics
τ = f(
) for even lower shear rates is practically impossible to determine, however
τ = f(
) courses established for both mixtures are the most probable (
Figure 4).In both cases, at
E = 0.3 kV·mm
−1, the viscosity (
η) again corresponded to the value at
E = 0. The maximum values of viscosity, caused by the action of the electric field, were obtained in both cases at the lowest shear rates, when the electric field intensity was
E = 0.2 kV·mm
−1. In the case of the mixture GP1 + CJ001 it was the value of
η = 435.71 mPa·s, which was almost 2.5 times higher than the viscosity in the absence of an electric field (
Table 3). However, in the case of the PAO6 + CJ008 mixture, the components of which are more polar than the GP1 + CJ001 mixture (
Section 3.2—
Table 1), the effect of action of the electric field was greater. Viscosity increased to the value of
η = 1247.19 mPa·s (
Section 3.3—
Table 4), which was almost 20 times higher than the value of (
η) in the absence of electric field. Thus, a much better ER effect was obtained for the PAO6 + CJ008 mixture described by the Ostwald-de Waele equation
τ = m2·(
)
n2, the components of which different in viscosity value by 279,88 mPa s, i.e., two times less than in the GP1 + CJ001 mixture described by the Herschel-Bulkley equation
τ = m1·(
)
n1 +
τo, where the difference was 539,81 mPa·s. It should also be noted that in the first case the base insulating liquid, i.e., PAO6, had a viscosity
η = 47.36 mPa·s, and in the second case the base insulating liquid, i.e., GP-1, had a viscosity
η = 12.61 mPa·s, i.e., four times lower than PAO6. Such observation suggests that in discussed case, the effect on the maximum three times the greater value of the viscosity of the PAO6 + CJ008 mixture (
η = 1247.19 mPa·s), with
E = 0.2 kV·mm
−1 (
Table 4), compared to the GP1 + CJ001 mixture (
η = 435.71 mPa·s), with the same value of
E = 0.2 kV·m
−1 (
Table 3), had among others, the higher viscosity of the PAO-6 base liquid than GP1, and not different viscosity of both components of the mixture, which in turn could be associated with the occurrence of the boundary stress (
τo) in the GP1 + CJ001 mixture (
Figure 4).
Ionic liquids qualified for ER research belonged to the set of liquids previously tested as perspective lubricating oils [
1,
2,
3,
4,
16]. In those studies, excellent tribological properties of many ionic liquids were found, therefore an attempt was made to use them also as an electrically active additive in a mixture with an insulating hydrocarbon lubricating oil. In order to identify the causes of the formation and disappearance of the ER effect in such a mixture, it was decided to conduct additional tests in dielectric spectroscopy of the components of both discussed mixtures, i.e., base oils GP-1 and PAO-6 and ionic liquids CJ001 and CJ008 (
Figure 5,
Figure 6,
Figure 7,
Figure 8,
Figure 9,
Figure 10,
Figure 11 and
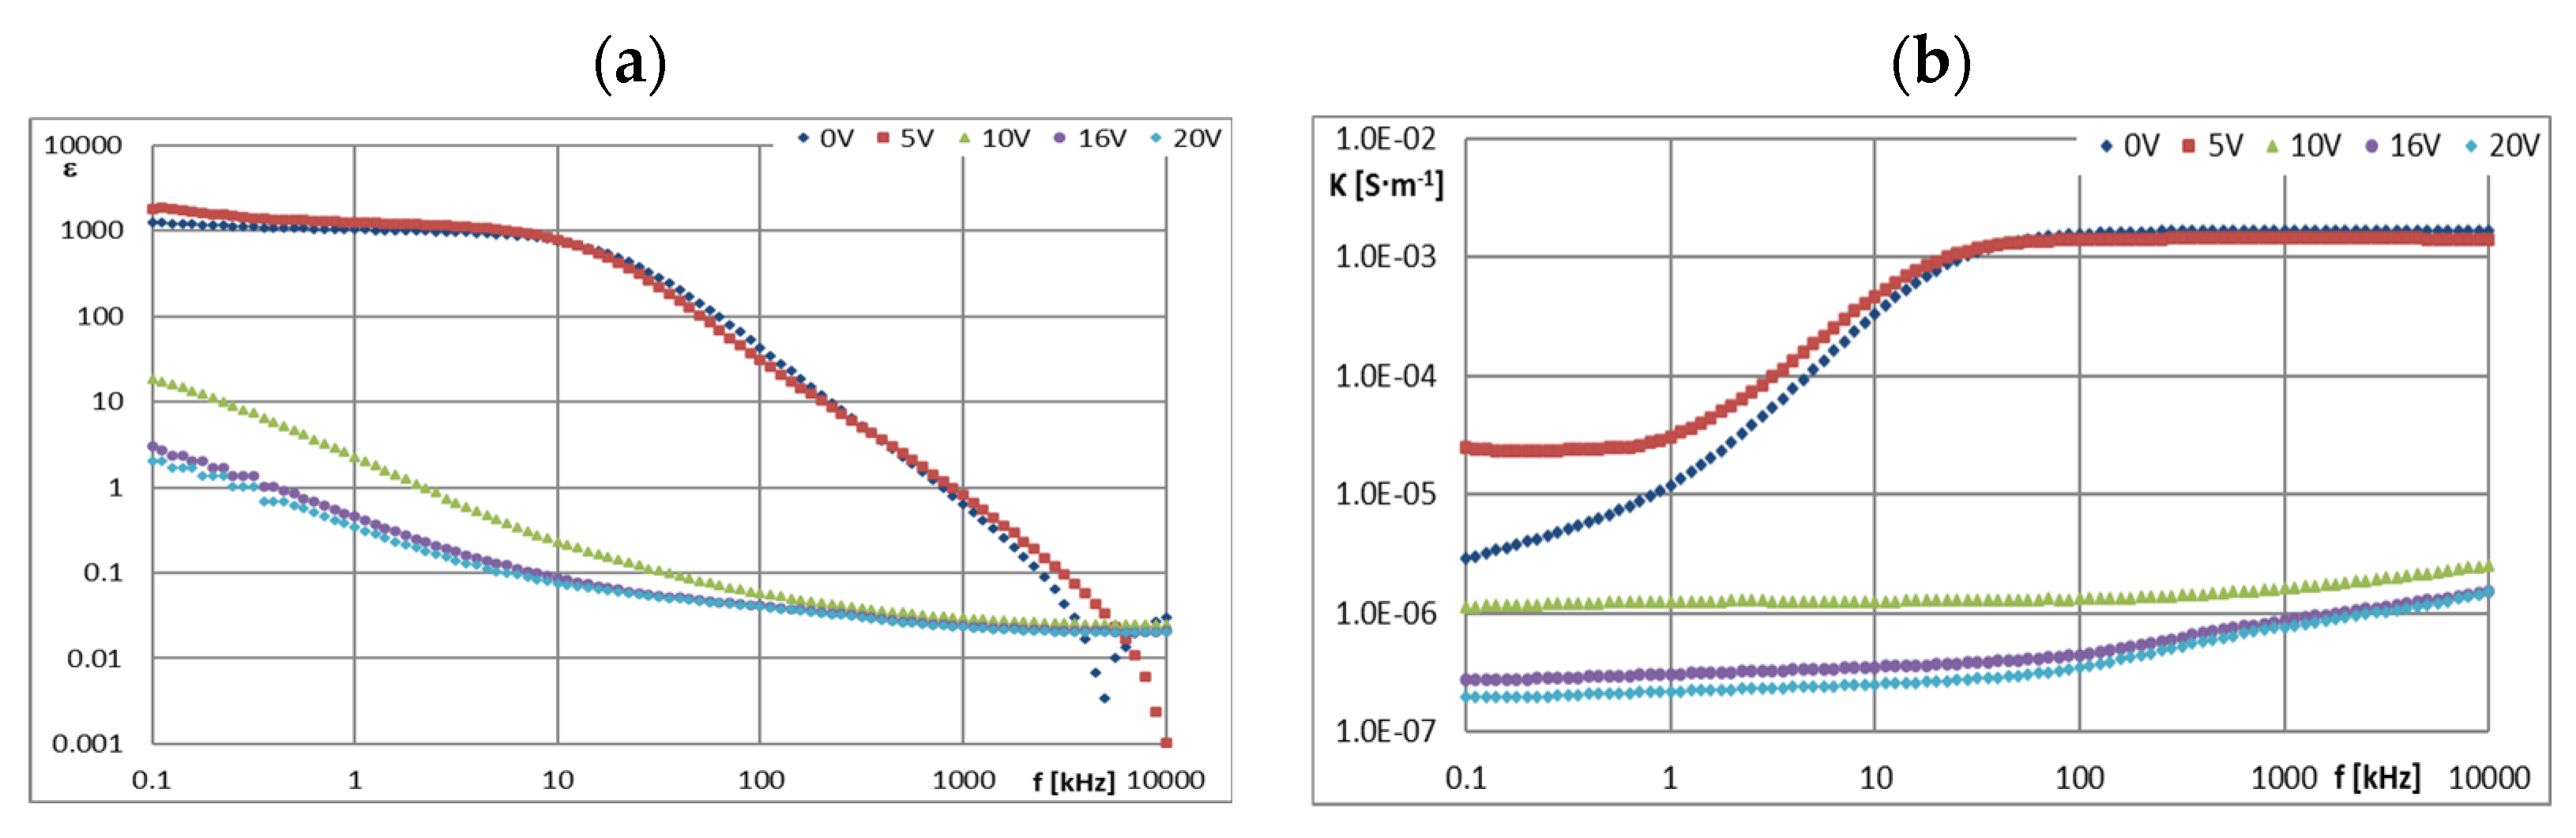
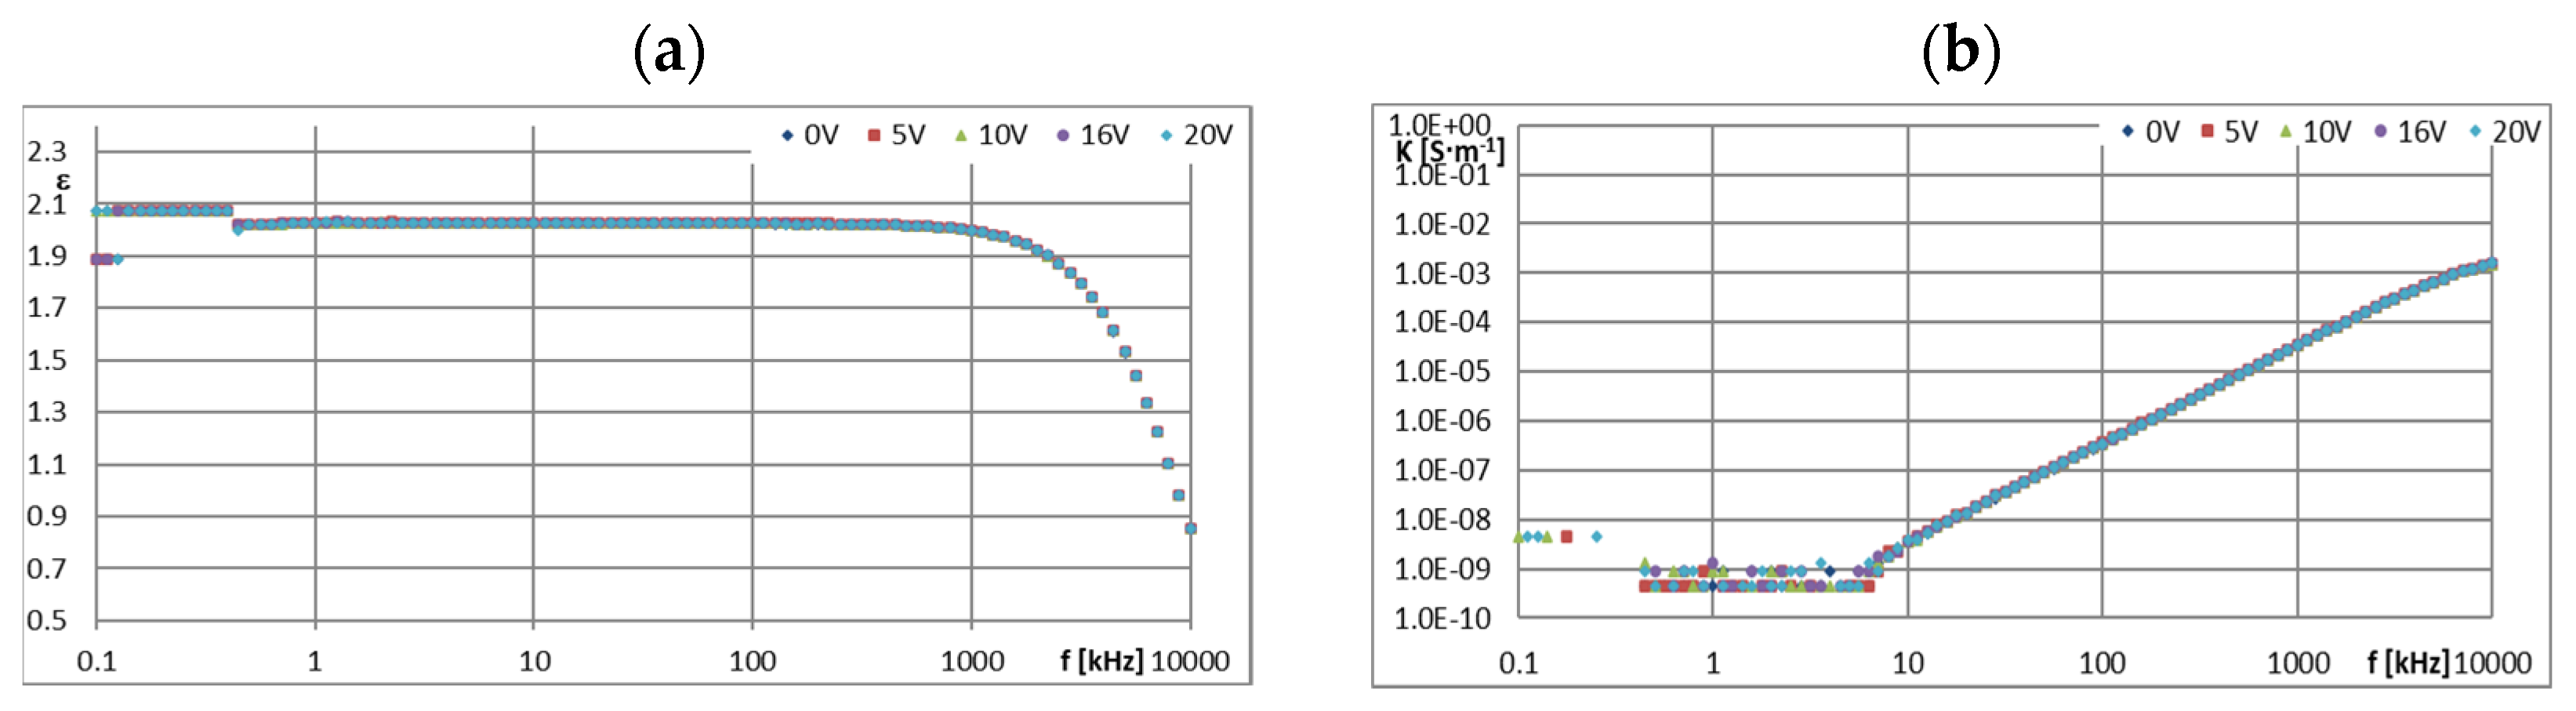
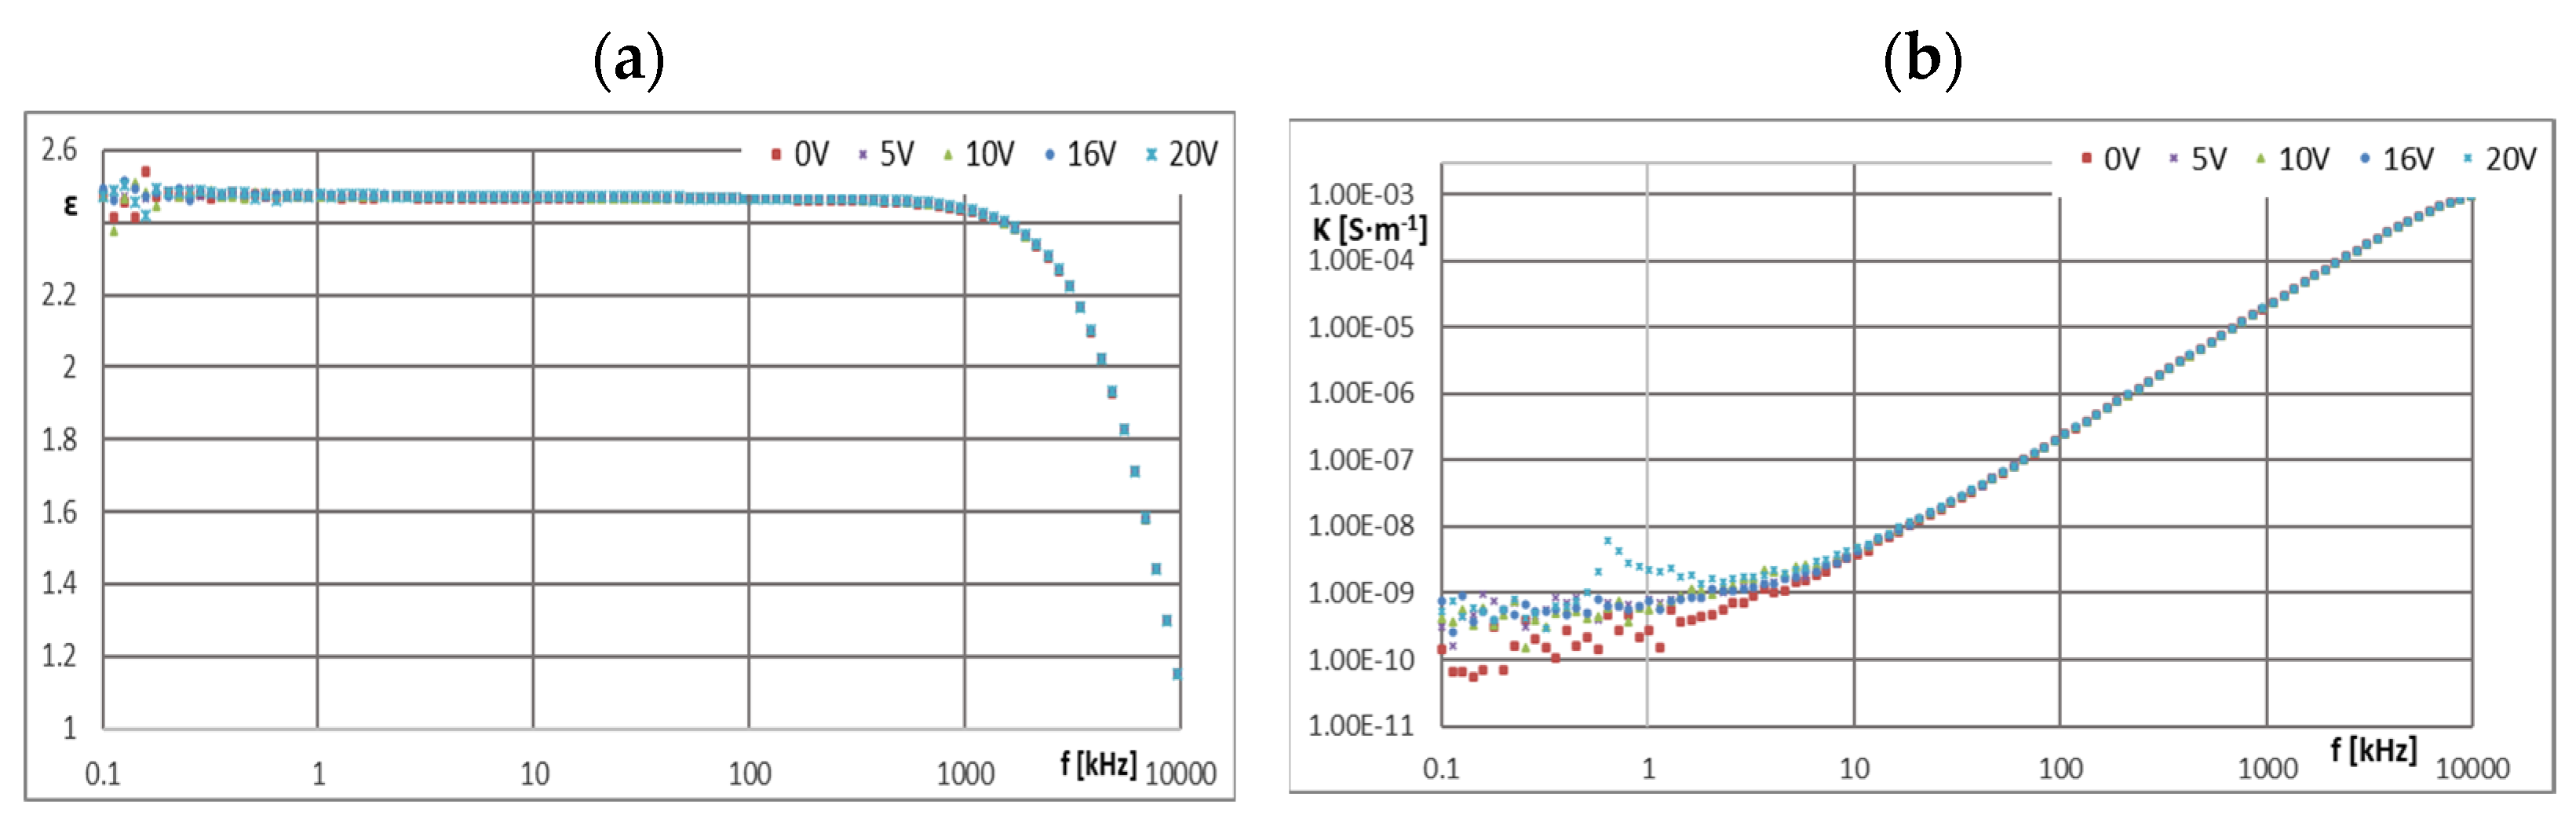
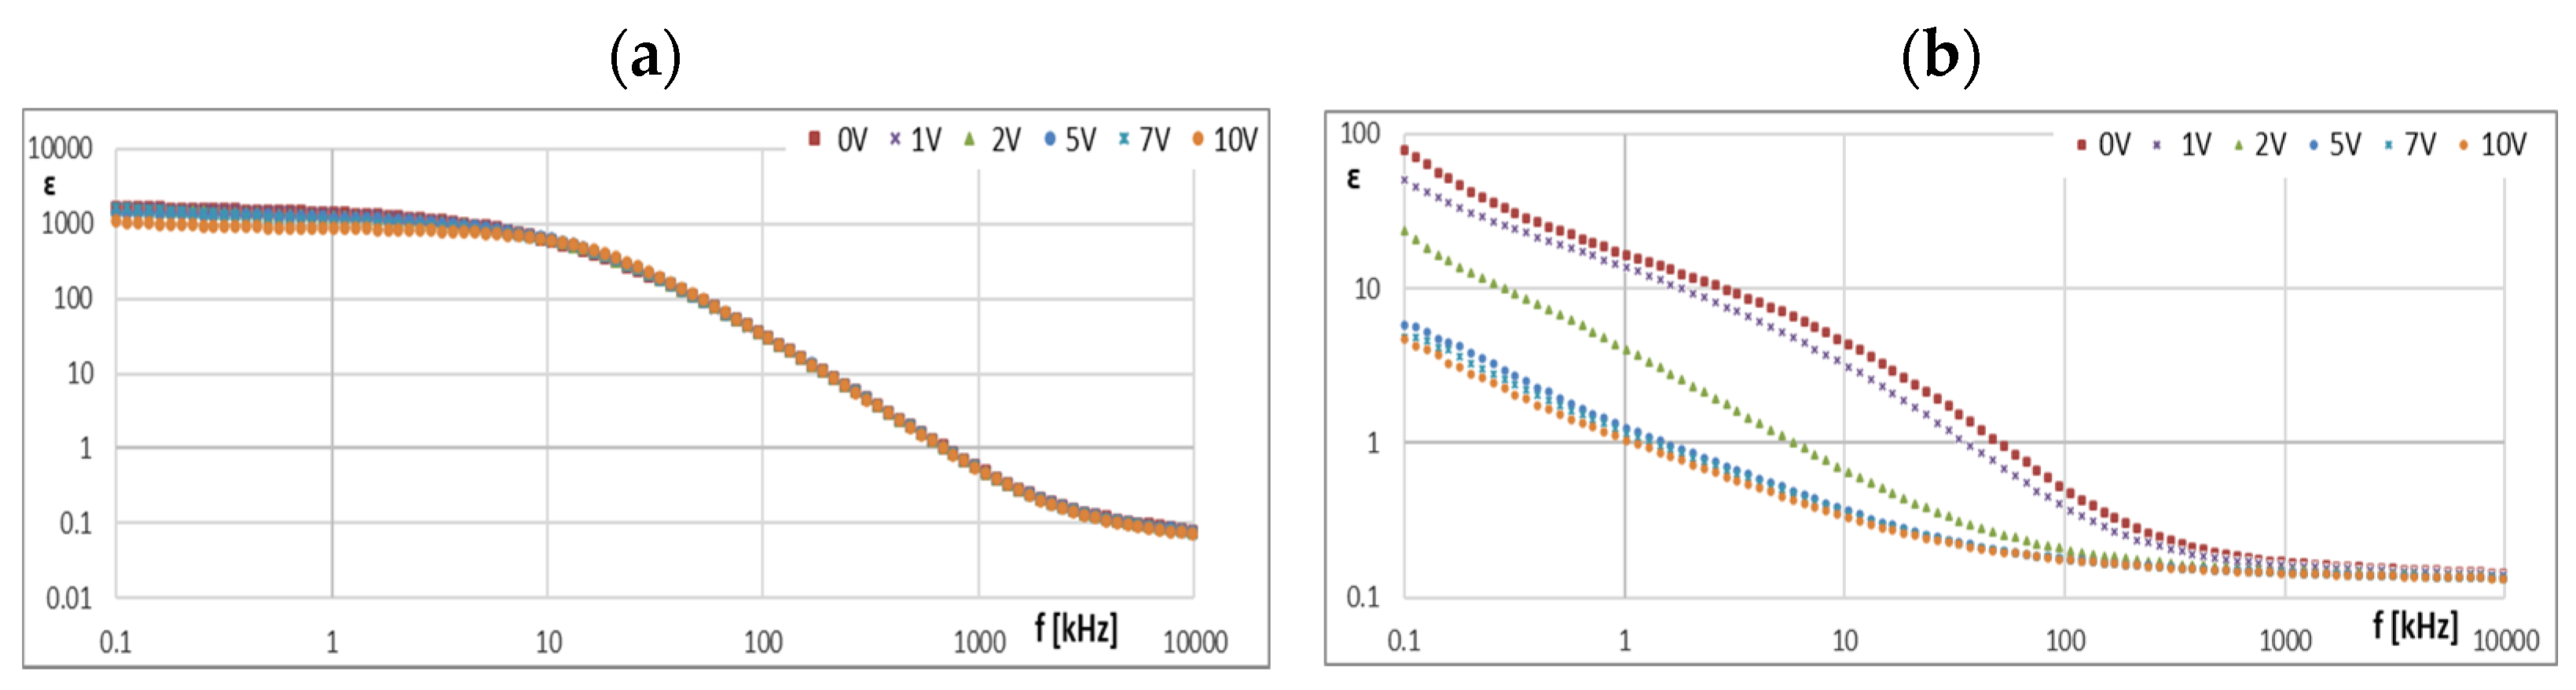
Figure 12). The obtained results determining the dielectric constant (ε) show that the ionic liquid CJ008, i.e., triheksyltetradecylphosphonium bis(trifluoromethylsulfonyl)imide, showed the highest value, which at
f = 1 kHz and BIAS (CD) voltage zero was
ε = 1127, while the ionic liquid CJ001, i.e., 1-methyl-3-oktyloxymethylimidazole tetra-fluoroborate, had this value slightly lower, i.e.,
ε = 1035 (
Figure 5a and
Figure 6a). Increasing the BIAS (DC) voltage caused a decrease in the value of (
ε), much more intense for the CJ001 Ionic liquid (
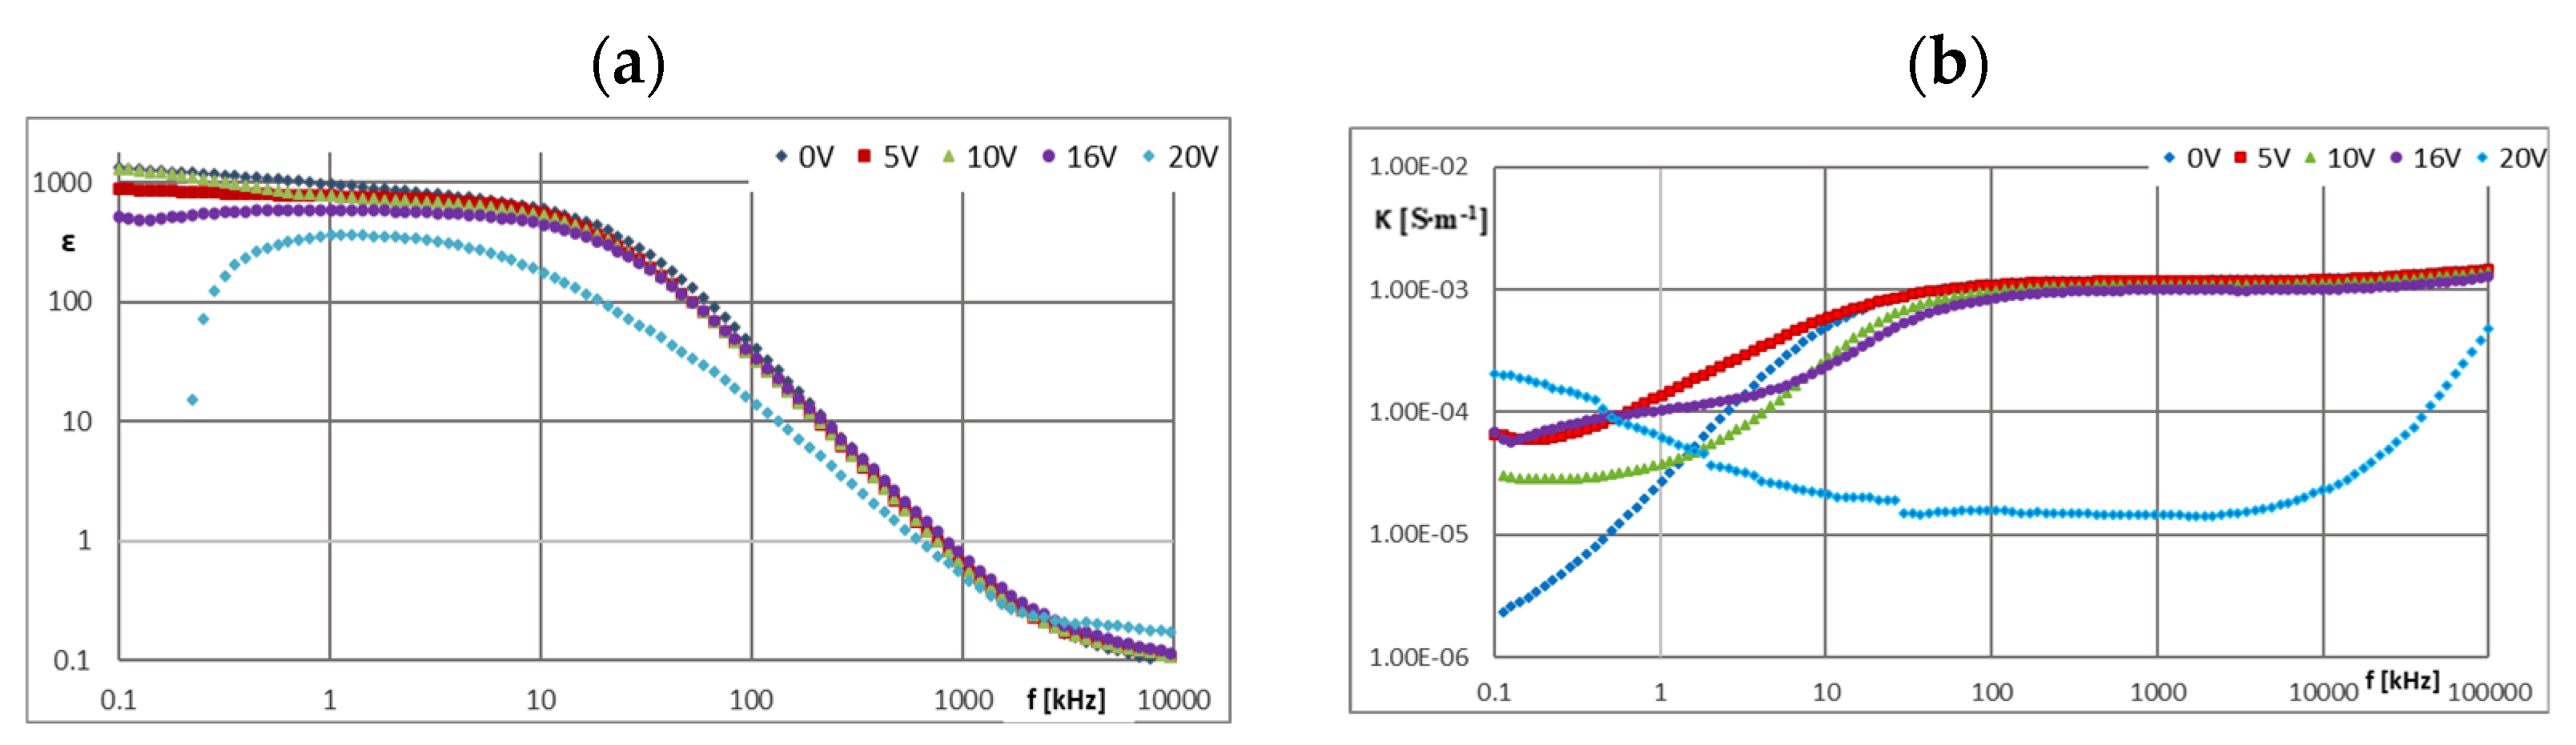
Figure 5a) than the CJ008 ionic liquid (
Figure 6a). This differentiation may result from the different number of paired ions in both liquids [
9]. Such ions have relatively low mobility and contribute to the permeability and relatively low frequencies–at higher frequencies, this effect disappears–faster in the CJ001 ionic liquid than in the CJ008 ionic liquid. This may be another indirect reason for obtaining a weaker ER effect for the mixture containing the ionic liquid CJ001. The values (
ε) of this liquid, at
f = 1 kHz and for
U 10 V, reached the range typical for dielectric and insulating liquids (
Figure 5a). In the case of CJ008, only the voltage
U16 V caused a significant decrease in (
ε)—
Figure 6a. The characteristics of
ε = f (
f) and
κ = f (
f) for ionic liquids show that measurements above 10 kHz have dubious analytical usefulness, and above 100 kHz do not make much sense because they are distorted by the specific properties of the ITO cell determined by the so-called cut-off frequency (
Section 2.4). The course of the characteristics
ε = f(
f)—(
Figure 5a and
Figure 6a) and
κ = f (
f)—(
Figure 5b and
Figure 6b) proves the strong influence of the BIAS (DC) field on ionic liquids and confirms the earlier assumptions that the large BIAS (DC) field was had a destructive effect on the tested ionic liquids and changed their properties.
Figure 12a,b show how the applied BIAS (DC) field influenced the further history of the sample of the CJ008 ionic liquid, i.e., the one that gave three times greater ER effect in the mixture with PAO6 than in the mixture with GP1 oil. Measurements as shown in
Figure 12a,b were repeated many times, obtaining results showing the same tendency. Treatment of the CJ008 ionic liquid with the BIAS field of low voltage (1~2 V) did not cause large changes, therefore the electric permittivity characteristics as a function of frequency were then usually similar and sometimes the same. It happened, however, that the characteristics for small voltages in
U5 V were “conquered” (i.e.,
Figure 5a and
Figure 6a)—it could have been caused by the variable mobility of ions. In general, the increase in BIAS (DC) voltage caused the electrical permeability of the liquid was decreased, and this could have a reduction of diversified value course even for the same liquid; for the same reasons above. In
Figure 12b, we can see that the earlier (previous—
Figure 12a) application of the constant voltage caused large changes. The measured values of the real part of the electric permittivity are many times smaller—in the example given in
Figure 12a,b, even almost a hundred times lower for
U = 0 and
f = 1 kHz. For this frequency and
U = 2 V, the value (ε) has reached the range typical for dielectric and insulating liquids. Thus, reapplication of the BIAS (DC) field voltage to the same sample of the CJ008 liquid. Accelerated the process of its destruction and led to the same state as in CJ001, which was so damaged even after a single BIAS field operation.
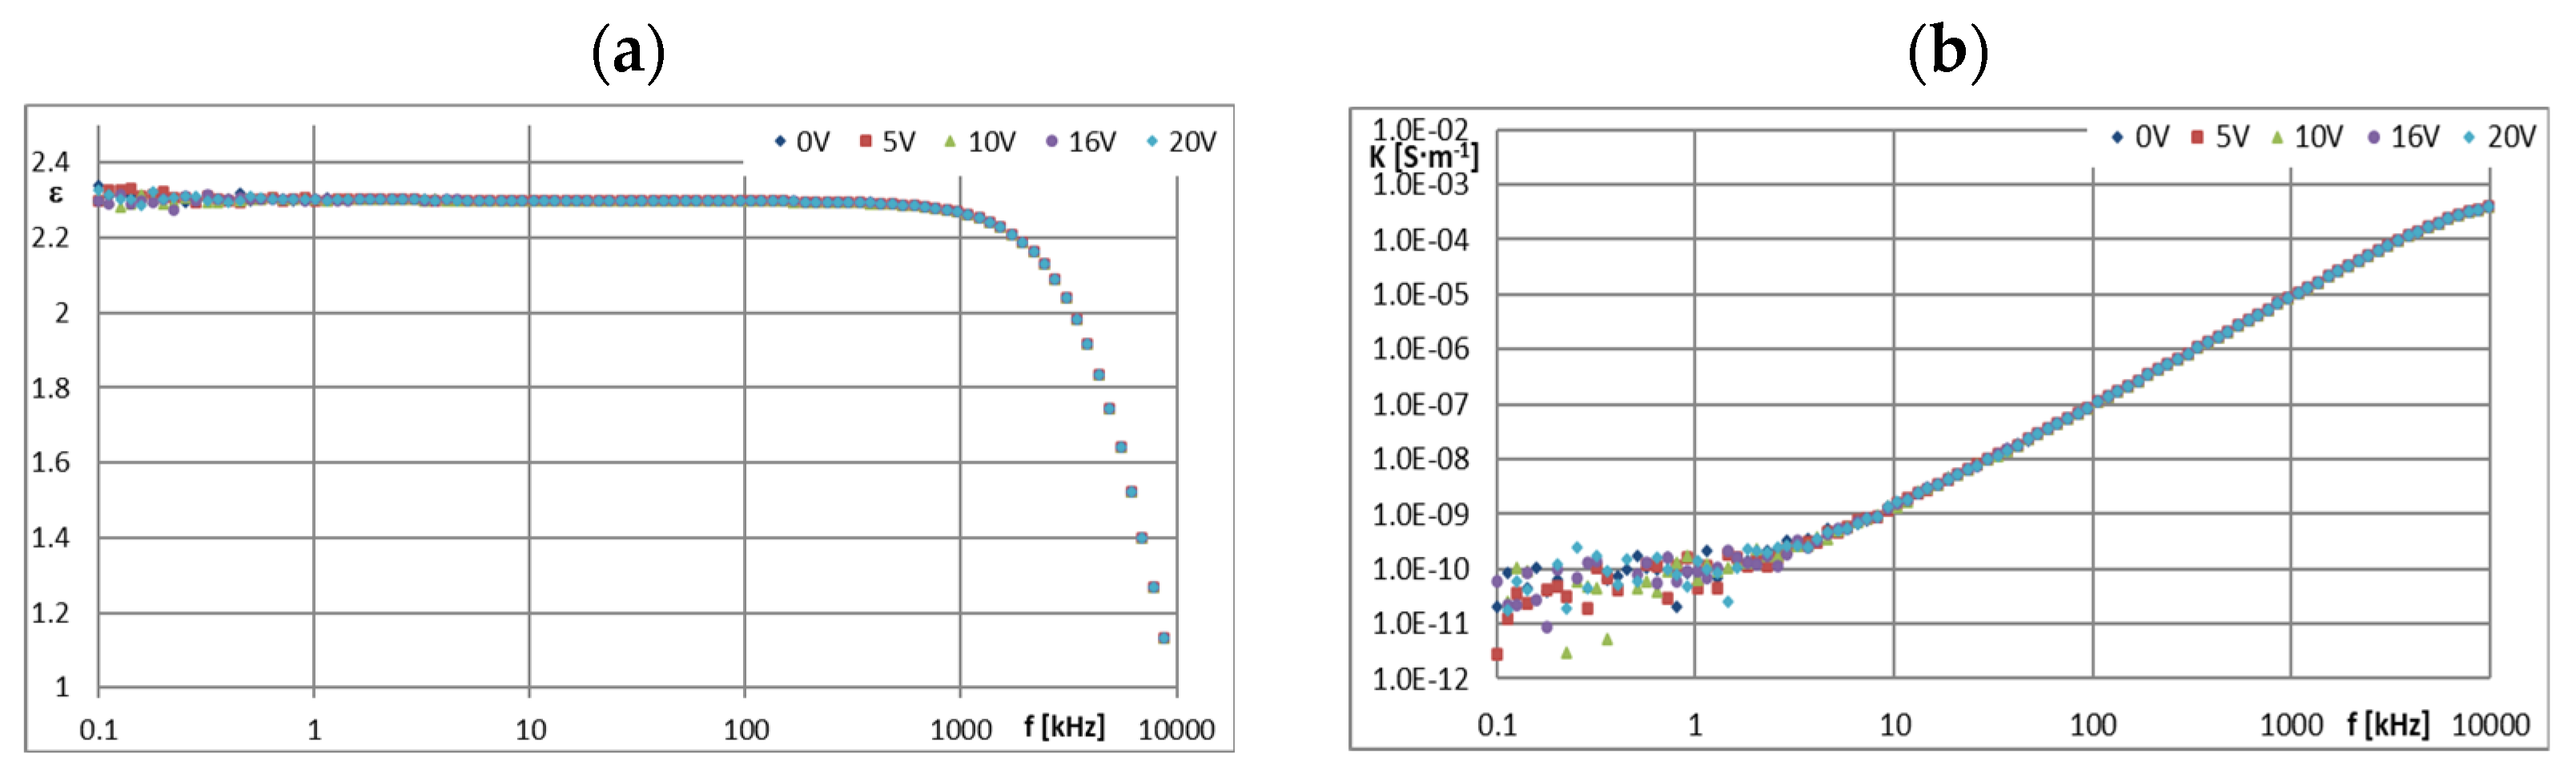
The PAO6 and GP1 base oils behaved completely differently. Their dielectric constants were stable both as a function of the BIAS (DC) field voltage increase and as a function of its frequency (
f), when a wide plateau was recorded, even above 100 kHz (
Figure 7a and
Figure 8a), and amounted to 2.02 and 2.30 respectively. This means that the dielectric properties of both base oils do not depend on the applied BIAS (DC) field. Increasing the (
U) value of this field did not cause any changes in the dielectric constants of both base oils.
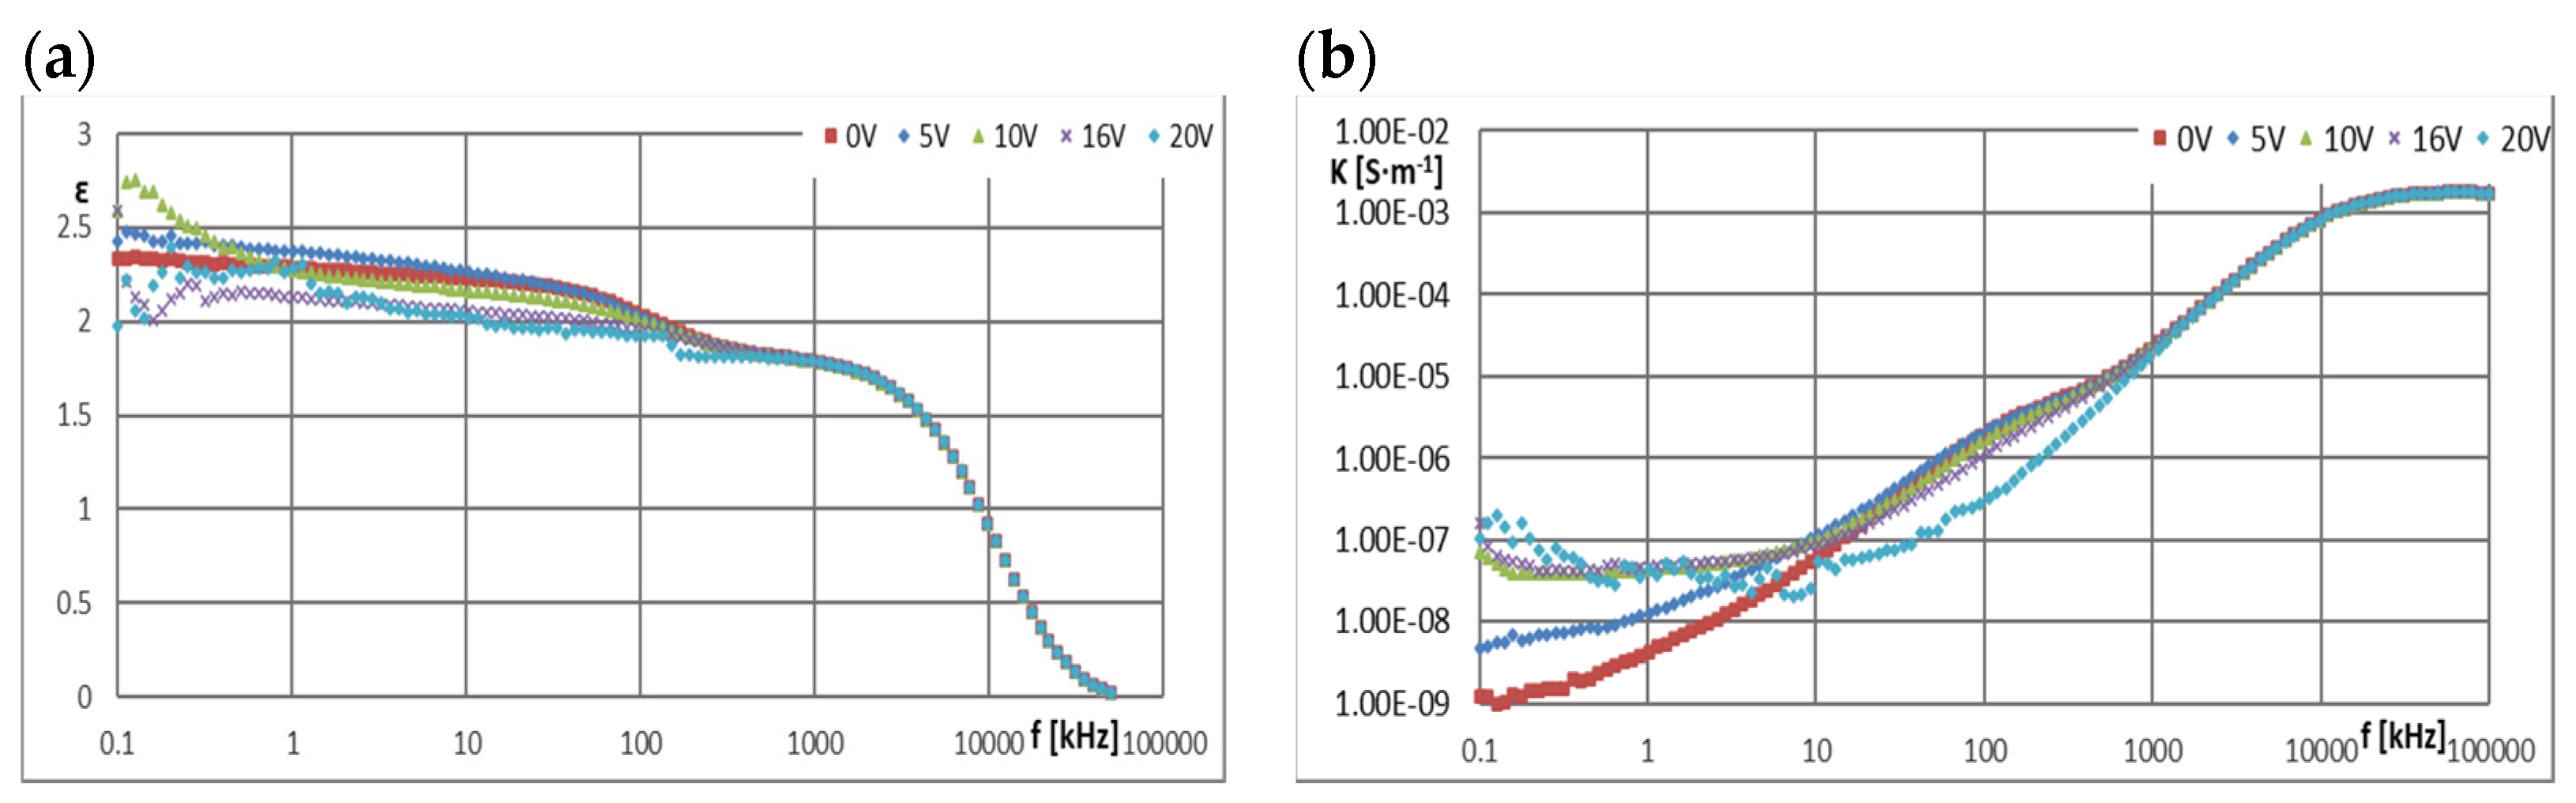
PAO6 and GP1 are non-conductive, which confirms their suitability as insulating liquids in ER mixtures. In the case of the tested mixtures GP1 + CJ001 and PAO6 + CJ008, a slight increase in the value of the dielectric constant (
ε) was observed in the area of a stable plateau (
Figure 9a and
Figure 10a). For the mixture GP1 + CJ001, this increase was 0.17 in relation to the base oil GP1 for which
ε = 2.30. A slightly greater increase in the dielectric constant value was recorded for the PAO6 + CJ008 mixture, i.e., by 0.26 in relation to PAO6 base oil, for which
ε = 2.02. In this case, the plateau was not so stable anymore. There was a slight decrease (
ε) in the range of 0~100 kHz and at the same time unstabilized values (
ε) for different values (
U), not necessarily related to the voltage increase. From a dielectric point of view, this slight admixture of ionic liquids practically did not cause any significant change. Increasing the BIAS (DC) voltage value from 0 to 20 V did not significantly affect the results of the measurements of the dielectric constant of the tested mixtures (
Figure 9a and
Figure 10a), as well as pure base oils (
Figure 7a and
Figure 8a). However, in the case of the PAO6 + CJ008 mixture (
Figure 10a), it can be seen that under the influence of the voltage
U > 0, alternately decreases and increases in the value (ε) were noted, denoting a continuous change in dielectric properties caused by probably chaotic movement of ions.
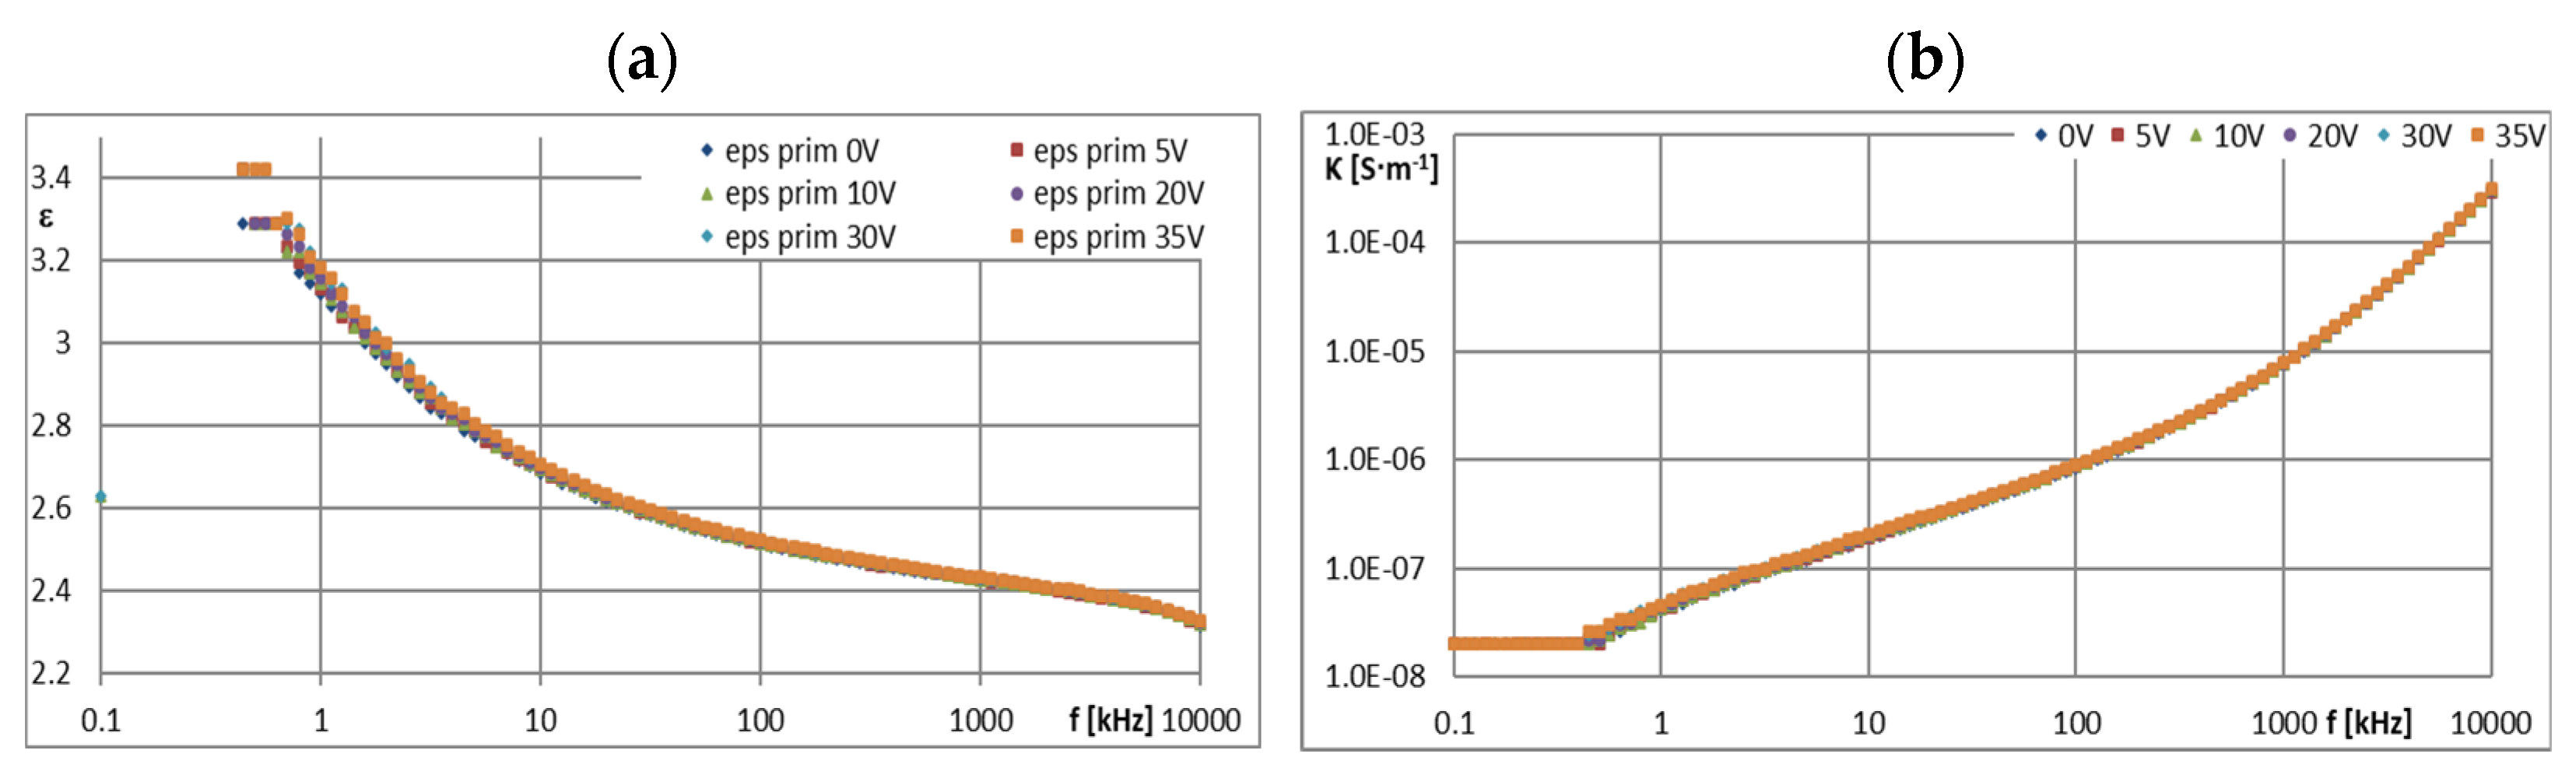
Figure 11a shows, for comparative purposes, the dependence (
ε) on frequency (
f) for ER LID 3354S liquid in the range from 0 to 35 V BIAS (DC) field voltage. This liquid showed a very high resistance to the BIAS (DC) voltage, but it did not plateau as a function of the frequency increase (
f); moreover, its dielectric constant (ε) recorded at
f = 1 kHz was a bit unstable (3.15–3.20) when changing the BIAS (DC) field voltage—however, without a clearly marked trend. This symptom was probably the result of the uneven dispersion of the solid polymer particles in the base oil of the LID 3354S liquid. At slightly higher frequencies (
f), regardless of the applied voltage, it had the same value, steadily decreasing gently in the function (
f), down to the value of about 2.5 at about 100 kHz (
Figure 11a). Simultaneously with the decrease in (
ε) as a function of frequency (
f), the conductivity (
κ) gently increased (
Figure 11b) and the resistance (
R) decreased accordingly. Due to the volume of this article, the resistance values are not shown. The greatest resistance was shown by GP1 silicone base oil, i.e.,
R = 3.2·10
9 Ω at
f = 1 kHz and
U = 0 V. The second liquid in terms of resistance value was the mixture GP1 + CJ001, with
R = 1.71·10
9 Ω. The third was the base oil PAO6 with a result of
R = 9.8·10
8 Ω and the fourth was the mixture of PAO6 + CJ008 with a result of
R = 1.14·10
8 Ω. In both mixtures, the admixture of the ionic liquid caused a decrease in their resistance.
The parameter opposite to resistance (
R) is conductivity (
κ). The ionic liquid CJ008 showed the highest value of electrical conductivity: at
f = 1 kHz and
U = 0 V was
κ = 2.73 × 10
−5 S·m
−1. In the frequency range
f = 1~10 kHz (
Figure 6b), numerous “defects” of the curves
κ = f (
f) were recorded as a result of chaotic movements of ionic in the electric field, more intense with increasing value (
U). Initially, at
U = 0 V, the conductivity (
κ) increased the increase of (
f). Then, with
U > 0, the characteristics,
κ = f (
f) was “boosted” (
Figure 6b). This was especially true of the CJ008 ionic liquid and the PAO6 + CJ008 mixture (
Figure 10 b). The second, highest conductivity value was found in the ionic liquid CJ001, for which
κ = 1.21·10
−5 S·m
−1. In
Figure 5b we can see that initially at
U = 0 V, the conductivity (
κ) increases with increasing frequency (
f). Then, at
U = 5 V, there is a “boost” of these values. The subsequent increase of the BIAS (DC) field voltage causes a significant decrease in the conductivity value and at
U = 20 V and
f = 1 kHz it was
κ = 2.18·10
−7 S·m
−1 (
Figure 10b).
The
κ = f(
f) characteristics of pure GP1 and PAO6 base oils, presented in
Figure 7b and
Figure 8b are typical for dielectric liquids and compatible with
ε = f(
f) and
R = f(
f) characteristics. The results of in situ microscopic tests of both mixtures, i.e., PAO6 + CJ008 and GP1 + CJ001, subjected to an external electric field, allowed us to recognize the course of the ER mechanism—confirmation of its occurrence and registration of symptoms of changes in the internal structure of the tested mixtures, leading to the disappearance of the ER effect (
Section 3.5). The same tests were performed for comparison with the commercial liquid LID 3354S [
32]. Selected photo sequences showing changes in the internal structure of the LID 3354S liquid are shown in
Figure 13a–f. These photos show the successive phases of the formation of the so-called “fibril chains” from polymer particles present in the silicone oil constituting the matrix (base) of the LID 3354S liquid. In the initial phase of observation (
Figure 13a), the electric field intensity was
E = 0 kV·mm
−1. Polymer solids were seen quite freely “suspended” in the base liquid. Small and sparse clusters of these particles were caused by their mutual molecular interaction resulting from their very high content (close to each other) in the base oil (37.5%
v/
v [
32]). Then, with an increased intensity of the electric field to the value of
E = 0.1 kV·mm
−1 (
Figure 13b), more and more numerous “chains” forming the structure of the network were observed. While increasing the electric field intensity to the value of
E = 0.2 kV·mm
−1 (
Figure 13c), the structure of the network became denser. The chains of polymer particles grew thicker and the network denser. While increasing the electric field intensity to the value of
E = 0.3 kV·mm
−1 and then
E = 0.4 kV·mm
−1 and
E = 0.5 kV·mm
−1, the formed network became denser and denser, especially in the zones adjacent to the electrodes (
Figure 13e,f). During these tests, the electric field intensity was increased to the value of
E = 0.6 kV·mm
−1, but the structure of the network was stable and did not undergo any further changes. This undoubtedly means that all polymer particles present in the liquid have been effectively “used” to build the chains and structure of networks responsible for the ER effect. After de-energizing, the formed network and chains separated and single nano- and microparticles “freely suspended” were visible again. In subsequent tests with the same portion of liquid, the electric field intensity was increased again in the range 0~0.4 kV·mm
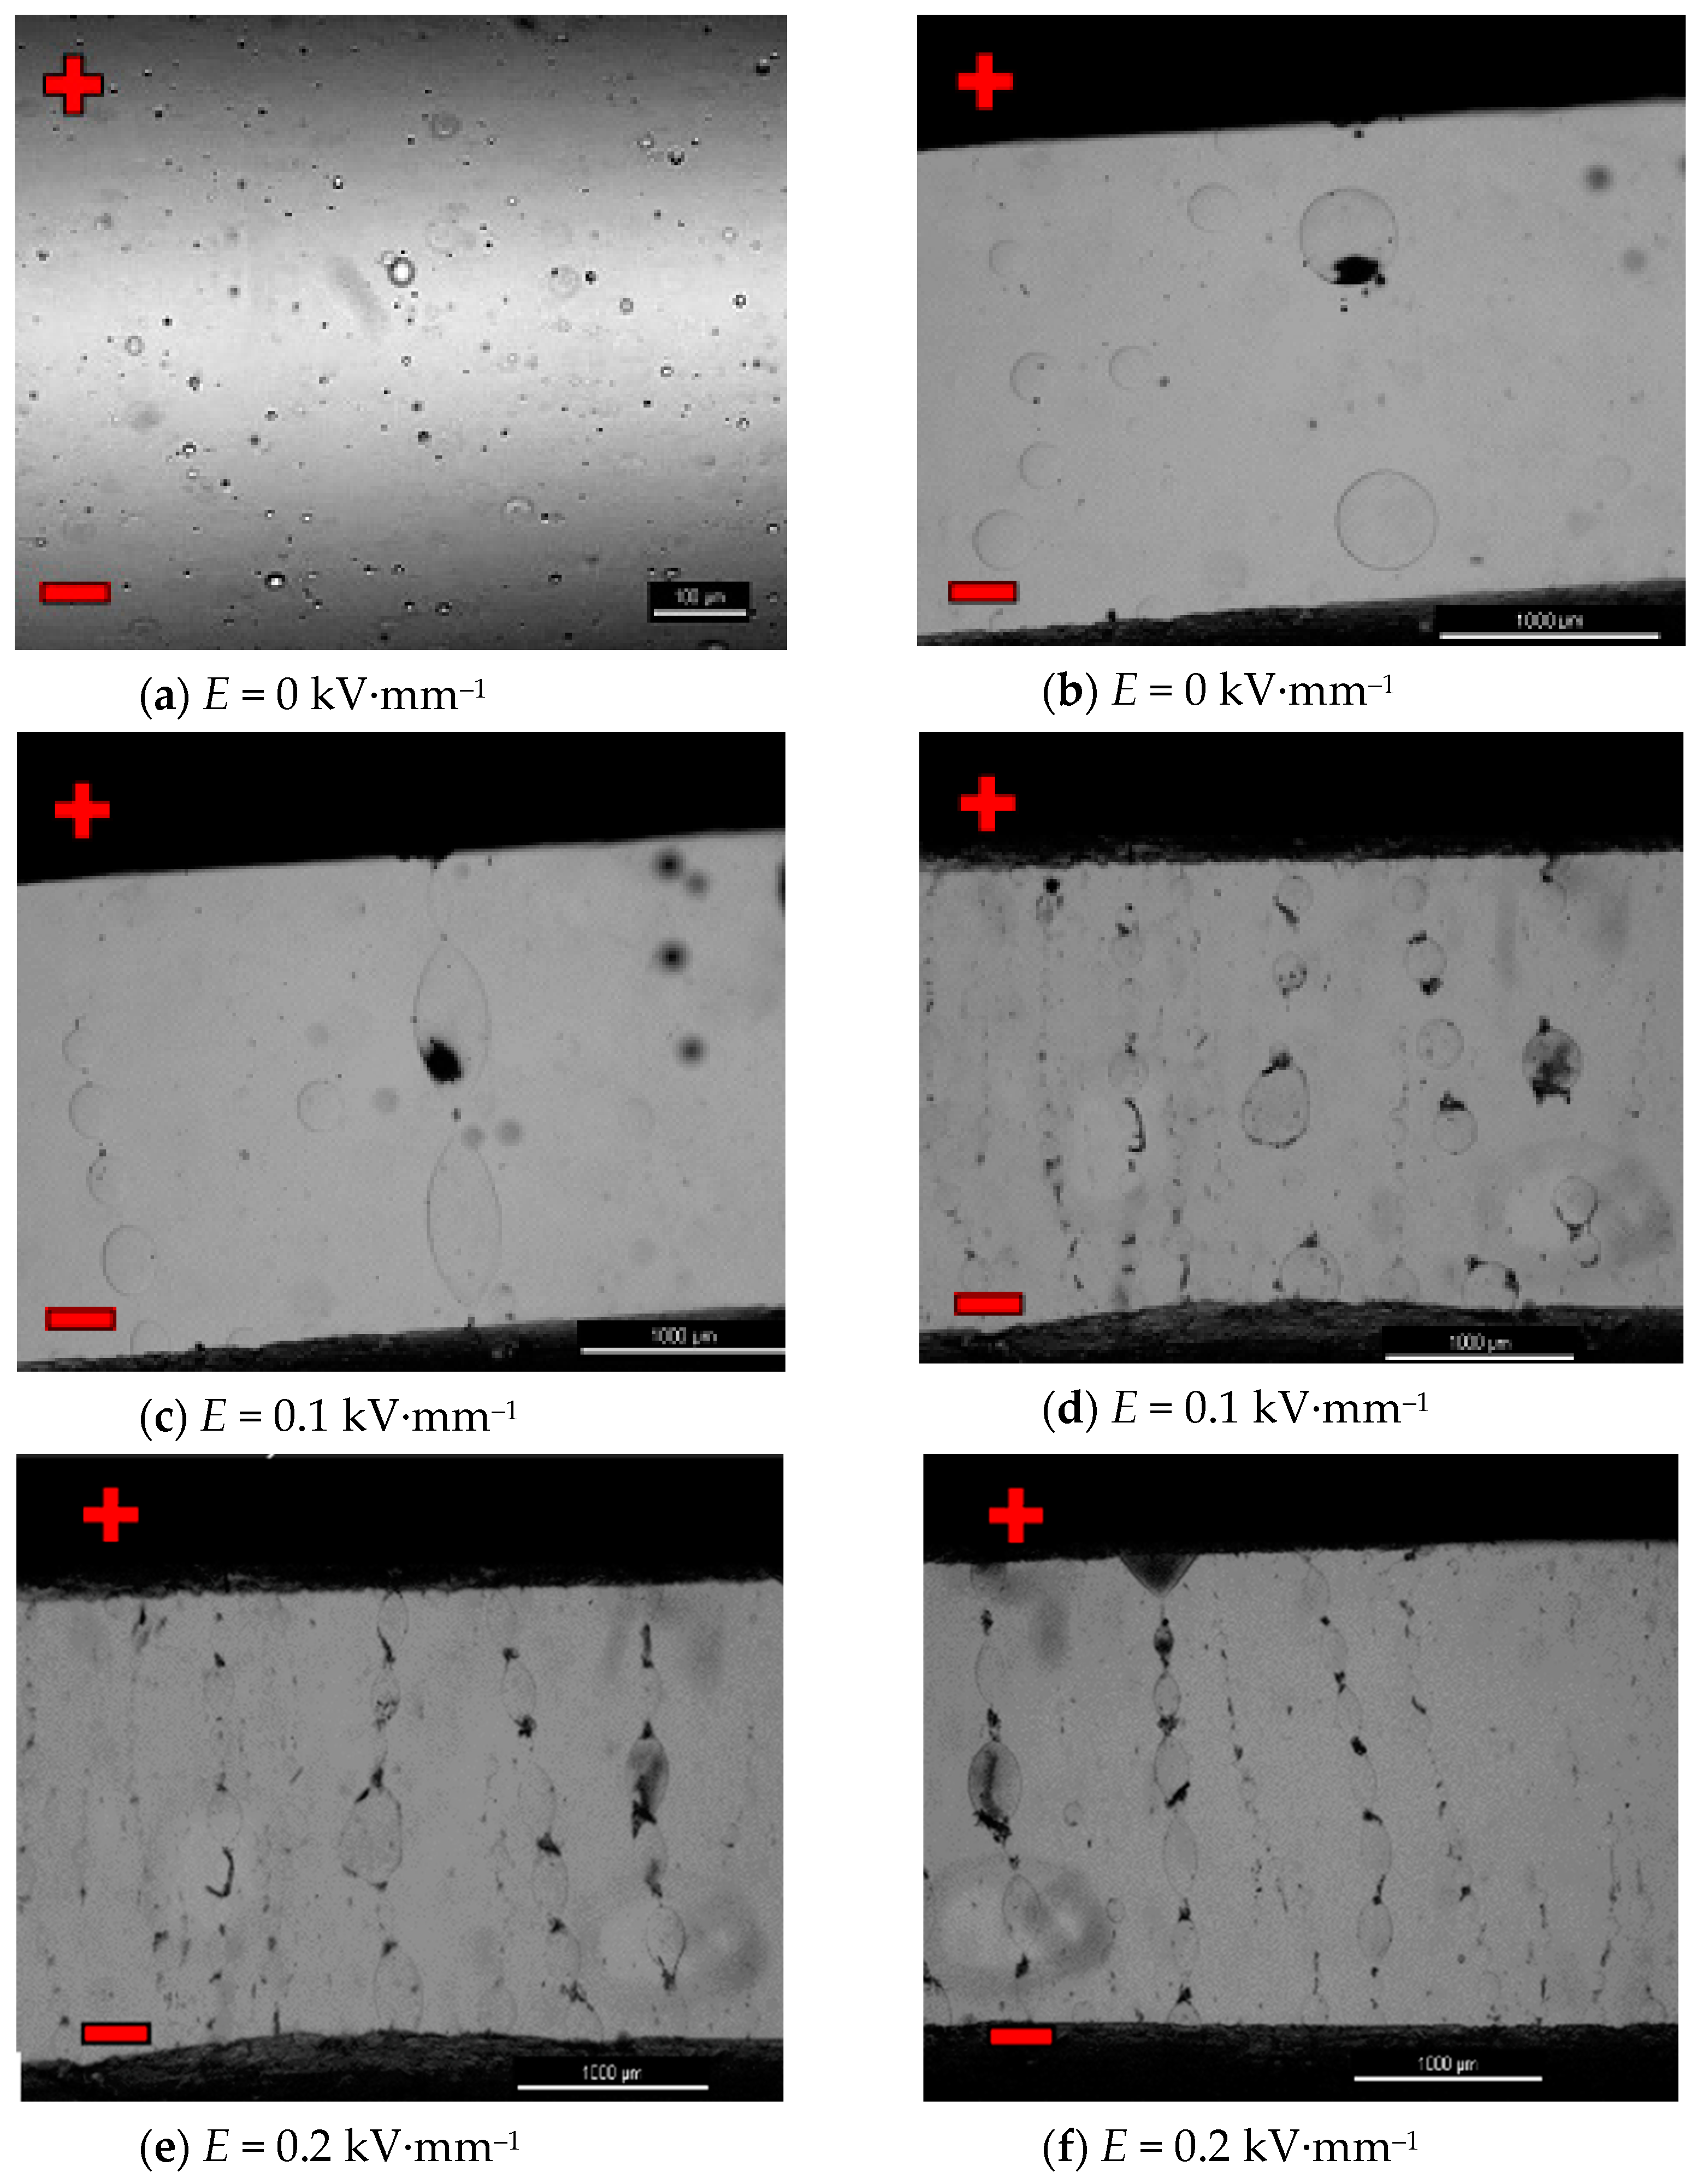
−1. Similar effects were observed in the first trial. Several attempts were made to increase and decrease the electric field intensity (also with changed polarity) for the same sample In each trial, the effects of creating and compacting the formed network of polymer particles in the LID 3354S liquid was predictable and the pattern of their formation was reproducible. The results of in situ tests of the PAO6 + CJ008 mixture (
Figure 14a–j), subjected to an external electric field with the intensity
E = 0~0.3 kV·mm
−1, were different. This time, a higher electric field intensity was unnecessary because the ER effect disappeared at
E = 0.3 kV·mm
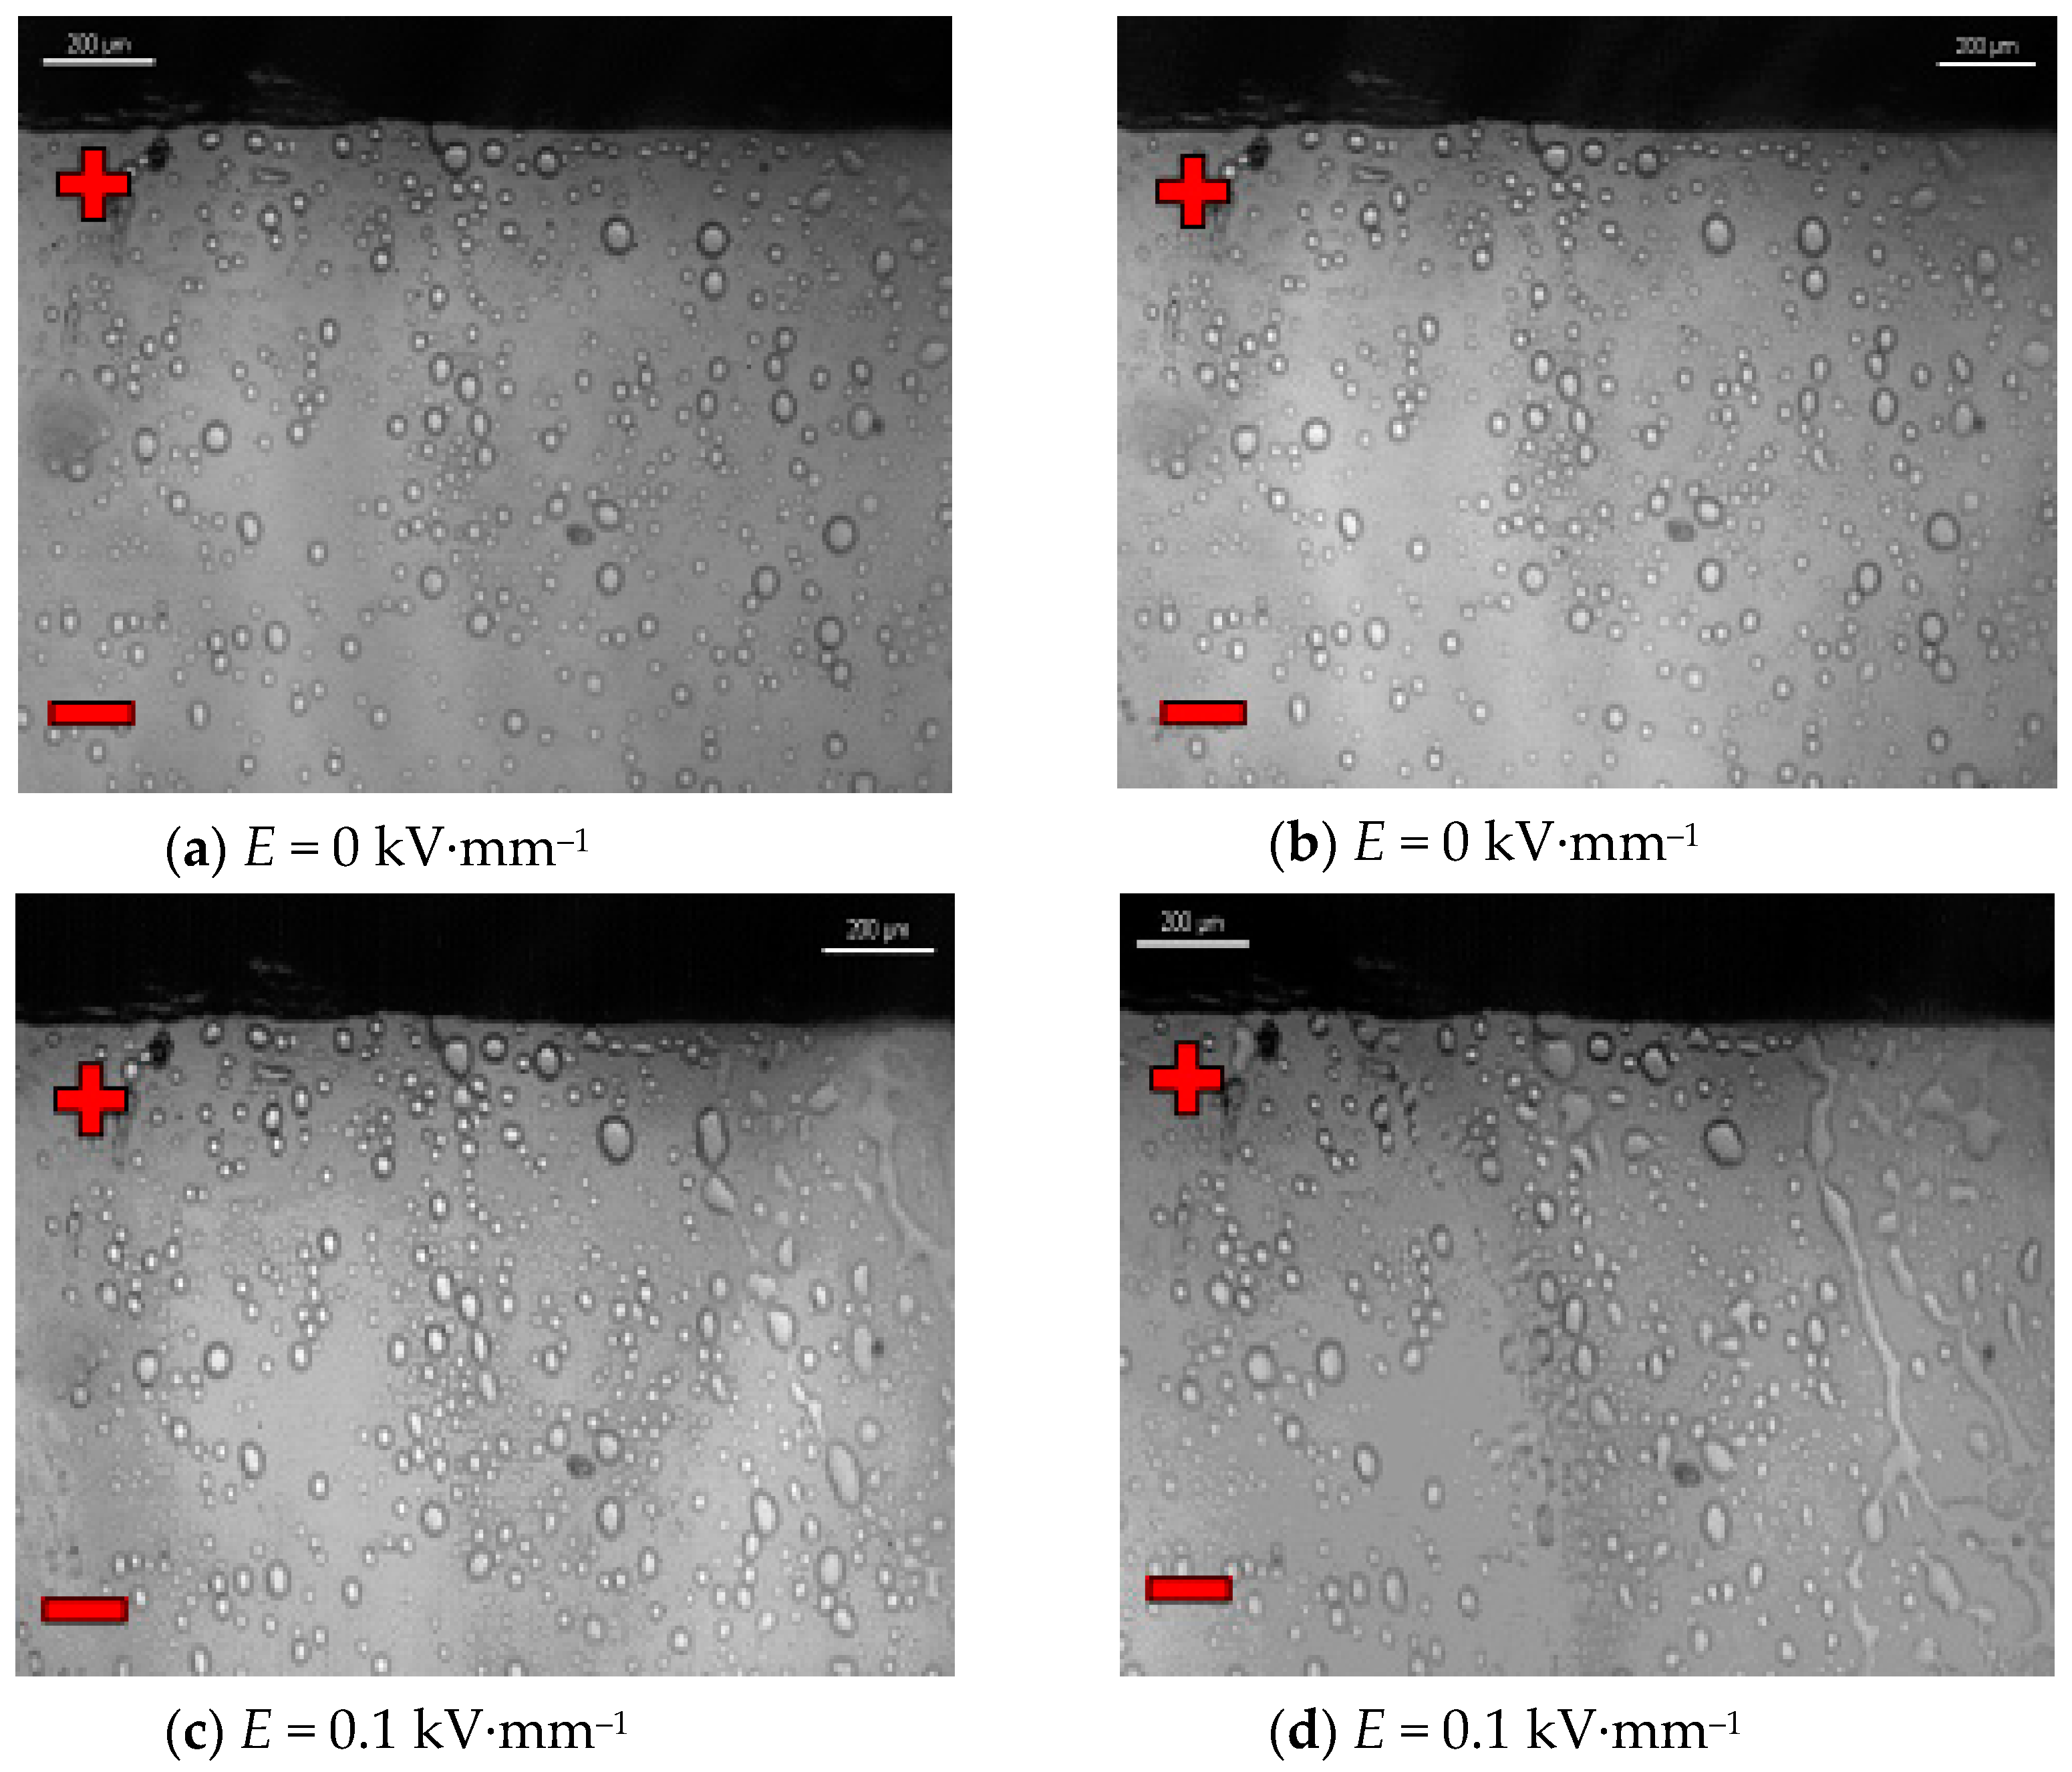
−1. As both components of the PAO6 + CJ008 mixture are transparent the observation of changes taking place in it was very difficult, compared to the observation with the reference liquid LID3354S Therefore, and also due to the high dynamics of changes in a short time, the registration of characteristics sequences was very complicated and tedious. However, they managed to capture the moment of formation of “fibril chains” from the CJ008 ionic liquid, somewhat differently than in the heterogeneous liquid LID3354S. Initially, when the electric field strength was zero (
Figure 14a), a large dispersion of the CJ008 ionic liquid nanoparticles in the PAO6 base oil was observed, although occasionally larger particles of the ionic appeared, indicating a certain heterogeneity of dispersion (
Figure 14b). Then, with an increased electric field intensity to the value of
E = 0.1 kV·mm
−1, the first symptoms of the formation of “fibril chains” were recorded, which were created by these slightly larger particles (most visible in the foreground).
Figure 14c shows the effect of an electric field of
E = 0.1 kV·mm
−1 on single particles of the CJ008 ionic liquid, which elongate and connect in a chain in direction of the field’s action, between the electrodes. The next photo (
Figure 14d) shows the formation of new “fibril chains” with the same value of
E = 0.1 kV·mm
−1. After a successive increase in the electric field strength to
E = 0.2 kV·mm
−1 (
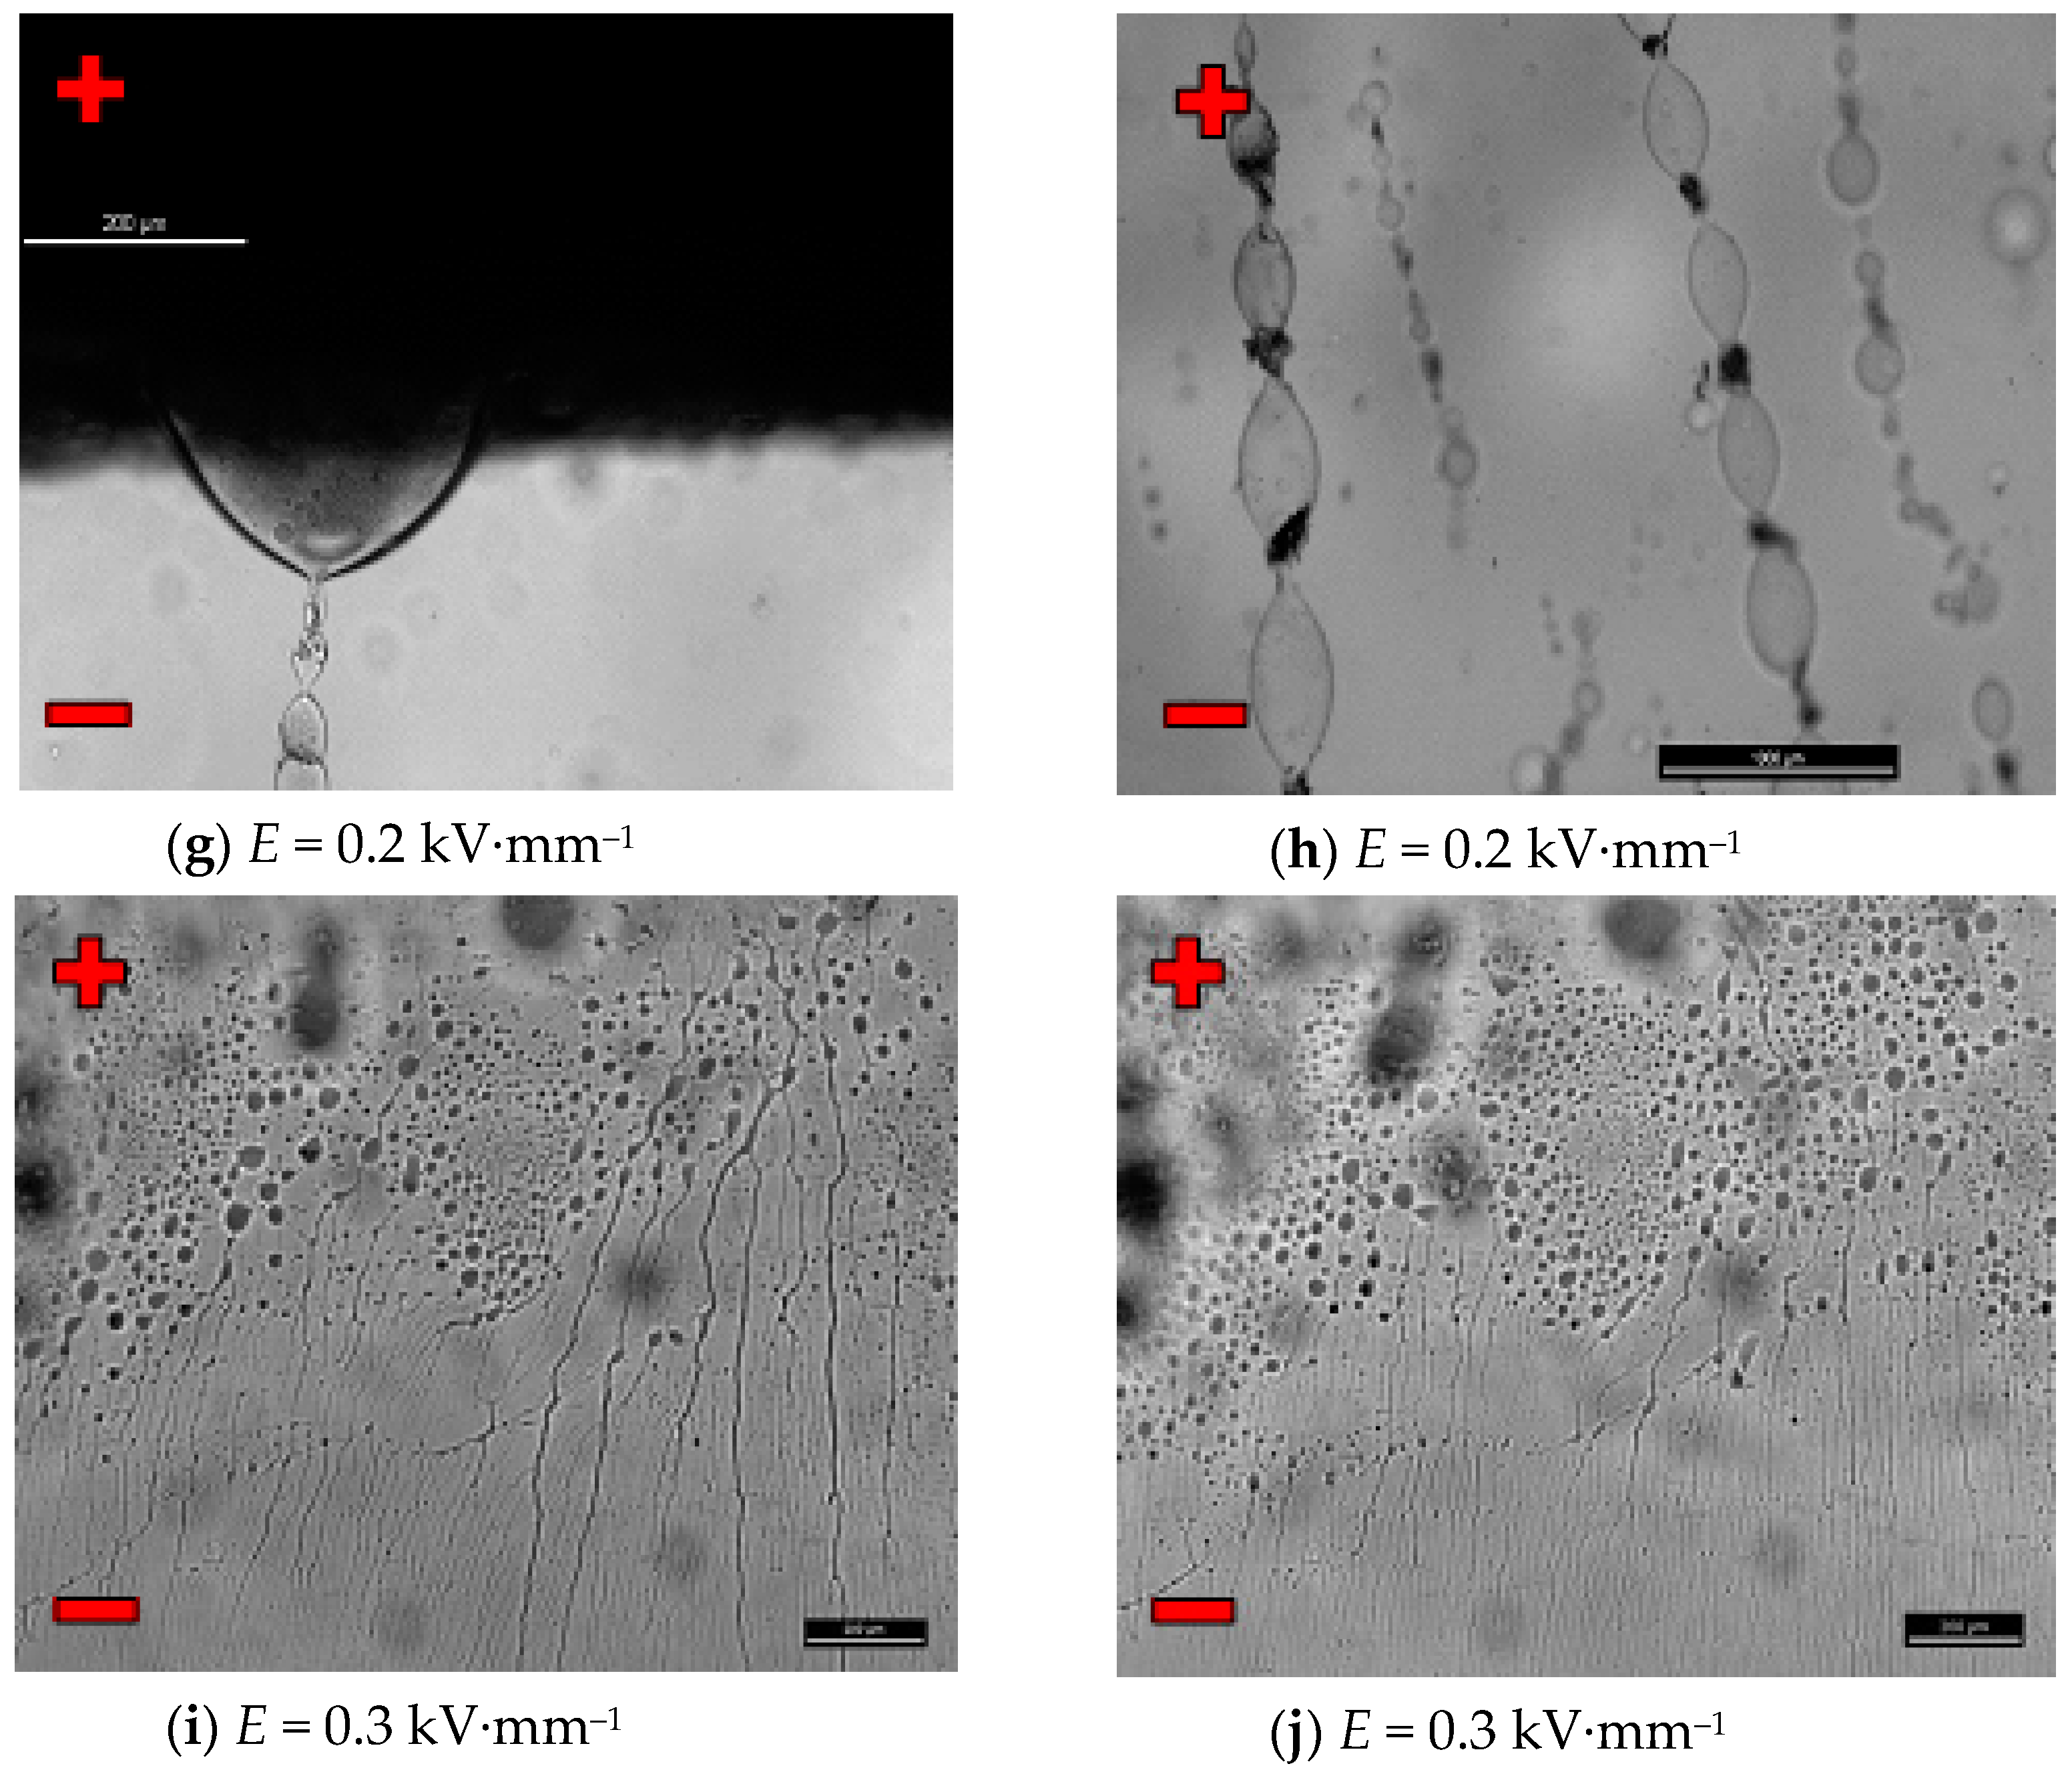
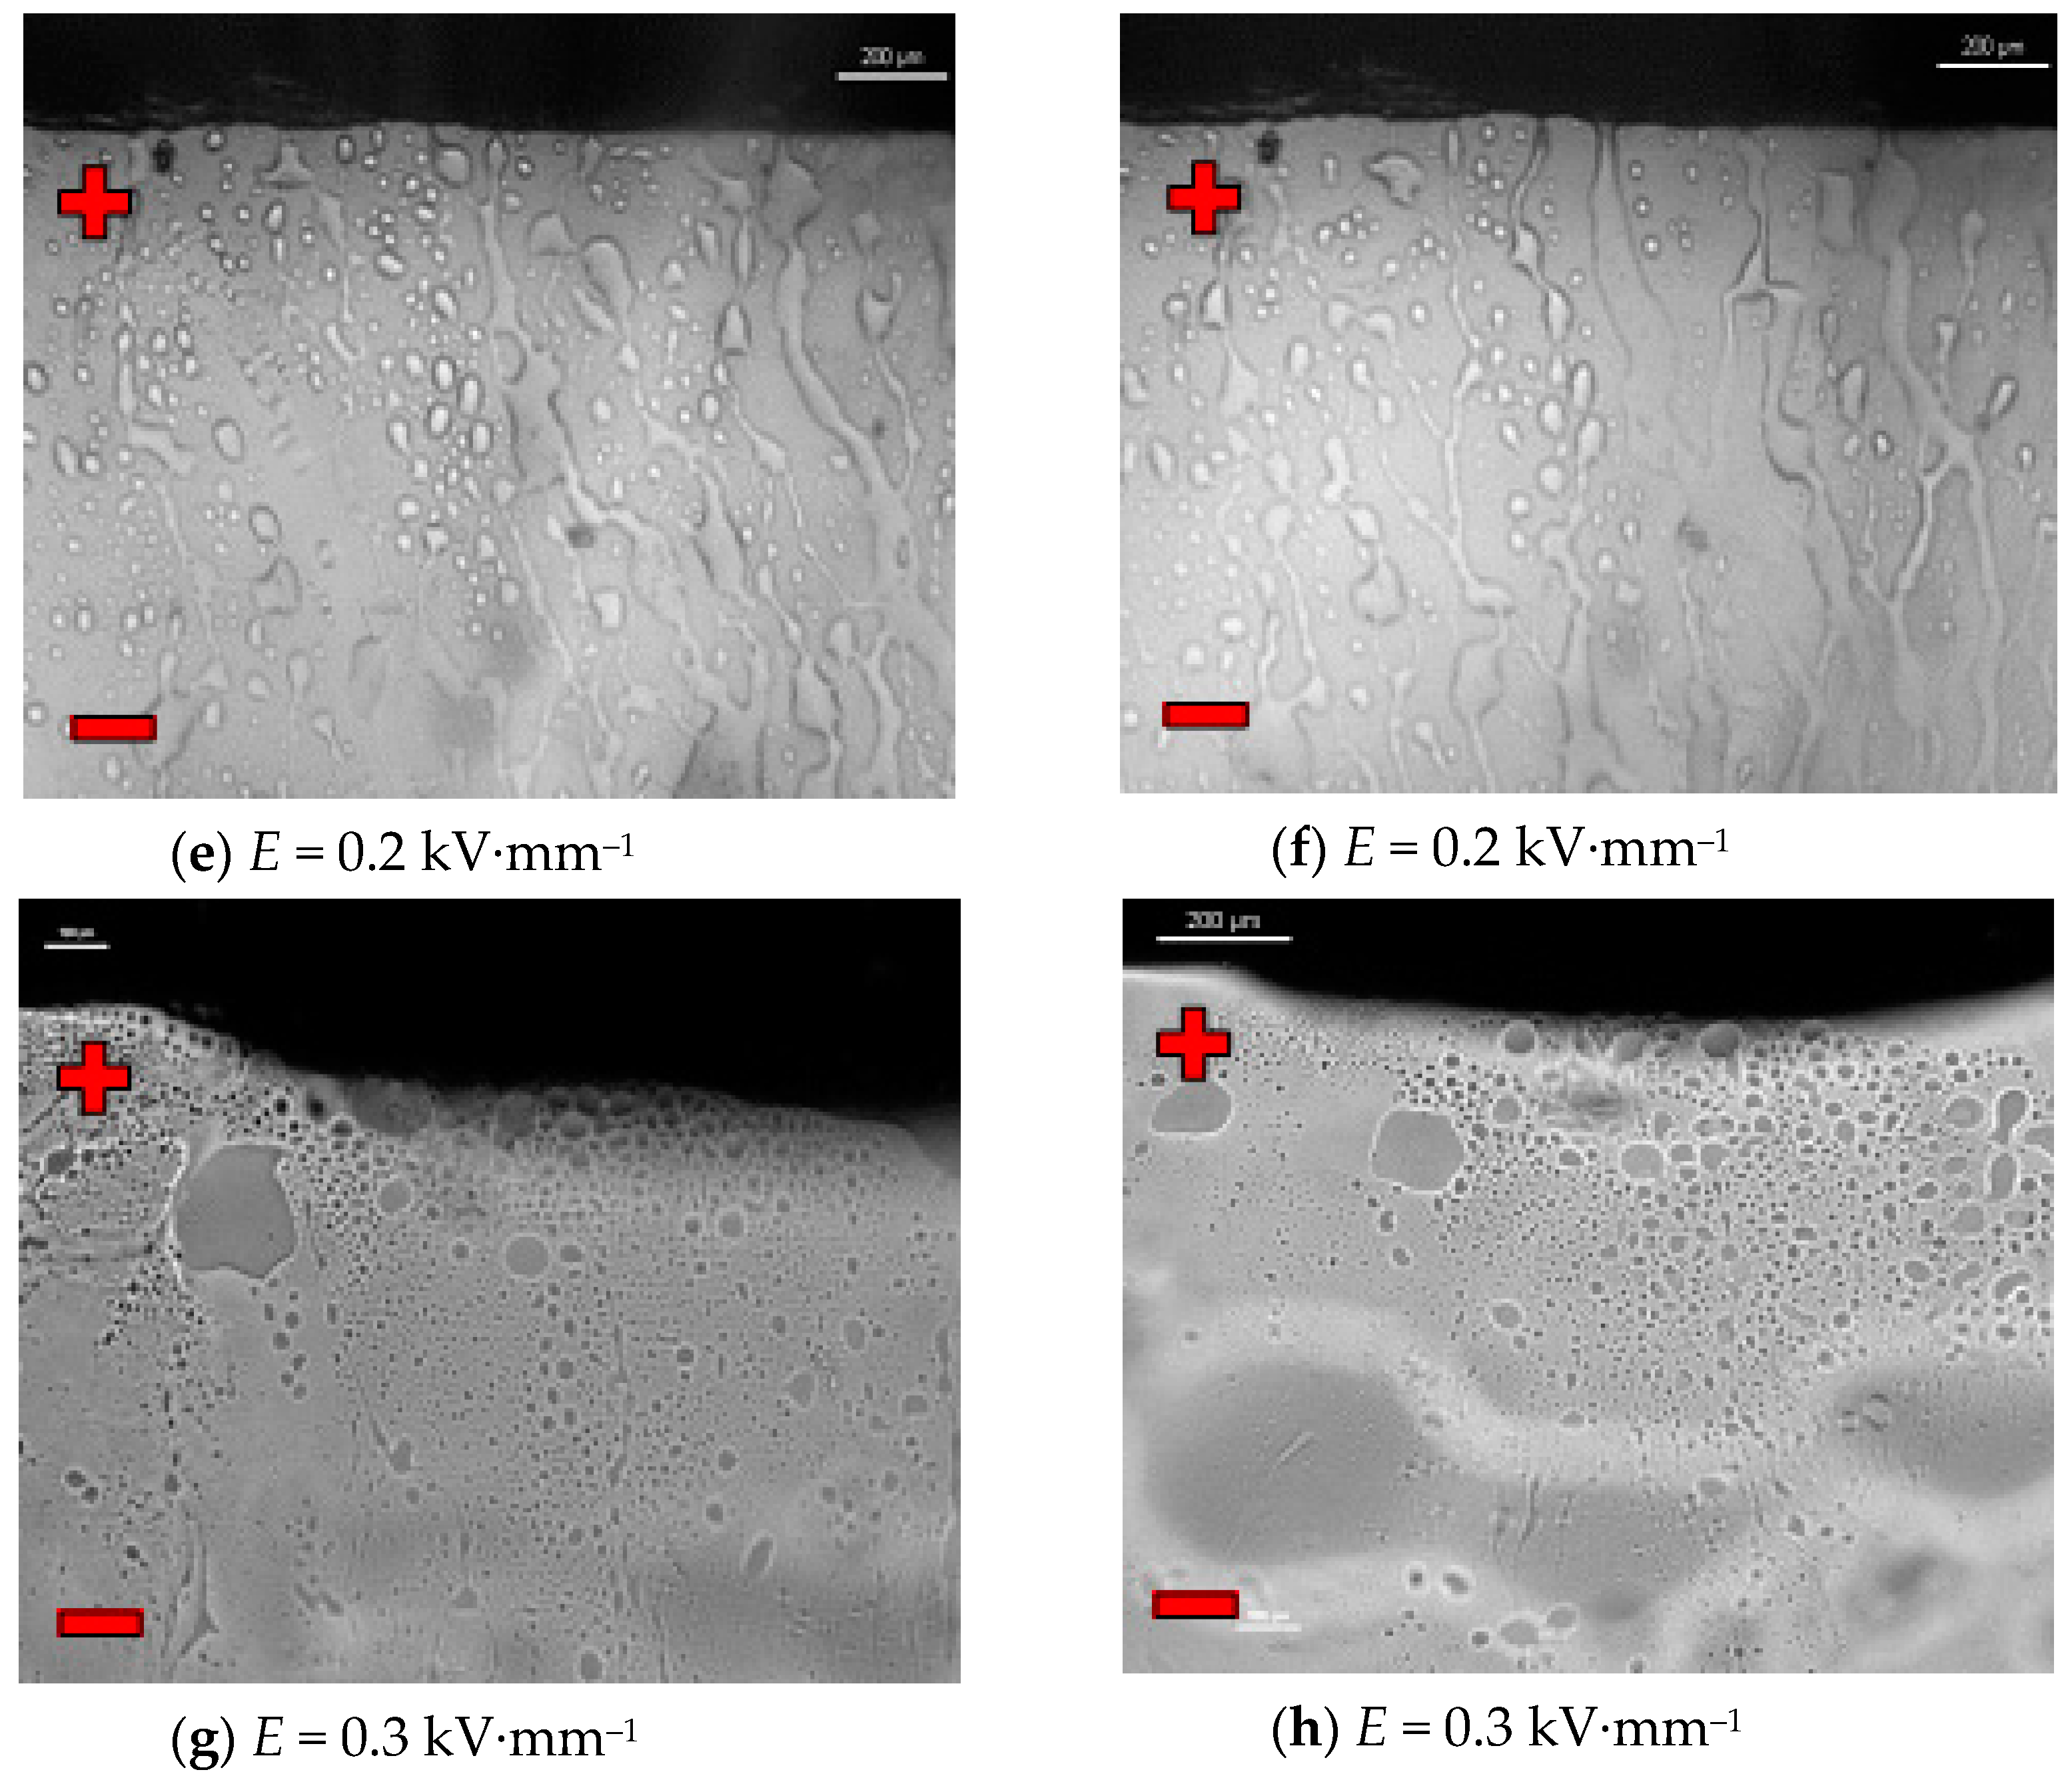
Figure 14e, f), the number of “fibril chains” increases, and subsequent particles of the ionic liquid combine into chains between the electrodes. However, there are no symptoms of the formation of a dense “fibrillary network”—as was the case with the liquid LID 3354S. On the other hand, the first single symptoms of ionic liquid accumulation at the electrode were observed (
Figure 14f,g).
Figure 14h shows the structure of the same chain in its central part. The dark spots visible in the photos, especially at the points of contact of individual particles of the ionic liquid in the “fibril chain”, are probably unidentified nanoparticles of impurities that easily cluster in the area of the strongest molecular and electrical interactions. By analyzing all the photos showing the so-called “fibril chains” of the CJ008 ionic liquid can be said to be rather single chains (unbranched, not linked to other chains) of particles serially connected to each other and “spread” between the electrodes. The particle sizes of the ionic liquid (micro/nano) are varied and random–resulting from the obtained dispersion of individual samples of the CJ008 ionic liquid in a mixture with PAO6 base oil. Further increase of the electric field intensity to the value of
E =
0.3 kV·mm
−1 resulted in gradual destruction of the previously formed “fibril chains” and the formation of ionic liquid clusters in the form of “streams” accumulating at the electrode (
Figure 14i,j). After disconnecting the power supply, the tested mixture did not return to the initial state presented in
Figure 14a—now the particles from the decay of “fibril chains” were permanently stuck at the electrodes (
Figure 14j). In subsequent trials with the same portion of the mixture, no effects of the formation of any “fibril chains” were recorded. Multiple changes in the polarity of the power supply with an external during the electric field, also did not bring any effect. The tested PAO6 + CJ008 mixture underwent destruction and the same portion of did not show any ER effect, previously not in the rheological test (
Section 3.3) and in the so-called dielectric spectroscopy (
Section 3.4). However, the PAO6 + CJ008 mixture showed, in the range of the electric field strength
E = 0~0.2 kV·mm
−1, a much greater increase in viscosity compared to the second tested mixture i.e., GP1 + CJ001 (
Section 3.3—
Table 3 and
Table 4).
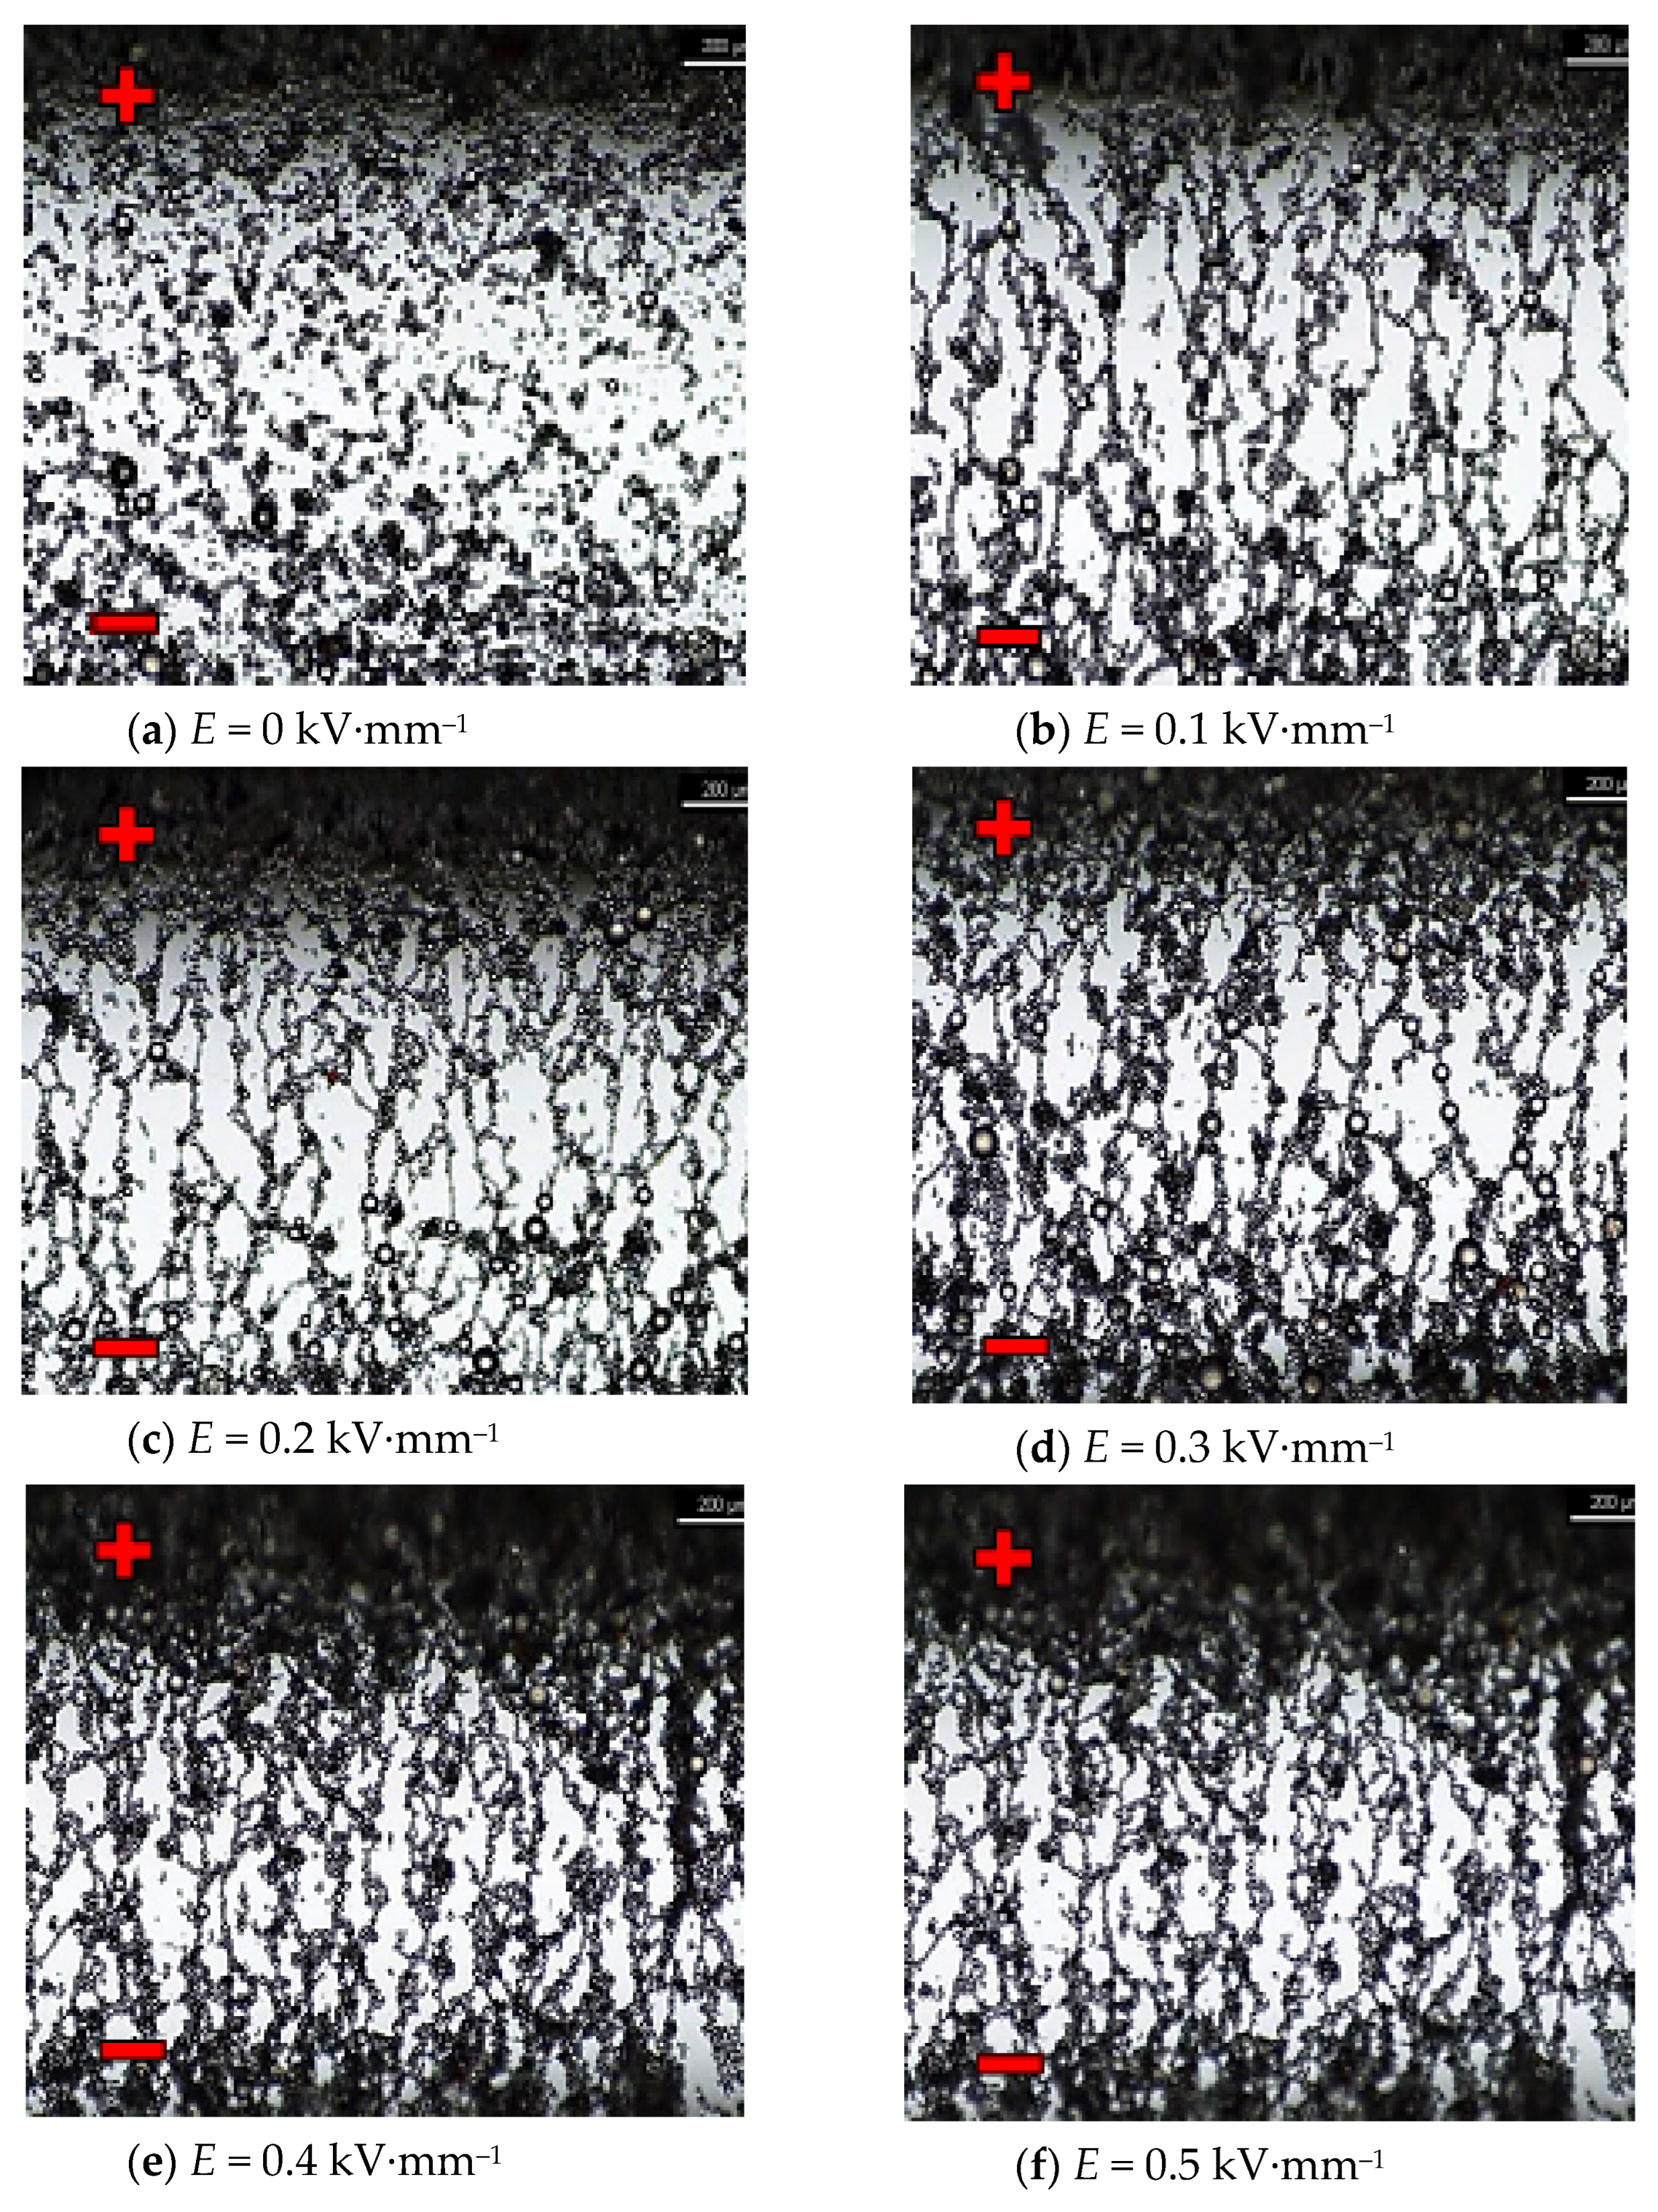
The following photos (
Figure 15a–h) show selected sequences showing changes in the internal structure of the mixture composed of the GP1 silicon damping liquid as a matrix and 2% (
v/
v) of the CJ001 ionic liquid, i.e., methyl-3-octyloxymethylimidazole tetrafluoroborate. This mixture was also tested only with an electric field strength
E = 0~0.3 kV·mm
−1, for the same reason as the PAO6 + CJ008 mixture. However, in this case, the process of creating and declining the ER effect was slightly different and much more dynamic. The obtained dispersion of the CJ001 ionic liquid in GP1 silicone oil was more uniform and homogenous (
Figure 15a,b) than that of the CJ008 ionic liquid in the PAO6 base oil (
Figure 14a,b), but the average particle size was larger. There was no such variation in mean particle size as before. As a result, the visible concentration of the particles of the CJ001 ionic liquid was slightly higher than that of the CJ008 ionic liquid. In the initial phase of the observation, when the electric field strength was equal to
E = 0 kV·mm
−1, the particles of the CJ001 ionic liquid did not change their position, size, or structure. Then, the observed sample was supplied with the electric field intensity
E = 0.1 kV·mm
−1. In the initial phase, single short chains appeared, in very short sections, arranged in the direction of the electric field, which joined together to form a stream of ionic liquid in the base oil, fulfilling the function of a “fibril chain” (
Figure 15c,d). In the next phase, after increasing the electric field intensity to the value of
E = 0.2 kV·mm
−1, the formation of successive streams of ionic liquid took place (
Figure 15e,f). After increasing the electric field strength to the value of
E = 0.3 kV·mm
−1, the chains were broken supply, the tested mixture did not return to the initial state presented in
Figure 15a. Microparticles from the decay of the “fibril chains (streams)” adhered permanently to the electrodes, forming the layer visible in
Figure 15g,h.
Figure 15g shows the decay phase of the streams and the accumulation of the ionic liquid at the electrode.
Figure 15h shows larger clusters of the ionic liquid lying at a short distance from the electrode. In subsequent tests with the same portion of the GP1 + CJ001 mixture, no ER effect was recorded, as in the PAO6 + CJ008 mixture. However, some differentiation of the course of the ER effect is visible, manifested mainly by different electrorheological characteristics (
Section 3.3—
Figure 4). As was said before, it was influenced not only by the different dielectric properties, but also by the physicochemical properties of the components of both mixtures. The recorded difference in the mechanism of the disappearance of the ER effect in both mixtures, especially the distinctly different course of the decay of the so-called “fibril chains (streams)” and the accumulation of the ionic liquid at the electrode, requires not only the previously discussed impact of the difference in viscosity of both components in the mixtures, but also the probable influence of their surface tension. It seems that the recorded effect is different for the GP1 + CJ001 mixture (
Figure 15g,h) than for the PAO6 + CJ008 mixture (
Figure 14i,j), as well as the differentiation of the electrorheological characteristics of the GP1 + CJ001 mixture in relation to the characteristics of the PAO6 + CJ008 mixture (
Section 3.3—
Figure 4), could also have been influenced by a significant difference in by a significant difference in the surface tension of the components of the GP1 + CJ001 mixture (
Section 3.2—
Table 1). It was found that at 25 °C the surface tension of GP1 oil was 19.547 mN·m
−1, and the CJ001 ionic liquid was 26.032 mN·m
−1, while in the second mixture the surface tension of both components was almost the same, for PAO6 was 27.523 mN·m
−1 and for CJ008—28.099 mN·m
−1. Additionally, the different rheological characteristics of both mixtures, i.e., GP1 + CJ001 (Bingham) and PAO6 + CJ008 (Newton) were directly influenced by the diverse chemical structure of their components. In the first case, one deals with a complicated structure of the GP1 damping oil, which is a mixture of polymethylsiloxanes with an admixture of CJ001, i.e., 1-methyl-3-octyloxymethylimidazolium tetrafluoroborate (
Table 3), and in the second case, it was PAO6 hydrocarbon polyolefin base oil with an admixture of CJ008, i.e., trihexyltetradecylphosphonium bis(trifluoromethylsulfonyl)imide (
Table 4). In both cases, it was not possible to obtain fully homogenous mixtures (
Figure 14a and
Figure 15a), which determined the occurrence of additional internal friction in the mixtures between their components. In the case of the PAO6 + CJ008 mixture, the formation of typical “fibril chains” was recorded (
Figure 14) and much slower degradation as compared to the GP1 + CJ001 mixture was observed. GP1 + CJ001 mixture suddenly revealed the degrading CJ001 ionic liquid as exposed to the external electric field “streams” (
Figure 15). From the chemical structure point of view, the components of the GP1 + CJ001 mixture are less compatible than the components of the PAO6 + CJ008 mixture. Moreover, the oxygen incorporated in the alkyl chain may cause its disintegration, which in turn may cause the mixture to lose its ER properties faster. The measurement technique may occur as an additional reason for the differentiation of the characteristic of both mixtures. In our study the rotational viscometer was used, the mixtures were subject to mechanical mixing, which may favor their disintegration. Previous own research [
1,
2,
3,
4,
16] also showed that the tribological properties of the discussed ionic liquids are exceptionally good. The assessed lubricity parameters of these ionic liquids were much better, not only than base oils, but also brand engine and transmission oils. Anyway, information on very good tribological properties of various ionic liquids is quite common in the world tribological literature (e.g., [
5,
6,
12,
13,
37,
38]). Thus, the observed effect of ionic liquid accumulation at the electrodes, after the destruction of the “fibril chains” under the influence of an external electric field, may have a positive effect on the creation of the lubricating boundary film.


