1. Introduction
Gas turbine engines used in aerospace are among the most complex mechanical systems. The engines operate at increasingly high turbine inlet temperatures to satisfy ever-increasing working demands. Turbine blades work in temperatures very close to the melting point of the material they are made of. They are internally cooled by the air passing through intricate passages within the blade geometry to decrease the blade temperature during operation. A more complicated cooling is based on the method called “blade film cooling”, based on the supply of cooler air through small channels to the blade’s surface to eliminate direct contact with the gas flowing out of the combustion chamber [
1,
2].
Currently, commonly used materials are superalloys characterized by an imposing combination of high-temperature strength, phase stability, and resistance to high-temperature oxidation [
3,
4]. For example, their leading representative is a nickel-based second-generation CMSX-4 superalloy supplied by Cannon-Muskegon. The complex loads during the service of the blades mean that they must be resistant to high-temperature tensile strain and creep; these requirements are met by CMSX-4 superalloy [
5,
6,
7]. The single-crystalline casts of CMSX-4 cast have high phase stability and homogeneity of the dendritic structure [
8,
9], as well as resistance to high-temperature corrosion [
4,
8].
The strength properties of particular grades of other applied superalloys, e.g., Rene supplied by General Electric, Inconel supplied by Special Metals Corporation, PWA supplied by Pratt and Whitney, and RR supplied by Rolls Royce, have been successively increased in subsequent generations.
The single-crystalline blades are usually obtained by directional crystallization using the Bridgman technique. The groups of dendrites formed during crystallization commonly create an array with a preferred crystal orientation of [001]-type, which should be parallel to the withdrawal direction [
1,
10].
During crystallization, various types of defects are formed, such as freckles [
11,
12], slivers [
13,
14,
15], and subgrains separated by low-angle boundaries [
16,
17], which may negatively affect the strength parameters of the blades [
18,
19,
20]. Misorientation of neighboring subgrains is caused by the deformation of dendrites during solidification, among other reasons [
21,
22,
23]. Dendrite deformation results in small crystal lattice rotations and, thus, in the non-parallel growth of neighboring dendrites. Several reasons for dendrite deformation exist, for which morphological and mechanical bending can be distinguished [
24]. Morphological bending is related to the changes in the local chemistry of the liquid phase influencing the growth direction of a dendrite without changing the crystal orientation of the dendrites. It is related to the so-called dendritic segregation of alloying elements [
25,
26,
27,
28,
29]. If, in addition, there is a change in the crystal orientation of the growing dendrite, it is a mechanical bending related to the local distortion of the crystal lattice with a change in the lattice parameter, and hence the formation of residual stresses [
30,
31,
32,
33]. The stresses related to the dendrite bending are already created in the γ-phase and are inherited by the γ′ dendrites formed by cubic crystals. The complex geometry of the blades may also contribute to the formation of misoriented areas by bending the dendrites or areas with various primary dendrite spacing related to the material thickness [
34]. In detail, other complex reasons for dendrite deformation are presented in [
35].
The single-crystalline superalloys contain several alloying additives that segregate into interdendritic regions or dendrites, the arms of which may cover an area of even several hundred microns. The chemical composition heterogeneity related to dendritic segregation is disadvantageous [
1,
25,
26,
27,
28,
29]. Disturbances in the dendrite growth cause both local changes in the crystal orientation of dendrites and changes in their chemical composition, as well as changes in a crystal lattice parameter [
36]. Such changes are disadvantageous for the blade’s strength [
18,
19,
20] and must be reduced by a very costly homogenizing heat treatment. Local changes in the chemical composition of the blade material can be observed by measuring the lattice parameter of the γ′-phase (a
γ′). For this purpose, the dedicated Freiberg EFG X-ray diffractometer [
37] can be used, which allows for a
γ′ measurements along the lines with the length covering a whole blade.
The cored blades are cast in ceramic molds that give them shape. The external surfaces of the blades provide the desirable aerodynamic shape, and the internal surfaces of the blades are related to the cooling bores created by ceramic cores, the shape of which is optimized for the rate of heat dissipation from different fragments of the blades. Usually, in the blades used in jet engines, the distribution of channels is very complex. Since the directional growth of dendrites is influenced by the geometry of the external and internal blades’ surfaces, the experimental differentiation of the mechanisms of the influence of the external and internal surfaces on the growth of dendrites is difficult. For the above reason, it was decided that the research presented in this paper would be carried out on the blades with a simplified shape in which the cooling bores have the simplest cylindrical form with a constant diameter, and their axis is parallel to the blade axis. It was assumed that for such blades, possible changes in the dendritic structure would be related only to abrupt changes to the outer surfaces of the blade.
The complex shape of the blades with cooling bores may create local disturbances in the dendrites’ growth [
38,
39,
40,
41]. To observe the effect of such disturbances, it is necessary to study longitudinal cross-sections of the blades parallel to the axis of the blade. Additionally, the blade axis defines the direction of the centrifugal force, which is the highest load of the blade during service, so the analysis of the lattice parameter and the primary orientation angle along this direction is essential.
Single-crystalline blade castings are commonly produced using a spiral selector [
42]. In cored blades, the dendritic structure near the selector differs from that located away, as analyzed and presented in [
38,
43]. These differences should imply differences in the γ′-phase lattice parameter a
γ′ and the dendrites’ primary crystal orientation described by the α angle, which is the angle measured between the crystal direction [001] and the blade axis Z. The differences suggest different mechanisms of dendrite growth. Therefore, the a
γ′ and α angle distributions along the Z axis, in the regions relatively near the selector, considering the top view of the blades, were first investigated. The results are presented in this study. Further studies are planned to explore areas more distant from the selector, in cross-sections intersecting structures such as the cooling bore that is most distanced from the selector extension area.
The aim of this paper is to analyze the influence of the blade’s internal and external surface geometry on the γ′ lattice parameter and primary crystal orientation of single-crystalline cored turbine blades made of CMSX-4 superalloy. The current first part of the paper series concerns a longitudinal section intersecting both the selector extension area, treated as the reference area with the most negligible influence of the blade geometry on the γ′ lattice parameter and primary crystal orientation, and the nearest cooling bore. The paper is a continuation of our previous studies [
38,
43,
44,
45], which have shown that at a longer distance from the selector, considering the top view, crystal misorientation and lattice parameter inhomogeneity increase significantly, which is related to the geometry of the blade and different other parameters, e.g., a technological parameter.
2. Materials and Methods
The blade casts for analysis were made of CMSX-4 superalloy by the directional vertical Bridgman crystallization at a 3 mm/min withdrawal rate and with the temperature gradient in the growth chamber of G0 = 16 K/cm. The ALD Vacuum Technologies Co. (Hanau, Germany) VIMIC 2E–DS/SC industrial furnace, which belongs to the Research and Development Laboratory for Aerospace Materials, Rzeszów University of Technology, Rzeszów, Poland, was used to produce the blades.
The initially prepared wax models of the blades were placed in the wax assembly (
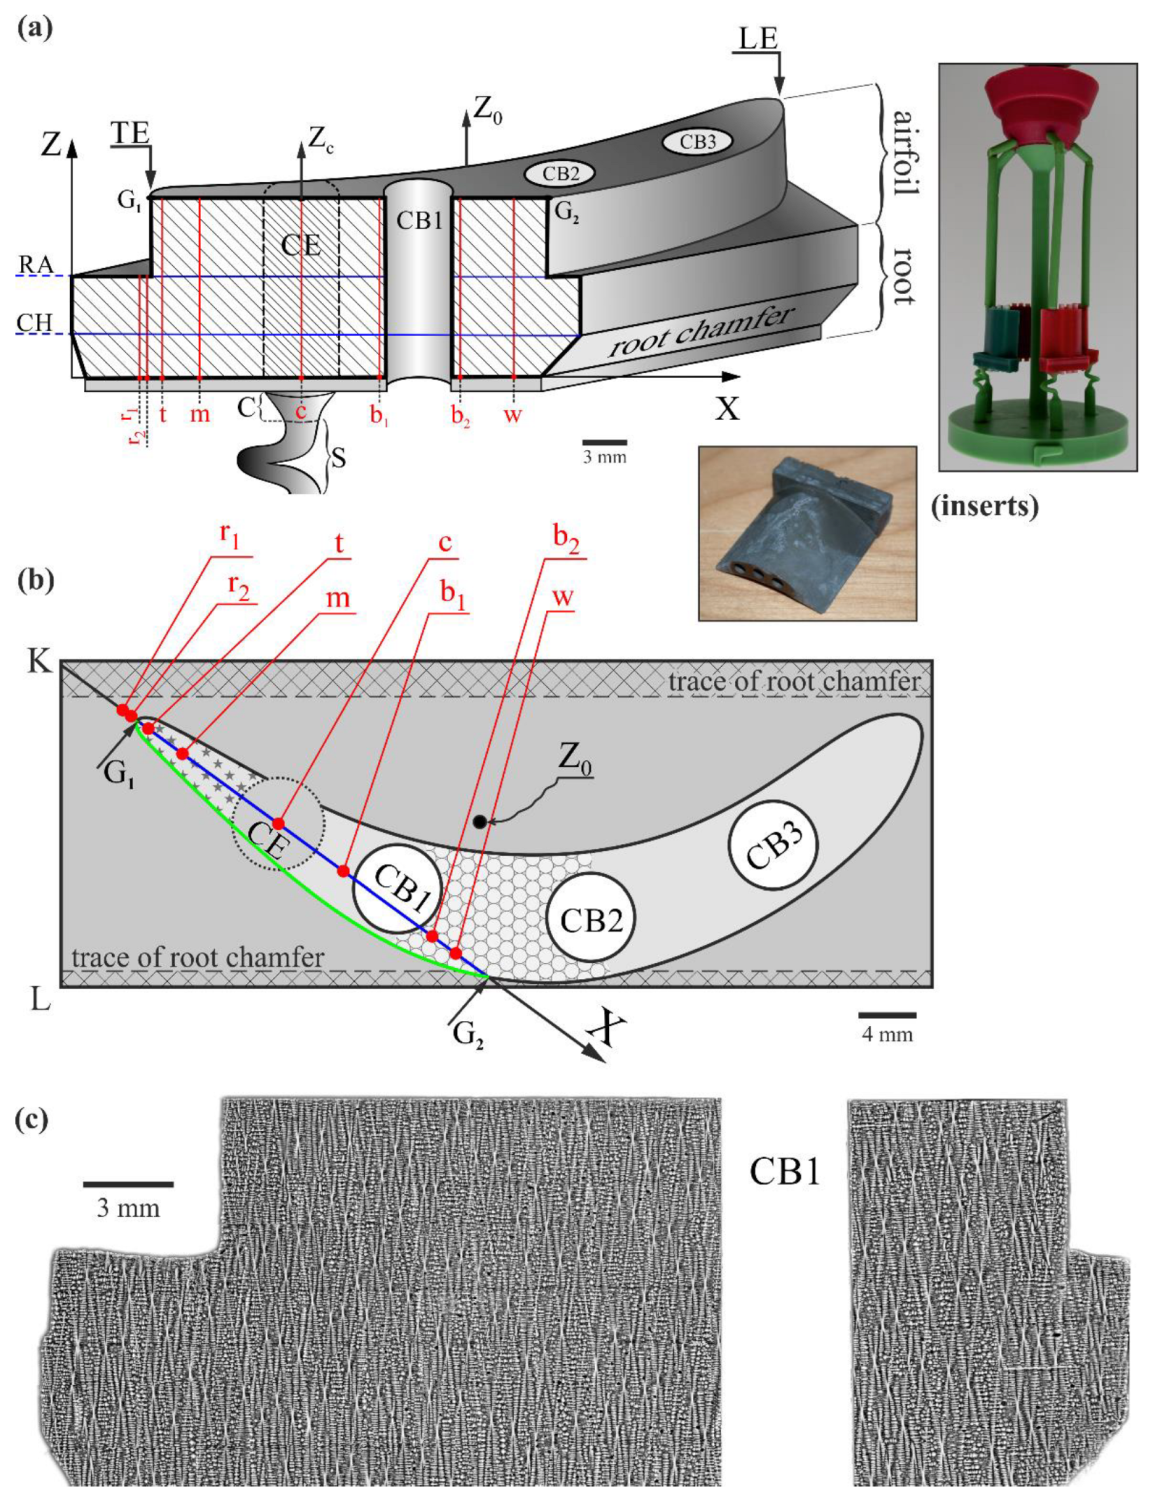
Figure 1, insert) and coated with a ceramic layer by dipping them into a refractory slurry and coating them with refractory grains, followed by drying them to produce a ceramic mold. The total mold thickness was about 9 mm and consisted of several layers. Then the wax was removed in a steam autoclave, and the mold was fired for strength. The batch with the nominal chemical composition of CMSX-4 (wt.%: 5.6 Al, 1.0 Ti, 6.5 Ta, 6.5 Cr, 0.6 Mo, 6.0 W, 9.0 Co, 3.0 Re, 0.1 Hf, less than 0.002 C, Ni bal.) was melted using induction heating. Melting and solidification processes were carried out in a vacuum. The ceramic mold located on the chill plate was heated up to 1520 °C, and the melt of the same temperature was poured inside. When finished, the mold was removed from the furnace and separated from the blade casts (
Figure 1, insert).
The blade casts contained three cylindrical cooling bores, CB1, CB2, and CB3, and a spiral selector (S) with the continuer (C) asymmetrically located relative to the main blade axis Z
0 (
Figure 1a,b). The cylindrical shape bounded by the projection of the continuer’s perimeter into the blade was named the continuer extension (CE) area. In the produced blade casts, only internal cooling was implemented as the simplest method of cooling the blades. The model blades for analysis were created from the blade casts by cutting off a fragment of the airfoil.
The model blades were intersected for the tests along the plane that was parallel to the main blade axis Z
0 and passed through the center of the continuer extension (CE) area, the trailing edge (TE) of the airfoil (
Figure 1a), and the cooling bore CB1. The exposed longitudinal section of the shape presented in
Figure 1 was prepared for the tests using the standard superalloy metallographic procedure [
46]. The geometry of the blade allows the distinction of two specific Z levels related to the root chamfer at the bottom of the blade limited by the chamfer level (CH-level) and the level of connection between the root and airfoil (RA-level) (
Figure 1a). The levels are related to the changes in the blade transverse sections; therefore, the character of the likely changes in a
γ′ and α has been subjected to detailed analysis.
A JSM-6480 JEOL SEM microscope (JEOL Ltd., Tokyo, Japan) was used to visualize the dendritic structure of the analyzed section surface (
Figure 1c). The image was created using the backscattered electron (BSE) imaging technique by collecting several separate microimages.
The measurements of the γ′ lattice parameter and α angle defining the primary crystal orientation were completed in the Research and Development Laboratory for Aerospace Materials, Rzeszów University of Technology, Rzeszów, Poland, with the use of a dedicated EFG Freiberg Instruments X-ray diffractometer (Freiberg Instruments, Freiberg, Germany) [
37]. The measurement lines parallel to the blade axis Z
0 on the section surface are traced by a laser scanner. The values of the a
γ′ parameter and the α angle were calculated using software with which the diffractometer is equipped, based on the Ω-scan method [
37]. The method is of high sensitivity and allows the measurement of slight changes in the α angle of the order of arc minutes despite the analysis of large macroscopic surfaces [
37]. The mean error of the a
γ′ and α measurements was 0.0005 Å and 0.006°, respectively.
In the beginning, the a
γ′ and α measurements were performed at points of line c (
Figure 1a,b) located in the center of the CE area. It was assumed that the growth of dendrites in the area CE was the least disturbed by the change in the blade transverse sections. Therefore, the a
γ′(Z
c) and α(Z
c) distributions could serve as reference distributions for other areas where a
γ′ and α changes at CH and RA levels would be measurable. In the next step, measurements were performed along certain lines: m, positioned near the side surface of the airfoil and far from the side surface of the root; w, positioned near the side surface of both the airfoil and the root; r
1 and r
2, positioned close to TE and passing through the root only; and t, positioned close to TE and passing through both root and airfoil (
Figure 1). Additionally, the measurements were performed around two lines, b
1 and b
2, positioned around the internal surfaces on the left and right sides of the CB1. Lines r
1 and r
2 covered the blade root only, and the other lines covered the root together with the airfoil. The measurement line length was several millimeters, and the a
γ′ and α values were collected for each line in a single-pass measurement. This allowed the visualization of both small local changes and broader trends of a
γ′(Z) and α(Z) changes occurring throughout the blade macroscopic areas.
3. Results and Discussion
The dendritic structure revealed in the analyzed section (
Figure 1c) is typical for a longitudinal section of single-crystalline blades made of CMSX-4 superalloy using standard parameters of the technological process. The hourglass shapes visualize the oblique cuts of the dendrites.
Based on our previous studies, the results of which are presented in [
44], it was assumed that in the CE area (
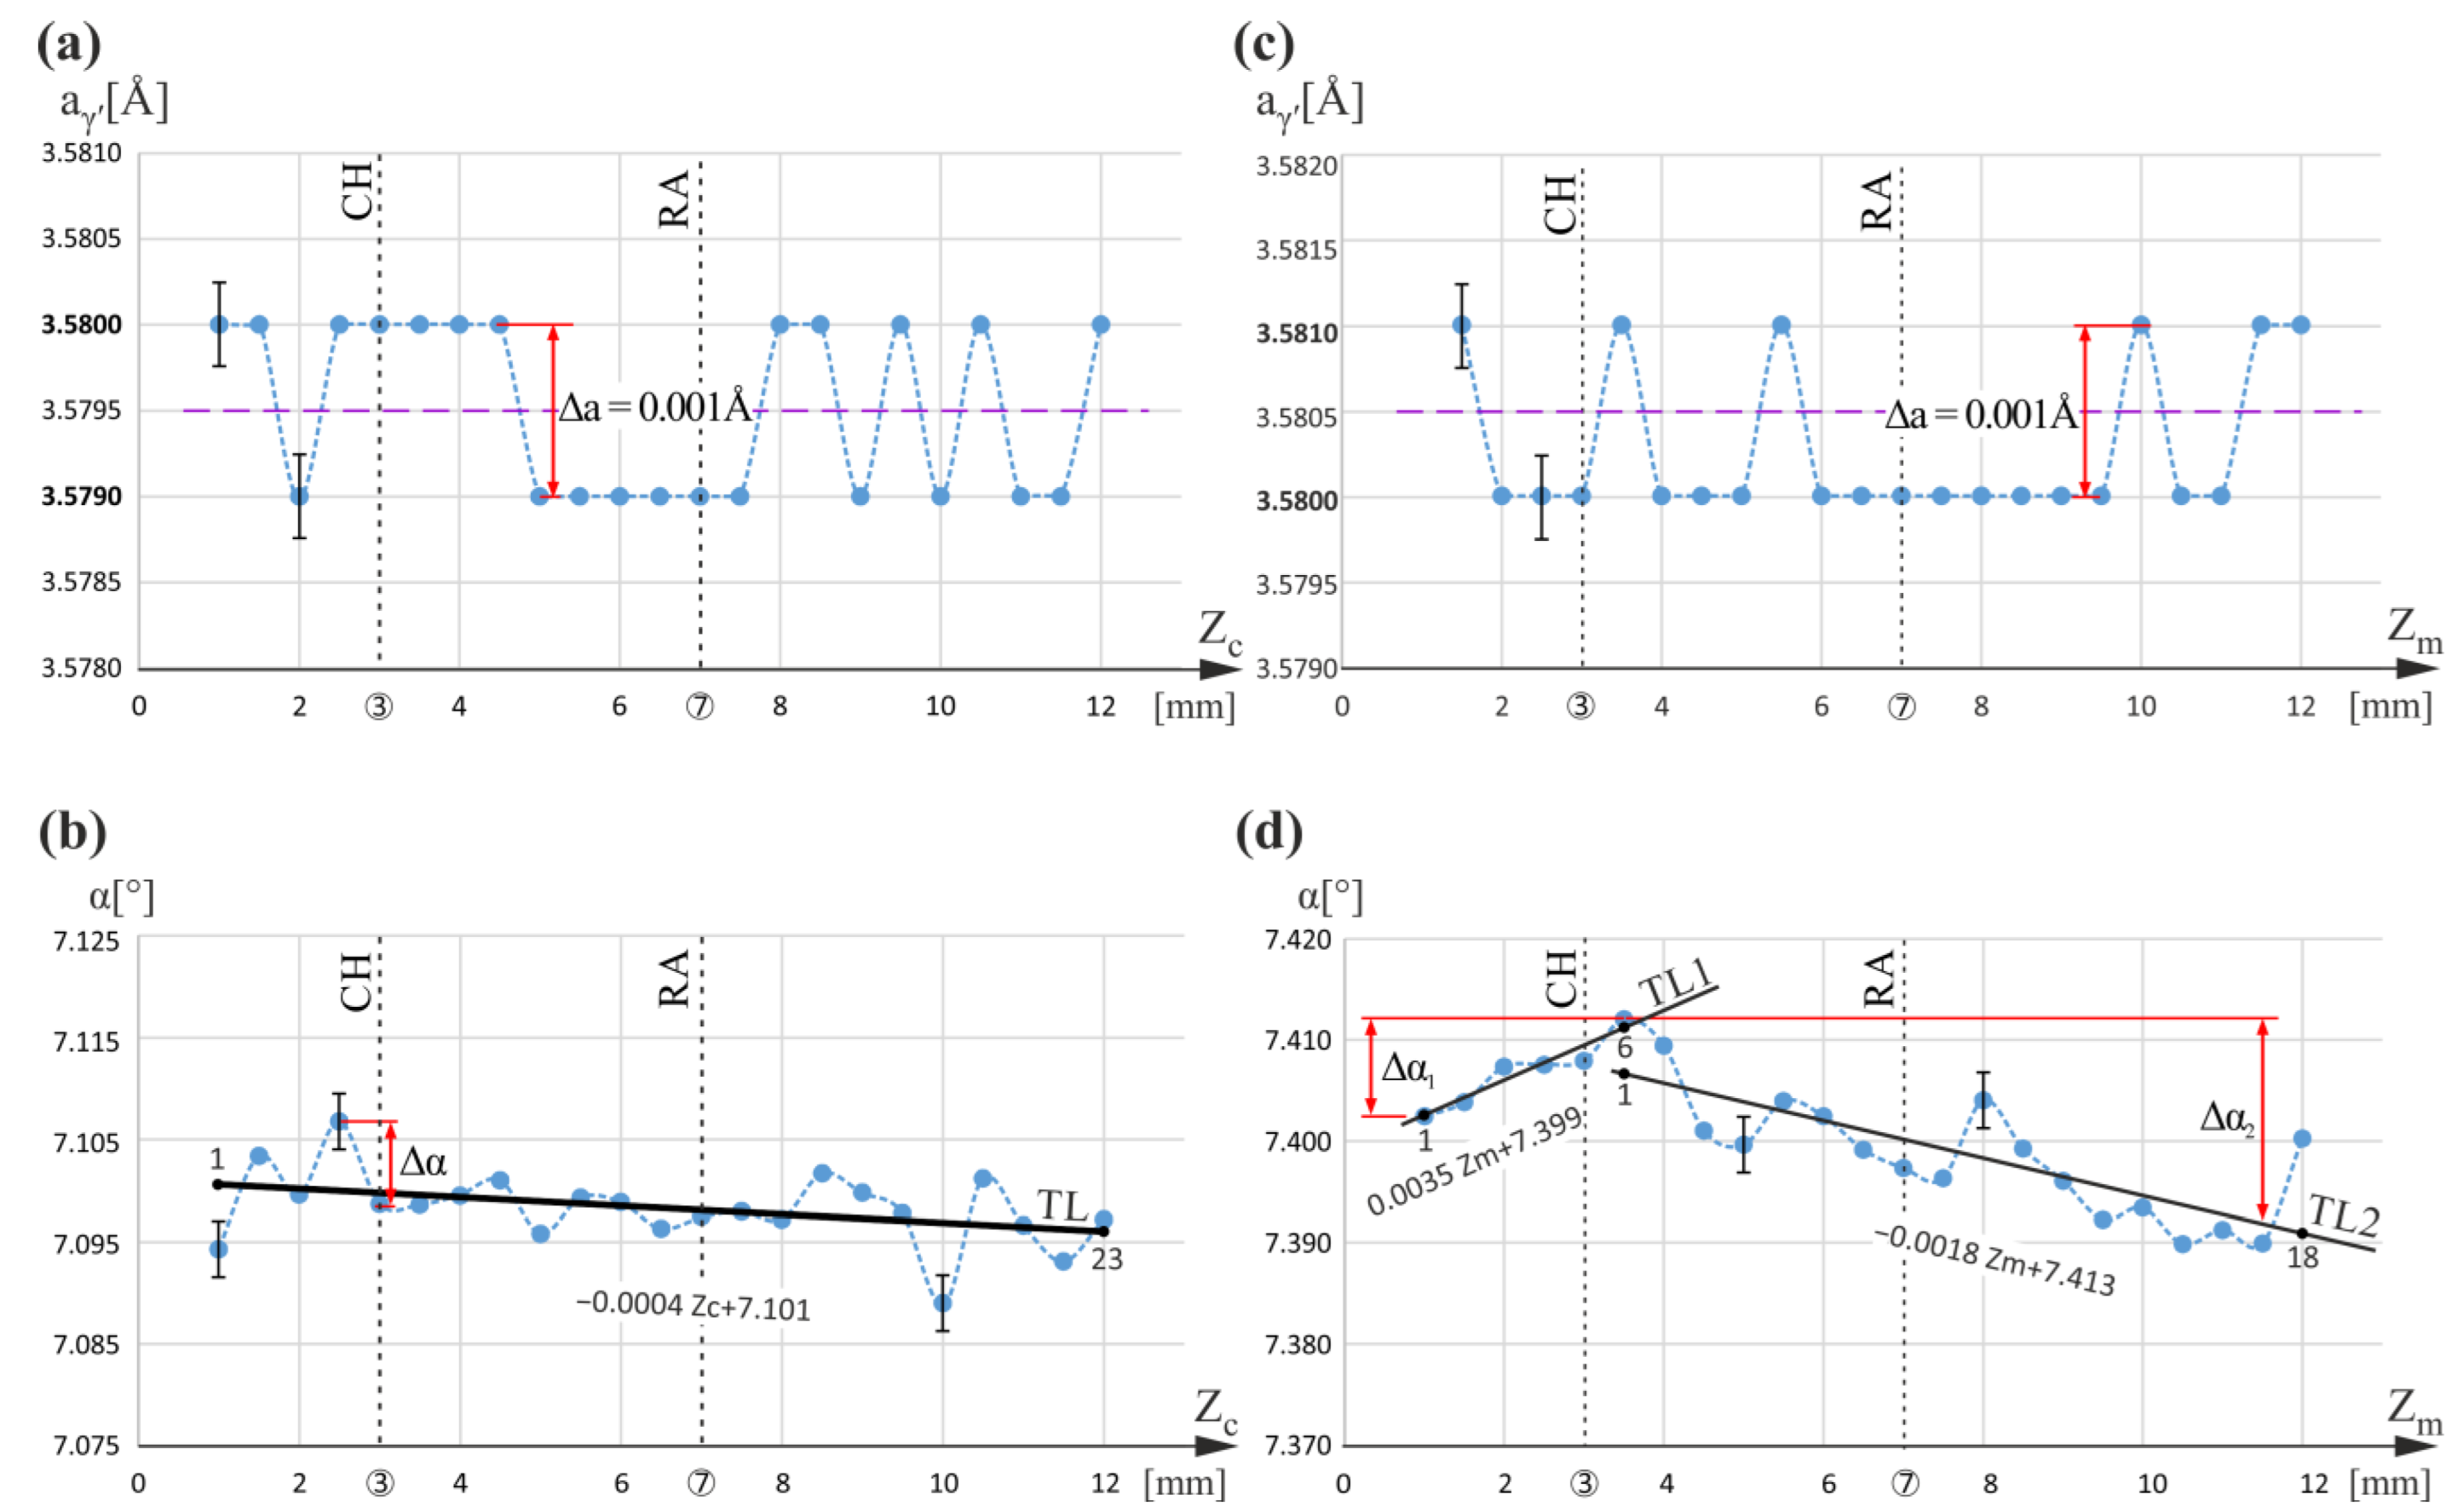
Figure 1), the growth of dendrites is steady, and the influence of the mold walls is minimized. Therefore, it was assumed that the dendrite growth inside CE proceeds without possible significant disturbances related to CH and RA levels. Hence, measurement line c, in the center of CE (
Figure 1a,b), was chosen as the reference line for all studied lines, so distributions of the lattice parameter a
γ′ and α angle of primary crystal orientation along this line were analyzed first. These distributions are shown in
Figure 2a,b. The dashed lines connecting the measurement points are only drawn to visualize the fluctuations and/or increase/decrease in a
γ′ and the α angle. They do not describe the character of the changes. It can be observed that the a
γ′ value fluctuates around a certain level of 3.5795 Å. The a
γ′ changes are in the range of 0.001 Å, from 3.5790 Å to 3.5800 Å over the entire measuring range Z
c, which exceeds twice the mean measurement error (see exemplary error bars for the first and third points in
Figure 2a). According to the interpretation described in [
44], these a
γ′ changes are related to the stochastic coverage by incident X-ray beam of the secondary dendrite arms’ initial or ending areas. The observed stochastic changes in the a
γ′ in the range of 0.001 Å may be called a
γ′ fluctuations. Because only such type changes are observed, and there were no additional changes near the CH and RA levels, it may be concluded that the fluctuations correspond to the undisturbed dendrite growth.
The α(Z
c) changes (
Figure 2b) also have only a stochastic character with values that may be approximated as a straight line TL and exceed the mean measurement error only in a few points (see exemplary error bars). No changes in α were observed near the CH (Z
c = 3 mm) and RA (Z
c = 7 mm) levels. Moreover, no correlation of α(Z
c) with the a
γ′(Z
c) graph is noticeable. Therefore, it should be stated that the possible effect of a
γ′ and α changes related to the variation of the root cross-section near the CH and RA levels is not noticeable in the CE area. Because the changes in the α angle are only stochastic, it follows that roughly in the CE area, there is no systematic bend of the dendrites near the CH and RA levels. Based on the a
γ′(Z
c) and α(Z
c) graphs presented in
Figure 2a,b, it can be concluded that a
γ′ changes in the range of 3.5790–3.5800 Å are purely stochastic and correspond to dendrites formed during the steady crystallization of melt with a chemical composition strictly corresponding to CMSX-4 alloy. However, a more precise analysis of the α(Z
c) graph shows a slightly decreasing trend in α angle. The slope of the trend line TL (points 1 to 23) is only 0.0004 [°/mm], and the maximal fluctuation of α (Δα) is about 0.01°.
Line m was selected near the side surface of the airfoil and far from the side surface of the root. Additionally, line m represented the blade area distanced both from the CE and CB1, as well as from the TE of the airfoil. The analysis of the a
γ′(Z
m) relationship shows only fluctuations with the value Δa
γ′ = 0.001 Å in the range 3.5800–3.5810 Å (
Figure 2c). This range is shifted towards higher values, compared to the CE area, which may indicate a slight change in the chemical composition. However, as for the CE line, only stochastic fluctuations of the lattice parameter are observed over the entire range of Z
m that correspond to the undisturbed dendrite growth, including the Z
m values around CH and RA levels.
The relationship α(Z
m) has a trend that increases up to about Z
m = 3.5 mm and decreases above this value (
Figure 2d). It can be assumed that there is a systematic bend of the dendrites at Z
m = 3.5 mm near the CH level (Z
m = 3 mm). Because the slope coefficient describes rates of α changes, the degree of bend can be described by the difference in the slope coefficients of the trend lines TL1 and TL2 (
Figure 2d) defined for the Z
m < 3.5 mm and Z
m > 3.5 mm. The calculated coefficients are +0.0035 [°/mm] for LT1 (points 1 to 6) and −0.0018 [°/mm] for LT2 (points 1 to 18). Since the slope coefficients have opposite signs, the degree of dendrite bend can be defined as the sum of the modulus of both coefficients; i.e., for the α(Z
m) graph, the sum (general difference) is 0.0053 [°/mm]. The range of α changes for Z
m < 3.5 mm is 0.008° (Δα
1), and that for Z
m > 3.5 mm is 0.019° (Δα
2), so the values are not large. As there are no systematic changes in the a
γ′(Z
m) on the background of Δa = 0.001 Å, it should be concluded that the observed systematic bending of the dendrites near the CH level (Z
m = 3mm) is not related to any measurable change in the a
γ′ parameter. Additionally, it may be stated that neither dendrite bending nor a
γ′ systematic changes are observed at the RA level (Z
m = 7 mm).
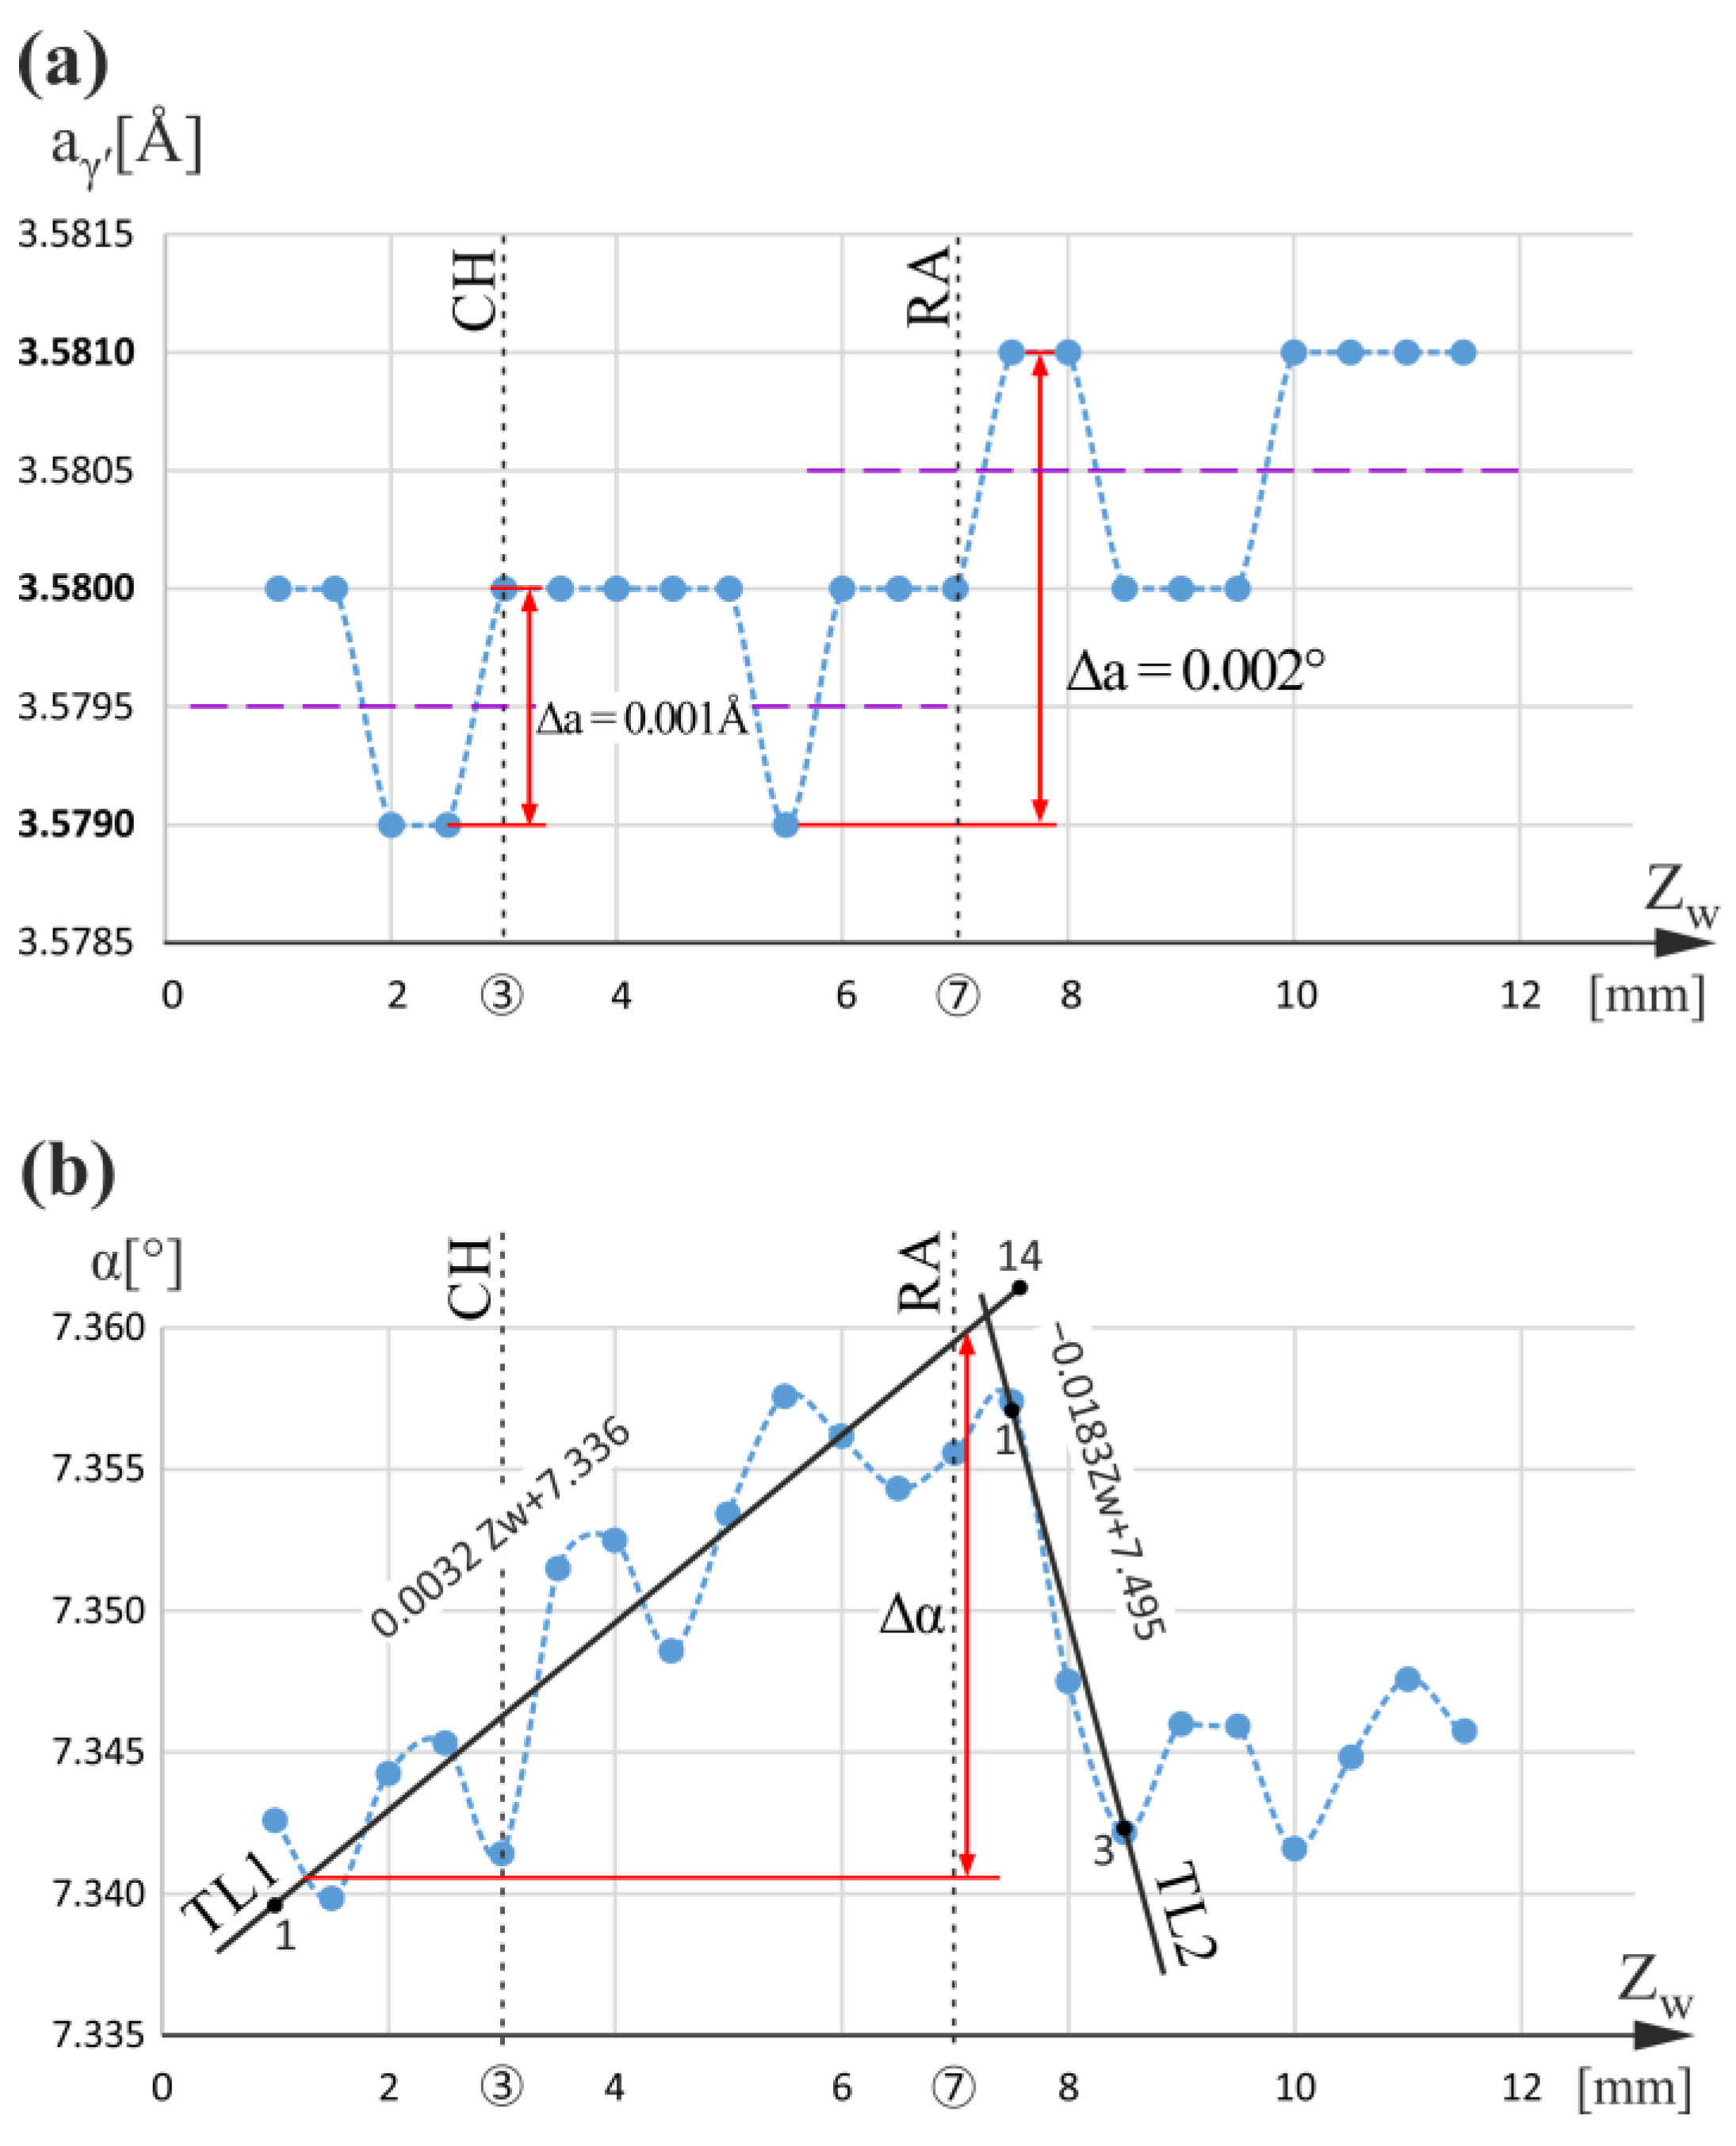
Next, measurements were continued for the line w positioned near the side surface of the airfoil and the root and distanced from the CE. The graphs of the a
γ′(Z
w) and α(Z
w) relationship are presented in
Figure 3. The dashed lines connecting the measurement points are only drawn to visualize the fluctuations and/or increase/decrease in a
γ′ and the α angle. They do not describe the character of the changes. It was deduced from
Figure 3a that for a
γ′, there are fluctuations with the value Δa
γ′ = 0.001 Å in the range 3.5790–3.5800 Å below the RA level (Z
w < 7 mm). The fluctuation range corresponds to an undisturbed dendrite array similar to that presented for the c line of the CE region. In addition, below the RA level on the α(Z
w) graph, the systematic increase in the α value with the background fluctuations is observed, whereas, above the RA level, a similar decrease in the α value is observed. The α(Z
w) graph analysis for line w shows a minimal effect related to the CH level of Z
w = 3 mm, compared to the RA level. On the other hand, the effect related to the RA level is noticeable both in the a
γ′(Z
w) and α(Z
w) graphs. Slightly above the RA level, the a
γ′ value increases to 3.5810 Å, and for the whole range Z
w > 7 mm, the a
γ′ fluctuates about 3.5805 Å, which is a higher value than that for the range Z
w < 7 mm equal to 3.5795 Å. The trend lines TL1 and TL2 of the α(Z
w) graph (
Figure 3b) show a change in the trend from increasing (below RA level) to decreasing (above RA level). This change means that the dendrites near the RA level are highly bent. The greater degree of bending, the greater difference in the slope coefficient of the trend lines TL1 and TL2. The calculated coefficients are 0.0032 [°/mm] for TL1 (points 1 to 14) and −0.0183 [°/mm] for TL2 (points 1 to 3). Since the slope coefficients have opposite signs, the difference in the coefficients is 0.0215 [°/mm], which is significantly higher than that in the case of the line m (0.0053 [°/mm]) (
Figure 2d). This means a higher bending of the dendrites near the RA level of the w line. It may be assumed that only a sufficiently large bending of the dendrites can cause observable changes in the lattice parameter.
The correlation of α change with the a
γ′ change means that the increase in a
γ′ may be related to the distortion of the γ′-phase’ crystal lattice due to dendrite bending near the RA level without changes in the chemical composition or to a local change in their chemical composition created during the crystallization by the redistribution of the alloying elements. The latter seems more likely for CMSX-4-type alloys containing many alloying elements. An additional argument may be the fact that the γ′-phase in the form of cubic crystals with dimensions of the order of 1 µm is formed [
47] after the crystallization of γ-phase dendrites as a result of a diffusive ordering transformation. Therefore, macrostresses in bent γ-phase dendrites will not cause residual stresses of the lattice in each crystal of γ′, but rather a change in the chemical composition of following γ′ crystals. In the case of the measurement line w, the value of the α change near the RA level can be estimated as Δα = 0.018° (
Figure 3b). The bending of the dendrites may be caused by local changes in the vertical temperature gradient, which may be influenced by the proximity of the external blade surfaces. The measurement line w is located in the thick fragment of the blade airfoil marked by a circle-hath in
Figure 1b. The local temperature gradient in this area may be so high that the effect of a
γ′ and α changes on the CH level is unnoticeable for the w measurement line.
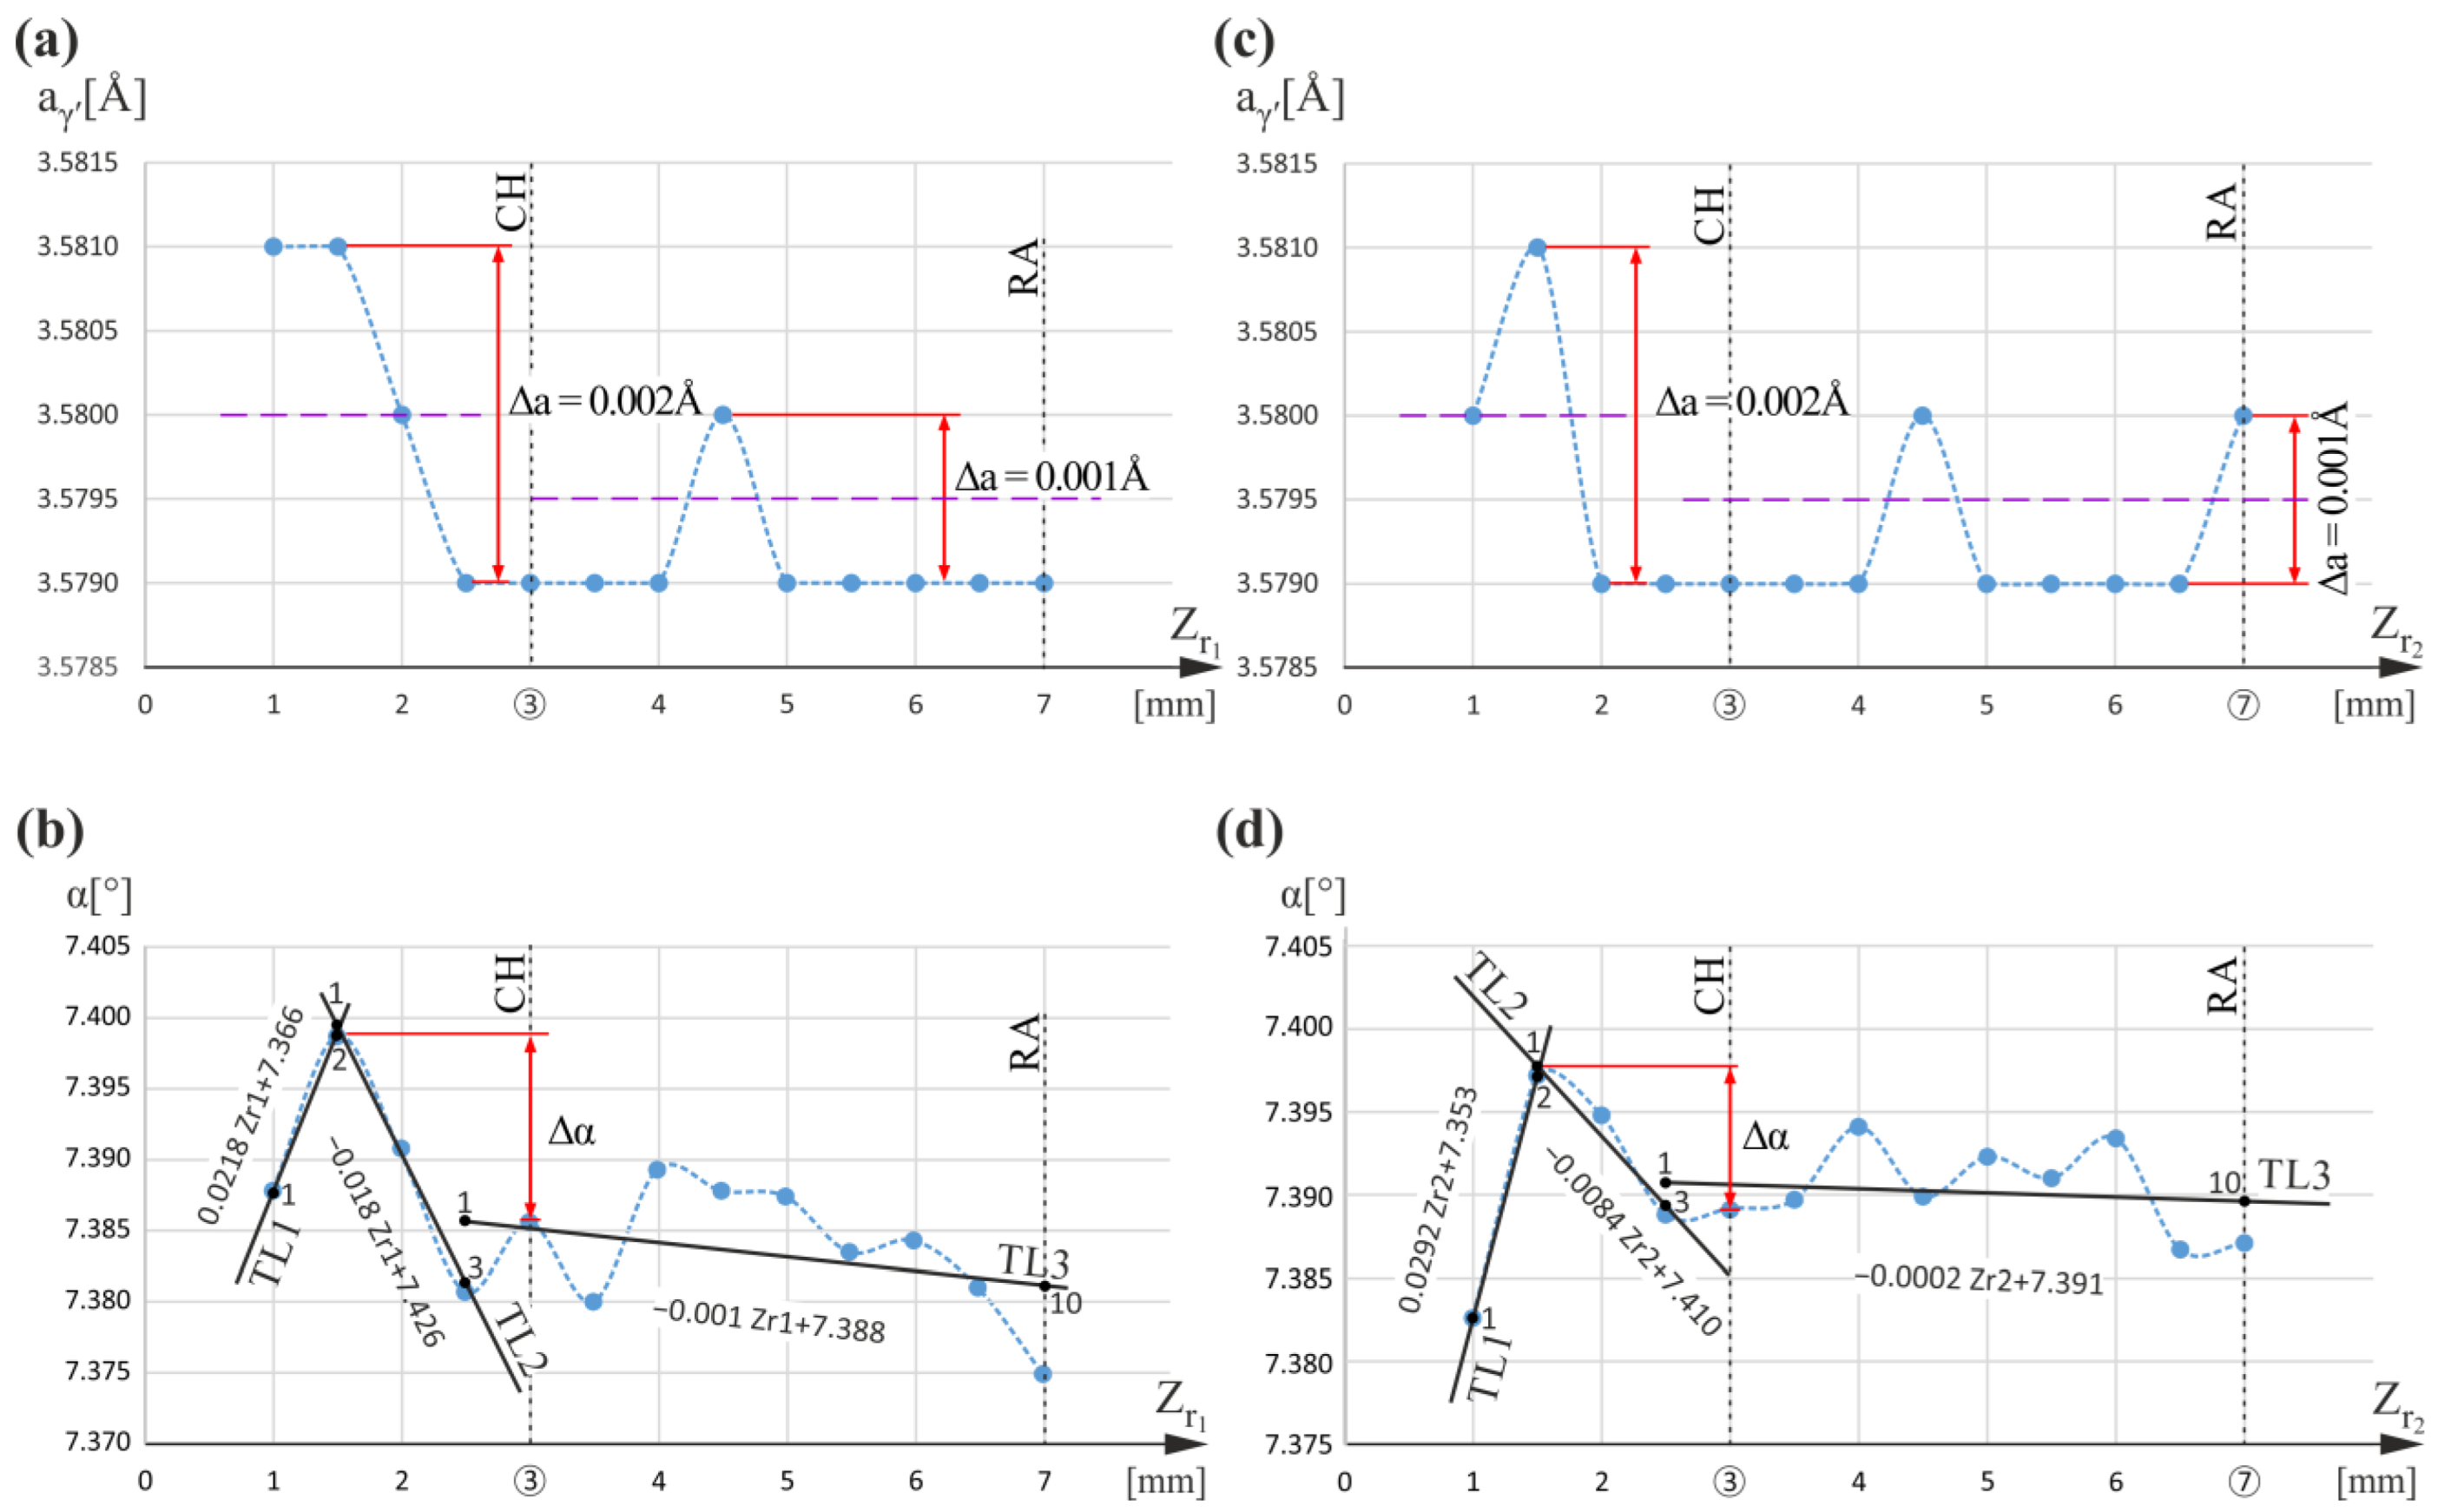
Then, the areas on the opposite left side of the analyzed section were studied, on which measurement lines r
1 and r
2 were selected (
Figure 1). These areas covered only the blade root, and no airfoil was above them. The measurement lines were traced at a considerable distance from the vertical side wall KL of the mold (
Figure 1) so that the a
γ′ and α measurements were not affected by additional effects related to this wall. The results are shown in
Figure 4. The a
γ′(Z
r1) and a
γ′(Z
r2) graphs for both lines (
Figure 4) show a maximal increase in the a
γ′ value ranging up to 3.5810 Å for the Z
r1 and Z
r2 values below the CH level. The a
γ′ changes are within 0.002 Å, and a
γ′ value fluctuates about 3.5800 Å. The a
γ′ changes for the Z
r1 and Z
r2 values observed for both r
1 and r
2 lines above the CH level are within 0.001 Å, and the a
γ′ value fluctuates about 3.5795 Å. The nature of the a
γ′(Z
r1) and a
γ′(Z
r2) relationships above the CH level is similar to that observed for the line c (
Figure 2a), specific for undisturbed dendrite array.
When comparing the graphs in
Figure 4a,b, a correlation between the changes in a
γ′ and α below the CH level can be observed. The increase in a
γ′ for the r
1 measurement line generally corresponds to changes in the slope of the TL1 and TL2 trend lines (
Figure 4b), meaning dendrite bending. A similar correlation is observed for measurement line r
2 (
Figure 4d). The slope coefficients for TL1 (points 1 to 2) and TL2 (points 1 to 3) of the r
1 measurement line are +0.0218 [°/mm] and −0.0180, respectively; hence, their difference is 0.0398 [°/mm]. The slope coefficients for TL1 (points 1 to 2) and TL2 (points 1 to 3) of the r
2 measurement line are +0.0292 and −0.0084, respectively; hence, their difference is 0.0376 [°/mm]. These values are comparable with the value determined for the α(Z
w) graph in
Figure 3. It can also be observed that there is a gradual slight decrease in the α angle above the CH level in
Figure 4b,d. The slope coefficients of the TL3 trend lines (points 1 to 10) for the α(Z
r1) and α(Z
r2) graphs are −0.001 [°/mm] and −0.0002 [°/mm], respectively; hence, the difference in the neighboring trend line slope coefficients (TL2) is 0.017 [°/mm] and 0.0082 [°/mm], respectively. The values suggest some bending of the dendrites. However, the difference in the slope of neighboring trend lines TL2 and TL3 is less than that calculated for TL1 and TL2. This means that, above the CH level, the dendrites are only slightly bent. In this case, in the graphs of a
γ′(Z
r) relationship, the fluctuation of a
γ′ value in about 3.5795 Å is only visible, and no measurable symmetric changes in a
γ′ are caused. Δα changes below the CH level for r
1 and r
2 lines range from 0.014° (
Figure 4b) to 0.011° (
Figure 4d), so they are significantly greater than those occurring in the CE area (0.008°,
Figure 2b). Because there is a correlation between a
γ′ changes and the degree of dendrite bending, it may be concluded that dendrite bending causes a change in a
γ′ that may mean the presence of residual stress near the CH level.
The a
γ′ changes can be caused by the bend of the dendrites or by local changes in heat dissipation (local changes in temperature gradient). However, it was found that with the observed slight bending of the dendrites, no changes in a
γ′ occurred. Only at a relatively large bend, the effect of a
γ′ change is observed, which suggests that the contribution of the alloying component segregation mechanism is controlled by the degree of dendrite bend. Therefore the cause of segregation is the bending of the dendrites. It was also found that a
γ′ changes occur at dendrite bending levels or slightly higher Z values, i.e., in areas that crystallize later—after dendrite bending occurs. The above results in the creation of the shift of the a
γ′ changes level in relation to the level of dendrite bending. If the cause of the segregation of alloying elements and a
γ′ changes was a local change in the temperature gradient, this kind of shift would not occur, and a
γ′ changes would always appear at the same level where the bending of the dendrites is visible. The above suggests that the cause of the a
γ′ changes is the bending of the dendrites. This, in turn, may be caused by a local change in the temperature gradient or by other factors, e.g., by the influence of the mold wall [
48].
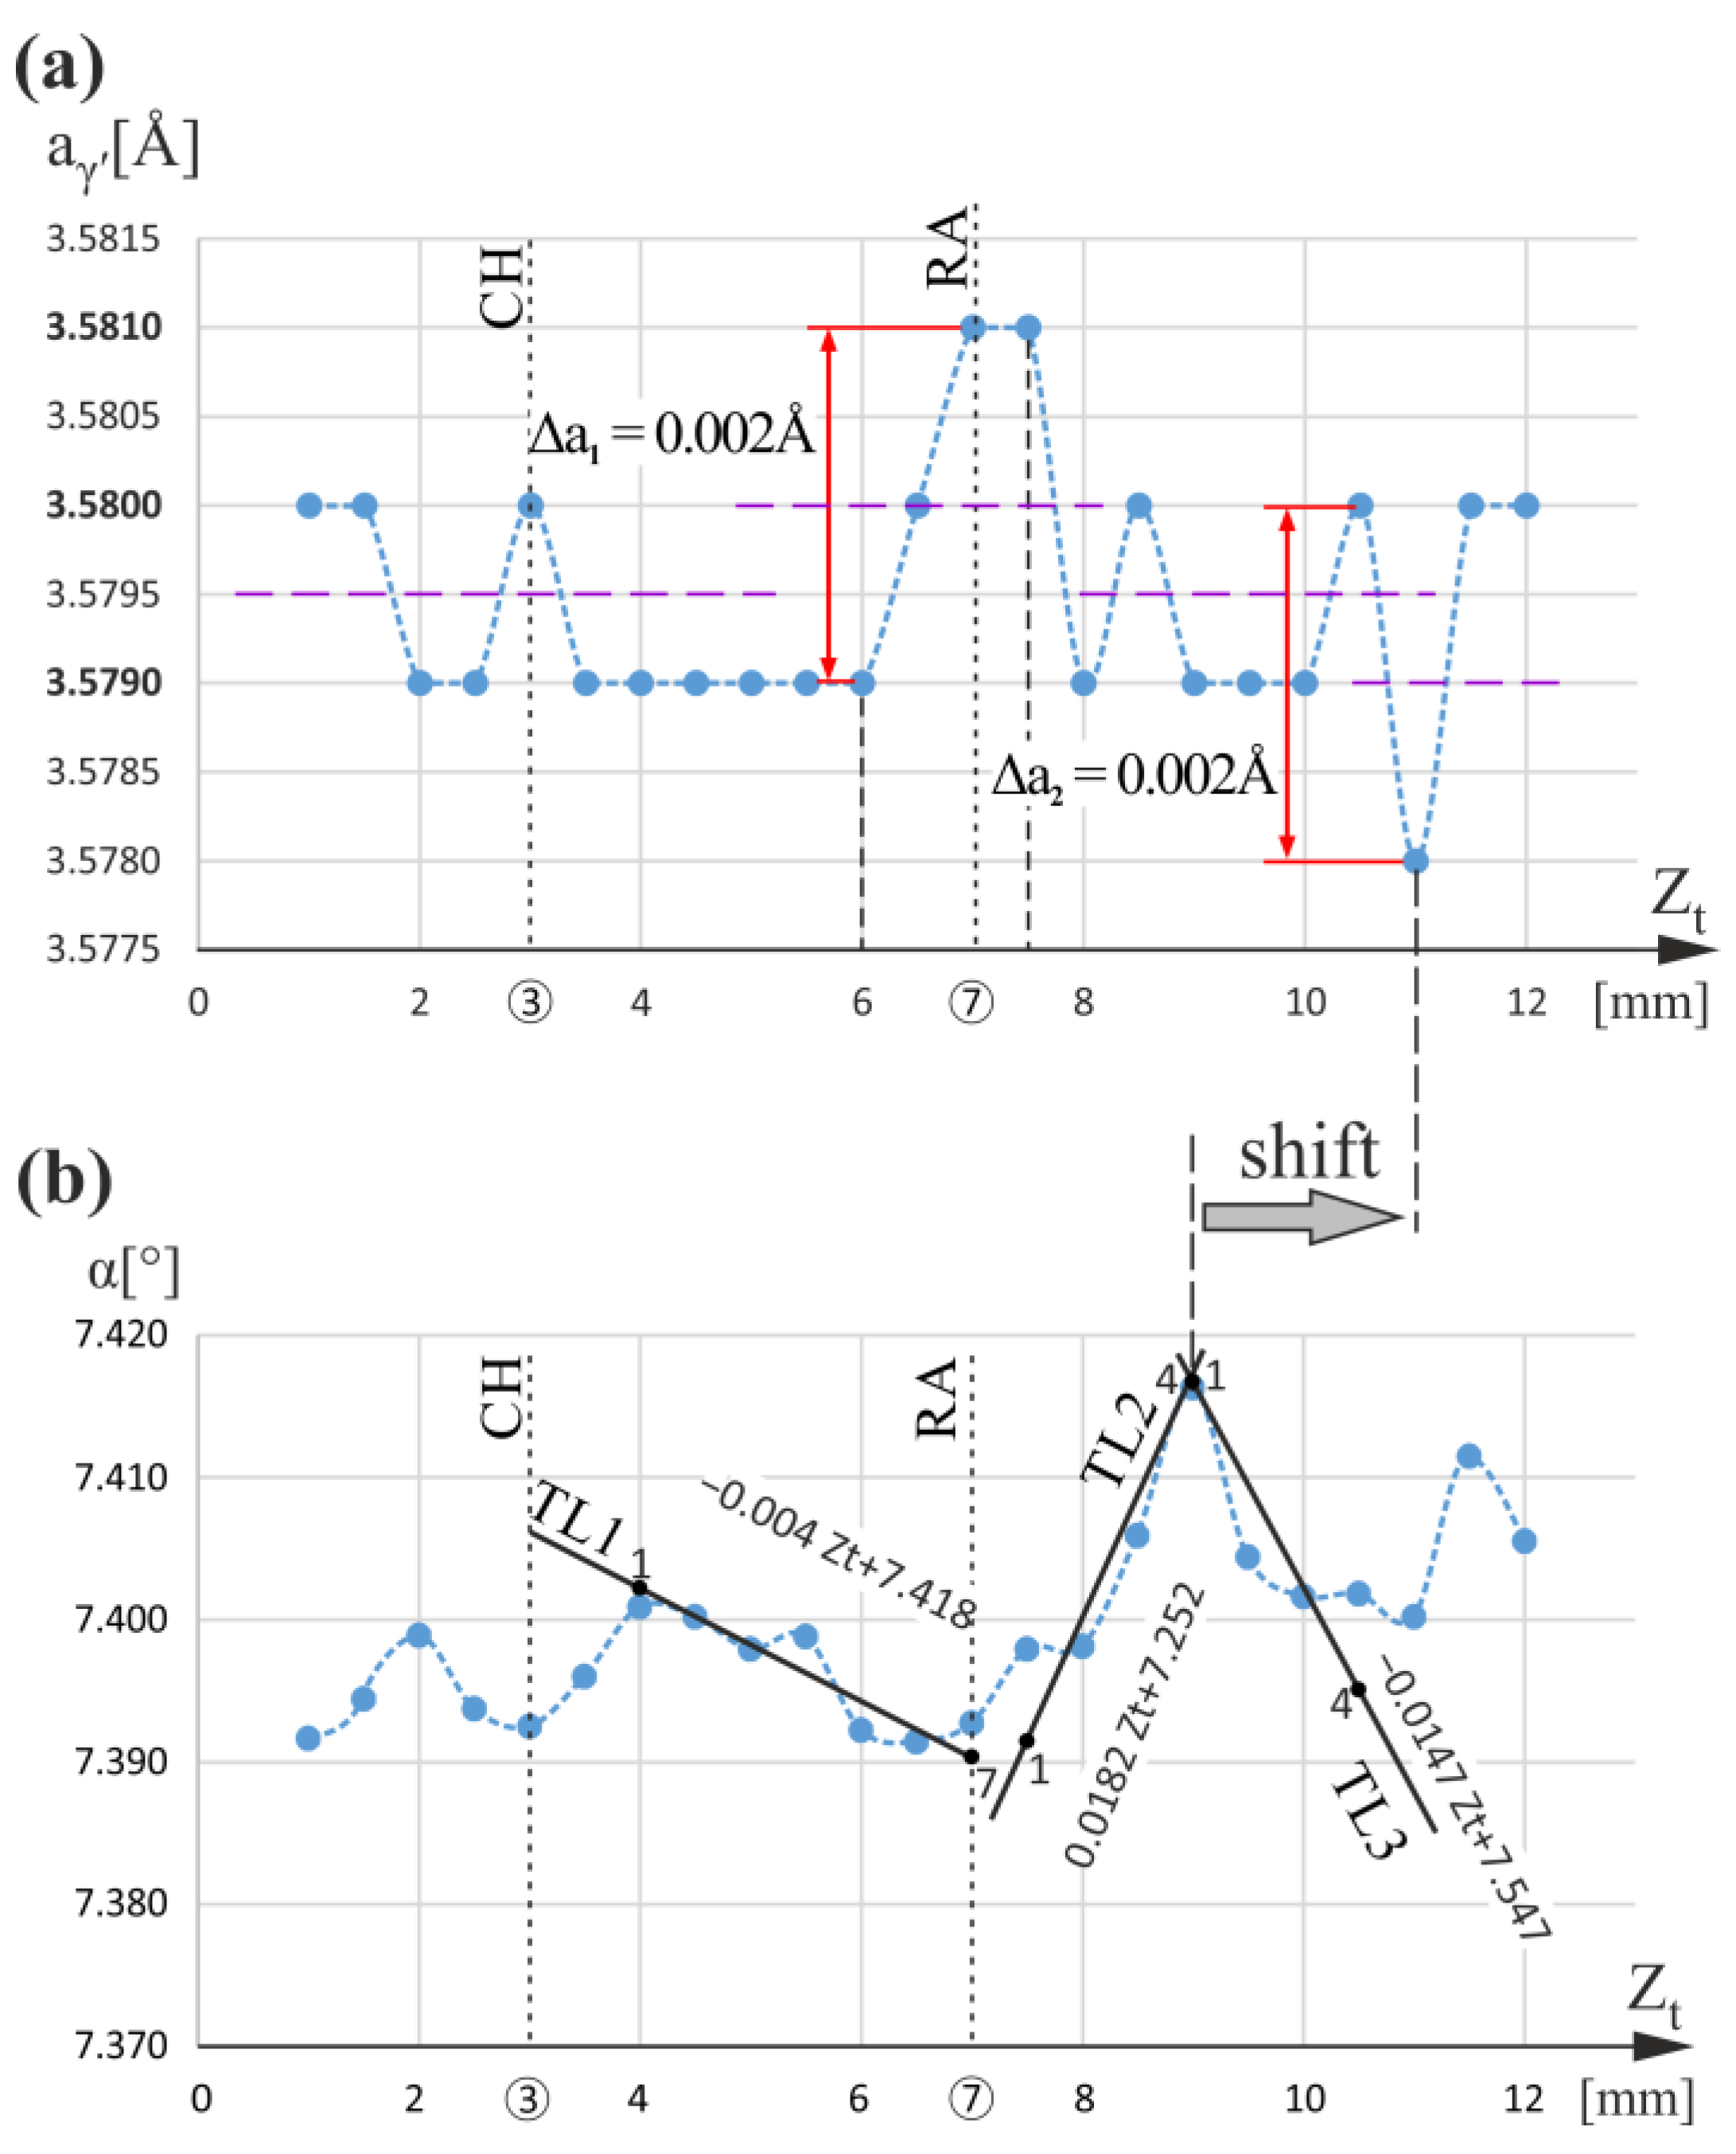
The measurement line t (
Figure 1) traced for the entire blade height, including both root and airfoil, was chosen near the external surface of the mold close to the TE. This line is traced in the thin-walled airfoil region marked in
Figure 1b by a star pattern. In addition, the measurement line t was localized close to the G
1G
2 line (
Figure 1b), indicating a root–airfoil connection. The graphs of the α(Z
t) and a
γ′(Z
t) relationships for measurement line t are presented in
Figure 5. There is no similar effect for a
γ′(Z
t) as observed in
Figure 4 below the CH level (Z
t < 3mm); however, the effects occurring close to the RA level (Z
t = 7 mm) are noticeable (Δa
γ′ = 0.002 Å—marked as Δa
1 in
Figure 5a). The increase in a
γ′ near the RA level with Δa
1 = 0.002 Å is related to the bend of dendrites represented by α angle changes, which are presented by changes in the slope of TL1 and TL2 trend lines. In the α(Z
t) graph, TL1 decreases below the RA level, and TL2 increases above the RA level. For TL1 (points 1 to 7), the slope coefficient is −0.004 [°/mm], and for TL2 (points 1 to 4), it is 0.0182 [°/mm]; hence, their difference is 0.0222 [°/mm]. For the RA level, the change in the slope coefficient sign of the α(Z
t) trend lines and the increase in the a
γ′ by Δa
1 correspond to the same value of Z
t = 7 mm. On the other hand, the maximum in the α(Z
t) graph occurs at Z
t = 9 mm, and the decrease by Δa
2 occurs at Z
t = 11 mm; i.e., the positions of the extremes of a
γ′(Z
t) and α(Z
t) are shifted. This means that during the crystallization, the bending of the dendrites at Z
t = 9 mm subsequently caused a change (decrease) in the lattice parameter of the γ′-phase, but a little later. The reduction in a
γ′ by Δa
2 visible in
Figure 5a at the level Z
t = 11.0 mm may be related to the effect of dendrite “force directing” by the mold walls in the thin-walled areas of the airfoil, described in [
49]. The degree of changes in the direction of the dendrite growth, i.e., their bending, is, in this case, characterized by the difference in the slope of the trend lines TL2 and TL3 (points 1 to 4) of the α(Z
t) graph, which is 0.0329 [°/mm]. According to the interpretation presented in [
45] (p. 12), such a decrease occurs when the local concentration of Re, W, and/or Mo increases, and Al, Ti, and Ta decrease. It should be emphasized that for the area below the CH level, there were no changes in a
γ′. It can be concluded that only if a specific critical value for the bending of the dendrites is exceeded will the a
γ′ change effect be observable.
The criterion for selecting the number of trend lines in α(z) graphs is related to the appearance of changes in a
γ′ with a value above 0.001Å. When for some Z range there are only fluctuations a
γ′, as is the case for 0 < Z < 7 mm in
Figure 3, then only one trend line of α(Z) is selected. If there are areas with a
γ′ changes higher than 0.001Å, that is, 0.002Å, then α(Z) should be searched for trend lines describing the bending of the dendrite (search for the α(Z) extremum). The slope coefficients of found trend lines must be higher than those at which a
γ′ changes do not occur (e.g., as in
Figure 2b,d).
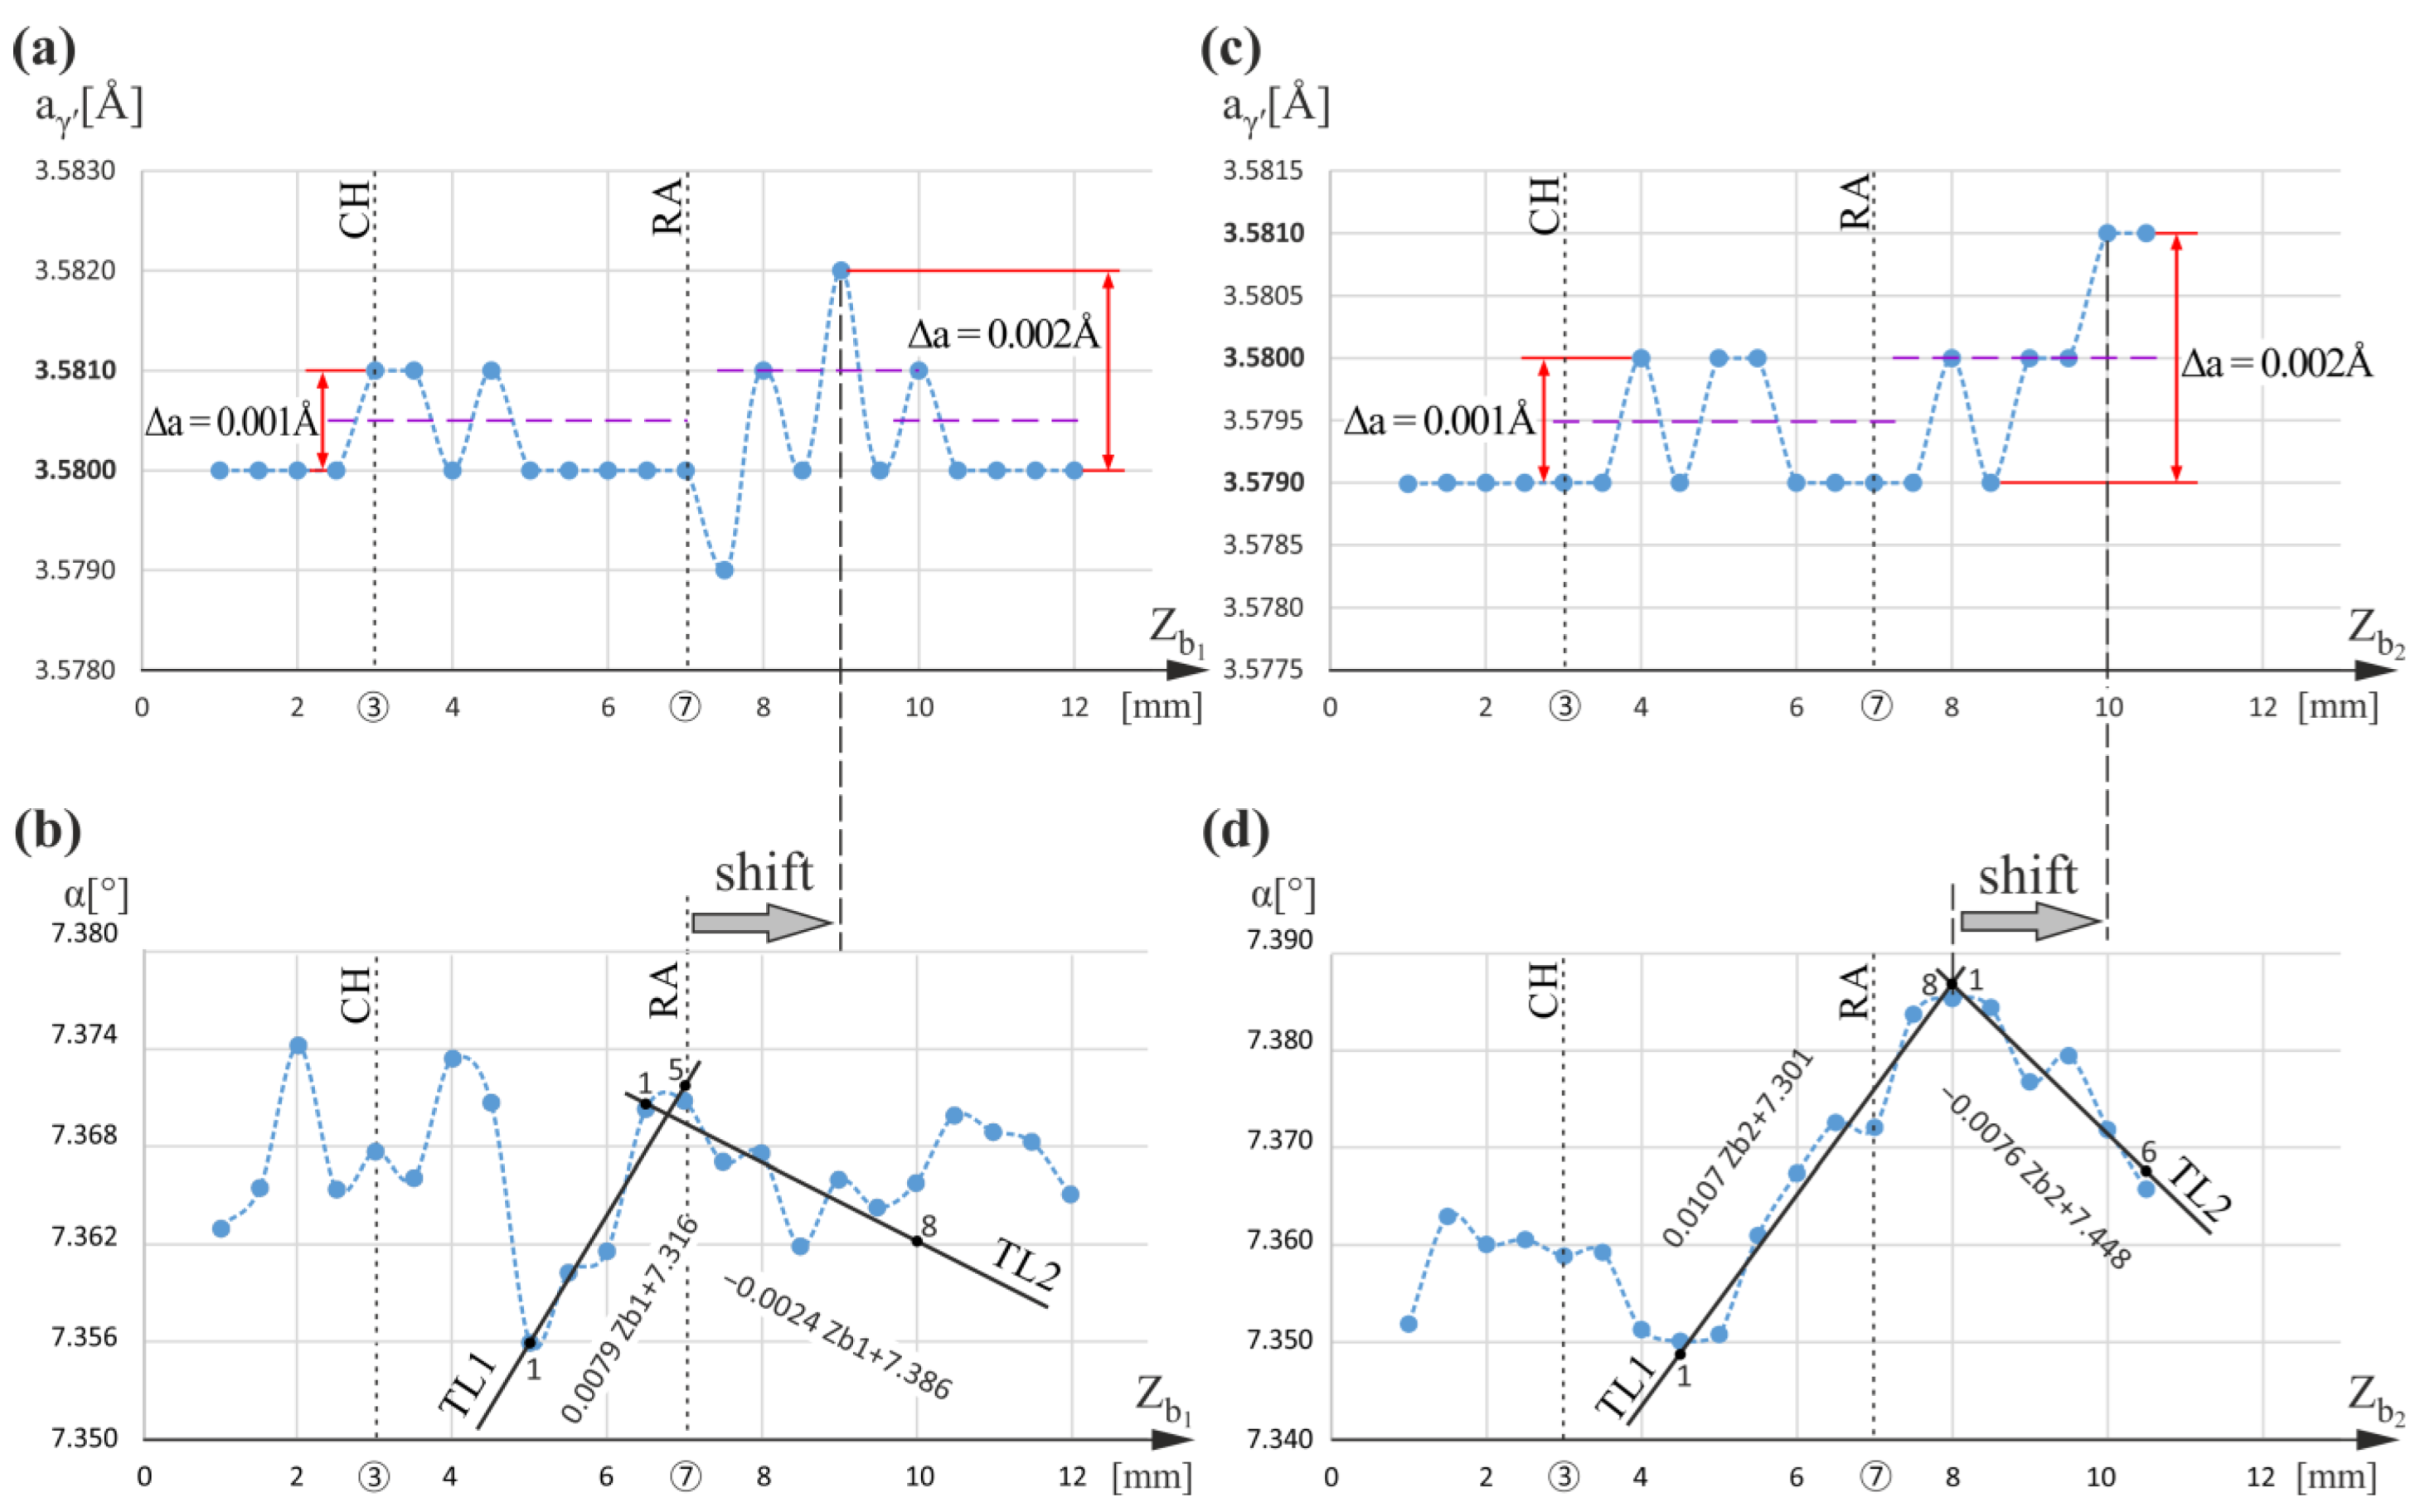
Consecutive research was carried out for measurement lines located near and around the CB1 cooling bore.
Figure 6 shows graphs of the a
γ′(Z
b1) and α(Z
b1) relationships for line b
1 located to the left of the CB1 bore, as well as the a
γ′(Z
b2) and α(Z
b2) relationships for line b
2 located to the right of the CB1 bore (
Figure 1). Graphs presented in
Figure 6a,c show that for both lines, above the RA level, in the range Z = 9–10 mm, the a
γ′ value increases. Compared to the graph of a
γ′(Z
t) for line t (
Figure 5), this effect is noticeable for the higher Z values. The graph of α(Z
b1) (
Figure 6b) shows the local decrease in α for Z
b1 in the Z
b1 range of 4–5 mm, i.e., above the CH level of the root, and decreasing tendency of α angle right above the RA level, i.e., above Z
b1 = 7 mm (see local trend line TL2). Although the a
γ′(Z
b1) relationship in the vicinity of the CH level shows no tendency to change in a
γ′, it shows fluctuations of a
γ′ around 3.5805 Å with Δa
1 = 0.001 Å. A similar character of a
γ′(Z
b2) relationship occurs for line b
2 below Z
b2 = 9 mm; however, above, the a
γ′ increases. In the α(Z
b1) and α(Z
b2) graphs, the clear maxima are visible at Z
b1 = 7 mm and Z
b2 = 8 mm, respectively. The maximum of α(Z
b2) is slightly shifted towards larger Z values in relation to the RA level. However, on the left and right sides of the CB1, the effect of a
γ′(Z) changes related to the chamfering of the root is absent. It may be concluded that the influence of the blade external surfaces changing the a
γ′ near the RA level is clearly visible, but its location is shifted toward larger Z values in relation to the dendrite bend level. This may mean that the a
γ′ change occurred during the dendrites’ growth process, not when the dendrites were bent but slightly later.
The maxima of the α angle near the RA level, shown in
Figure 6b,d, suggest large dendrite bending in this area, which can be described by the difference in the slope coefficient of the TL1 (points 1 to 5 and 1 to 8,
Figure 6b and
Figure 6d, respectively) and TL2 (points 1 to 8 and 1 to 6,
Figure 6b and
Figure 6d, respectively) trend lines. This difference is 0.0103 [°/mm] for line b
1 and 0.0183 [°/mm] for line b
2. Such values are greater than those for which the a
γ′ change effect was not observed, e.g., for the line t at the CH level (Z
t = 3 mm). However, the a
γ′ changes are likely to be influenced not only by dendrite bending but also by several other factors, e.g., local change in the crystallization rate of neighboring dendrites during directional growth or dendritic segregation. Since this effect does not occur with a slight dendrite bend (
Figure 2 and
Figure 5), it should be assumed that it is related to the degree of dendrite bending. The local increase or decrease in a
γ′ must be related to the local redistribution of alloying elements at or near the CH and RA levels.


