The experimental analyses were divided into two parts. The first was related to the determination of differences in the temperature influence on the samples materials, while the second was related to the tensile test.
4.2. Thermal Tests
The thermal tests were performed in an environmental chamber MyDiscovery DM600C (Angelantoni Test Technologies Srl, Massa Martana, Italy) that allows for investigations in a range of temperatures from −75 °C to 180 °C with fluctuations of ±0.3 °C under different levels of RH ranging from 10% up to 98%, with ±3% fluctuations.
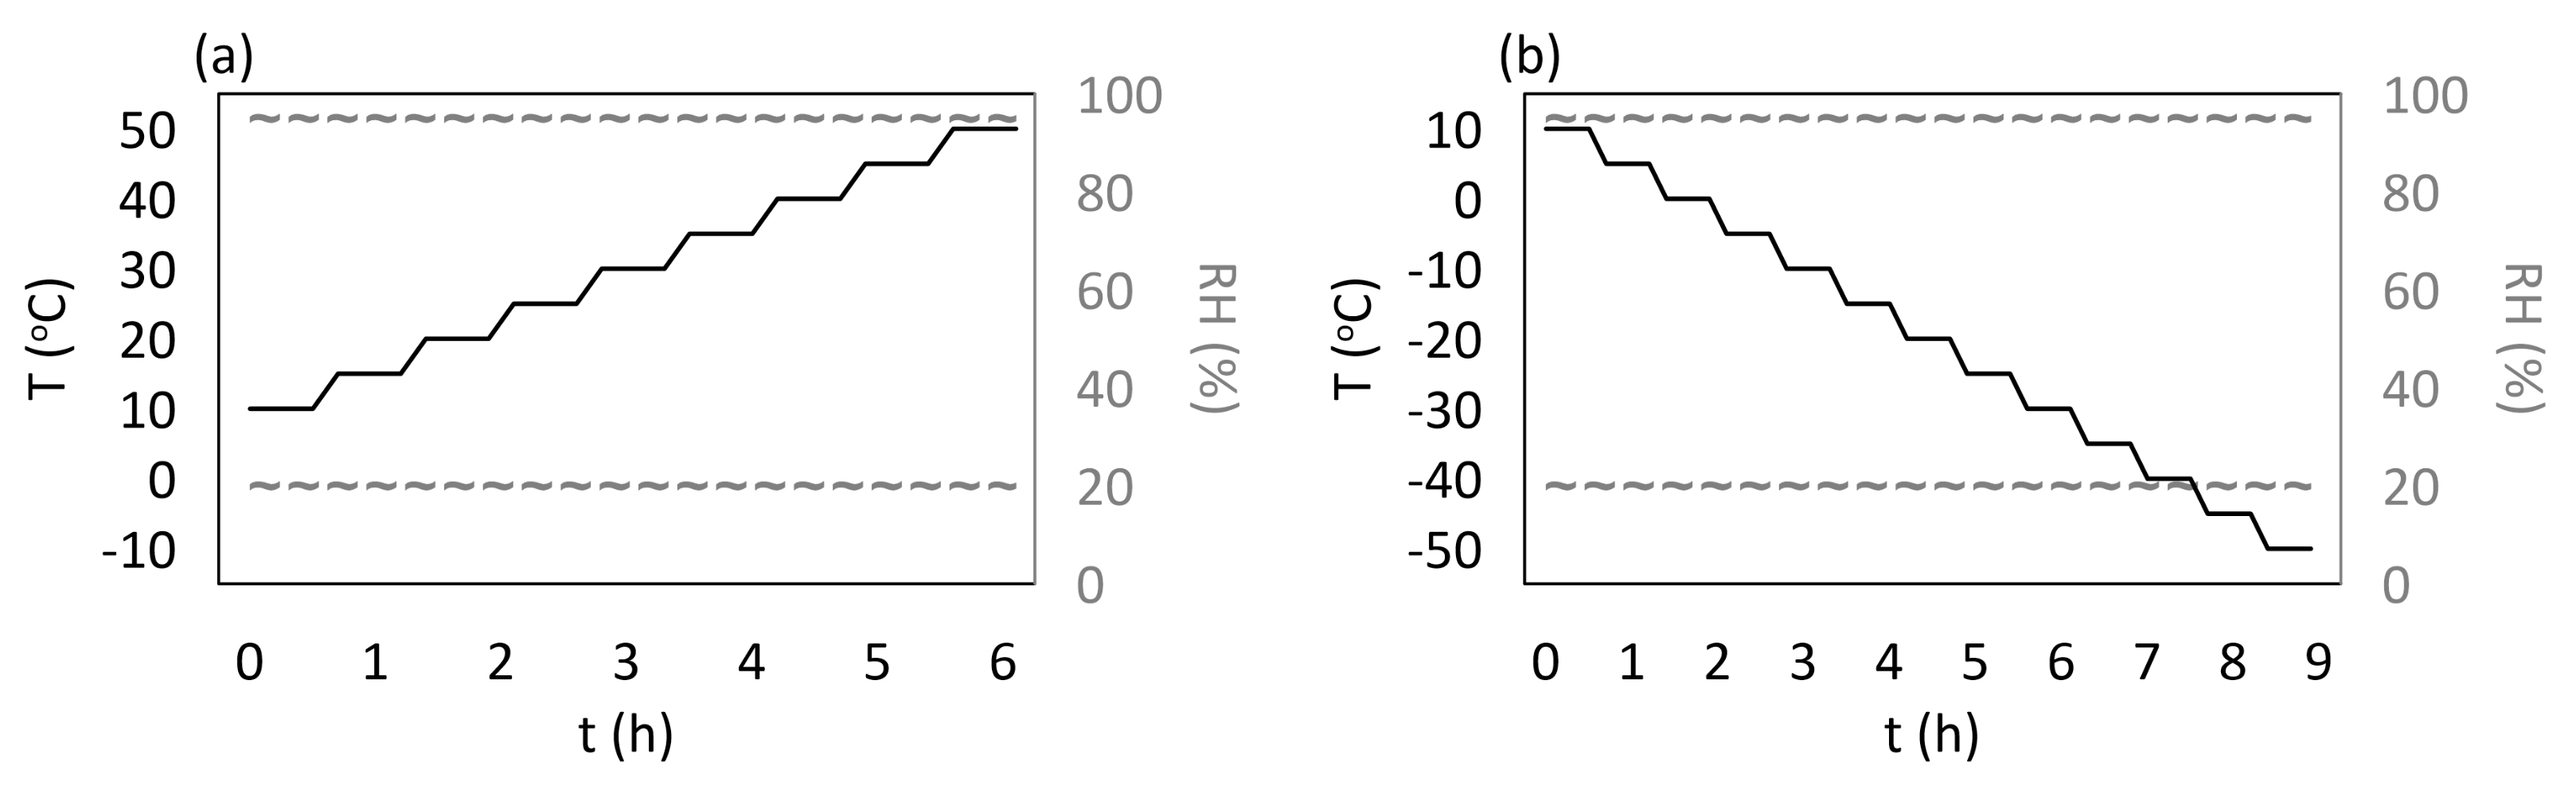
The temperature influence test was divided into two parts: elevated and sub-zero temperatures. The tests programs are presented in
Figure 3. The first measurements were performed at temperatures in a range from 10 °C to 50 °C and the second at temperatures in a range from −50 °C to 10 °C. In both cases, a 5 °C step between consecutive temperatures was assumed, and the measurements were performed for two stable values of the RH level: 20% and 95%. During the investigation, the samples were kept on a lattice shelf to allow them to expand in all directions. The temperature in the chamber was measured using an FBG temperature probe (Micron Optics, Atlanta, GA, USA). The FBG sensors measurements were performed using interrogator si425-500 (Micron Optics, Atlanta, GA, USA) with a measurement frequency equal to 1 Hz.
The total strain values were calculated using Equation (
1). As the base condition, the temperature equal to 20 °C and the relative humidity equal to 20% were assumed.
The heating process was performed in a way that allowed us to determine strain values for quasi-static conditions (steps). Both the heating and cooling processes were conducted at a very low speed (5 °C during 900 s). A comparison of the hysteresis of two analysed materials is presented in
Figure 4. On both of them, parts related to temperature increasing and decreasing are highlighted. For M3 X, the strain hysteresis loop parts almost cover each other and the maximal strain difference is equal to 8 ×
m/m. For M3 Crystal, the differences between the hysteresis loop parts are observable at the end of the heating process and the beginning of the cooling process. The maximal strain difference in this area is equal to 21 ×
m/m.
The mechanical strain
results for all M3 X samples from the thermal tests are presented in
Figure 5 and
Figure 6, while the mechanical strain
results for all M3 Crystal samples from the thermal tests are presented in
Figure 7 and
Figure 8. The mechanical strain values were calculated using Equation (
2). As it was presented in [
29], the strain changes for free FBG sensors for the analysed range of temperatures are on
m/m level and almost linear. As the strain values level in the free FBG sensor due to temperature and humidity influences is one order of magnitude lower than the total strain in the samples, the removal of the environmental conditions influence on the sensors do not influence the strain curve shapes. Therefore, the mechanical strain curves have similar shapes as the total strain curves.
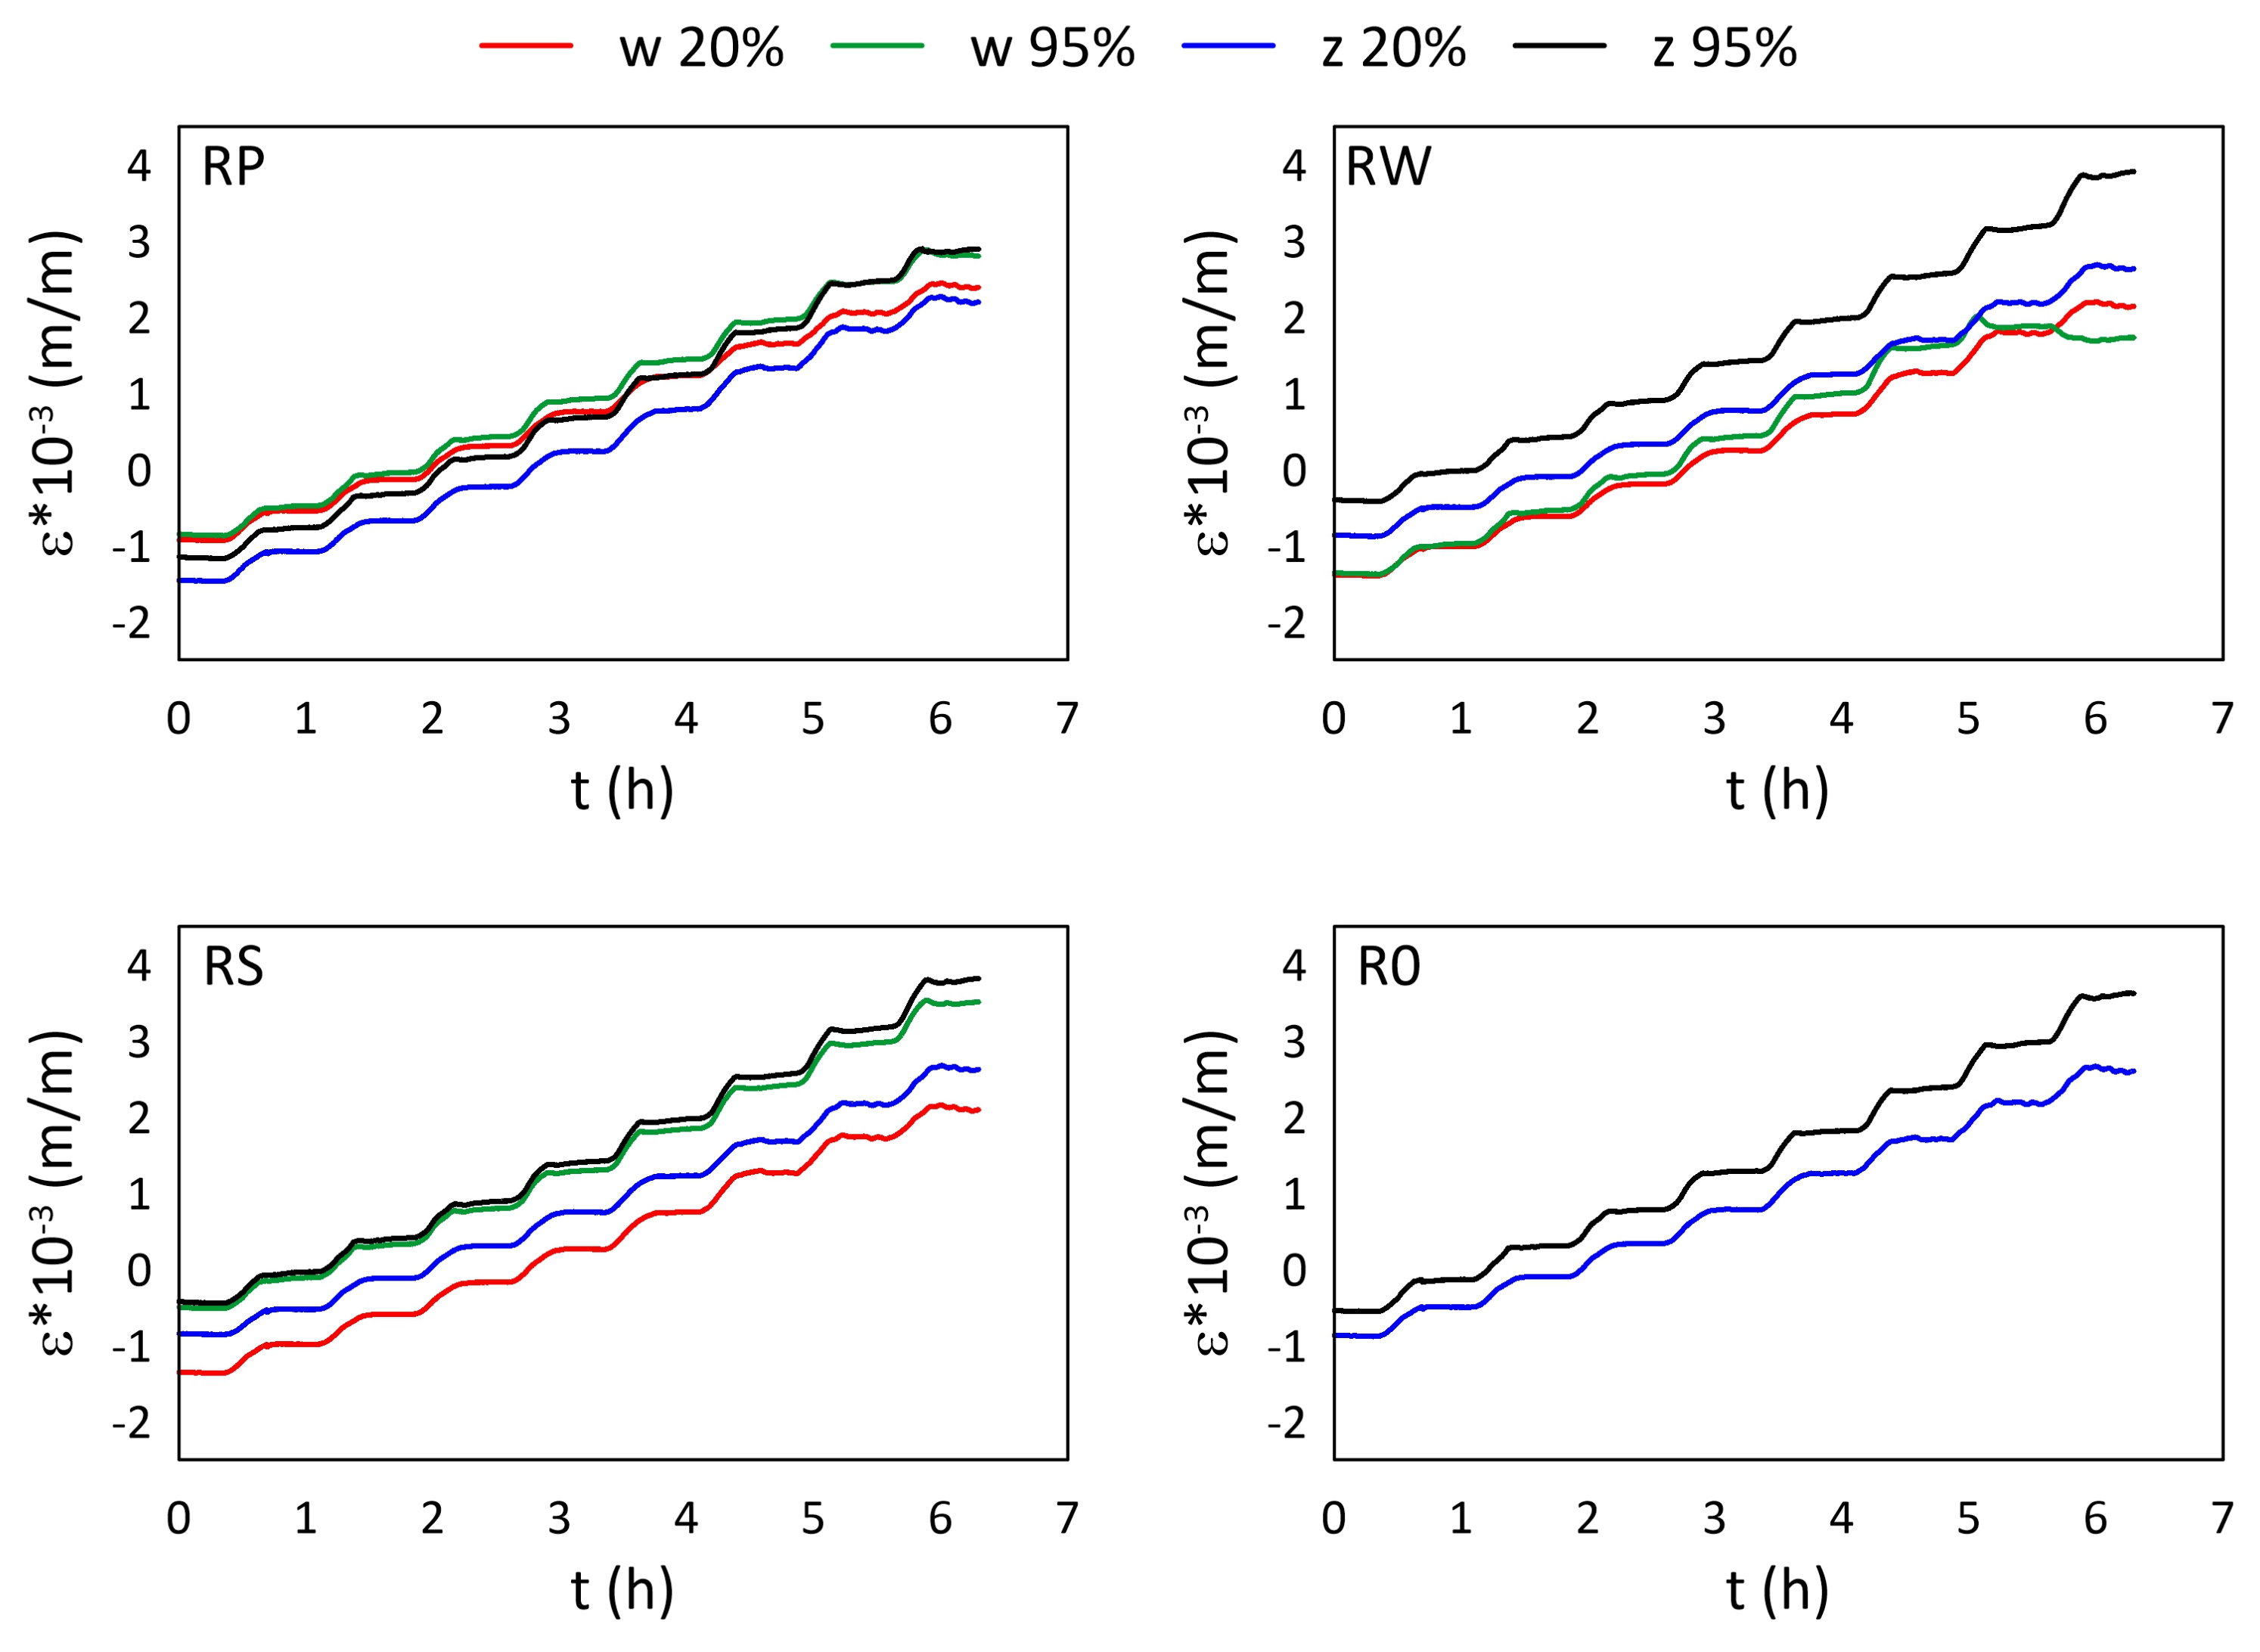
A comparison of mechanical strain
values for all M3 X samples exposed to elevated temperatures are presented in
Figure 5. For all sensors (except RPw) the influence of RH values is observable. The average strain differences between measurements performed for 20% RH and 95% RH are equal to
(m/m), while for RPw sensor the difference is one order of magnitude smaller. The strain values for 95% RH are higher, regardless of the temperature values. RWw sensor values for 40 °C and 50 °C are similar for both RH values. The RPw sensor behaves differently, probably due to its location inside the sample and the similarity between the gauge length (10 mm) and the sample thickness (12 mm).
A comparison of mechanical strain
values for all M3 X samples exposed to sub-zero temperatures are presented in
Figure 6. The achieved results are similar for all samples, regardless of the RH values and the location of the sensors. The average strain difference is equal to
(m/m).
A comparison of mechanical strain
values for all M3 Crystal samples exposed to elevated temperatures are presented in
Figure 7. Both FBG sensors (attached and embedded) from RP and RS samples show similar values for RH equal to 95%, regardless of the temperature. For RH equal to 20%, the strain values differ between embedded and attached sensors. For RW and RS, the attached strain values are higher, while for RP it is the opposite. Additionally, the strain values for RPw sensor determined for 20% RH up to 35 °C are similar (the average difference is ca.
(m/m)) to those measured for 95% RH (both RPw and RPz), while for higher temperatures the strain values are similar to RPz for 20% RH. In this case, the average difference is
(m/m). Strain values measured by RWw sensor for 95% RH are definitely smaller than those determined for the other embedded sensors under the same humidity level and are similar to the results achieved for 20% RH.
A comparison of mechanical strain
values for all M3 Crystal samples exposed to sub-zero temperatures are presented in
Figure 8. Contrary to M3 X material (see
Figure 6), M3 Crystal is sensitive to humidity. Strain values determined for 95% RH are always higher than for 20% RH, regardless of the temperature, while the strain values for both sensors (embedded and attached) in the same sample are similar. The average difference between the strain values is equal to
(m/m).
For the purpose of determining the differences among the FBG sensors measurement results performed under the same thermal and RH conditions, the mean strain differences were calculated and collected in
Table 6 and
Table 7.
The mean strain differences between samples (for attached sensors ‘
z’) were calculated using the following formulas
while for embedded sensors, (
w) were calculated using the formulas
where
m is equal to the number of intervals with stable temperature for the appropriate program (see
Figure 3) calculated for sensors described in
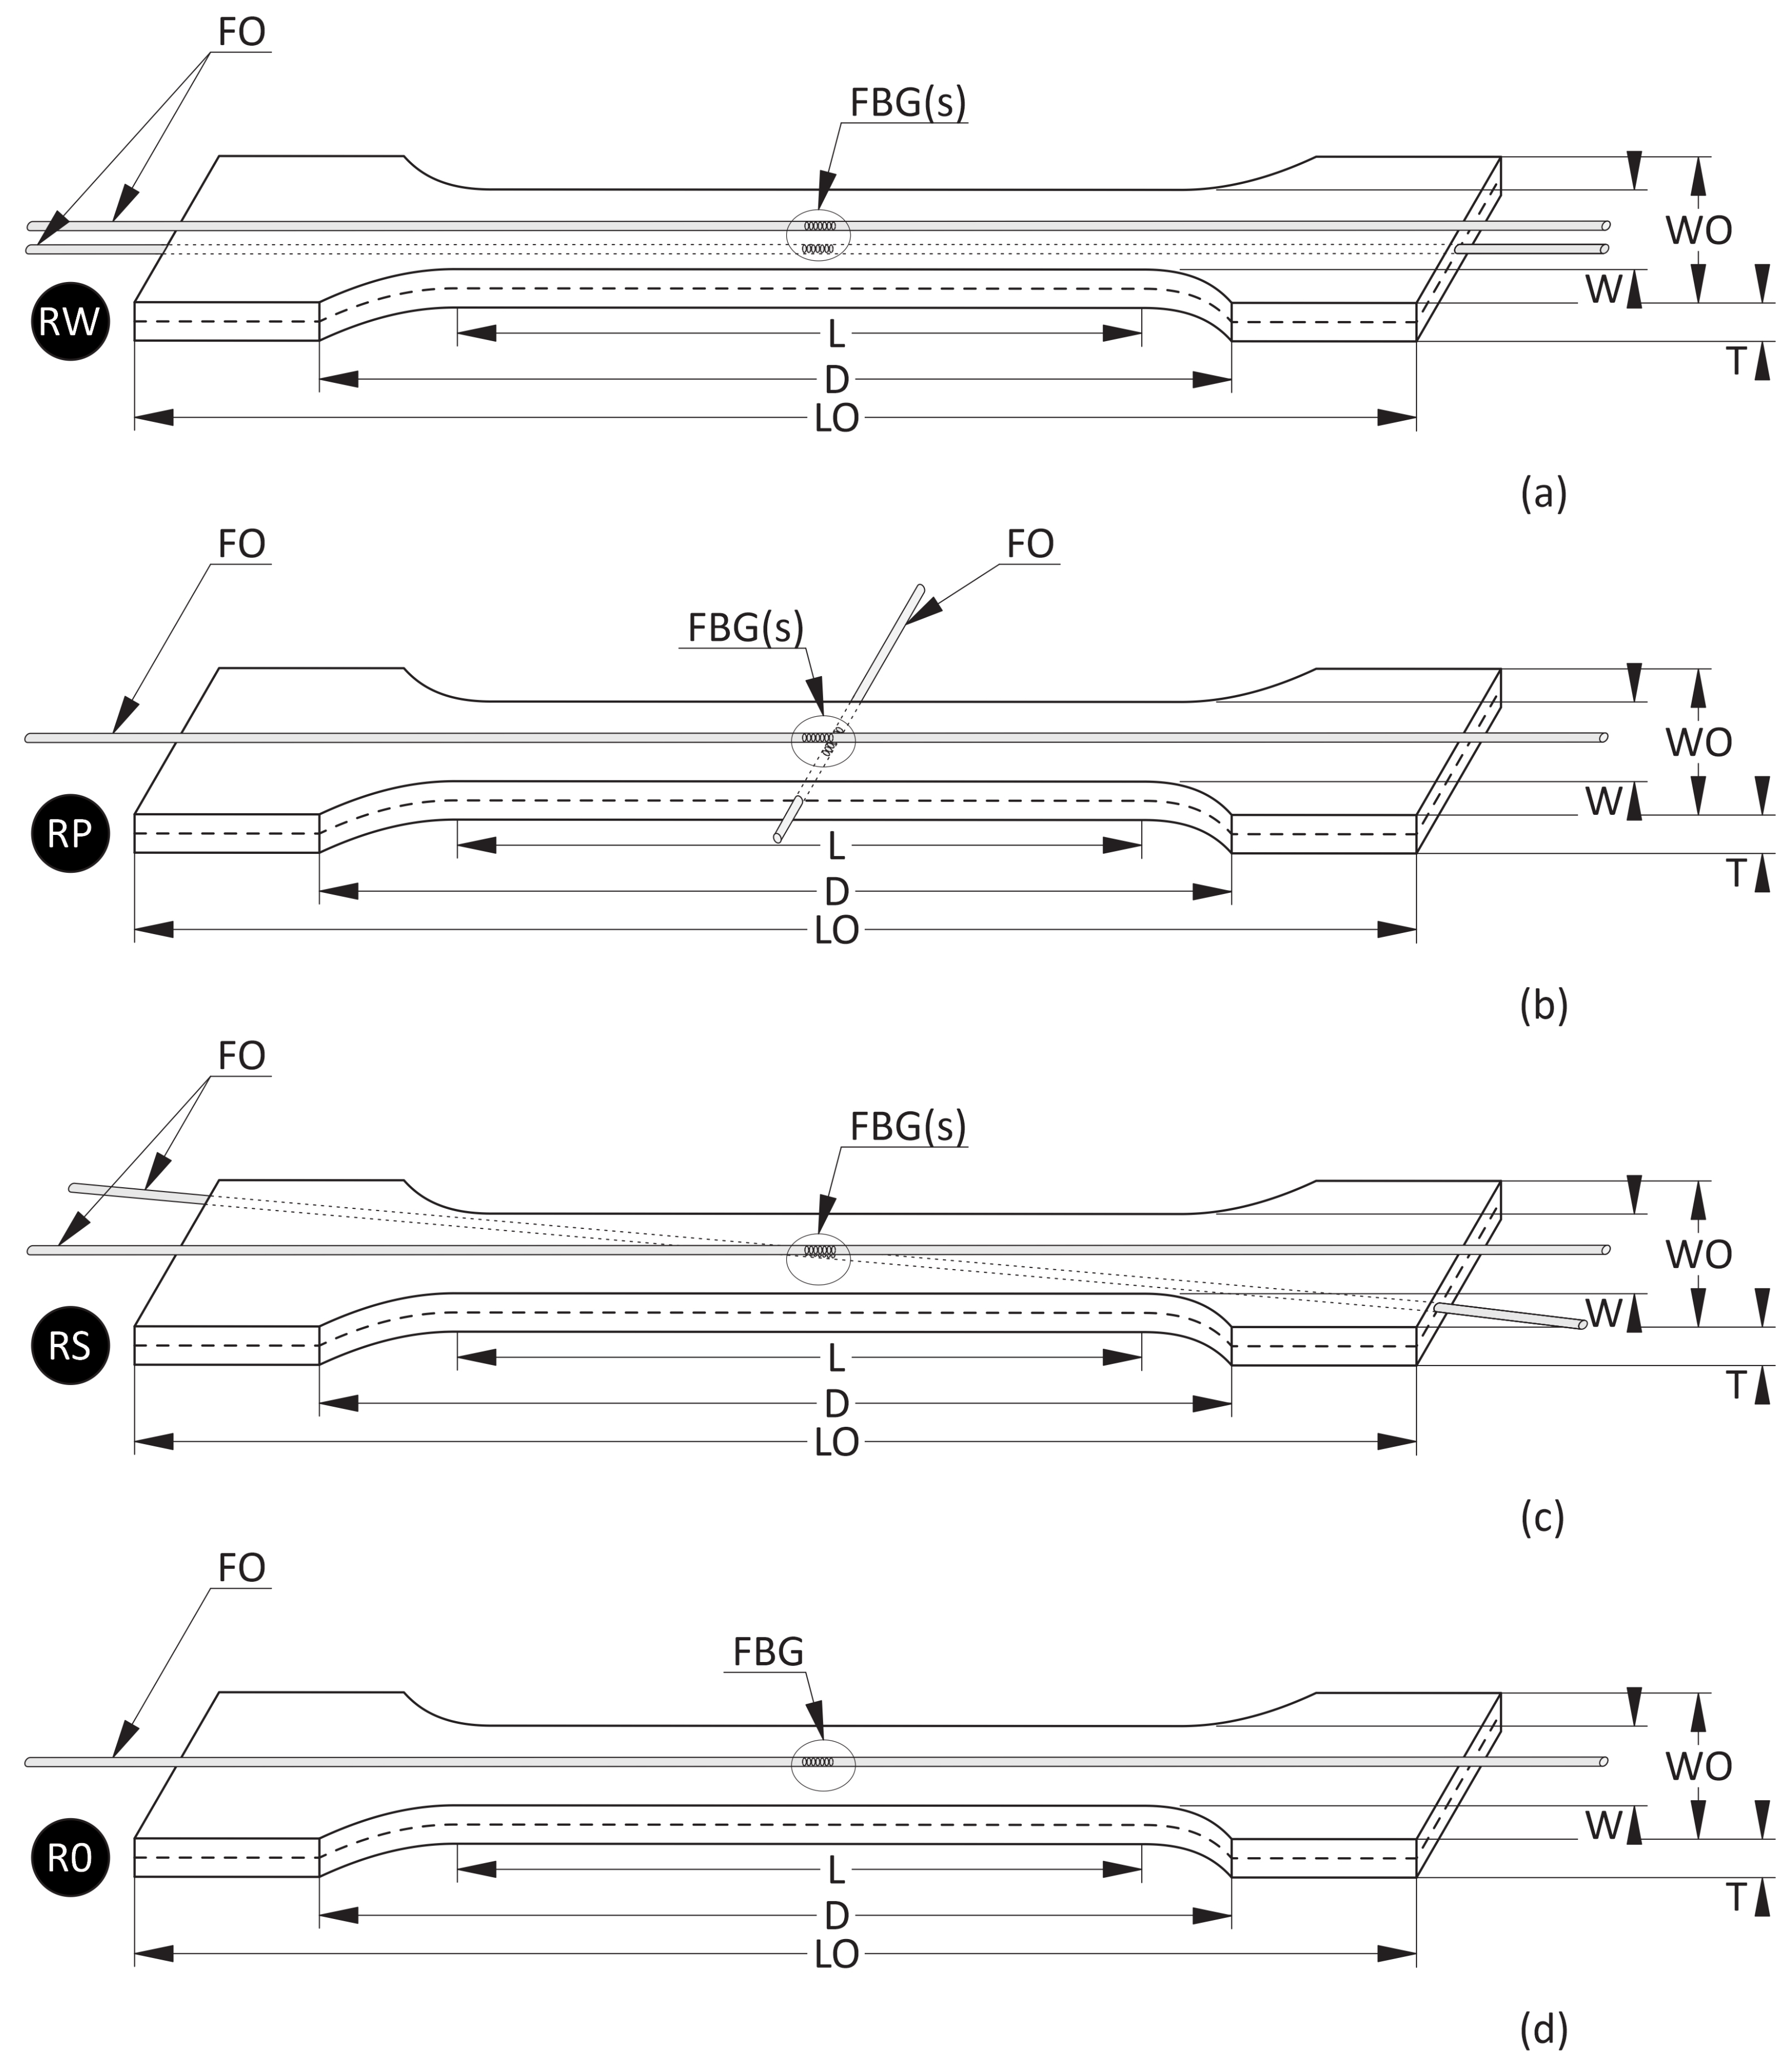
Table 5. For each case, the calculations were performed twice, separately for each RH value. Sensors from samples RW were chosen as the references, as both of them were laying along the main axis of the samples (compare schema
Figure 2). The mean strain value for all samples (
Table 6) was determined using the relationship
where
X means
S or
P, while
Y means
S,
P, or 0, and
n is the number of measurements (number of sensors multiplied by the number of considered RH values). RPw sensor influence was calculated as a mean value of
separately for 20% and 95% RH. The mean strain values for all sensors except RPw were calculated using Equation (
8) but without taking into consideration
separately for 20% and 95% RH.
A comparison of the mean strain differences among all samples is presented in
Table 6. In both cases, RPw sensor is highlighted as it was embedded perpendicular to the main axis of the sample—see
Figure 2. The differences in the behaviour of RPw sensor are well visible in
Table 6. For both materials and for both thermal cases, the strain differences for RPw are the highest.
The strain differences between embedded (
w) and attached (
z) sensors were calculated using the following formula
where
Z means
S,
W, or
P (to achieve the proper sample symbol), and
m is the number of measurements (number of intervals with stable temperature for the appropriate program—
Figure 3). The mean strain differences between embedded (
w) and attached (
z) sensors for all samples (
Table 7) were determined using the relationship
where
n is the number of samples and
,
, and
are calculated for particular sample using Equation (
9). The strain differences for RP sample were calculated using Equation (
9) for
Z equal
P. The mean strain values for all samples except RP were calculated using Equation (
10), taking into consideration
Z means
W and
S. The calculations were performed for two RH values separately to analyse the possible water diffusion influence on the polymer materials and FBG sensors measurements.
As both sensors (attached and embedded) in the same sample are surrounded by the same polymers, the expected strain differences under the same conditions were relatively small. Based on the authors’ experience they should be on the
(m/m) level, while the measurement accuracy of FBG sensors is
(m/m). The mean strain differences between measurements performed by embedded and attached FBG sensors in one sample (RW, RP, and RS) were determined. The mean values calculated for those three sample types are collected in
Table 7. It is well visible that, for M3 X exposed to elevated temperatures at 20% RH and sub-zero temperatures at 20% RH and 95% RH, the achieved results are on the expected level. Such differences for elevated temperatures and 95% RH are higher. They were probably related to the dissimilarity influence of humidity on the polymeric material: stronger on the element surface and weaker in the middle. For M3 Crystal, higher differences between embedded and attached sensors are observable than for M3 X. This is especially visible for elevated temperatures. There are two main probable reasons. The first is related to the structural changes in the material due to the maximal elevated temperatures in the test. The remaining effect is visible for all sensors for temperatures higher than 40 °C in
Figure 7. Such temperatures are ca. 5 °C smaller than the heat distortion temperature of the material (
Table 2). The other reason can be the relative humidity levels and the diffusion processes of water into the polymer. The humidity influence is smaller for sensors (RWw, RSw) embedded in the middle of the samples than on the sensors (RWz and RSz) attached to the samples’ surfaces. The same process caused the strain differences between RPw and RPz to be smaller. RPw sensor location and its direction according to the main axis of the sample (
Figure 2) increase the possibility of water diffusion along the embedded fibre optic due to the capillary effect occurrence. The process was described in more detail in [
34] for FBG sensors embedded in a glass fibre reinforced polymer sample.
Then the relative strain differences for embedded (
w) and attached (
z) sensors were calculated using the relationships
where
X means
S or
P while
Y means
S,
P, or 0. Sample RW was chosen as the reference value as the embedded sensor (RWw) was located along the main axis of the sample.
The mean values were calculated for each sensor and the results, in the form of percentage differences, are collected in
Table 8 and
Table 9 for embedded and attached sensors, respectively.
For M3 X material, the percentage difference was ca. 2% except RPw sensor under 95% RH. In such a case, the most possible reason is the influence of the water diffusion into the material and the capillary effect of the sensor that length is similar to the sample width. For M3 Crystal material, the average strain differences are very high for the elevated temperatures in comparison to the sub-zero temperatures. The observable effect is probably a result of lower heat distortion temperature (
Table 2) and its influence on the mechanical properties of the material—disturbance of the proper material response to the temperature loading.
In the next step, the relationship between strain and temperature was determined using the following formula:
where temperature level
is related to averaged temperature value from
n points for stable temperature conditions lasting 300 s and
m equal to the number of intervals with stable temperature for appropriate program (see
Figure 3). The averaged calculation error for temperature was 0.35 °C, whereas that for the strain was 8 × 10
−6 m/m. The measurement accuracy of the interrogator is equal to 1.0 × 10
−6 m/m, so the differences are neglected. The calculation errors were determined considering all measurements performed during the investigation for both materials jointly.
The resulting relationships are the thermal characteristics of materials that are useful for mechanical engineers and applied during the determination of strain in structures due to mechanical loading of structures operating under different environmental conditions. An example is the determination of strain originated from sea loading acting on a hull of a fast patrol boat for which the thermal characteristics of the material were defined based on a composite panel with the same structure as the hull [
35].
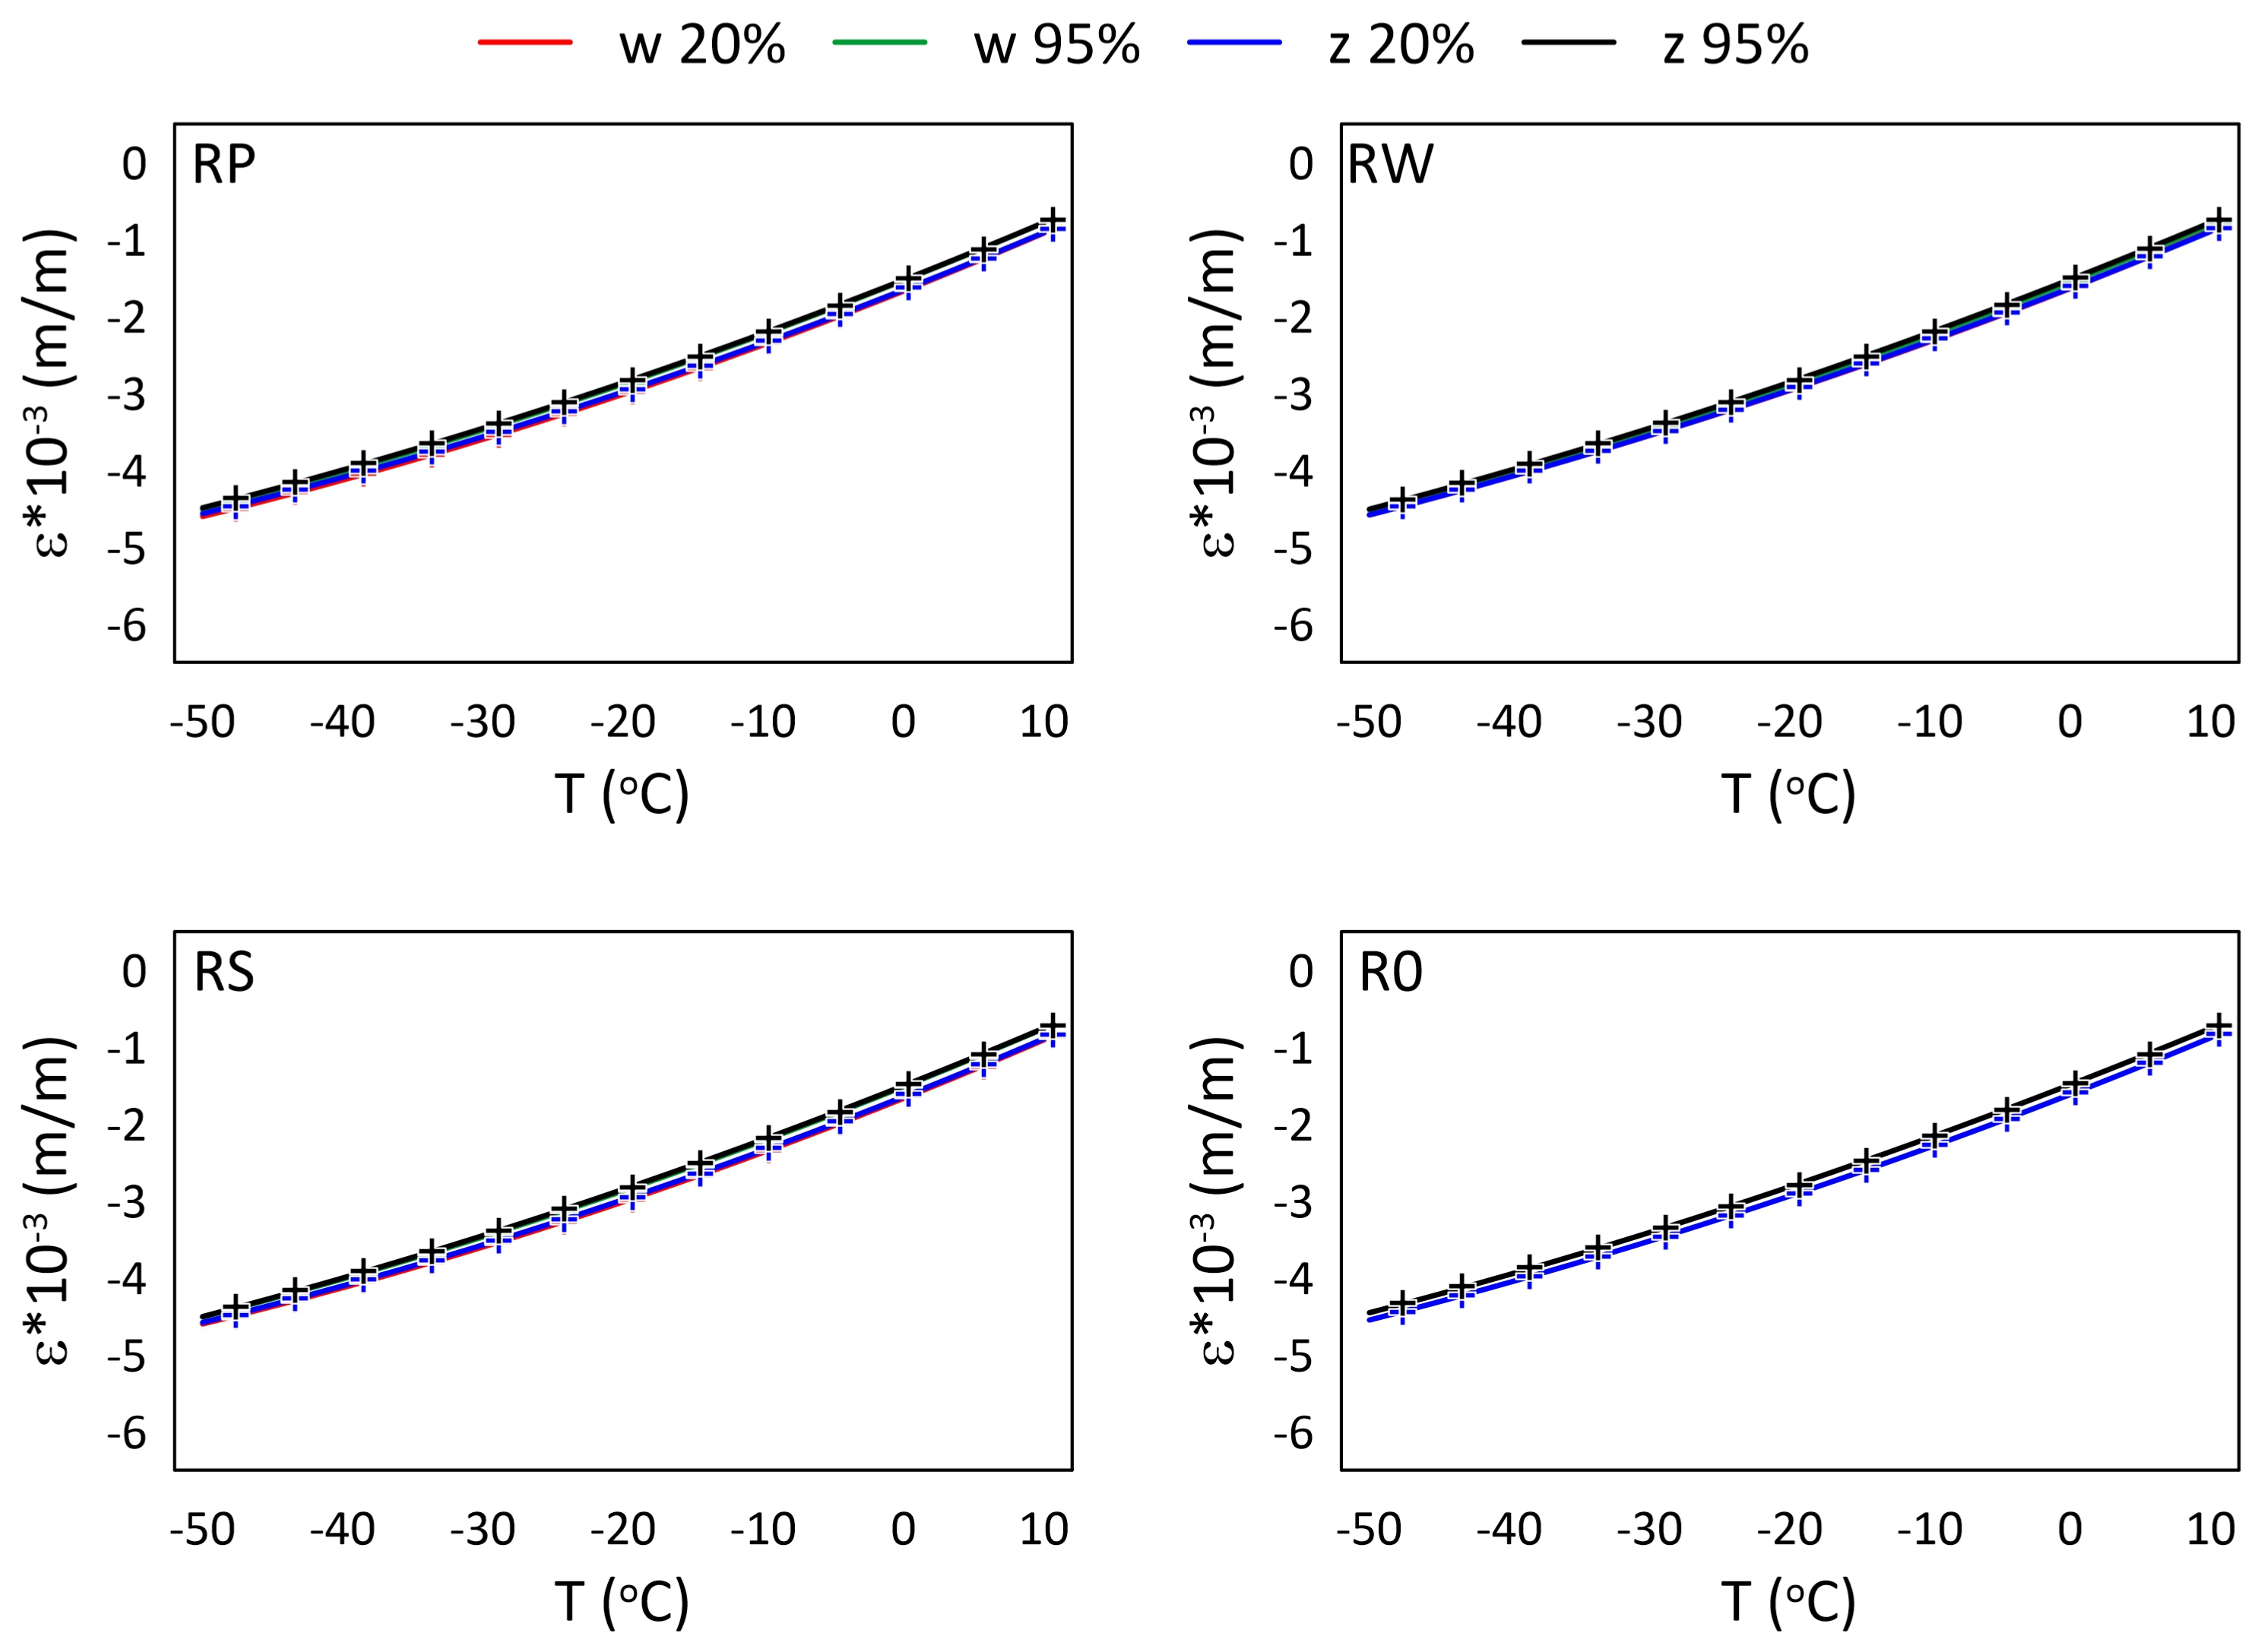
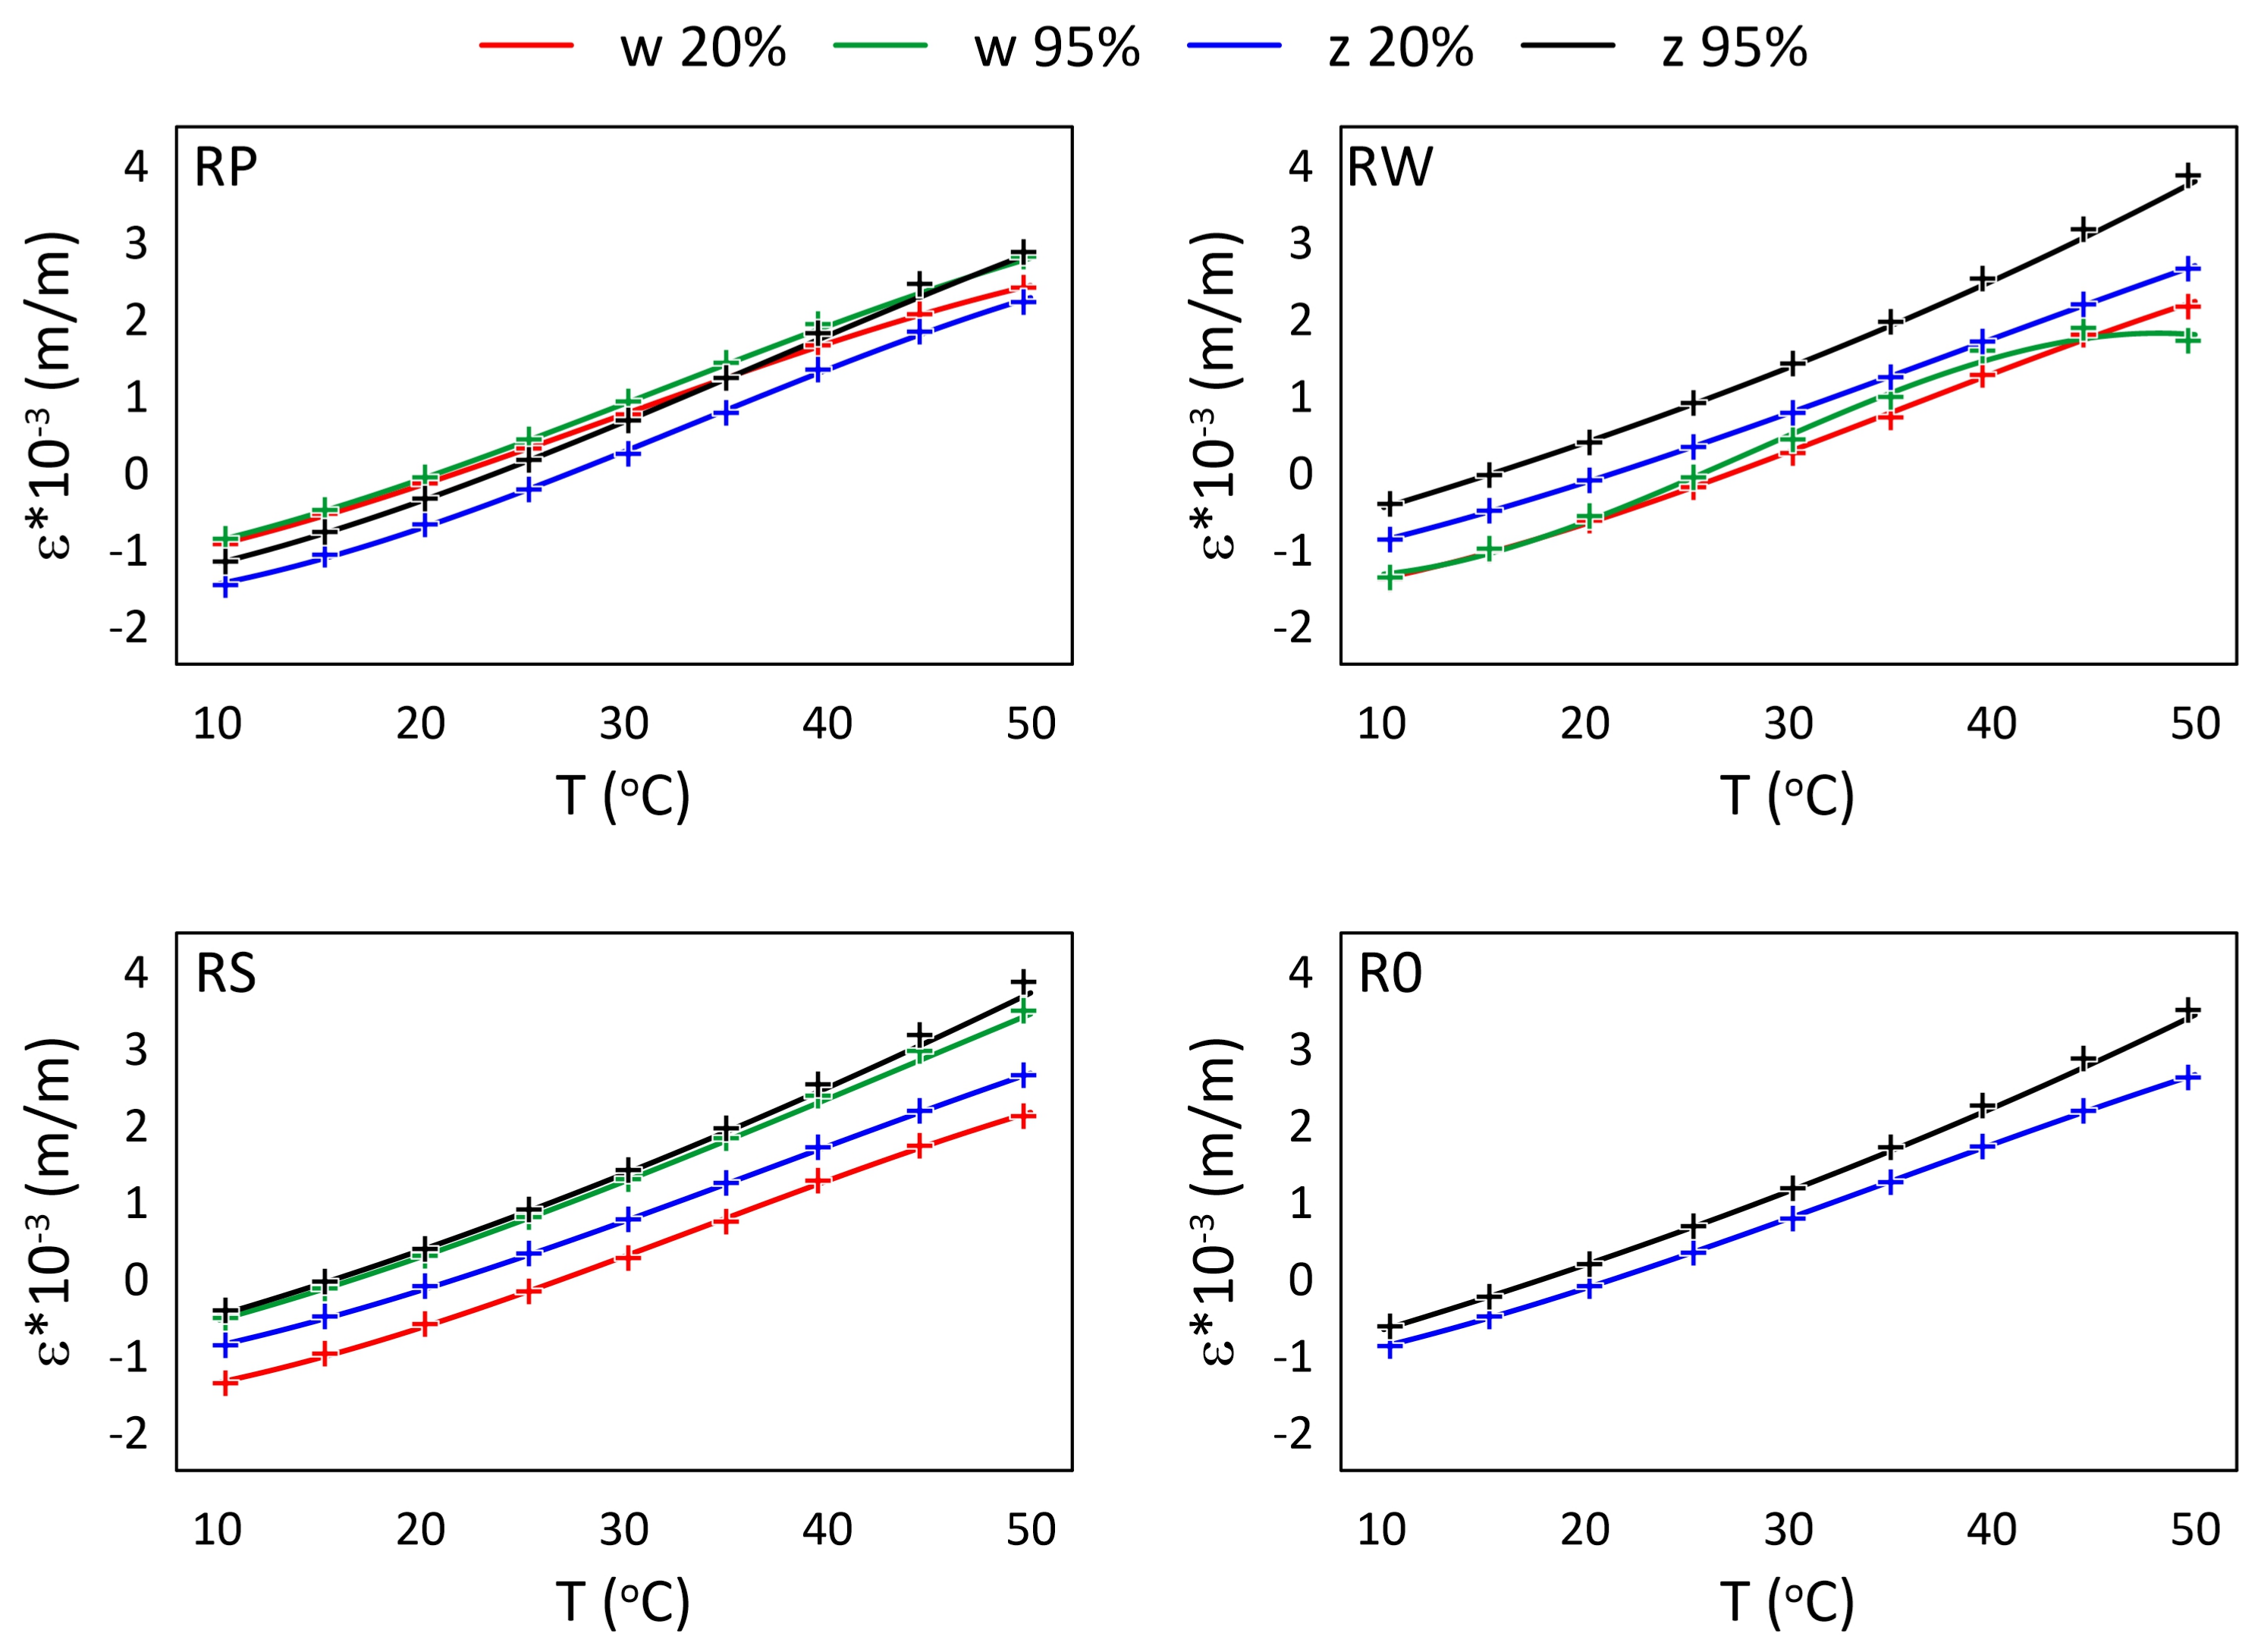
The relationships between strain values and temperature for all M3 X samples are presented in
Figure 9 and
Figure 10, while for all M3 Crystal samples in
Figure 11 and
Figure 12. The approximated curves for all sensors except RP
have similar shapes and can be written in a form of a polynomial; analogically, as was presented in [
29].
For M3 X material under elevated temperatures (
Figure 9), it is well visible that RPw sensor is more sensitive on RH than the other sensors. It is probably the effect of the sensor direction according to the main axis of the sample (
Figure 2). Generally, the strain values are similar for the same humidity levels regardless of the locations of the sensors (embedded or attached). It well agreed with the assumption related to using the same polymer for manufacturing samples and attaching sensors on their surfaces.
For M3 X material under sub-zero temperatures (
Figure 10) the determined relationships are similar for all sensors from all samples, regardless of the RH values. The water diffusion coefficient for the polymer is likely quite low. Therefore, the time when the sample during the thermal test is exposed to above zero temperatures (see
Figure 3b) is too short to allow enough water to diffuse into the material to change its thermal response in the FBG sensors location.
A comparison of strain values measured by embedded FBG sensor (corresponding to RWw sensor in the paper) and calculated numerically (finite element method) was presented and discussed in [
36]. For above zero temperatures, the average percentage error was ca. 3%, while for sub-zero temperatures it was ca. 5%.
For M3 Crystal exposed to elevated temperatures (
Figure 11), the differences among sensor measurements significantly increase with the temperature. When the temperature is close to the heat distortion temperature (see
Table 2) the differences between strain values determined for the sensors are the highest. It is especially visible for sensors RWw and RPw, where the strain distortion is also observable as the curves shape changes. Furthermore, the RH effect is visible as the increase in the distances between the curves (determined for the same sensor under 20% RH and 95% RH for temperatures higher than 40 °C).
For M3 Crystal exposed to sub-zero temperatures (
Figure 12) the influence of RH is visible. For all sensors, the strain values for 95% RH are higher than for 20% RH. The water diffuse coefficient for M3 Crystal is likely higher than for M3 X. Therefore, the time when the samples are in the above zero temperatures (
Figure 3b) is long enough to allow the polymer to absorb enough water to make its influence noticeable on the thermal strain measurements.
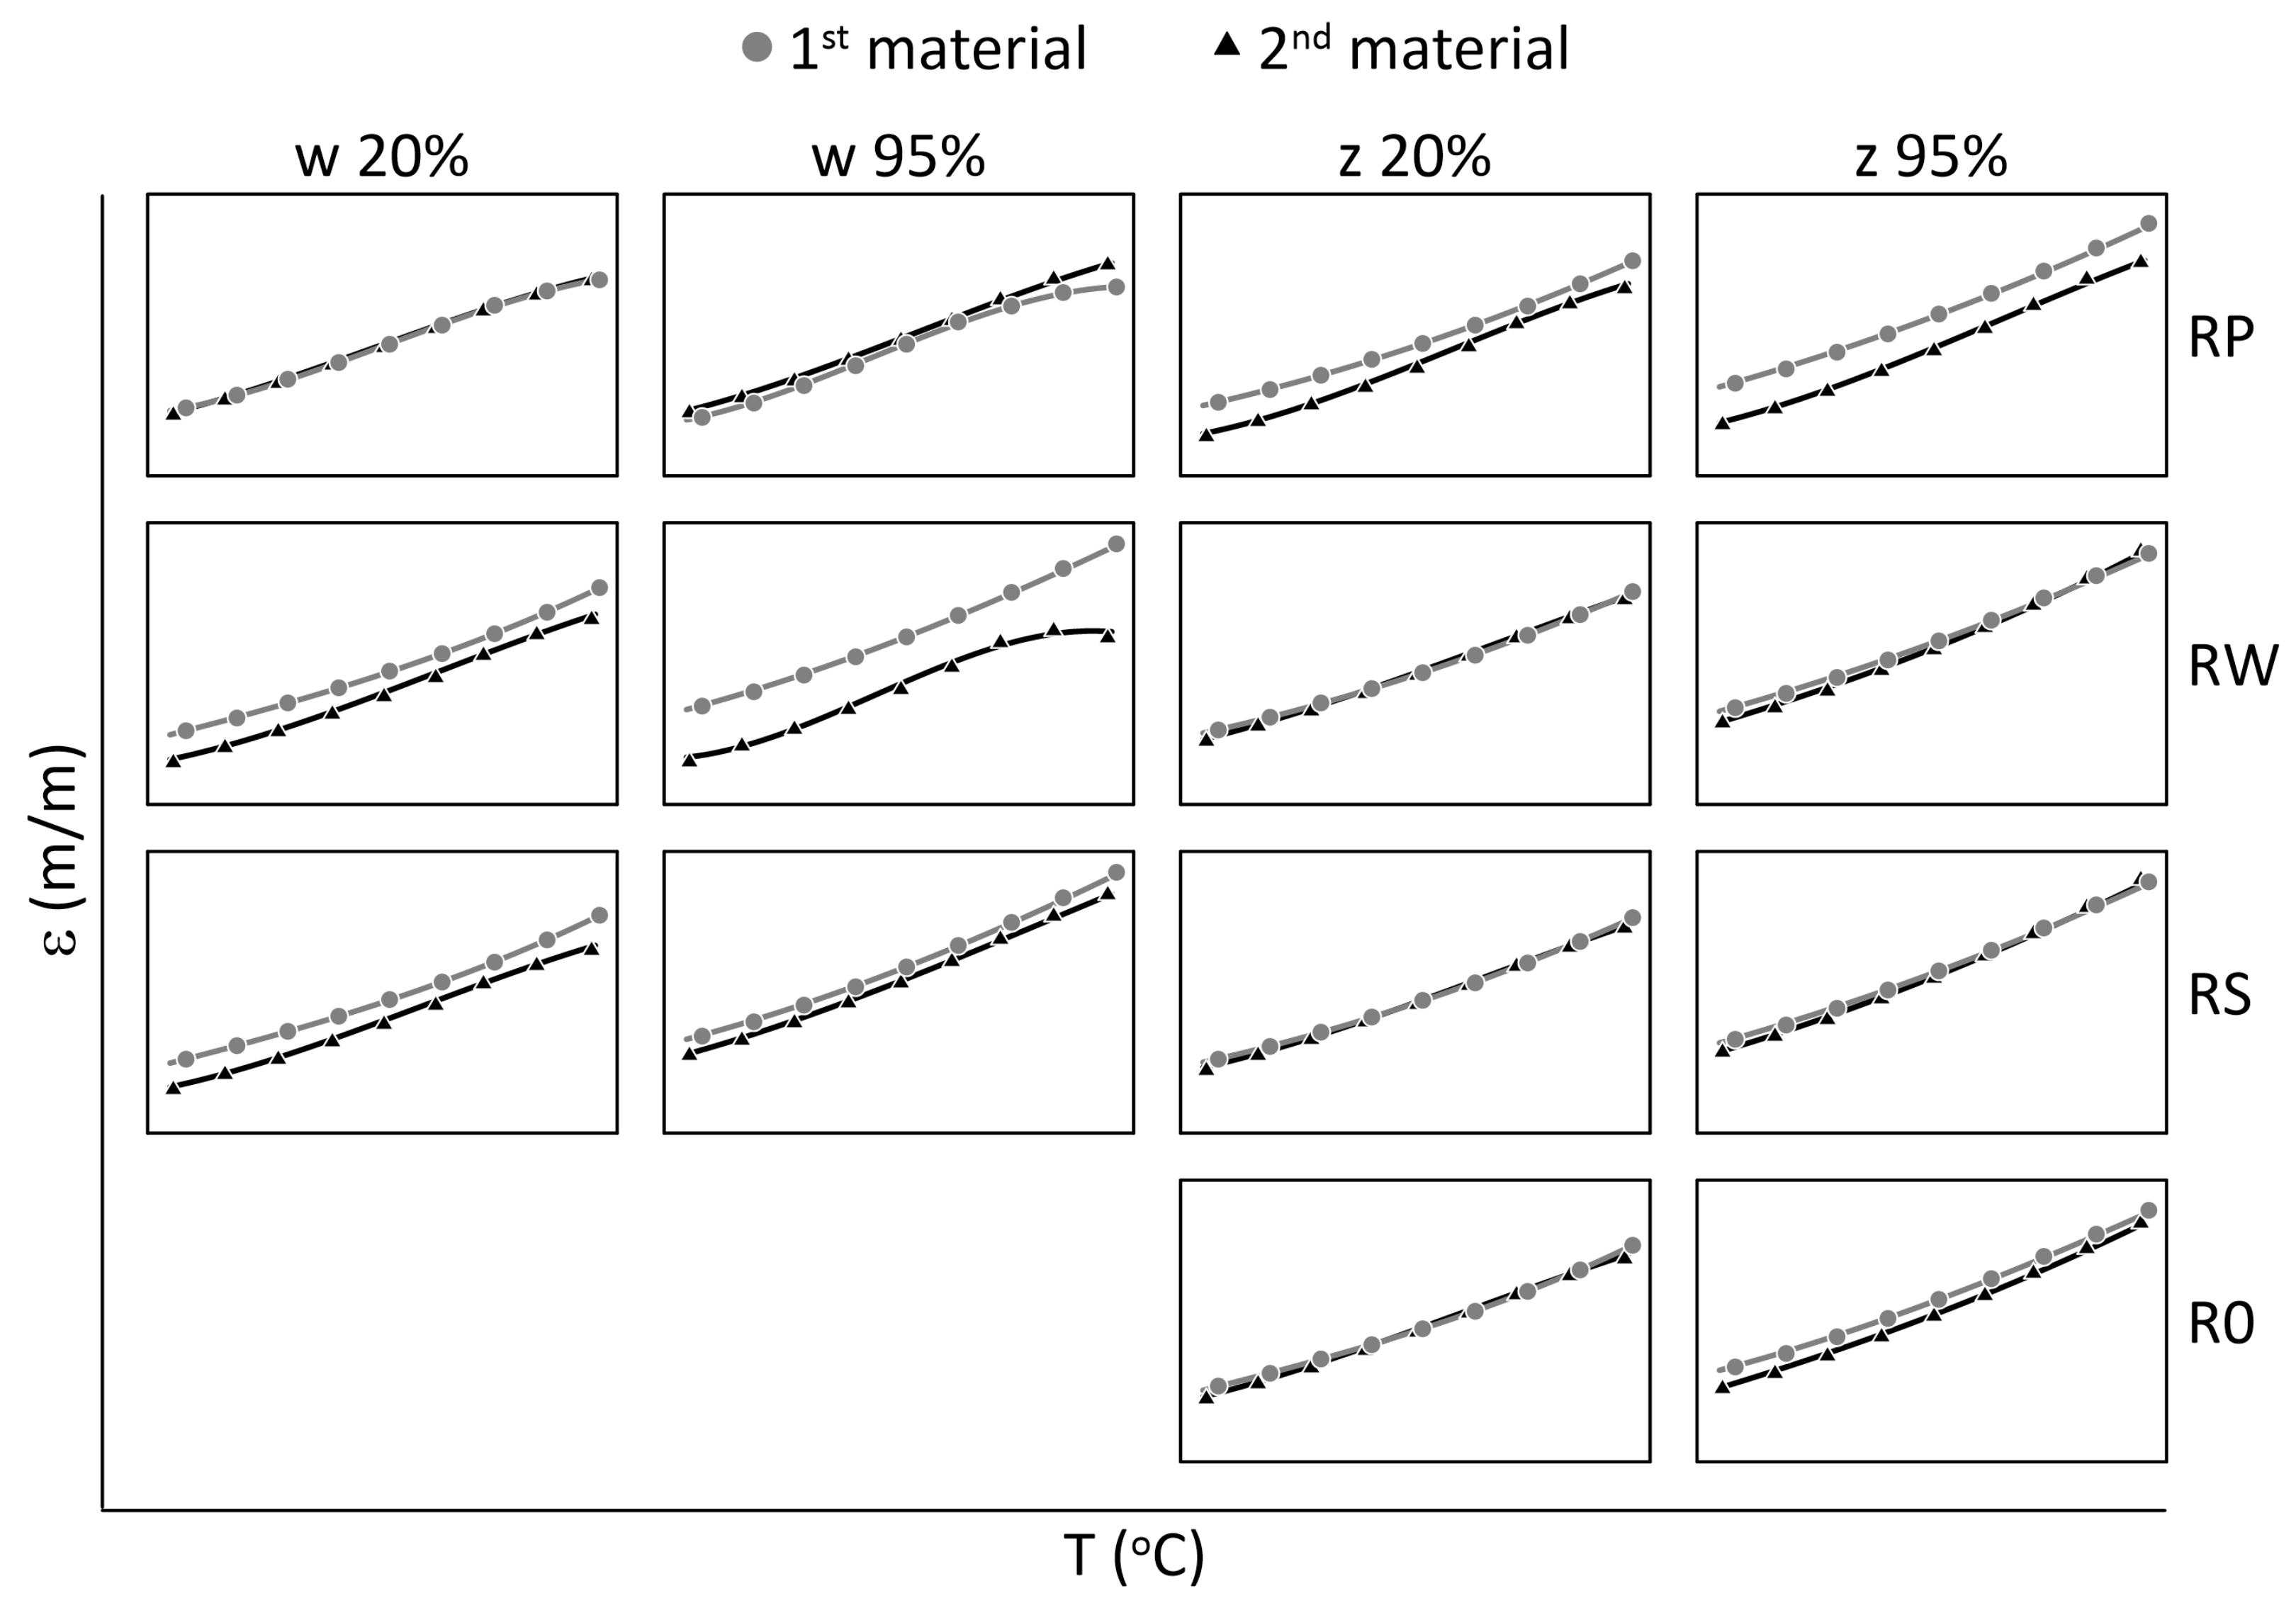
For the purpose of better understanding the differences between materials, a comparison of their behaviour under different temperatures and RH levels are presented in
Figure 13 and
Figure 14 for elevated and sub-zero temperatures, respectively.
The curves presented in
Figure 13 for elevated temperatures show that the relationships between materials are strongly related to the FBG sensors’ locations. As described earlier, the influence is higher for M3 Crystal material. Despite this, for the majority of cases, the strain values for M3 X are higher than the corresponding M3 Crystal strain values. For the purpose of better visibility of the materials’ strain relationships, the mean values of strain differences were calculated and collected in
Table 10. For each case, one sensor behaves differently, and the strain differences determined for it was significantly lower or higher than for the others. Such sensors with their maximal or minimal strain values are listed in the table. For almost all cases the sensors are from the RP sample type. Due to the definitely different behaviour of the sensors, they were not used for determining the mean strain differences between materials.
The strain differences between the strain curves determined for two considered materials (M3 X and M3 Crystal) were calculated using the following formula:
where
M is related to material (
M1 means M3 X and
M2 means M3 Crystal),
Z means
S,
W,
P, or 0 and is related to the samples,
x is related to the locations of the sensors (‘
w’ embedded or ‘
z’ attached), while m is the number of measurements (number of parts in programs (
Figure 3) with stable temperature values). The calculations were performed for each RH level separately. The mean strain differences for each RH level and the locations of the sensors (embedded and attached) were calculated using the following formula
where
n is the number of samples and
Z is related to all samples used in determining the average strain value. The calculations are performed according to columns of graphs presented in
Figure 13 and
Figure 14 for elevated and sub-zero temperatures, respectively. For elevated temperatures, the mean values were calculated for all sensors except the one highlighted in the bottom row in
Table 10. The
value determined for the sensor using Equation (
14) is listed in the table in the row with the maximal or minimal values. Except for one case, the sensors are from the RP sample type.
The curves presented in
Figure 14 for sub-zero temperatures show a strong relationship between strain and RH values. For all cases, the strain values for M3 X are higher than corresponding to them M3 Crystal values. The mean values collected in
Table 11 highlight the RH influence on M3 Crystal. Regardless of the sensor location, the mean differences between strain values in materials are equal to ca. 0.64 × 10
(m/m) and 0.18 × 10
(m/m) for 20% RH and 95% RH, respectively.
4.3. Tensile Test
All samples described above were then mechanically tested by the tensile test. Its aim was to determine the embedded fibre optic influence on the durability of the polymeric materials. The tensile tests were performed on universal static-dynamic testing machine HT-9711-25 (Hung Ta, Gwangmyoung Techno Park, Korea). A photograph of the sample mounted into the tensile machine jaws is presented in
Figure 15.
The tensile test results from the testing machine for all M3 X samples are presented in
Figure 16 and
Figure 17 for the samples after exposition to elevated and sub-zero temperatures, respectively. The tensile strength values are similar for all samples regardless of the previous thermal treatment parameters while the strain values differ among samples. The mean tensile strength value is equal to ca. 49 MPa, while the mean strain value is equal to 0.026 m/m. For both cases, samples RP show the smallest strain values (0.020 m/m). It is likely caused by the embedded sensor location (
Figure 2).
The tensile test results from the testing machine for all samples manufactured from M3 Crystal are presented in
Figure 18 and
Figure 19 for the samples after exposition on elevated and sub-zero temperatures, respectively. The elevated temperatures influence resulted in differences in the tensile strength values among samples and the maximal strength for R0 and RW is ca. 7 MPa higher than for the other two samples. For them, it is equal to ca. 51 MPa. Such a result does not occur for the samples exposed previously to sub-zero temperatures. For such cases, the mean tensile strength value is equal to ca. 46 MPa. Similarly to M3 X, the maximal strain values differ among samples.
Regardless of the material, the embedded sensors’ location, and thermal treatment, the maximal tensile strength values differ slightly. They are also comparable to the tensile strength values for intact samples listed in
Table 1 and
Table 2, for M3 Crystal and M3 X, respectively. Therefore, it can be concluded that the embedded fibre optic (with FBG sensor) occurrence does not affect the material strength.
More detailed analyses are presented for RW samples. The samples were chosen because both of their embedded and attached FBG sensors are located parallel to the main axis of the sample which was the main axis of loading during the tensile test. A set of photographs of RW samples after the tensile tests is presented for comparison in
Figure 20. The fracture characteristics depend on the material, while the break location is related to the thermal treatment that probably influenced the material’s internal structure. In both M3 X samples, the embedded fibre optics remained, and still join the parts of the samples. In both cases, a part of the sample in the form of a wedge dropped away during the tensile test. For both M3 Crystal samples, the typical brittle fracture was observed.
The strain values from both RWw and RWz sensors determined for the tensile tests are presented in
Figure 21 and
Figure 22 for M3 X and M3 Crystal, respectively. Both sensors from M3 X sample (
Figure 21) exposed previously to elevated temperatures show the same strain trends (values) up to the end of the test. The observed differences after the end of the test are related to the sensors’ condition after the fracture. Contrary to this, RWz sensor from the sample exposed previously to sub-zero temperatures is almost insensitive to the mechanical loading during the test. It was probably due to the attaching process failure, e.g., improper cleaning of the sample surface before the gluing process. The sensor behaviour is similar to extensometer sliding over the sample surface. Such behaviour occurs on a slippery surface of the measured sample and was observed for one of AM polymer samples during the tensile tests. For the majority of sensors (except RWz sensor after the sub-zero treatment), the strain curve shapes show that, after the maximal strain (corresponding to the maximal stress in
Figure 16 or
Figure 17) the remained strain value in the material is neglected.
Contrary to this, sensors from M3 Crystal samples (
Figure 22) indicate changes in the material structures—the strain levels after the end of the test are stable and their values are corresponding to the maximal strain values. The only difference is in RWw sensor after the sub-zero treatment because the sensor was broken during the test.
A comparison of the maximal strain values determined from the testing machine and the FBG sensors are collected in
Table 12. For each case of the tensile test, two strain values (from the machine) are given: for RW sample and the mean value for all samples. The achieved results for M3 X material show a good agreement. The percentage difference (between FBG sensors and extensometer) in relation to RW sample is ca. 17% (ca. 20% comparing to the mean value from all samples). The differences can be related to the analysed area of the sample: local (FBG sensors) and global (extensometer).
A finite element method model was used for the determination of strain in the embedded FBG sensor location. The maximal strain value determined numerically was equal to 0.028 m/m, while the tensile strength was equal to 46 MPa. The difference is equal to 10% and it is on an acceptable level. The numerical model details are presented in [
37].
The percentage strain differences for M3 Crystal are much higher. The minimum value is for RWw sensor after the sample exposition to elevated temperature and is equal to ca. 36%, while the maximal percentage difference is over 70%. This indicates that the FBG sensors embedded in AM M3 Crystal samples determine the mechanical strain values originated from the tensile force with a very high error. Therefore, it is not recommended to use the sensors for MJP M3 Crystal material for SHM purposes.


