Article

Preparation and Electromagnetic Absorption Properties of Fe73.2Si16.2B6.6Nb3Cu1 Nanocrystalline Powder

1
School of Materials Science and Engineering, Dalian University of Technology, Dalian 116081, China
2
Ningbo Research Institute, Dalian University of Technology, Ningbo 315000, China
*
Authors to whom correspondence should be addressed.
Materials 2022, 15(7), 2558; https://doi.org/10.3390/ma15072558
Submission received: 9 March 2022 / Revised: 28 March 2022 / Accepted: 29 March 2022 / Published: 31 March 2022
(This article belongs to the Special Issue Alloys and Composites: Structural and Functional Applications)

Abstract

:
In order to decrease and control electromagnetic pollution, absorbing materials with better electromagnetic wave absorption properties should be developed. In this paper, a nanocrystalline alloy ribbon with the composition of Fe73.2Si16.2B6.6Nb3Cu1 was designed and prepared. Nanocrystalline alloy powder was obtained by high-energy ball milling treatment. The effects of ball milling time on the soft magnetic properties, microstructure, morphology, and electromagnetic wave absorption properties of alloy powder were investigated. The results showed that, as time increased, α-(Fe, Si) gradually transformed into the amorphous phase, and the maximum saturation magnetization (Ms) reached 135.25 emu/g. The nanocrystalline alloy powder was flakelike, and the minimum average particle size of the powder reached 6.87 μm. The alloy powder obtained by ball milling for 12 h had the best electromagnetic absorption performance, and the minimum reflection loss RLmin at the frequency of 6.52 GHz reached −46.15 dB (matched thickness was 3.5 mm). As time increased, the best matched frequency moved to the high-frequency direction, and the best matched thickness decreased, while the maximum effective absorption bandwidth ΔfRL<−10 dB was 7.22 GHz (10.78–18 GHz).

1. Introduction

With the development of the power electronics industry, the problem of electromagnetic pollution has become more and more serious. In order to solve the increasingly serious electromagnetic pollution problem, it is necessary to develop excellent absorbing materials. Usually, the absorbing material is composed of an absorber and a matrix material, and the absorber is the key to affecting the absorbing performance of the absorbing material. Absorbing materials can also be used in military stealth technology, which is a cutting-edge technology to avoid military radar detection, identification, and tracking strikes. Therefore, the development of absorbing materials with excellent performance is of great practical significance [1,2].
According to their loss mechanism, absorbing materials can be divided into three types: resistive type (silicon carbide, carbon nanotubes, graphene, etc.) [3,4,5,6,7], dielectric loss type (ferroelectric ceramics, MnO2, etc.), and magnetic loss type (ferrite [8,9,10,11], carbonyl iron [12,13,14,15,16], magnetic metal alloy powder [17,18,19,20,21,22,23,24,25], etc.). Magnetic alloy powders have been widely studied for their high absorption intensity and wide absorption band. Duan et al. [18] used a high-energy ball milling method to obtain FeCoNi powder with different ball milling times. They found that, with the increase in ball milling time, the wave absorption performance of the powder was enhanced, and the RLmin reached −32.4 dB when the ball milling time was 90 h. Chen et al. [19] and Duan et al. [20] prepared FeSiCr and FeSiAl powders, respectively, and studied the effect of ball milling time on the wave absorption performance. The results showed that the absorbing properties of the alloy were enhanced after ball milling. When RLmin was −41.5 dB and −22.2 dB, ΔfRL<−10 dB reached 3.6 GHz and 6.6 GHz, respectively. All the above results indicated that the morphology of the alloy can be changed by high-energy ball milling to improve the absorbing properties of the alloy. In addition, the bandwidth properties of the absorbing materials with strong absorption properties also need to be strengthened. Duan et al. prepared FeCoNiCuAl [22] and FeCoNiCrAl high-entropy alloy powder [23] by high-energy ball milling; the RLmin was −47.55 dB, but the effective absorption bandwidth of the two alloys was less than 2.5 GHz. Lan et al. [24] prepared FeCoNiCrCuAl hollow high-entropy alloy powder with an RLmin of −40.2 dB and a ΔfRL<−10 dB of 4.48 GHz. Zhang et al. [25] obtained a high-entropy FeCoNiCuZn alloy powder with an RLmin of −14.69 dB and a ΔfRL<−10 dB of 2.5 GHz. The existing materials cannot have both strong absorption and a wide frequency band; therefore, studies should be focused on the development of new absorbing materials.
Fe-based nanocrystalline materials include amorphous and nanocrystalline composite phases. The nano-size grains, well dispersed in the amorphous matrix, can effectively reduce the magnetostrictive coefficient; thus, the soft magnetic properties can be accordingly optimized. Therefore, Fe-based nanocrystalline alloys present excellent soft magnetic properties such as high saturation magnetization MS, high permeability μ, low correction strength HC, and low iron loss P, which make them promising soft magnetic materials [26,27,28,29]. In this regard, Fe-based nanocrystalline alloys are expected to become excellent absorbing materials due to their excellent soft magnetic properties.
According to previous studies, the size and morphology of the powder particles of the absorbing material can greatly influence absorbing properties [18,19,20]. Therefore, in this study, the method of high-energy ball milling was used to control the effect of Fe-based nanocrystalline alloy powder particle size and mechanical ball milling time on the microstructure, morphology, soft magnetic properties, and wave absorption properties of Fe-based nanocrystalline powders. It is well known that obtaining powders via a traditional process (pulverization) can bring many economic benefits, but it should be noted that it is relatively easy to obtain amorphous powders by pulverization, whereas it is not easy to control the proportion of nanocrystalline phase in the powders. In addition, the soft magnetic properties of the powders obtained by pulverization are generally lower than ball-milling samples after spin-casting. Therefore, the excellent performance of Fe-based nanocrystalline absorbing materials can be further developed.

2. Experimental Procedures

Fe73.2Si16.2B6.6Nb3Cu1 alloy ingots were melted by vacuum arc smelting, and the amorphous alloy ribbon (22 μm in thickness) was prepared by a single-roll melt-spinning method. The amorphous alloy ribbon was annealed in vacuum to get Fe73.2Si16.2B6.6Nb3Cu1 nanocrystalline alloy ribbon. The specific process was as follows: firstly, the amorphous ribbon was heated to 450 °C in a vacuum environment, and the temperature was held for 100 min. Then, the temperature was continuously heated to 530 °C, and the temperature was held for 100 min. Finally, the ribbon-containing nanocrystalline structure was obtained by cooling in the furnace. Then, nanocrystalline alloy powders were prepared by the dry milling method. The nanocrystalline ribbons were put into a stainless-steel vacuum ball milling tank with a ball-to-material ratio of 10:1. The tank was pumped to 8 × 10⁻² MPa for high-energy mechanical ball milling. The rotating speed was 250 r/min. In this experiment, the ball milling time was set to 6, 8, 10, and 12 h according to the powder yield. Hence, the nanocrystalline alloy powders were obtained after mechanical high-energy ball milling. The saturation magnetization (Ms) and coercivity (HC) of the powders were measured by a vibrating sample magnetometer (VSM) (Lake Shore 7410) (Lake Shore Company, Westerville, OH, USA). The phase and microstructure of the powders were characterized by X-ray diffraction (XRD-6000, Cu target) (Shimadzu, Japan) and transmission electron microscopy (JEM-2100F) (JEOL, Akishima, Japan). The micromorphology of the powder was observed under a scanning electron microscope (SEM) (JSM-6360LV) (JEOL, Akishima, Japan), and its elements were analyzed by an energy-dispersive spectrometry (EDS). A vector network analyzer (VNA) (8720B) (Keysight, Santa Rosa, CA, USA) was used to measure the absorbing properties of the powder. The mass ratio of the alloy powder to the paraffin wax was 7:3.

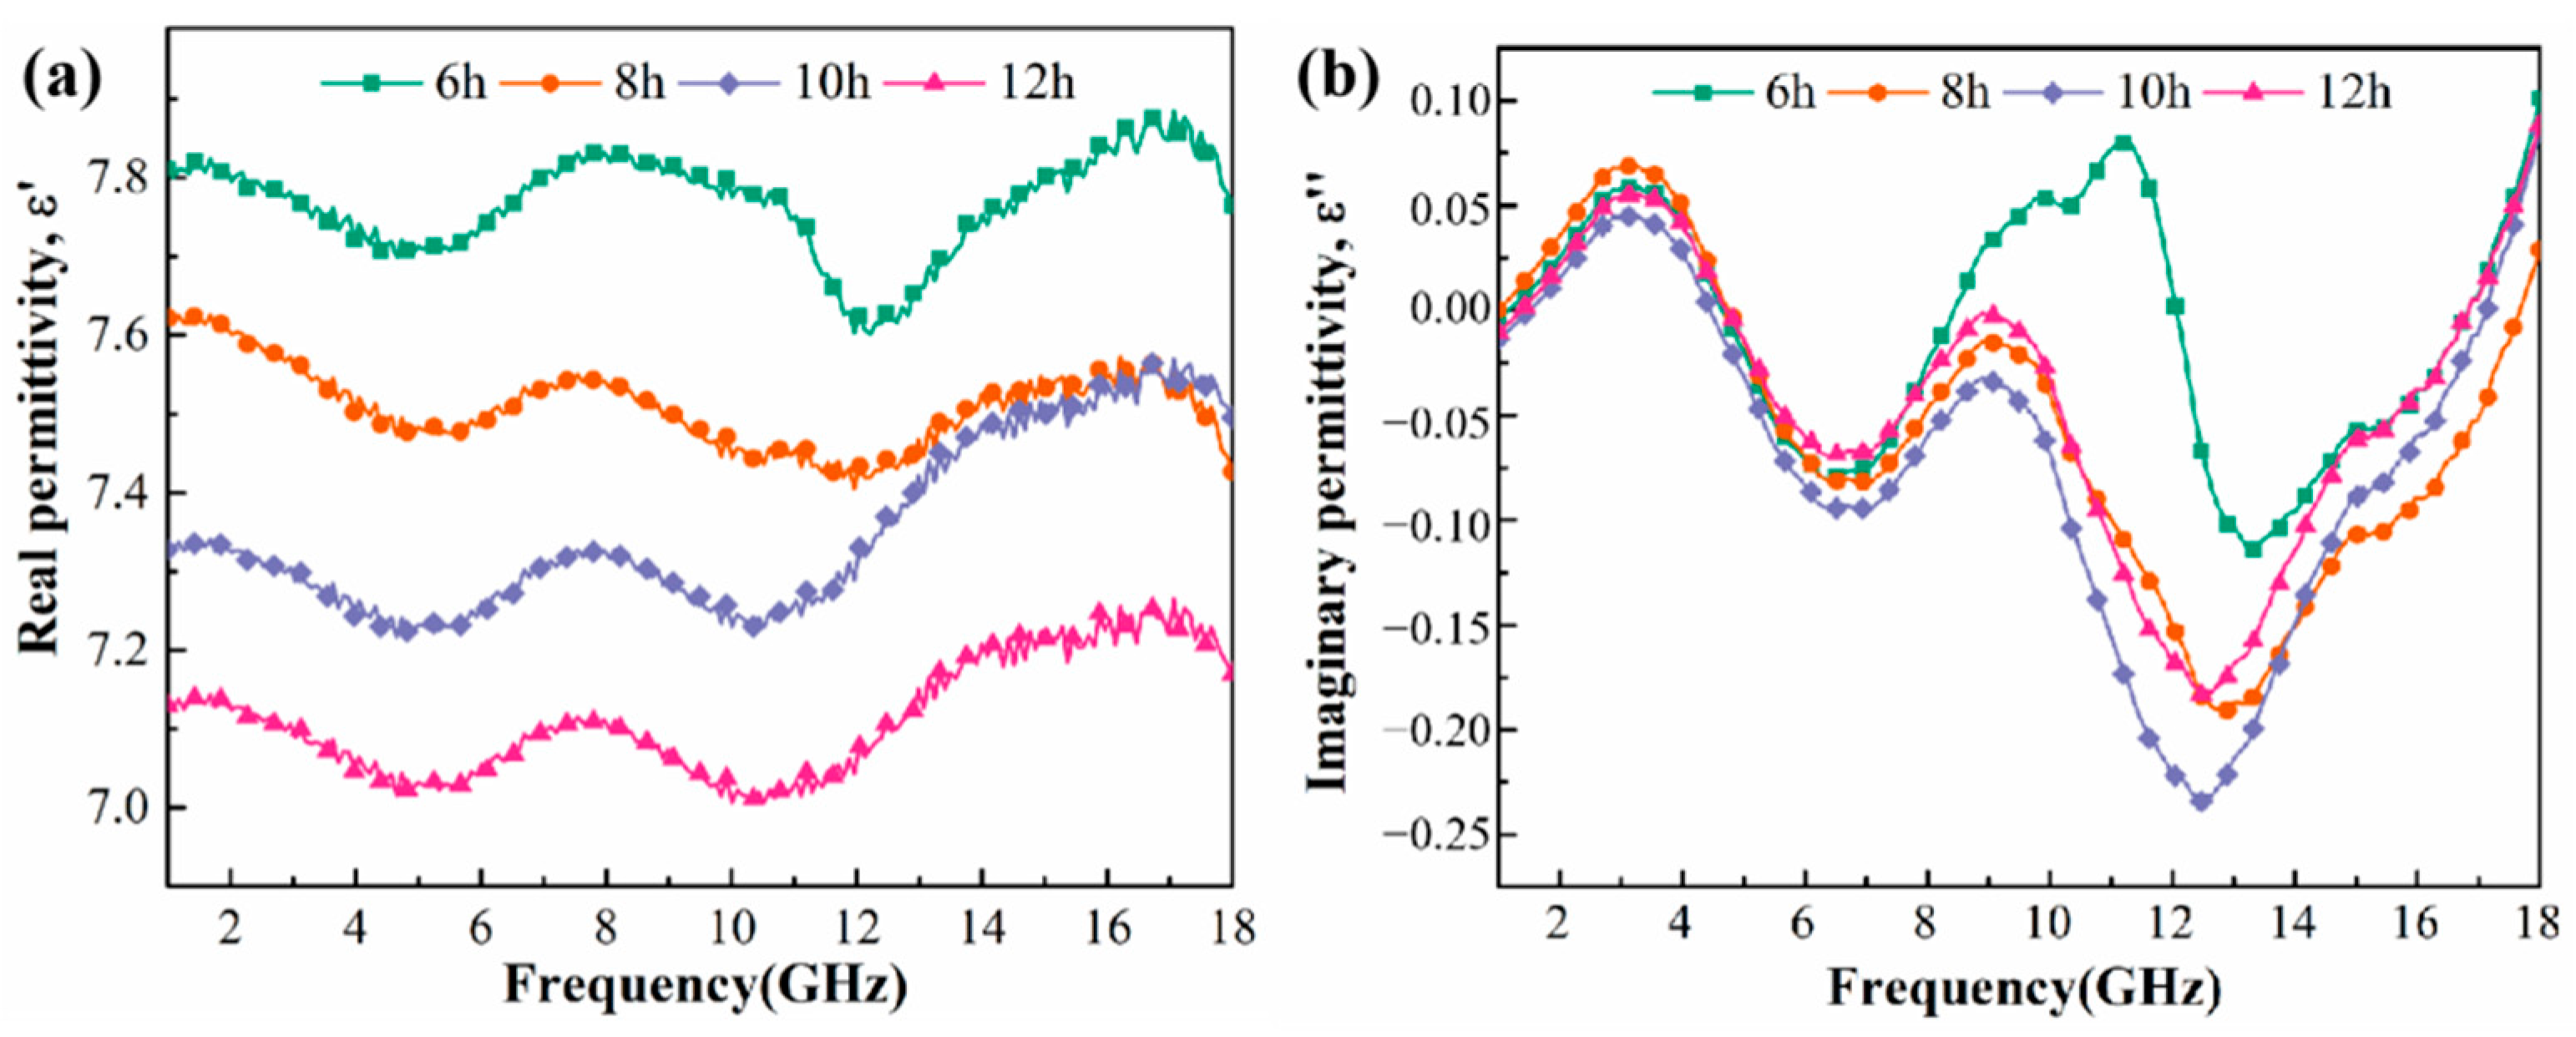
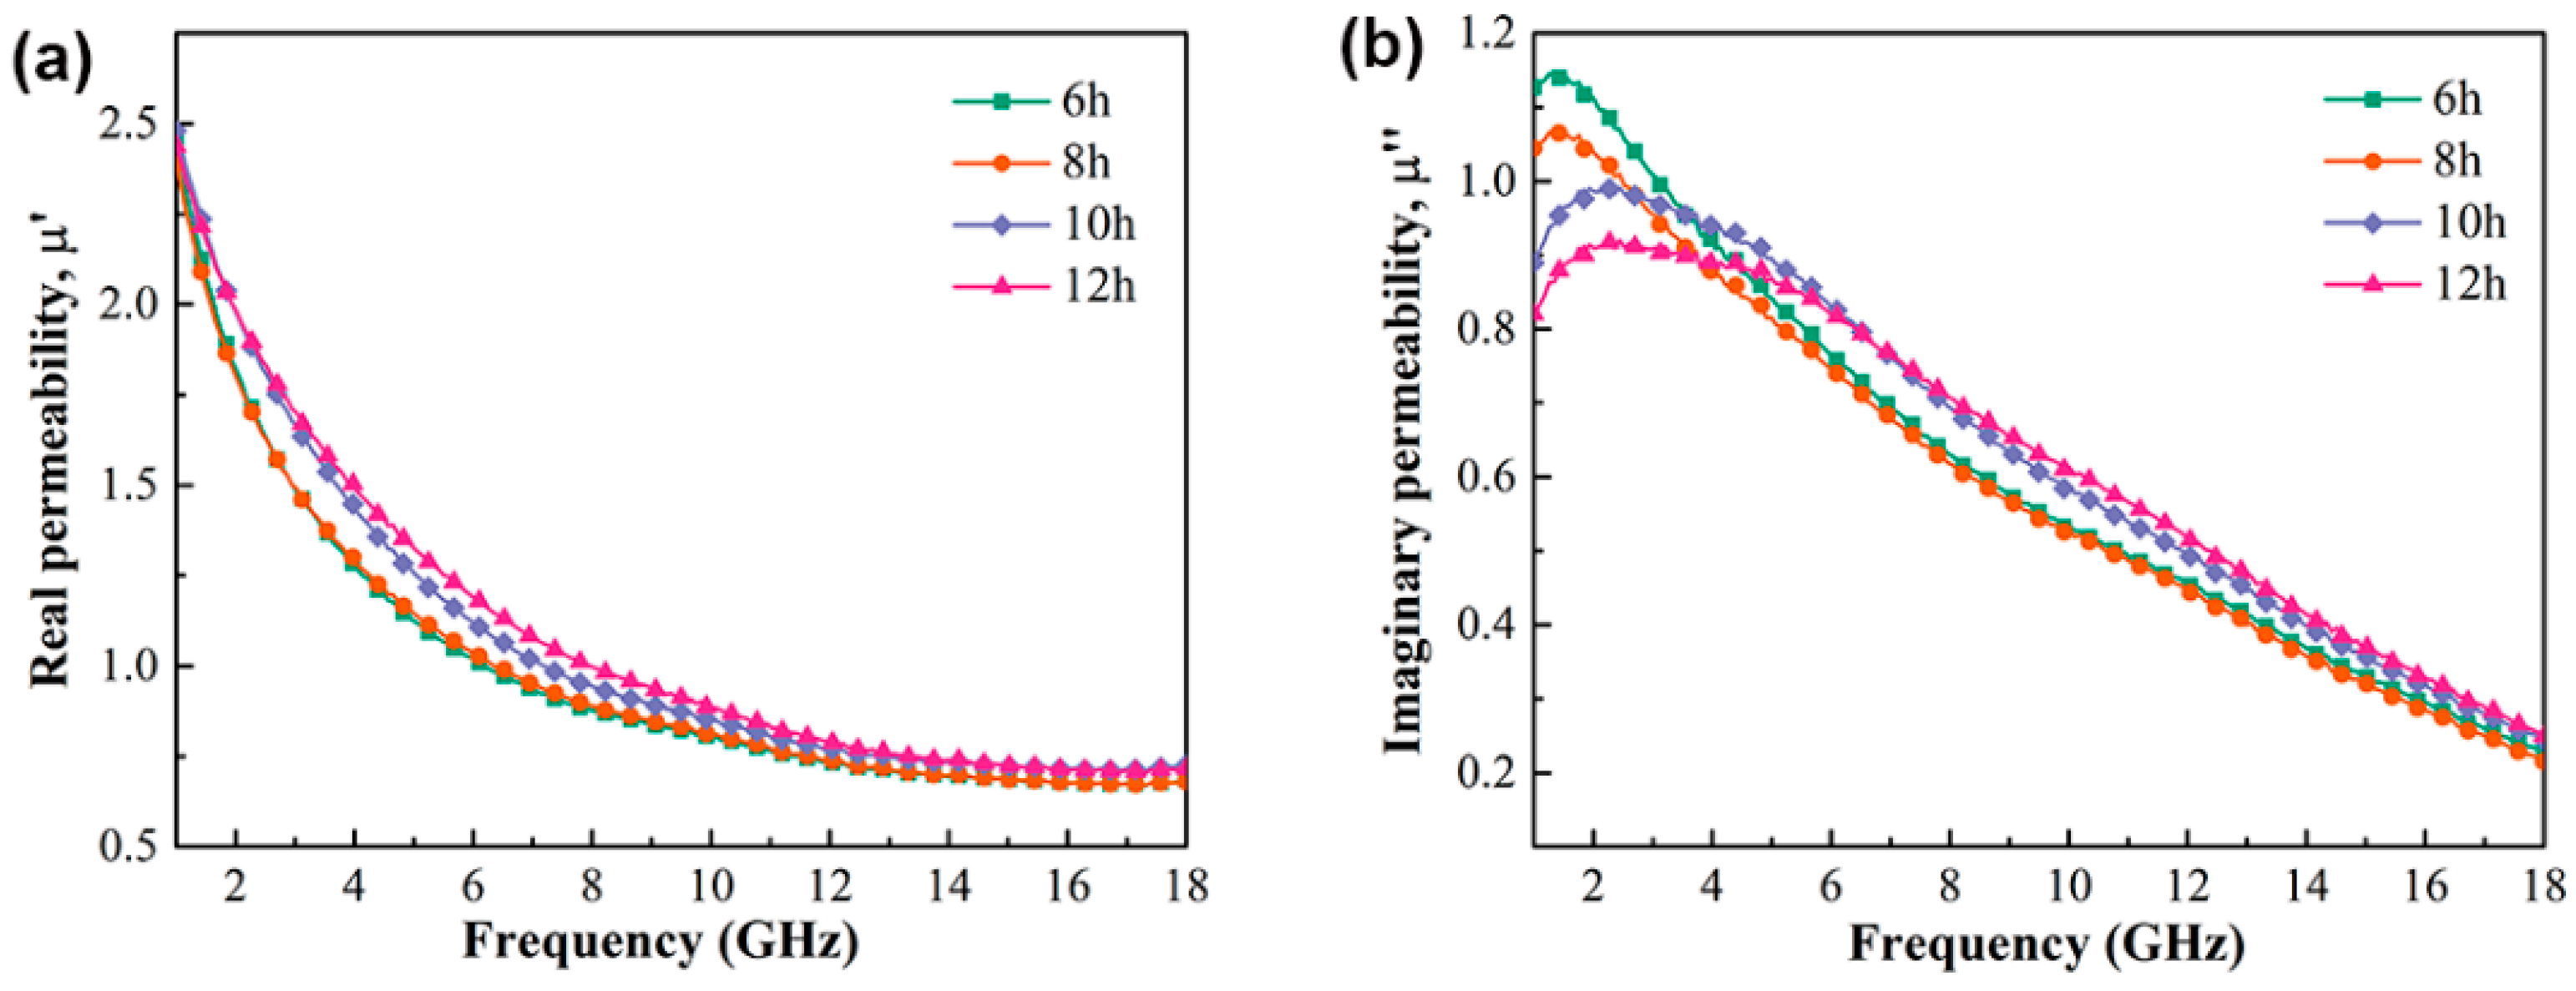
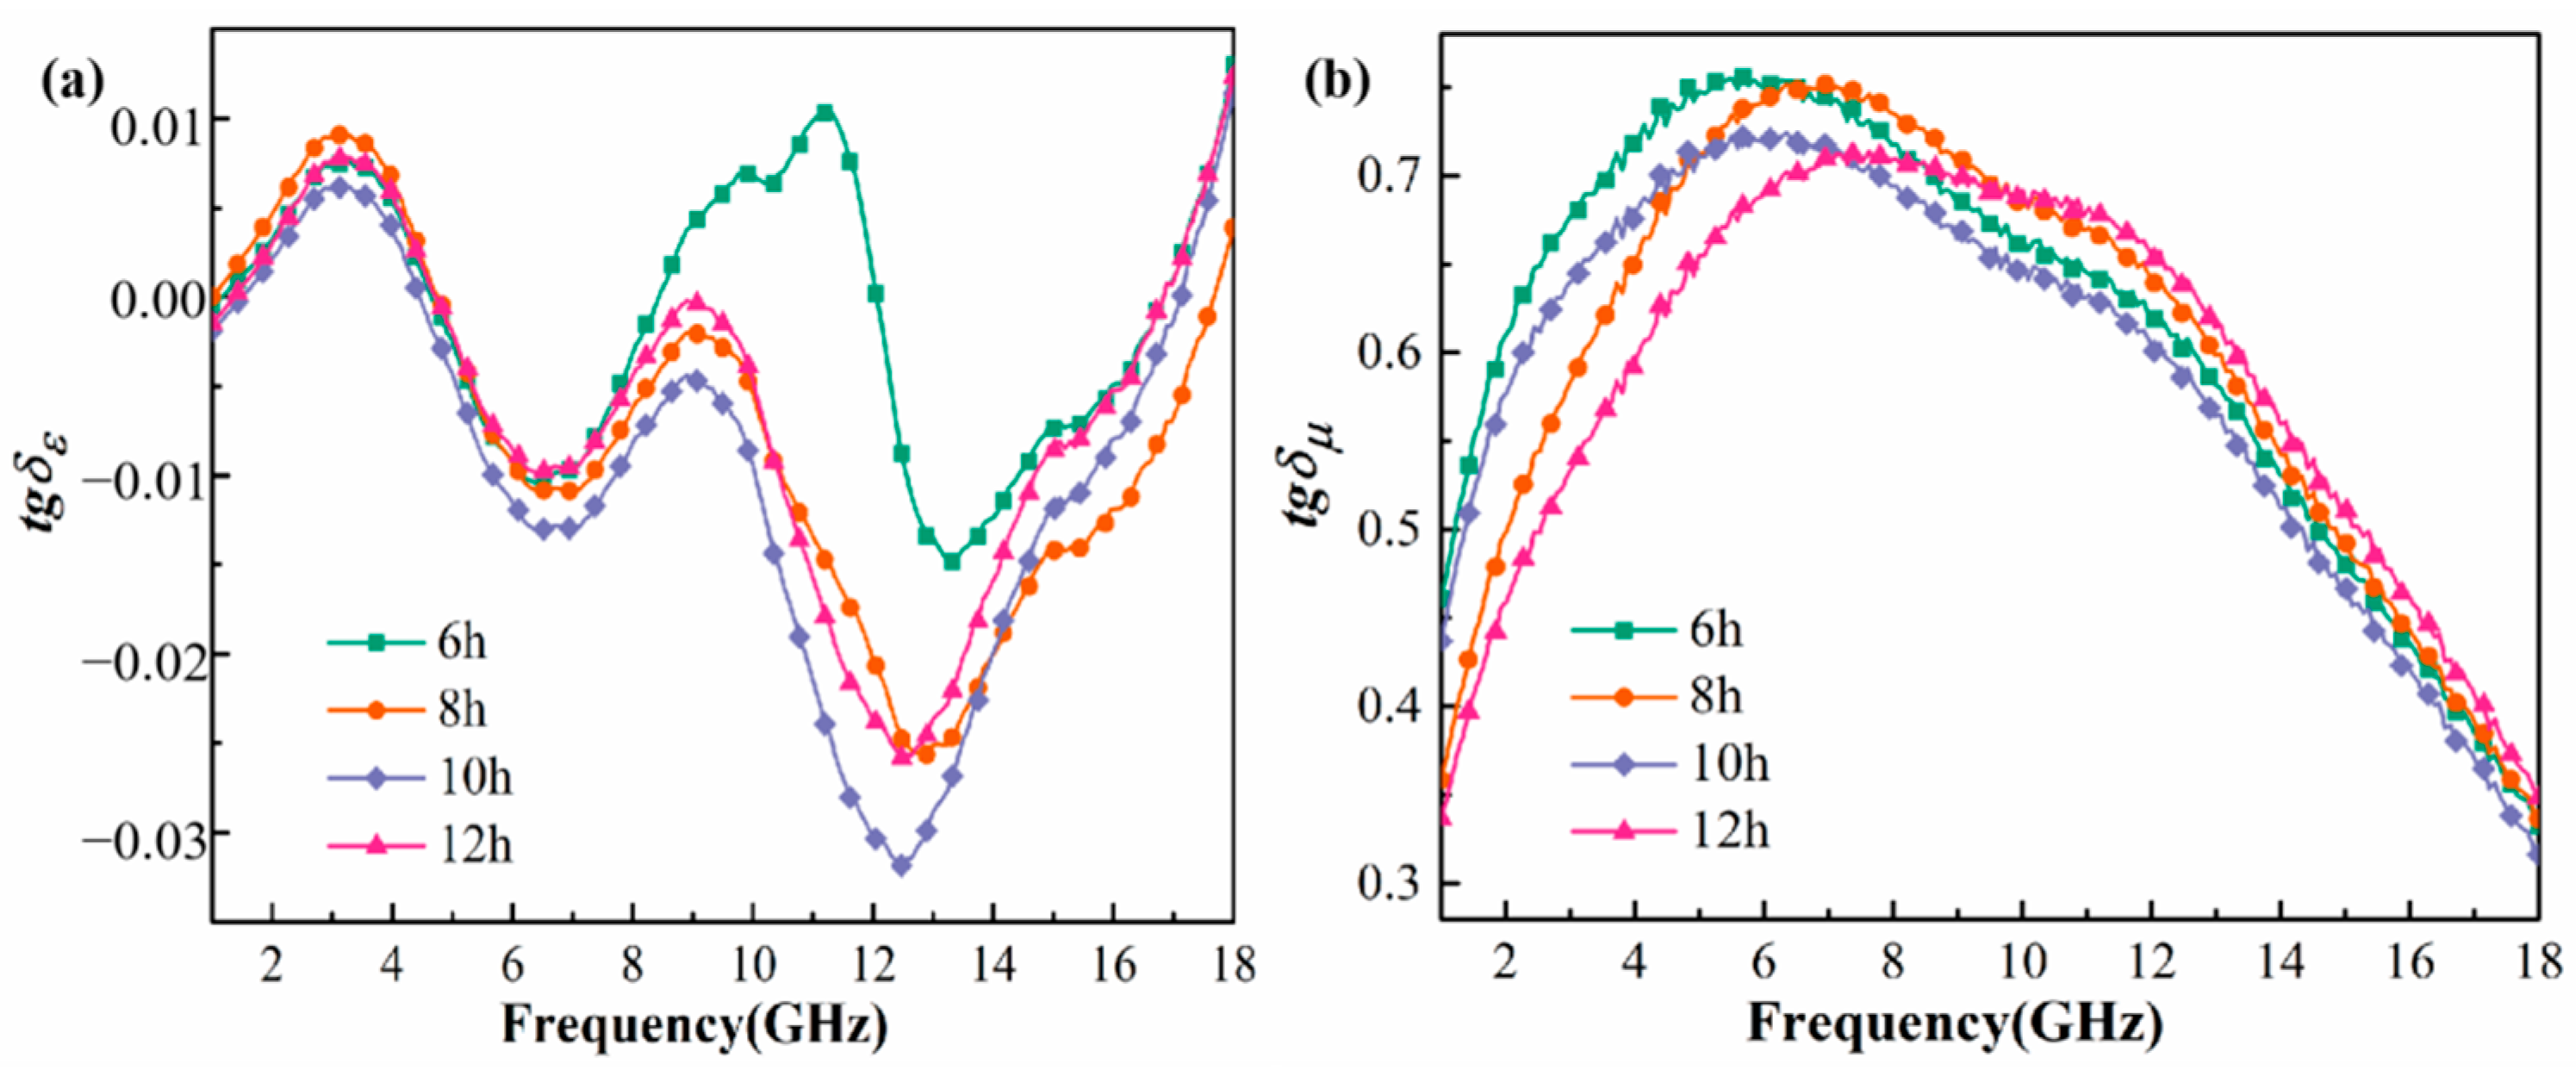
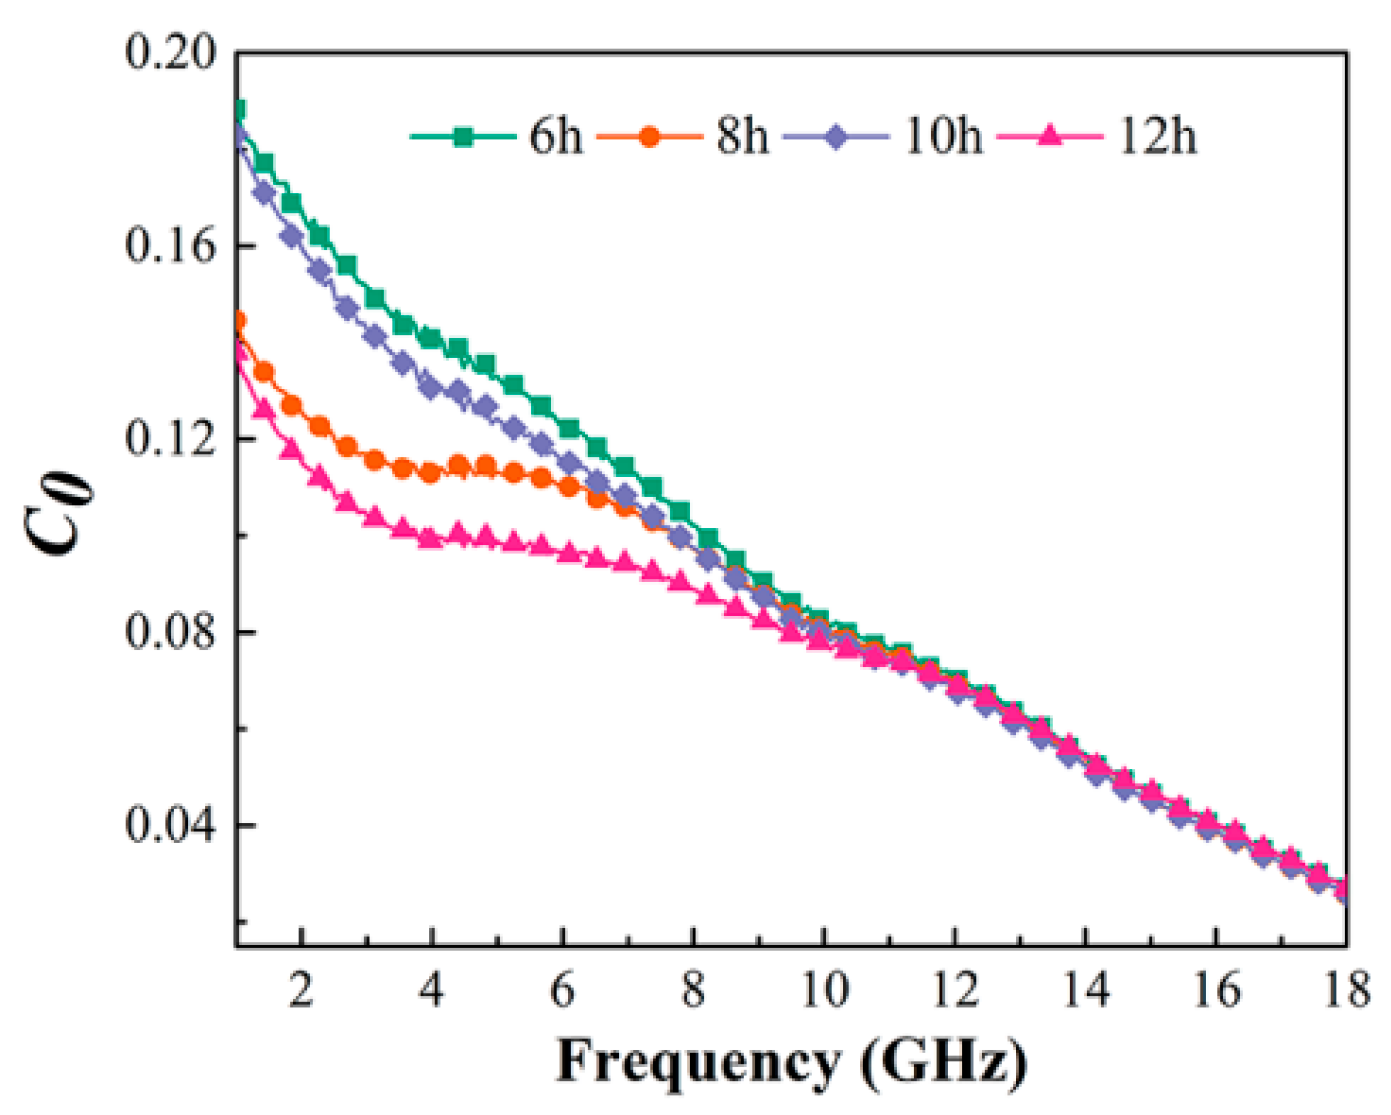
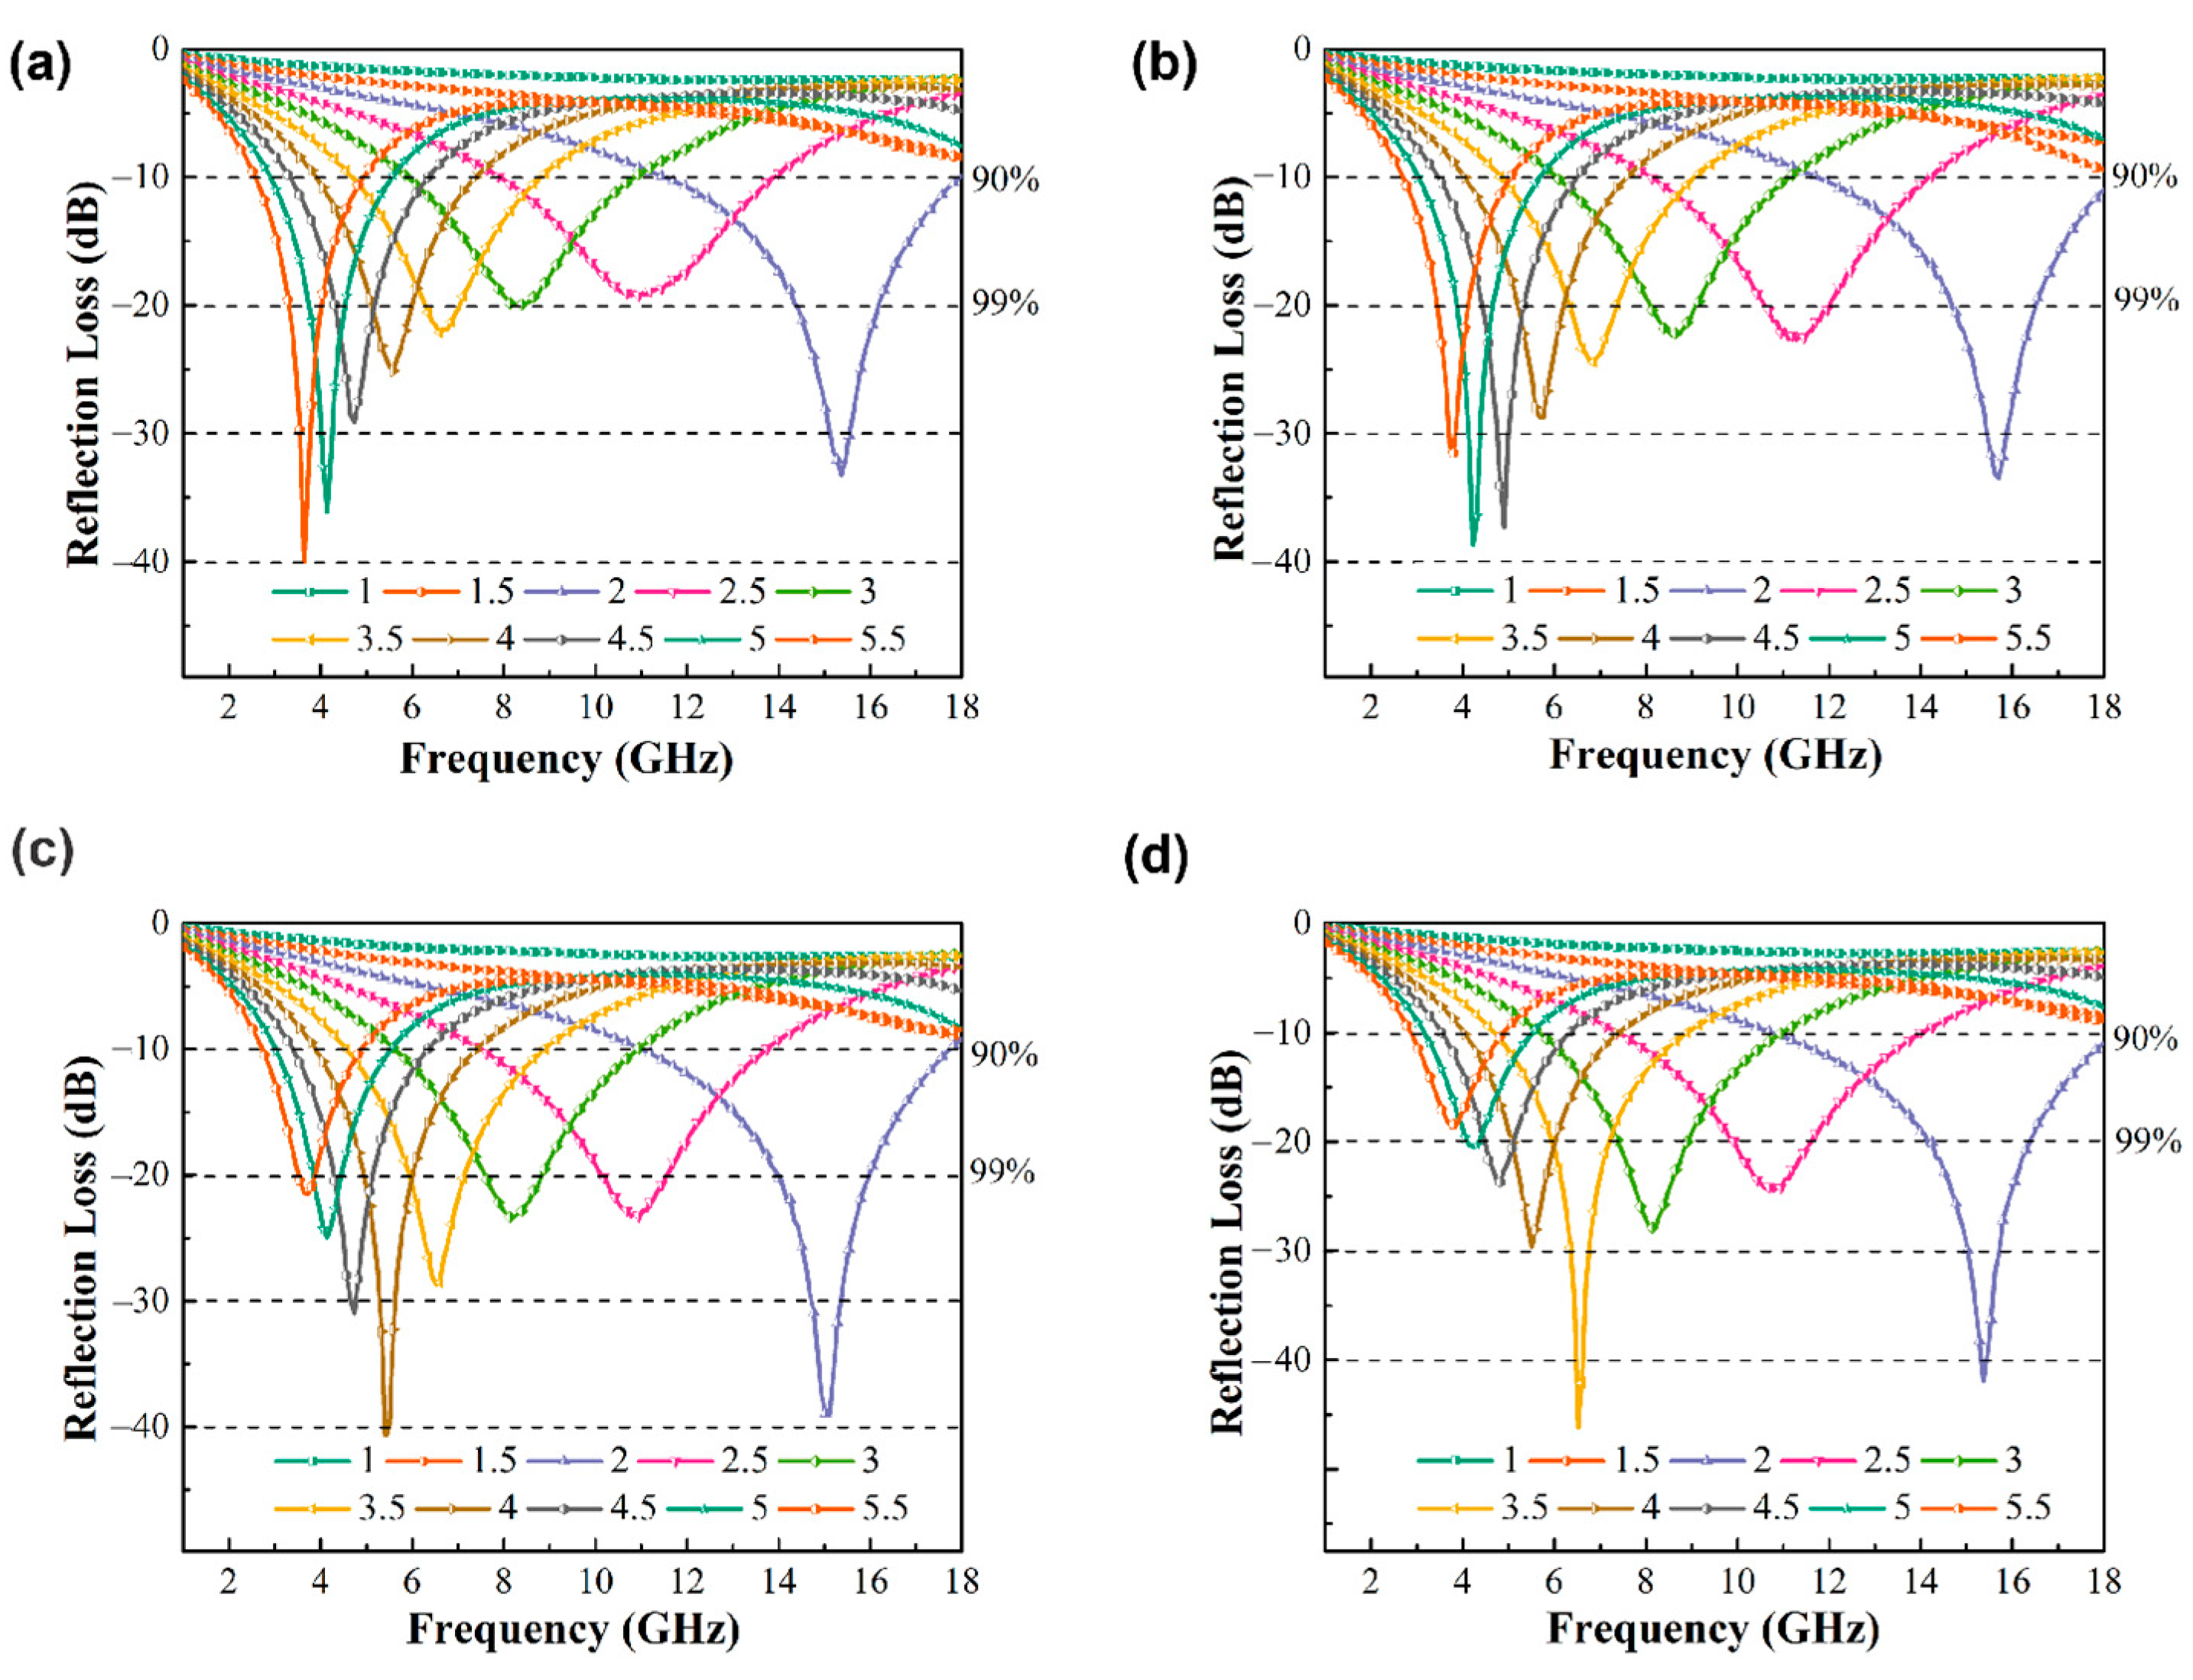
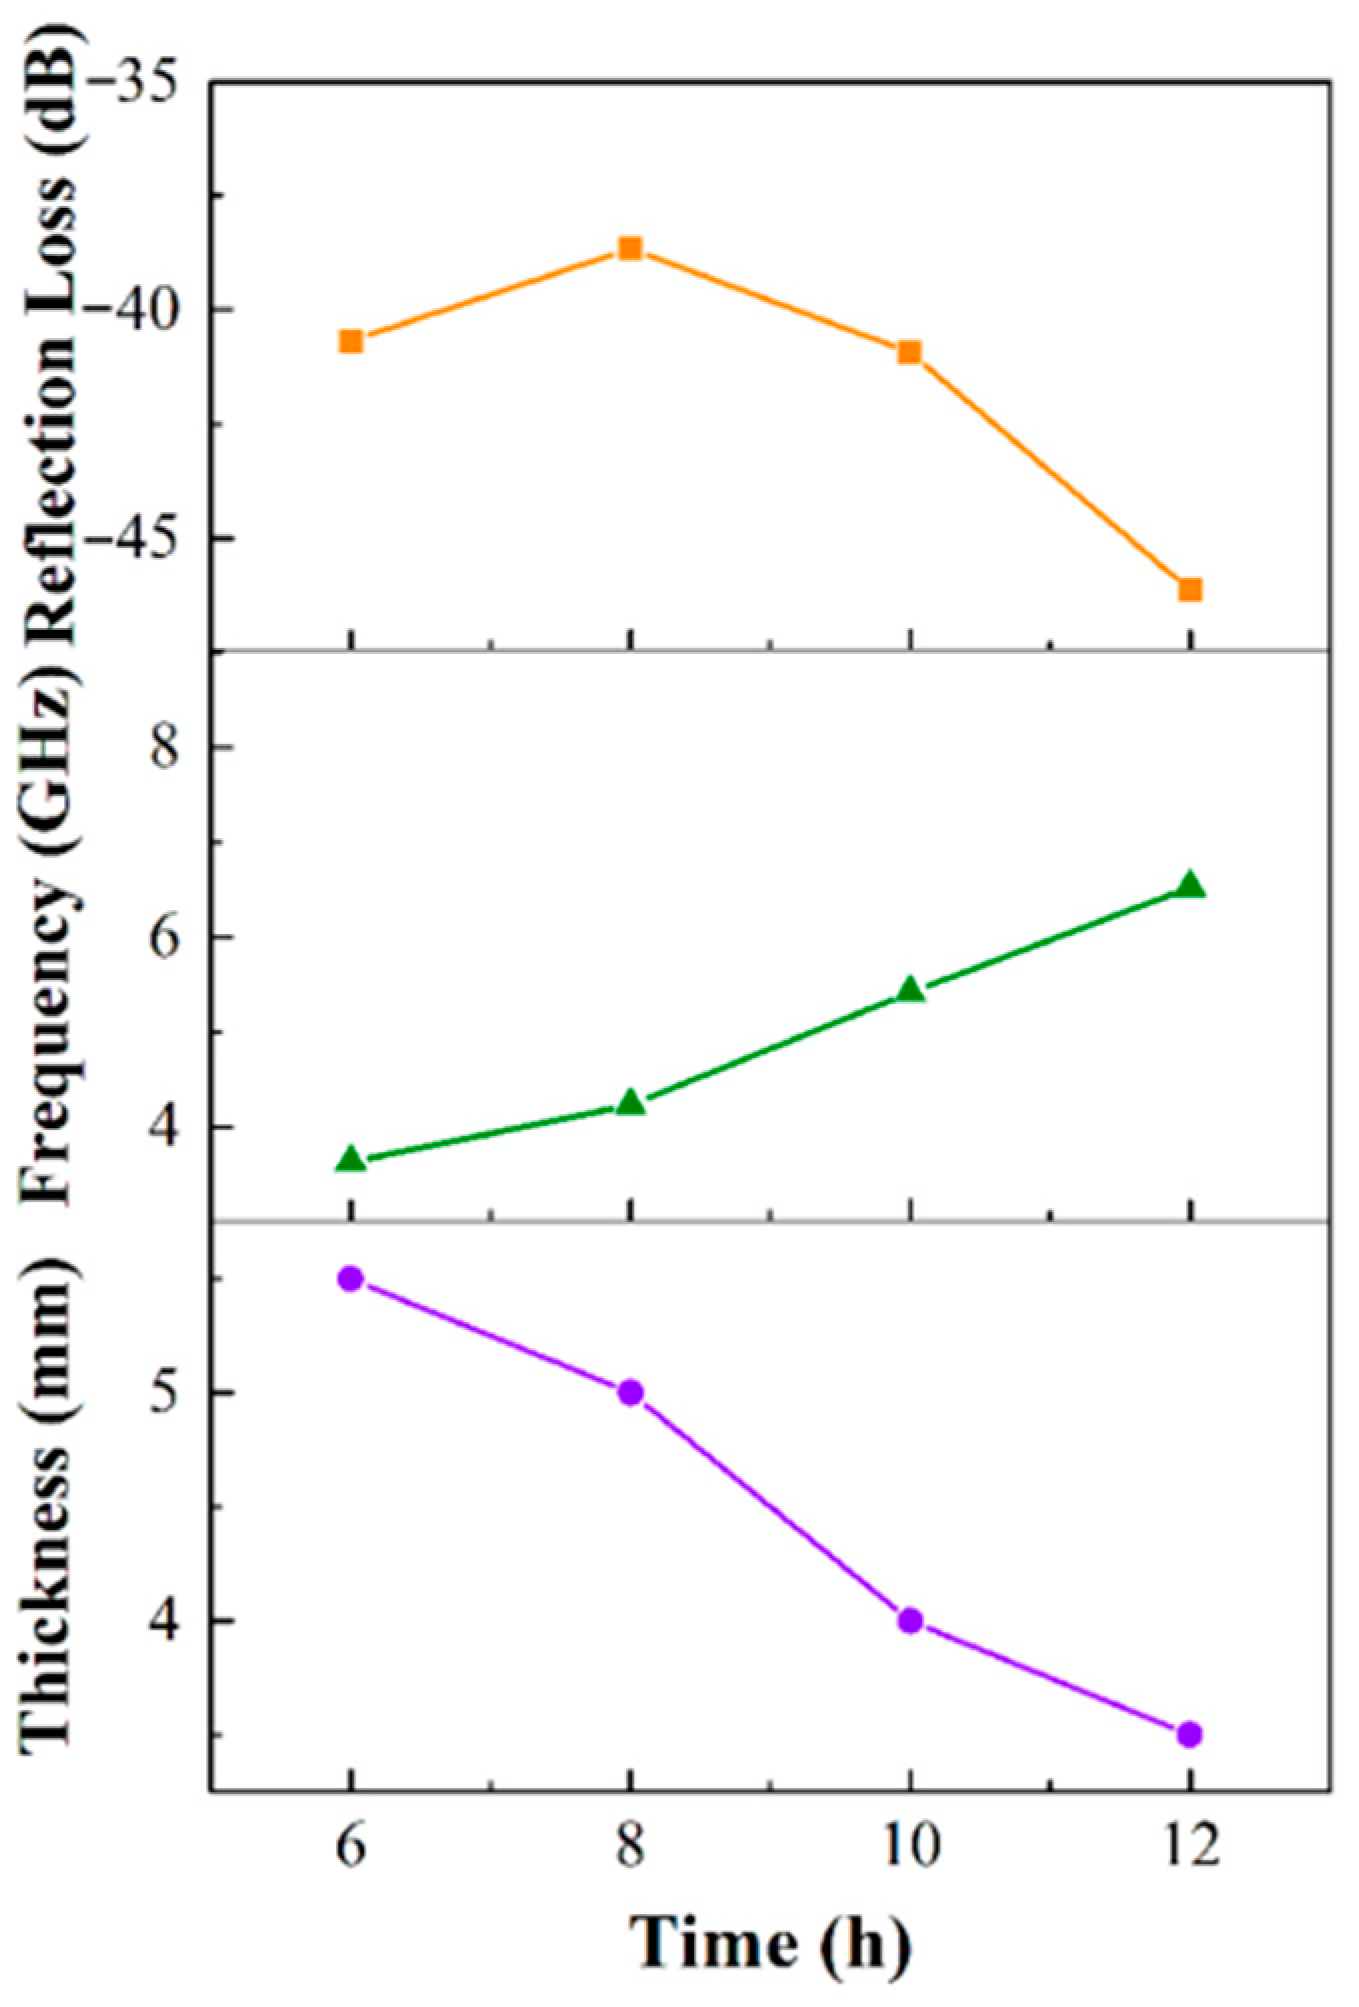
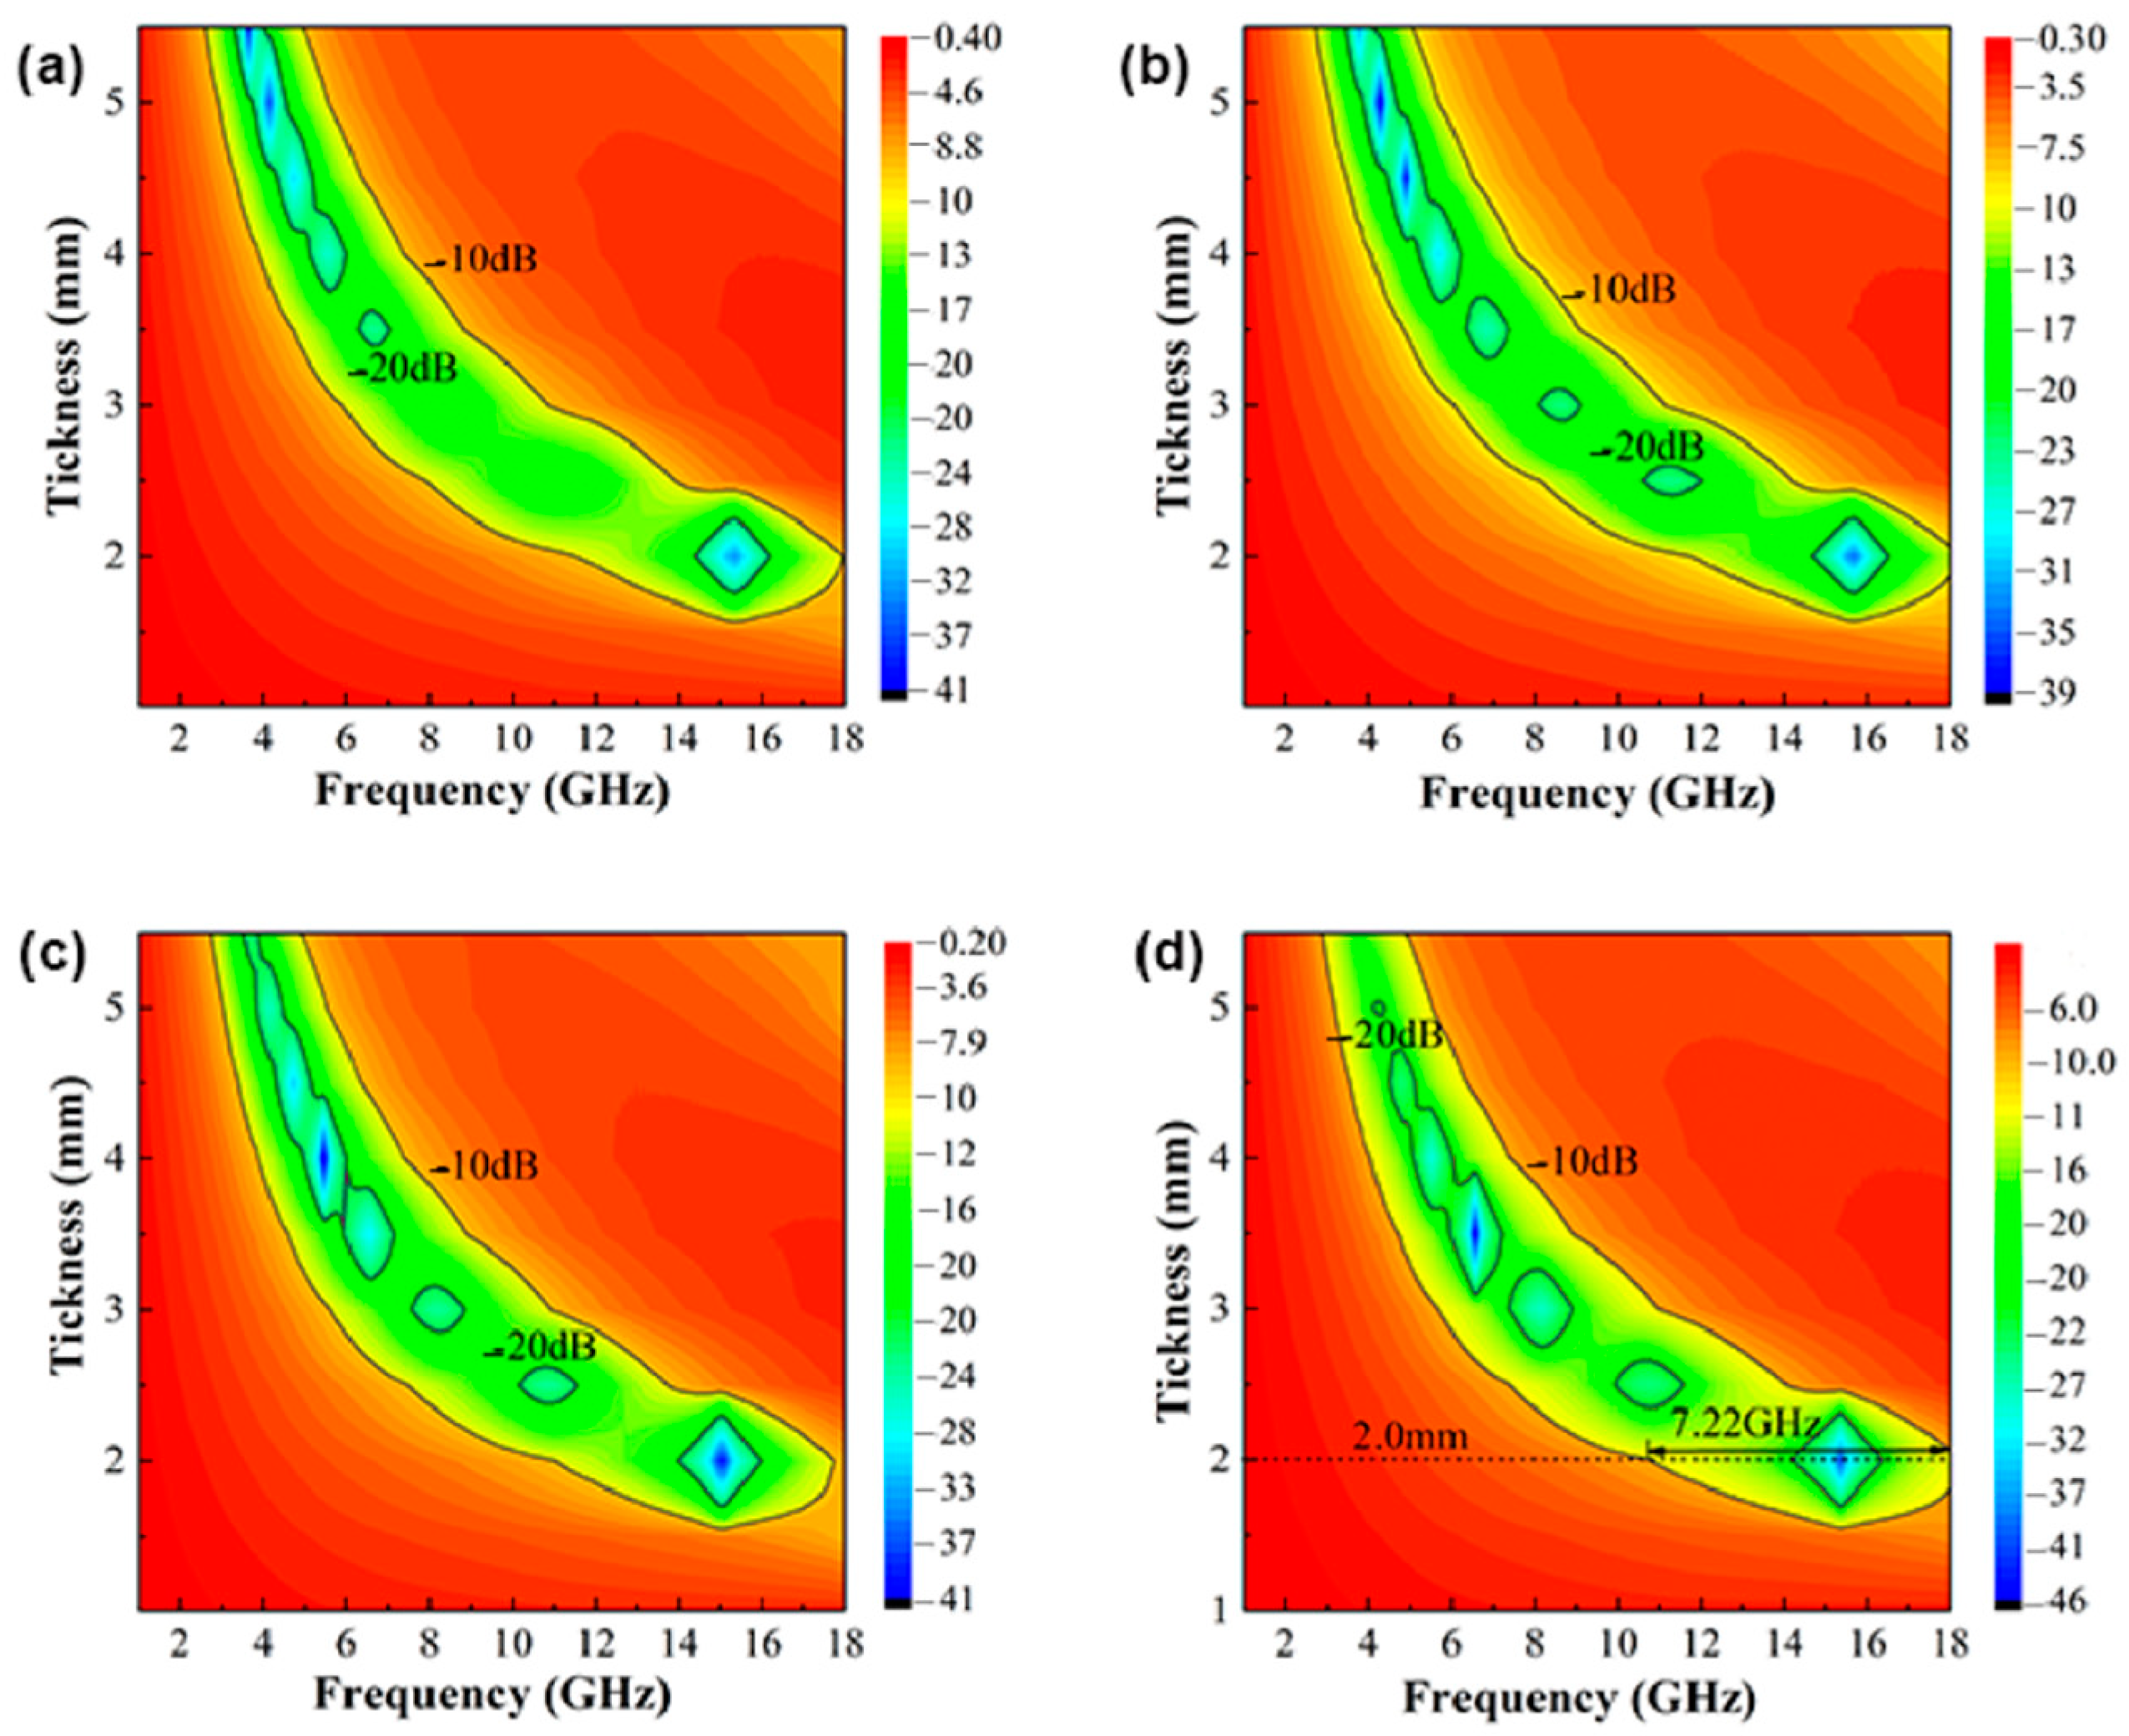
3. Results and Discussion

Figure 1a shows the VSM results of Fe73.2Si16.2B6.6Nb3Cu1 nanocrystalline alloy ribbon and powder after ball milling for 6, 8, 10, and 12 h. As can be seen from the figure, the initial MS of the nanocrystalline alloy ribbon without ball milling treatment was 132.03 emu/g. After 6 h of ball milling treatment, the initial MS increased to 135.25 emu/g, and then decreased gradually with the increase in ball milling time. After 12 h of ball milling, the initial MS decreased to 132.20 emu/g. The HC of the nanocrystalline alloy powder was between 0 and 16 Oe.
In order to study the mechanism of the change in soft magnetic properties, the microstructure of the alloy powder was characterized. Figure 2 shows the EDS map of Fe73.2Si16.2B6.6Nb3Cu1 nanocrystalline ribbon, as well as the XRD and TEM images of the nonannealed Fe73.2Si16.2B6.6Nb3Cu1 amorphous alloy and the annealed nanocrystalline alloy. For EDS, the detection range of the element is the element whose atomic number is after the oxygen element. The content of elements with an atomic number lower than that of oxygen cannot be determined. Therefore, the detection of the B element content here is not accurate. According to Figure 2a, the gap between the nominal composition and the actual composition of the comparative analysis material was within an acceptable range; hence, it can be considered that the actual composition of this material was Fe73.2Si16.2B6.6Nb3Cu1. According to Figure 2b,c, it can be determined that the material was amorphous when not annealed. The XRD image in Figure 2d shows that the diffraction peak of the α-(Fe, Si) phase can be seen in the XRD pattern of the ribbon, indicating that the α-(Fe, Si) phase precipitated on the amorphous matrix after annealing. Furthermore, the diffraction peak of the α-(Fe, Si) phase still existed in the XRD curve of the nanocrystalline alloy powder after 6–12 h ball milling, indicating that the nanocrystalline alloy powder was still a mixed structure of amorphous and nanocrystalline. As time increased, the intensity of the diffraction peak decreased gradually, indicating that the content of α-(Fe, Si) phase decreased. The grain size calculated by the Debye–Scherrer formula is shown in Table 1. As time increased, the diffraction peak gradually became wider, and the size of the nano-grains decreased gradually. Figure 2e shows the TEM images of the nanocrystalline alloy after 12 h ball milling. The crystal structure and amorphous structure can be observed in the high-resolution image. The crystal phase was determined to be the α-(Fe, Si) phase by calibration of the diffraction pattern, confirming that the alloy powder was a mixed structure of amorphous and nanocrystalline phase. The size of the crystal phase was about 10 nm, consistent with the XRD results. The changes in microstructure and structure of the nanocrystalline alloy resulted in a change in the soft magnetic properties of the alloy. According to Table 1, after 6 h of ball milling, large atoms Nb and Cu were gradually dissolved in the α-(Fe, Si) phase, and the crystal phase was gradually transformed into the amorphous phase, resulting in a larger lattice constant and a larger shift in the diffraction peak of the crystal phase to a lower angle. According to the Bethe–Slater curve, a larger atomic spacing causes an increase in Ms. Therefore, the MS of the powder increased after 6 h of ball milling and decreased gradually with the increase in ball-milling time from 6 h to 12 h. This is because the content of the α-(Fe, Si) soft magnetic phase in the alloy gradually decreased with the increase in ball milling time. Moreover, the amorphous phase had a lower MS; hence, the MS of the alloy decreased. As time increased, HC of nanocrystalline alloy powder showed an increasing trend, which was due to the increase in the internal stress of the alloy caused by the ball milling treatment.
Figure 3a–d show the SEM images of nanocrystalline alloy powders after 6 h, 8 h, 10 h, and 12 h ball milling, respectively. It can be observed from the figure that the nanocrystalline alloy powders were flat sheets. According to the Snoek limit principle [30], the absorbent with flake morphology can more easily obtain better absorbing performance. The particle size of the nanocrystalline powder was statistically analyzed, and the curve of particle size distribution with ball milling time is shown in Figure 4a. It can be seen that the particle size distribution of the nanocrystalline alloy powder ranged from 1 to 45 μm. As time increased, the particle size of the powder gradually decreased to a smaller size. Furthermore, the average particle size of the nanocrystalline alloy powder decreased with the increase in ball milling time, from 7.90 μm after 6 h to 6.87 μm after 12 h, as shown in Figure 4b.
The electromagnetic wave absorption performance is evaluated mainly through the alternating field of the material of the complex dielectric constant (εr = ε′ − ″) and complex permeability (μr = μ′ − ″). The real part (ε′ and μ′) and the imaginary part (ε″ and μ″) reflect the storage capacity and extinguish extent of the electromagnetic energy for certain materials, where a larger value indicates stronger storage or extinguish performance. The complex dielectric constant curve of Fe73.2Si16.2B6.6Nb3Cu1 nanocrystalline alloy powder is shown in Figure 5. The ε′ value of the nanocrystalline alloy was 7.00–7.88, while ε″ was −0.24–0.08. It can also be observed from the figure that ε′ and ε″ of the nanocrystalline alloy powder fluctuated as frequency increased. With the increase in milling time, ε′ and ε″ showed a downward trend, because both the content and the size of α-(Fe, Si) were gradually reduced; thus, the crystal phase changed to an amorphous phase, and the interface between crystalline and amorphous phases was reduced. Accordingly, the interfacial polarization was abated, and the polarization loss was reduced.
Figure 6 shows the complex permeability curve of Fe73.2Si16.2B6.6Nb3Cu1 nanocrystalline alloy powder. It can be observed from the figure that μ′ of the nanocrystalline alloy powder ranged from 0.67 to 2.45, while μ″ ranged from 0.21 to 1.15. The nanocrystalline alloy powders had a natural resonance peak near 1.5–2 GHz, and the resonance frequency was less than 10 GHz; therefore, this can be considered as a natural resonance peak. Nanocrystalline alloy powder also showed a strong frequency dependence. With the increase in frequency, the eddy current loss and skin effect increased, resulting in a low powder absorbing performance. With the increase in milling time, the powder particle size decreased, inhibiting the eddy current loss of powder particles. Therefore, with the increase in ball milling time, the powder particle size decreased, while μ″ increased at high frequency, indicating that ball-milling treatment could effectively improve the high-frequency wave absorption performance of the nanocrystalline alloy powder. Moreover, with the increase in milling time, the particle size of the alloy decreased gradually, and the magnetic exchange coupling between the nanocrystalline alloy powders increased, leading to higher μ′. However, the maximum value of μ″ decreased gradually because the complex permeability of the alloy is positively correlated to the square value of MS, as shown in Equation (1).
μ i μ 0 M s 2 ( K 1 + 3 2 λ s σ ) β 1 / 3 δ d ,
where μi is the initial permeability, μ0 is the free-space permeability, K1 is the magnetocrystalline anisotropy coefficient, λS is the magnetostriction coefficient, σ is the internal stress density, β is the volume fraction of impurities, δ is the domain wall thickness, and d is the particle size of impurities. Thus, μ″ obeys the same law as MS.
Figure 7 shows the variation curve of the dielectric loss tangent angle tgδε and magnetic loss tangent angle tgδμ with frequency of Fe73.2Si16.2B6.6Nb3Cu1 nanocrystalline alloy powder milling (6–12 h). It can be seen that the tgδε of nanocrystalline alloy powder ranged from −0.03 to 0.01, while tgδμ ranged from 0.32 to 0.76. tgδμ was much larger than tgδε, indicating a strong magnetic loss property; hence, this is a magnetic loss absorbing material. tgδμ first increased and then decreased with the increase in frequency. The peak value of tgδμ was between 5.5 GHz and 7.8 GHz. With the increase in ball milling time, tgδμ in the high-frequency band increased gradually. The peak of tgδμ gradually moved in the high-frequency direction, indicating that the high-frequency absorption performance was improved.
The magnetic loss of materials is mainly caused by hysteresis loss, domain wall resonance, natural resonance, and eddy current loss. The hysteresis loss in the weak electromagnetic field can be ignored, while the domain wall resonance only appears at low frequency (<2 GHz); thus, the magnetic loss in the range of gigabits mainly includes two forms: natural resonance and eddy current loss. Eddy current losses can be expressed as shown in Equation (2), where f, σ, and d represent the frequency, conductivity, and absorber thickness, respectively. If the magnetic loss of the material is only caused by eddy current loss, then the value of C0 should remain constant over all frequency bands. The C0 value of Fe73.2Si16.2B6.6Nb3Cu1 nanocrystalline alloy powder is shown in Figure 8. It can be seen that the C0 value of the nanocrystalline alloy powder decreased with the increase in frequency, indicating that the magnetic loss of the nanocrystalline alloy included eddy current loss and natural resonance. Among them, the formant of natural resonance appeared near 1.5–2 GHz.
C 0 = μ ( μ ) 2 f 1 = 2 π μ 0 σ d 2 / 3 .
The reflection loss RL of the alloy can be calculated according to the transmission line principle, as shown in Equations (3) and (4), where Z0 is the wave impedance in free space, Zin is the dielectric wave impedance, f is the frequency of the incident electromagnetic wave, c is the speed of light (3 × 10⁸ m/s), and d is the thickness of the absorbent (mm). Figure 9 shows the wave absorption curve of Fe73.2Si16.2B6.6Nb3Cu1 nanocrystalline alloy powder. It can be seen that the reflection loss of the fixed thickness of the nanocrystalline alloy powder decreased first and then increased with the increase in frequency. It featured an absorption peak, and the minimum reflection loss Rlmin could be obtained for the alloy powder at a specific thickness. Absorbers that are too thin or too thick will absorb electromagnetic waves differently due to the effect of impedance matching. The minimum reflection loss of nanocrystalline alloy powder after 6–12 h ball milling was about −40 dB. As shown in Figure 10, the minimum reflection loss Rlmin of Fe73.2Si16.2B6.6Nb3Cu1 nanocrystalline alloy powder and the corresponding frequency and thickness of Rlmin (i.e., the best matched frequency fRlmin and the best matched thickness dRlmin) changed with ball milling time. Rlmin increased first and then decreased with the increase in ball milling time, reaching the minimum value of −46.15 dB after 12 h of ball milling. The fRlmin of the alloy powder moved in the high-frequency direction with the increase in milling time, from 3.64 GHz for 6 h to 6.52 GHz for 12 h. Because the particle size of the alloy powder decreased, the skin effect was weakened, and the negative effect of eddy current loss on the high-frequency wave absorption performance was weakened. The dRlmin of the alloy powder decreased with the increase in milling time, which was conducive to the lightweight design of the absorber. The minimum matching thickness reached 3.5 mm after 12 h of ball milling.
R L ( dB ) = 20 log | Z i n Z 0 Z i n + Z 0 | .
Z i n = Z 0 μ ε t a n [ j ( 2 π f d c ) μ ε ] .
Figure 11a–d show the contour plot of reflection loss of Fe73.2Si16.2B6.6Nb3Cu1 nanocrystalline alloy powder after ball milling for 6–12 h as a function of thickness and frequency. The contour lines in the figure represent 90% effective absorption below −10 dB and 99% absorption below −20 dB, respectively. It can be seen that the nanocrystalline alloy powder of ball milling for 12 h had the best bandwidth performance, and the effective absorption bandwidth was higher below −10 dB when the thickness of the absorbent was 2 mm, while ΔfRL<−10 dB was up to 7.22 GHz (10.78–18 GHz), covering nearly half of the X-band and all of the Ku band.

4. Conclusions

(1) After ball milling, the nanocrystalline alloy remained an amorphous–nanocrystalline mixed structure. With the increase in ball milling time, α-(Fe, Si) gradually transformed into the amorphous phase, and the maximum Ms reached 135.25 emu/g.
(2) The nanocrystalline alloy powder after ball milling was flakelike. The minimum average particle size of the powder reached 6.87 μm. The decrease in particle size weakened the skin effect caused by eddy current loss and enhanced the absorption performance of high-frequency electromagnetic waves.
(3) Nanocrystalline alloy powders had excellent electromagnetic absorption properties. The real part μ′ of the complex permeability ranged from 0.60 to 1.97, and the imaginary part μ″ and tgδμ reached the maxima of 1.15 and 0.76, respectively. The alloy powder obtained from ball milling for 12 h had the best electromagnetic absorption performance, and the minimum reflection loss RLmin at the frequency of 6.52 GHz reached −46.15 dB (matched thickness = 3.5 mm).
(4) With the increase in ball milling time, the best matched frequency moved to a higher frequency, and the best matched thickness decreased. When the thickness of the absorbent was 2 mm, the maximum effective absorption bandwidth Δ fRL<−10 dB was 7.22 GHz (10.78–18 GHz).

Author Contributions

Conceptualization, B.Z., M.L. and J.W.; methodology, B.Z., X.Z., B.Y., L.M. and L.J.; software, B.Z., M.L. and J.W.; validation, B.Z. and M.L.; formal analysis, B.Z., X.Z. and M.L.; investigation, X.Z., B.Y., L.M. and L.J.; resources, B.Z. and X.Z.; writing—original draft preparation, J.W.; writing—review and editing, B.Z. and M.L.; supervision, X.Z., B.Z., B.Y. and L.M.; project administration, X.Z. and B.Z.; funding acquisition, B.Z. All authors have read and agreed to the published version of the manuscript.

Funding

This research was funded by the National Natural Science Foundation of China Project, grant number 51971049, and the Fundamental Research Funds for the Central Universities, grant number DUT 19GF110.

Data Availability Statement

The raw/processed data required to reproduce these findings cannot be shared at this time as the data also form part of an ongoing study.

Acknowledgments

The authors gratefully acknowledge the support from the National Natural Science Foundation of China Project (51971049) and the Fundamental Research Funds for the Central Universities (DUT 19GF110).

Conflicts of Interest

The authors declare no conflict of interest.

References

  1. Cao, M.; Wang, X.; Cao, W.; Fang, X.; Wen, B.; Yuan, J. Thermally driven transport and relaxation switching self-powered electromagnetic energy conversion. Small 2018, 14, 1800987. [Google Scholar] [CrossRef] [PubMed] [Green Version]
  2. Wang, X.X.; Cao, W.Q.; Cao, M.S.; Yuan, J. Assembling nano-microarchitecture for electromagnetic absorbers and smart devices. Adv. Mater. 2020, 2020, 2002112. [Google Scholar] [CrossRef] [PubMed]
  3. Cao, M.S.; Wang, X.X.; Zhang, M.; Shu, J.C.; Cao, W.Q.; Yang, H.J.; Fang, X.Y.; Yuan, J. Electromagnetic response and energy conversion for functions and devices in low-dimensional materials. Adv. Funct. Mater. 2019, 29, 1807398. [Google Scholar] [CrossRef]
  4. Zhang, Y.L.; Wang, X.X.; Cao, M.S. Confinedly implanted NiFe2O4-rGO: Cluster tailoring and highly tunable electromagnetic properties for selective-frequency microwave absorption. Nano Res. 2018, 11, 1426–1436. [Google Scholar] [CrossRef] [Green Version]
  5. Song, W.L.; Cao, M.S.; Hou, Z.L.; Fang, X.Y.; Shi, X.L.; Yuan, J. High dielectric loss and its monotonic dependence of conducting-dominated multiwalled carbon nanotubes/silica nanocomposite on temperature ranging from 373 to 873 K in X-band. Appl. Phys. Lett. 2009, 94, 233110. [Google Scholar] [CrossRef]
  6. Cheng, C.; Fan, R.; Wang, Z.; Shao, Q.; Guo, X.; Xie, P.; Yin, Y.; Zhang, Y.; An, L.; Lei, Y. Tunable and weakly negative permittivity in carbon/silicon nitride composites with different carbonizing temperatures. Carbon 2017, 2017, S0008622317309120. [Google Scholar] [CrossRef]
  7. Cao, M.S.; Song, W.L.; Hou, Z.L.; Wen, B.; Yuan, J. The effects of temperature and frequency on the dielectric properties, electromagnetic interference shielding and microwave-absorption of short carbon fiber/silica composites. Carbon 2010, 48, 788–796. [Google Scholar] [CrossRef]
  8. Gu, H.; Zhang, H.; Lin, J.; Shao, Q.; Young, D.P.; Sun, L.; Shen, T.D.; Guo, Z. Large negative giant magnetoresistance at room temperature and electrical transport in cobalt ferrite-polyaniline nanocomposites. Polymer 2018, 143, 324–330. [Google Scholar] [CrossRef]
  9. Singh, J.; Singh, C.; Kaur, D.; Narang, S.B.; Joshi, R.; Mishra, S.R.; Jotania, R.; Ghimire, M.; Chauhan, C.C. Tunable microwave absorption in Co-Al substituted M-type Ba-Sr hexagonal ferrite. Mater. Des. 2016, 110, 749–761. [Google Scholar] [CrossRef]
  10. Qin, X.; Cheng, Y.; Zhou, K.; Huang, S.; Hui, X. Microwave absorbing properties of W-type hexaferrite Ba(MnZn)xCo2(1−x)Fe16O27. J. Mater. Sci. Chem. Eng. 2013, 1, 8–13. [Google Scholar]
  11. Liu, J.L.; Zhang, P.; Zhang, X.K.; Xie, Q.Q.; Pan, D.J.; Zhang, J.; Zhang, M. Synthesis and microwave absorbing properties of La-doped Sr-hexaferrite nanopowders via sol-gel auto-combustion method. Rare Met. 2017, 36, 704–710. [Google Scholar] [CrossRef]
  12. Guo, C.; Yang, Z.; Shen, S.; Liang, J.; Xu, G. High microwave attenuation performance of planar carbonyl iron particles with orientation of shape anisotropy field. J. Magn. Magn. Mater. 2018, 454, 32–38. [Google Scholar] [CrossRef]
  13. Wang, F.; Long, C.; Wu, T.; Li, W.; Chen, Z.; Xia, F.; Wu, J.; Guan, J. Enhancement of low-frequency magnetic permeability and absorption by texturing flaky carbonyl iron particles. J. Alloys Compd. 2020, 823, 153827. [Google Scholar] [CrossRef]
  14. Zhou, Y.; Xie, H.; Zhou, W.; Ren, Z. Enhanced antioxidation and microwave absorbing properties of SiO2-coated flaky carbonyl iron particles. J. Magn. Magn. Mater. 2018, 446, 143–149. [Google Scholar] [CrossRef]
  15. Guo, X.; Yao, Z.; Lin, H.; Zhou, J.; Zuo, Y.; Xu, X.; Wei, B.; Chen, W.; Qian, K. Epoxy resin addition on the microstructure, thermal stability and microwave absorption properties of core-shell carbonyl iron@epoxy composites. J. Magn. Magn. Mater. 2019, 485, 244–250. [Google Scholar] [CrossRef]
  16. Duan, Y.; Liu, Y.; Cui, Y.; Ma, G.; Tongmin, W. Graphene to tune microwave absorption frequencies and enhance absorption properties of carbonyl iron/polyurethane coating. Prog. Org. Coat. 2018, 125, 89–98. [Google Scholar] [CrossRef]
  17. Yang, P.; Liu, Y.; Zhao, X.; Cheng, J.; Li, H. Electromagnetic wave absorption properties of FeCoNiCrAl0.8 high entropy alloy powders and its amorphous structure prepared by high-energy ball milling. J. Mater. Res. 2016, 31, 2398–2406. [Google Scholar] [CrossRef]
  18. Yuping, D.; Yahong, Z.; Tongmin, W.; Shuchao, G.; Xingjun, L. Evolution study of microstructure and electromagnetic behaviors of Fe-Co-Ni alloy with mechanical alloying. Mater. Sci. Eng. B 2014, 185, 86–93. [Google Scholar] [CrossRef]
  19. Chen, Y.; Wang, L.; Xiong, H.; Ur Rehman, S.; Tan, Q.; Huang, Q.; Zhong, Z. Optimized Absorption Performance of FeSiCr Nanoparticles by Changing the Shape Anisotropy. Phys. Status Solidi 2020, 217, 2000389. [Google Scholar] [CrossRef]
  20. Duan, Y.; Gu, S.; Zhang, Z.; Wen, M. Characterization of structures and novel magnetic response of Fe87.5Si7Al5.5 alloy processed by ball milling. J. Alloys Compd. 2012, 542, 90–96. [Google Scholar] [CrossRef]
  21. Zhou, T.D.; Tang, J.K.; Wang, Z.Y. Influence of Cr content on structure and magnetic properties of Fe-Si-Al-Cr powders. J. Magn. Magn. Mater. 2010, 322, 2589–2592. [Google Scholar] [CrossRef]
  22. Duan, Y.; Song, L.; Cui, Y.; Pang, H.; Zhang, X.; Wang, T. FeCoNiCuAl high entropy alloys microwave absorbing materials: Exploring the effects of different Cu contents and annealing temperatures on electromagnetic properties. J. Alloys Compd. 2020, 848, 156491. [Google Scholar] [CrossRef]
  23. Duan, Y.; Wen, X.; Zhang, B.; Ma, G.; Wang, T. Optimizing the electromagnetic properties of the FeCoNiAlCrx high entropy alloy powders by composition adjustment and annealing treatment. J. Magn. Magn. Mater. 2020, 497, 65947. [Google Scholar] [CrossRef]
  24. Lan, D.; Zhao, Z.; Gao, Z.; Kou, K.; Wu, G.; Wu, H. Porous high entropy alloys for electromagnetic wave absorption. J. Magn. Magn. Mater. 2020, 512, 167065. [Google Scholar] [CrossRef]
  25. Yingzhe, Z.; Yudao, C.; Qingdong, Q.; Wei, L. Synthesis of FeCoNiCuZn single-phase high-entropy alloy by high-frequency electromagnetic-field assisted ball milling. J. Magn. Magn. Mater. 2020, 498, 166151. [Google Scholar] [CrossRef]
  26. Herzer, G. Modern soft magnets: Amorphous and nanocrystalline materials. Acta Mater. 2013, 61, 718–734. [Google Scholar] [CrossRef]
  27. Makino, A. Nanocrystalline soft magnetic Fe-Si-B-P-Cu alloys with high BS of 1.8–1.9T contributable to energy saving. IEEE Trans. Magn. 2012, 48, 1331–1335. [Google Scholar] [CrossRef]
  28. Luborsky, F.; Becker, J.; Walter, J.I.; Liebermann, H. Formation and Magnetic Properties of Fe-B-Si Amorphous Alloys. IEEE Trans. Magn. 1979, 15, 1146–1149. [Google Scholar] [CrossRef]
  29. Yoshizawa, Y.; Oguma, S.; Yamauchi, K. New Fe-based soft magnetic alloys composed of ultrafine grain structure. J. Appl. Phys. 1988, 64, 6044–6046. [Google Scholar] [CrossRef]
  30. Snoek, J. Dispersion and absorption in magnetic ferrites at frequencies above one Mc/s. Physica 1948, 14, 2. [Google Scholar] [CrossRef]
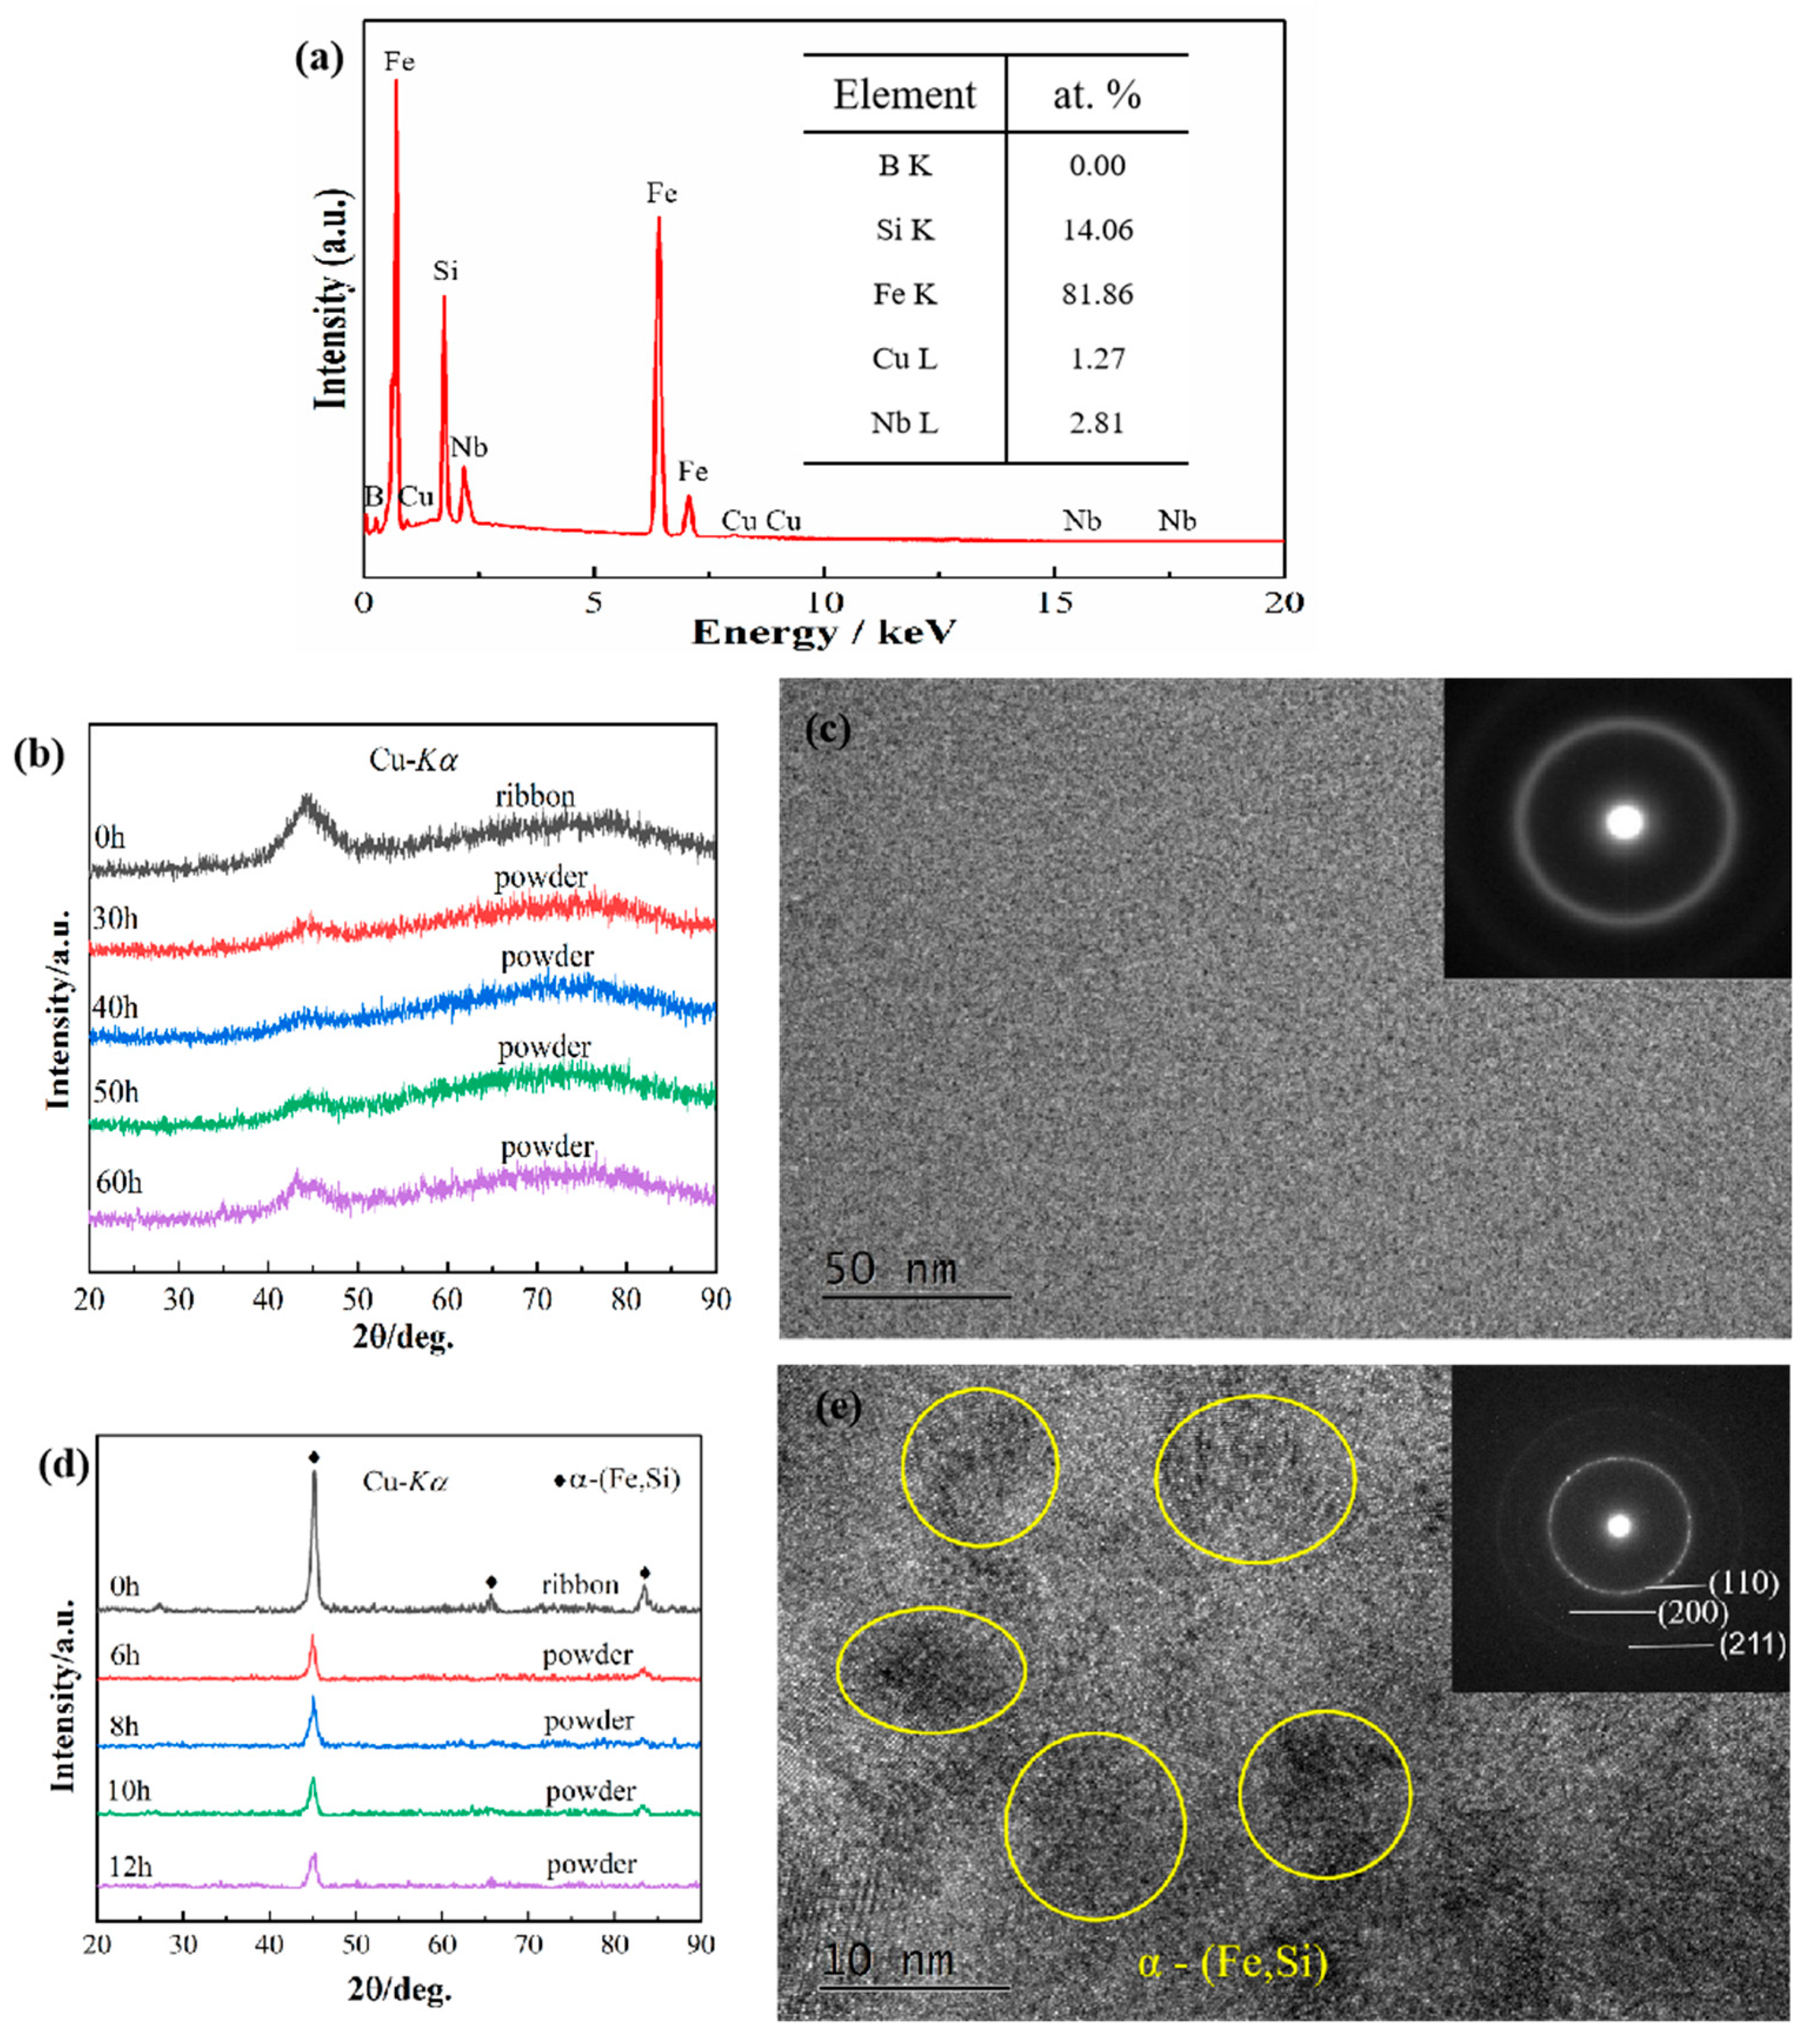
Figure 1. VSM patterns of Fe73.2Si16.2B6.6Nb3Cu1 nanocrystalline alloy: (a) hysteresis loops; (b) changes in MS and HC as a function of milling time.
Materials 15 02558 g001
Figure 2. EDS map of Fe73.2Si16.2B6.6Nb3Cu1 nanocrystalline ribbon, along with XRD patterns and TEM images of Fe73.2Si16.2B6.6Nb3Cu1 amorphous alloy and nanocrystalline alloy: (a) EDS map of the nanocrystalline ribbon; (b) XRD patterns of amorphous alloy; (c) HRTEM and SAED images of amorphous alloy; (d) XRD patterns of nanocrystalline alloy; (e) HRTEM and SAED images of nanocrystalline alloy powder after ball milling for 12 h.
Materials 15 02558 g002
Figure 3. SEM images of Fe73.2Si16.2B6.6Nb3Cu1 nanocrystalline alloy powder after milling for (a) 6 h, (b) 8 h, (c) 10 h, and (d) 12 h.
Materials 15 02558 g003
Figure 4. Particle size of Fe73.2Si16.2B6.6Nb3Cu1 nanocrystalline alloy powder: (a) particle size distribution; (b) change in average particle size as a function of milling time.
Materials 15 02558 g004
Figure 5. Frequency dependences of ε′ (a) and ε″ (b) of Fe73.2Si16.2B6.6Nb3Cu1 nanocrystalline alloy powder.
Materials 15 02558 g005
Figure 6. Frequency dependences of μ′ (a) and μ″ (b) of Fe73.2Si16.2B6.6Nb3Cu1 nanocrystalline alloy powder.
Materials 15 02558 g006
Figure 7. Frequency dependences of tgδε (a) and tgδμ (b) of Fe73.2Si16.2B6.6Nb3Cu1 nanocrystalline alloy powder.
Materials 15 02558 g007
Figure 8. Frequency dependence of C0 of Fe73.2Si16.2B6.6Nb3Cu1 nanocrystalline powder.
Materials 15 02558 g008
Figure 9. Reflection loss of Fe73.2Si16.2B6.6Nb3Cu1 nanocrystalline alloy powder after milling for (a) 6 h, (b) 8 h, (c) 10 h, and (d)12 h in the frequency range of 2–18 GHz.
Materials 15 02558 g009
Figure 10. Curves of the minimum reflection loss Rlmin, the best matching frequency fRlmin, and the best matching thickness dRlmin of Fe73.2Si16.2B6.6Nb3Cu1 nanocrystalline alloy powder as a function of ball milling time.
Materials 15 02558 g010
Figure 11. Contour diagram of reflection loss of Fe73.2Si16.2B6.6Nb3Cu1 nanocrystalline alloy powder as a function of thickness and frequency after milling for (a) 6 h, (b) 8 h, (c) 10 h, and (d) 12 h.
Materials 15 02558 g011
Table 1. Grain size of nanocrystalline alloy with different milling time.
Milling Time (h)Peak Center (°)Width of Half Height (°)Grain Size (nm)
045.120.5814.72
645.000.6213.76
845.120.6313.46
1045.080.6413.37
1245.310.6712.74
Publisher’s Note: MDPI stays neutral with regard to jurisdictional claims in published maps and institutional affiliations.

