
Hydrophobic Recovery of PDMS Surfaces in Contact with Hydrophilic Entities: Relevance to Biomedical Devices

 , and
, and 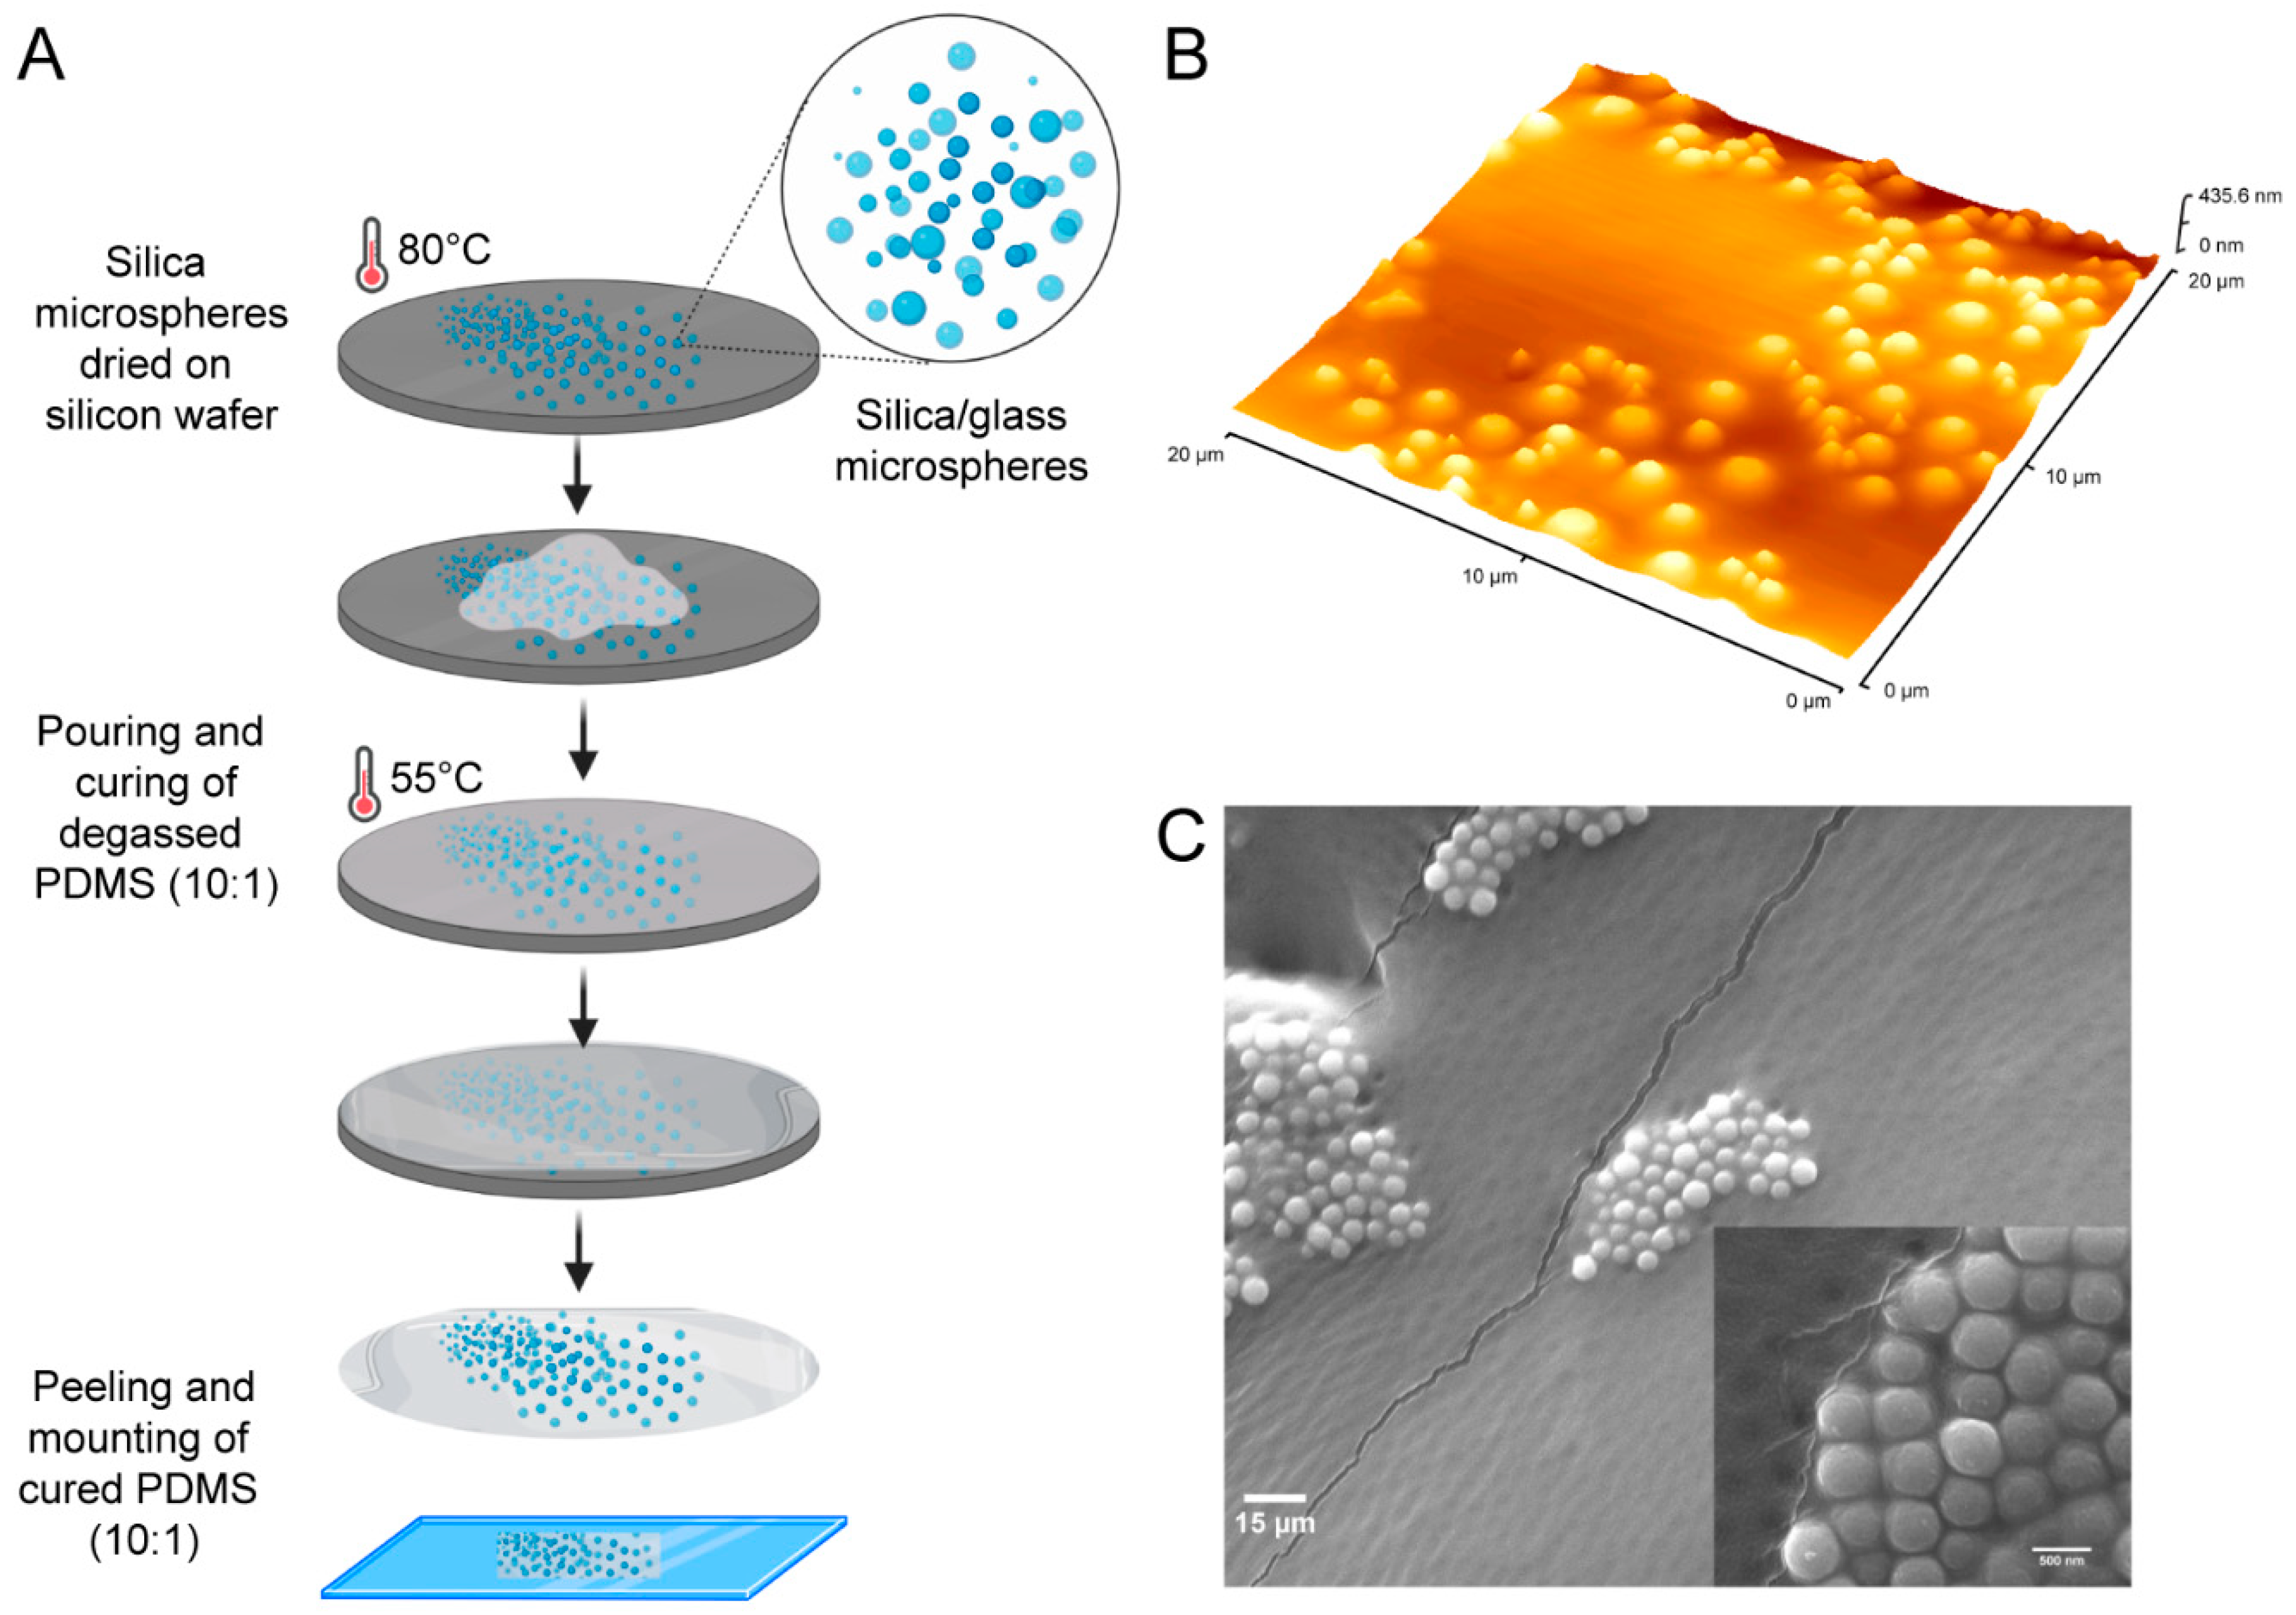
Abstract
:1. Introduction
2. Materials and Methods
3. Results
3.1. Hydrophobic Recovery on Flat PDMS Surfaces
3.2. Hydrophobic Recovery of PDMS Surfaces Embedded with Hydrophilic Beads
4. Discussion
4.1. Hydrophobic Recovery on Flat PDMS Surfaces
4.2. Hydrophobic Recovery of PDMS Surfaces Embedded with Hydrophilic Beads
- (i)
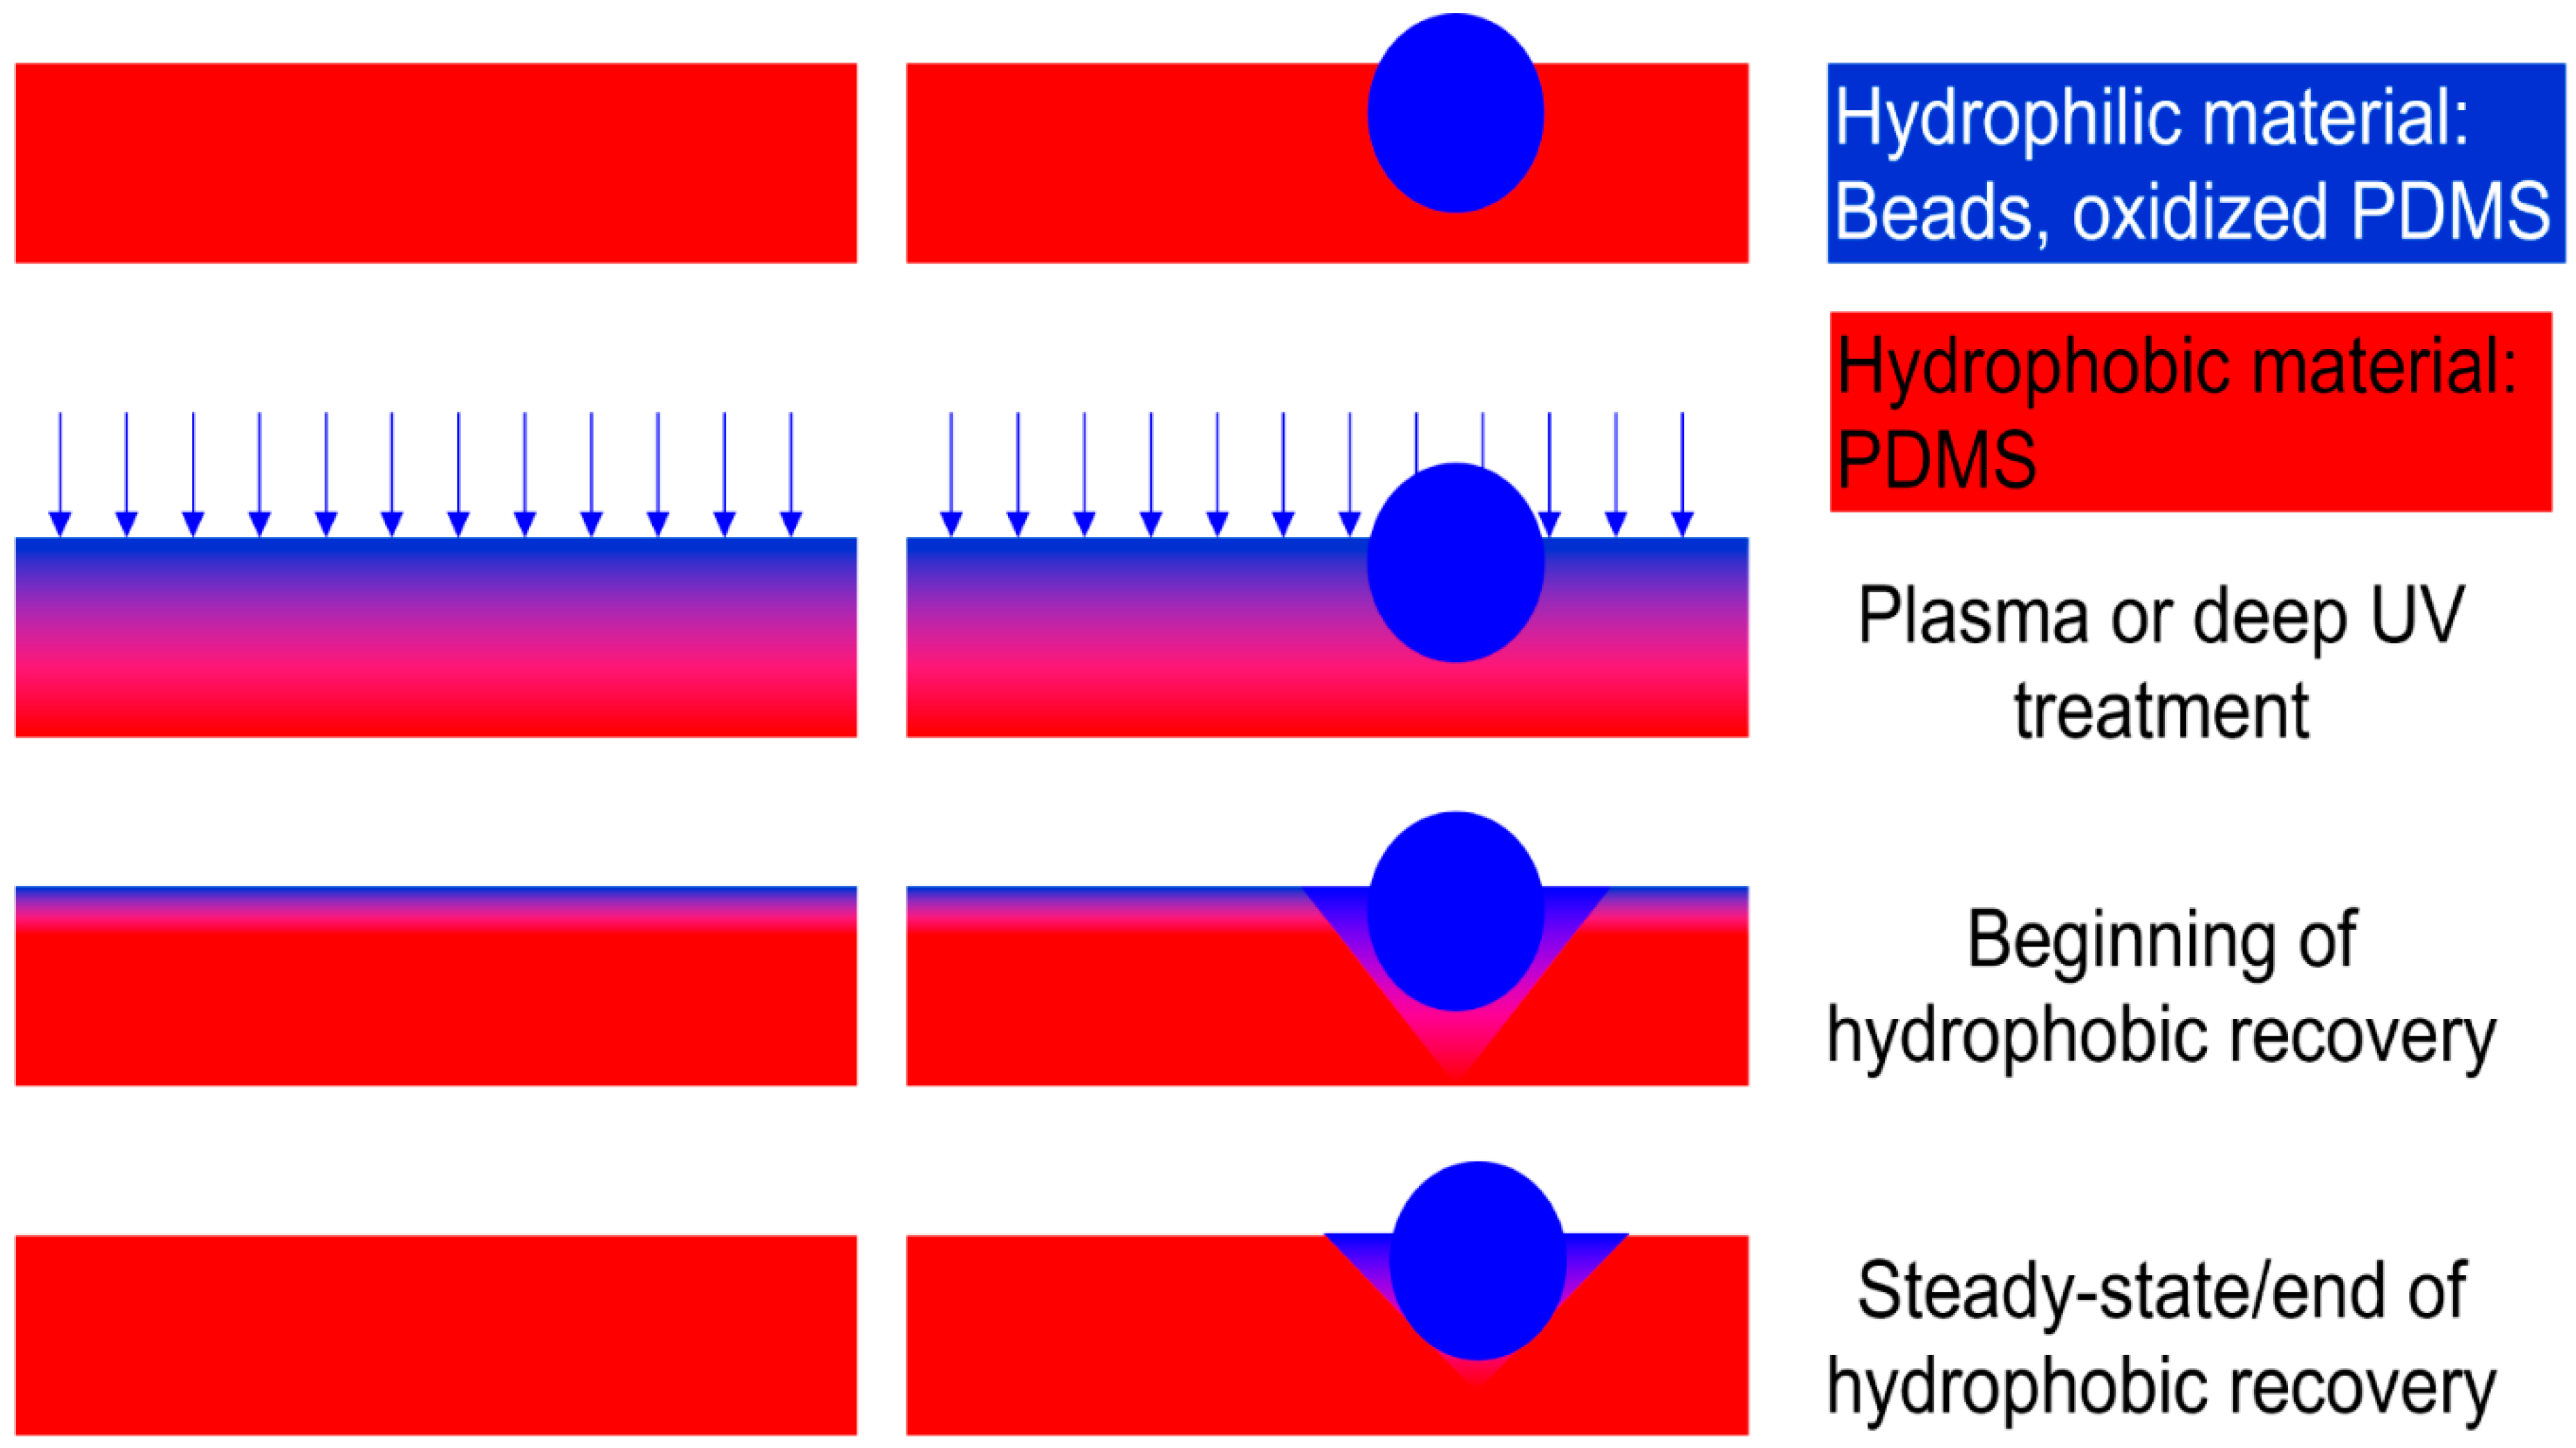
- Chemical processes leading to hydrophilization. The exposure of flat PDMS material to UV radiation (or O2 plasma) translates in the oxidation of the very top layers of the elastomer, thus increasing the SiOx groups embedded in the polymeric matrix. Longer, and/or more intense UV exposure will lead to further breakage and oxidation of the polymeric chains and the formation of silica islands, and eventually a contiguous silica thin ‘skin’.
- (ii)
- Depth limitations of hydrophilization. The oxidative process cannot progress throughout the thickness of the polymeric film, regardless of the intensity or length of the UV radiation, since PDMS is not transparent to UV light (and cannot be penetrated by plasma-ionised gas). This limitation can be inferred from the more prominent FTIR -OH bands at larger wavenumbers with lower ATR penetration depths than those at smaller wavenumbers with longer penetration depths (Figure 3, first two spectra at the top).
- (iii)
- Mechanical properties of the hydrophilized layer. The SiOx-rich material at the top layer of the exposed PDMS surface presents three important characteristics distinguishing it from the unexposed material. First, the top layer is hydrophilic, which can be inferred from the drastic decrease in contact angle measurements (Figure 2a). Second, the difference in densities between the SiOx-rich layer and the submerged native PDMS material results in a wrinkled surface with higher roughness at the nm-scale (Figure 2b). Third, the top layer exhibits more stiffness as shown by the change in Young’s modulus immediately after UV exposure (Figure 2c).
- (iv)
- Different rates of parallel processes following hydrophilization. Immediately after hydrophilization these three parameters follow a gradual return towards the values prior to UV exposure, each with its own dynamics. This complex process is globally denominated as “hydrophobic recovery”, although it involves more aspects than simply surface hydrophobicity.
- a.
- First, the top surface is levelled, driven by the relatively fast mechanical relaxation of the unoxidized, base PDMS elastomer, as evidenced by the initially rapid decrease of the rugosity (Figure 2b). This process also leads to an increase in the Young’s modulus, as well as contributing to an initially more rapid increase of the contact angle (Figure 2a).
- b.
- Second, the apparent stiffness increases until approximately 24 h after hydrophilization, (Figure 2c), possibly due to the ‘consolidation’ of the material supporting the hydrophilic skin, due to the slow crosslinking of the polymer underneath, whose chains were broken during UV exposure.
- c.
- Third, and concomitantly, a slower process occurs, consisting of the cross-diffusion of the SiOx-rich polymeric chains into the native PDMS, and vice versa, resulting in a gradual increase of the Young’s modulus and a slower increase of the contact angle after approximately 10 h (Figure 2c).
- (v)
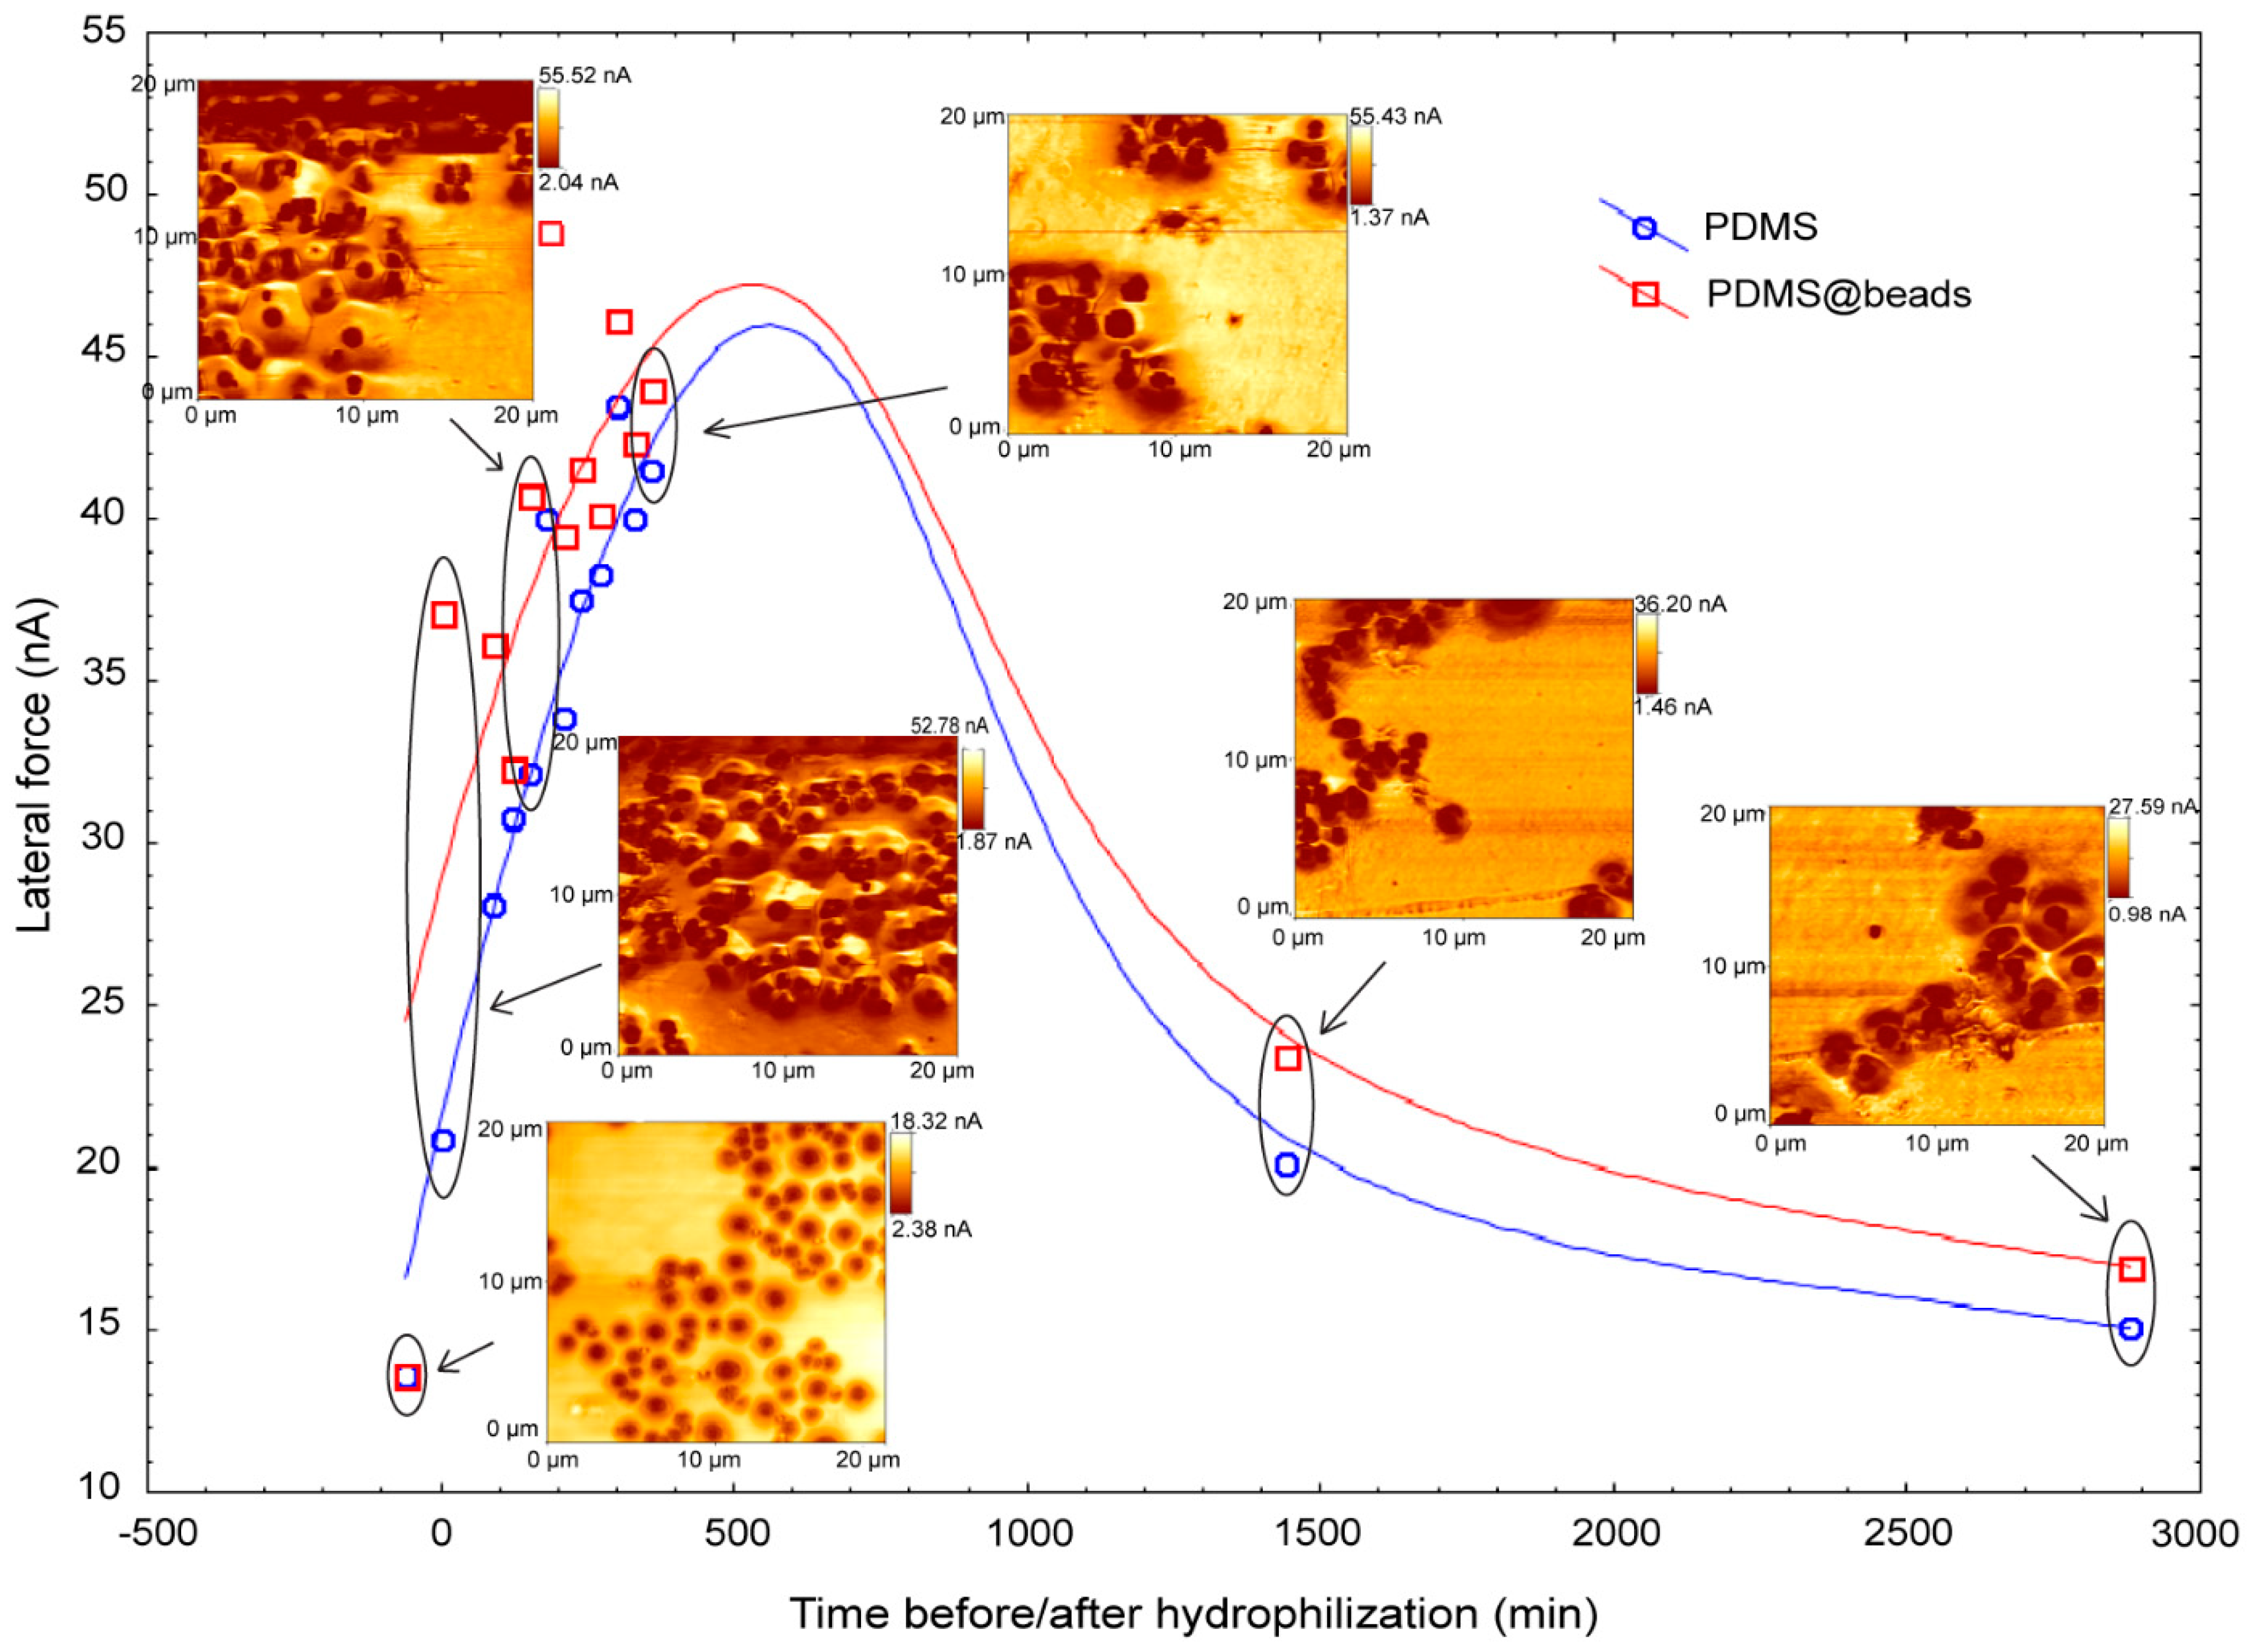
- Evolution of lateral force during hydrophobic recovery. The increase of the Young’s modulus and the decrease of hydrophilicity modulate the forces experienced by the AFM tip during scanning, but with different weights and at different rates. Indeed, the vertical force modulation (Figure 2c) is impacted more by the increase of Young’s modulus than the lateral force (Figure 2d), which in turn is more impacted by surface hydrophobicity than force modulation. The result of this ‘tug of war’ between the increase of Young’s modulus, leading to the increase of the forces experienced by the AFM tip, and the decrease of hydrophilicity, leading to the decrease of these forces, translates to both forces presenting a variation with a maximum (Figure 2c,d). However, due to their different weights, these maxima are located at different times of the hydrophobic recovery (i.e., approximately after 24 h for force modulation) and after 10 h for lateral force.
- (vi)
- End of hydrophobic recovery. These processes reach a quasi-equilibrium state, but the apparent contact angle does not recover totally back at values prior to hydrophilization. This hysteresis can be explained by the limited depth of diffusion of SiOx-rich polymeric chains in the more hydrophobic PDMS base, but also by the fully oxidised silica islands, or even contiguous thin hydrophilic (and stiff) top layer for prolonged, or more intense UV exposure.
4.3. Relevance of Hydrophobic Recovery for Biomedical Applications
5. Conclusions
Supplementary Materials
Author Contributions
Funding
Institutional Review Board Statement
Informed Consent Statement
Data Availability Statement
Acknowledgments
Conflicts of Interest
References
- Dardouri, M.; Bettencourt, A.; Martin, V.; Carvalho, F.A.; Santos, C.; Monge, N.; Santos, N.C.; Fernandes, M.H.; Gomes, P.S.; Ribeiro, I.A. Using plasma-mediated covalent functionalization of rhamnolipids on polydimethylsiloxane towards the antimicrobial improvement of catheter surfaces. Mater. Sci. Eng. C, 2021; 112563, in press. [Google Scholar] [CrossRef]
- Kim, S.-J.; Lee, D.-S.; Kim, I.-G.; Sohn, N.-W.; Park, J.-Y.; Choi, B.-K.; Kim, S.-W. Evaluation of the biocompatibility of a coating material for an implantable bladder volume sensor. Kaohsiung J. Med. Sci. 2012, 28, 123–129. [Google Scholar] [CrossRef] [PubMed] [Green Version]
- Doutel, E.; Viriato, N.; Carneiro, J.; Campos, J.B.; Miranda, J.M. Geometrical effects in the hemodynamics of stenotic and non-stenotic left coronary arteries—Numerical and in vitro approaches. Int. J. Numer. Methods Biomed. Eng. 2019, 35, e3207. [Google Scholar] [CrossRef]
- Wang, X.; Phan, D.T.T.; Sobrino, A.; George, S.C.; Hughes, C.C.W.; Lee, A.P. Engineering anastomosis between living capillary networks and endothelial cell-lined microfluidic channels. Lab Chip 2016, 16, 282–290. [Google Scholar] [CrossRef] [PubMed]
- Xue, Y.; Seiler, M.J.; Tang, W.C.; Wang, J.Y.; Delgado, J.; McLelland, B.T.; Nistor, G.; Keirstead, H.S.; Browne, A.W. Retinal organoids on-a-chip: A micro-millifluidic bioreactor for long-term organoid maintenance. Lab Chip 2021, 21, 3361–3377. [Google Scholar] [CrossRef] [PubMed]
- van Meer, B.; de Vries, H.; Firth, K.; van Weerd, J.; Tertoolen, L.; Karperien, H.; Jonkheijm, P.; Denning, C.; Ijzerman, A.; Mummery, C. Small molecule absorption by PDMS in the context of drug response bioassays. Biochem. Biophys. Res. Commun. 2017, 482, 323–328. [Google Scholar] [CrossRef] [PubMed] [Green Version]
- Mai, H.-N.; Hyun, D.C.; Park, J.H.; Kim, D.-Y.; Lee, S.M.; Lee, D.-H. Antibacterial Drug-Release Polydimethylsiloxane Coating for 3D-Printing Dental Polymer: Surface Alterations and Antimicrobial Effects. Pharmaceuticals 2020, 13, 304. [Google Scholar] [CrossRef]
- de Aguiar, K.M.R.; Nascimento, M.V.; Faccioni, J.L.; Noeske, P.-L.M.; Gätjen, L.; Rischka, K.; Rodrigues-Filho, U.P. Urethanes PDMS-based: Functional hybrid coatings for metallic dental implants. Appl. Surf. Sci. 2019, 484, 1128–1140. [Google Scholar] [CrossRef]
- Comina, G.; Suska, A.; Filippini, D. PDMS lab-on-a-chip fabrication using 3D printed templates. Lab Chip 2014, 14, 424–430. [Google Scholar] [CrossRef] [PubMed]
- Choi, J.R.; Liu, Z.; Hu, J.; Tang, R.; Gong, Y.; Feng, S.; Ren, H.; Wen, T.; Yang, H.; Qu, Z.; et al. Polydimethylsiloxane-Paper Hybrid Lateral Flow Assay for Highly Sensitive Point-of-Care Nucleic Acid Testing. Anal. Chem. 2016, 88, 6254–6264. [Google Scholar] [CrossRef]
- Filipponi, L.; Sawant, P.D.; Fulga, F.; Nicolau, D.V. Microbeads on microposts: An inverted architecture for bead microarrays. Biosens. Bioelectron. 2009, 24, 1850–1857. [Google Scholar] [CrossRef]
- Miranda, I.; Souza, A.; Sousa, P.; Ribeiro, J.; Castanheira, E.M.S.; Lima, R.; Minas, G. Properties and Applications of PDMS for Biomedical Engineering: A Review. J. Funct. Biomater. 2021, 13, 2. [Google Scholar] [CrossRef] [PubMed]
- Bélanger, M.-C.; Marois, Y. Hemocompatibility, biocompatibility, inflammatory andin vivostudies of primary reference materials low-density polyethylene and polydimethylsiloxane: A review. J. Biomed. Mater. Res. 2001, 58, 467–477. [Google Scholar] [CrossRef] [PubMed]
- Bacharouche, J.; Haidara, H.; Kunemann, P.; Vallat, M.-F.; Roucoules, V. Singularities in hydrophobic recovery of plasma treated polydimethylsiloxane surfaces under non-contaminant atmosphere. Sens. Actuators A Phys. 2013, 197, 25–29. [Google Scholar] [CrossRef]
- Fritz, J.L.; Owen, M.J. Hydrophobic Recovery of Plasma-Treated Polydimethylsiloxane. J. Adhes. 1995, 54, 33–45. [Google Scholar] [CrossRef]
- Bodas, D.; Khan-Malek, C. Hydrophilization and hydrophobic recovery of PDMS by oxygen plasma and chemical treatment—An SEM investigation. Sens. Actuators B Chem. 2007, 123, 368–373. [Google Scholar] [CrossRef]
- Hillborg, H.; Ankner, J.; Gedde, U.; Smith, G.; Yasuda, H.; Wikström, K. Crosslinked polydimethylsiloxane exposed to oxygen plasma studied by neutron reflectometry and other surface specific techniques. Polymer 2000, 41, 6851–6863. [Google Scholar] [CrossRef]
- Hillborg, H.; Gedde, U. Hydrophobicity recovery of polydimethylsiloxane after exposure to corona discharges. Polymer 1998, 39, 1991–1998. [Google Scholar] [CrossRef]
- Hillborg, H.; Sandelin, M.; Gedde, U. Hydrophobic recovery of polydimethylsiloxane after exposure to partial discharges as a function of crosslink density. Polymer 2001, 42, 7349–7362. [Google Scholar] [CrossRef]
- Efimenko, K.; Wallace, W.E.; Genzer, J. Surface Modification of Sylgard-184 Poly(dimethyl siloxane) Networks by Ultraviolet and Ultraviolet/Ozone Treatment. J. Colloid Interface Sci. 2002, 254, 306–315. [Google Scholar] [CrossRef]
- Filipponi, L.; Livingston, P.; Kašpar, O.; Tokárová, V.; Nicolau, D.V. Protein patterning by microcontact printing using pyramidal PDMS stamps. Biomed. Microdevices 2016, 18, 9. [Google Scholar] [CrossRef] [PubMed] [Green Version]
- Tavana, H.; Neumann, A. Recent progress in the determination of solid surface tensions from contact angles. Adv. Colloid Interface Sci. 2007, 132, 1–32. [Google Scholar] [CrossRef]
- Crick, C.; Parkin, I.P. Preparation and Characterisation of Super-Hydrophobic Surfaces. Chem.—A Eur. J. 2010, 16, 3568–3588. [Google Scholar] [CrossRef]
- Sethi, S.K.; Manik, G. Recent Progress in Super Hydrophobic/Hydrophilic Self-Cleaning Surfaces for Various Industrial Applications: A Review. Polym. Technol. Eng. 2018, 57, 1932–1952. [Google Scholar] [CrossRef]
- Kašpar, O.; Zhang, H.; Tokárová, V.; Boysen, R.I.; Suñé, G.R.; Borrise, X.; Perez-Murano, F.; Hearn, M.T.W.; Nicolau, D.V. Confinement of water droplets on rectangular micro/nano-arrayed surfaces. Lab Chip 2016, 16, 2487–2493. [Google Scholar] [CrossRef]
- Nicolau, D.V.; Pham, D.K.; Ivanova, E.P.; Wright, J.P.; Lenigk, R.; Smekal, T.; Grodzinski, P. Tone Reversal of an AFM Lateral Force Image Due to Hybridization of Oligonucleotides Immobilized on Polymers. Small 2005, 1, 610–613. [Google Scholar] [CrossRef] [PubMed]
- Nicolau, D.V.; Ivanova, E.P.; Fulga, F.; Filipponi, L.; Viezzoli, A.; Dobroiu, S.; Alekseeva, Y.V.; Pham, D.K. Protein immobilisation on micro/nanostructures fabricated by laser microablation. Biosens. Bioelectron. 2010, 26, 1337–1345. [Google Scholar] [CrossRef]
- Hemmilä, S.; Cauich-Rodríguez, J.V.; Kreutzer, J.; Kallio, P. Rapid, simple, and cost-effective treatments to achieve long-term hydrophilic PDMS surfaces. Appl. Surf. Sci. 2012, 258, 9864–9875. [Google Scholar] [CrossRef]
- Wai, S.W.; Spinks, G.M.; Brown, H.R.; Swain, M. Surface roughness: Its implications and inference with regards to ultra microindentation measurements of polymer mechanical properties. Polym. Test. 2004, 23, 501–507. [Google Scholar] [CrossRef]
- Müller, D.J.; Dumitru, A.C.; Giudice, C.L.; Gaub, H.E.; Hinterdorfer, P.; Hummer, G.; De Yoreo, J.J.; Dufrêne, Y.F.; Alsteens, D. Atomic Force Microscopy-Based Force Spectroscopy and Multiparametric Imaging of Biomolecular and Cellular Systems. Chem. Rev. 2021, 121, 11701–11725. [Google Scholar] [CrossRef]
- McGuiggan, P.M.; Zhang, J.; Hsu, S.M. Comparison of friction measurements using the atomic force microscope and the surface forces apparatus: The issue of scale. Tribol. Lett. 2001, 10, 217–223. [Google Scholar] [CrossRef]
- McConney, M.E.; Singamaneni, S.; Tsukruk, V.V. Probing Soft Matter with the Atomic Force Microscopies: Imaging and Force Spectroscopy. Polym. Rev. 2010, 50, 235–286. [Google Scholar] [CrossRef]
- Li, M.; Dang, D.; Liu, L.; Xi, N.; Wang, Y. Atomic Force Microscopy in Characterizing Cell Mechanics for Biomedical Applications: A Review. IEEE Trans. Nanobiosci. 2017, 16, 523–540. [Google Scholar] [CrossRef] [PubMed]
- Noy, A.; Vezenov, D.V.; Lieber, C.M. Chemical force microscopy. Annu. Rev. Mater. Sci. 1997, 27, 381–421. [Google Scholar] [CrossRef] [Green Version]
- Vezenov, D.V.; Noy, A.; Rozsnyai, A.L.F.; Lieber, C.M. Force Titrations and Ionization State Sensitive Imaging of Functional Groups in Aqueous Solutions by Chemical Force Microscopy. J. Am. Chem. Soc. 1997, 119, 2006–2015. [Google Scholar] [CrossRef]
- Derjaguin, B. Molekulartheorie der äußeren Reibung. Eur. Phys. J. A 1934, 88, 661–675. [Google Scholar] [CrossRef]
- Gao, J.; Luedtke, W.D.; Gourdon, D.; Ruths, M.; Israelachvili, J.N.; Landman, U. Frictional Forces and Amonton’s Law: From the Molecular to the Macroscopic Scale. J. Phys. Chem. B 2004, 108, 3410–3425. [Google Scholar] [CrossRef]
- Gibson, C.T.; Watson, G.S.; Myhra, S. Lateral force microscopy—A quantitative approach. Wear 1997, 213, 72–79. [Google Scholar] [CrossRef]
- Leggett, G.J. Scanning Probe Microscopy. In Surface Analysis—The Principal Techniques: Second Edition; John Wiley & Sons Ltd.: Chichester, UK, 2009; pp. 479–562. [Google Scholar]
- Nikogeorgos, N.; Hunter, C.A.; Leggett, G.J. Relationship Between Molecular Contact Thermodynamics and Surface Contact Mechanics. Langmuir 2012, 28, 17709–17717. [Google Scholar] [CrossRef] [PubMed]
- Noy, A.; Frisbie, C.D.; Rozsnyai, L.F.; Wrighton, M.S.; Lieber, C.M. Chemical Force Microscopy: Exploiting Chemically-Modified Tips To Quantify Adhesion, Friction, and Functional Group Distributions in Molecular Assemblies. J. Am. Chem. Soc. 1995, 117, 7943–7951. [Google Scholar] [CrossRef]
- Wilbur, J.L.; Biebuyck, H.A.; MacDonald, J.C.; Whitesides, G.M. Scanning Force Microscopies Can Image Patterned Self-Assembled Monolayers. Langmuir 1995, 11, 825–831. [Google Scholar] [CrossRef]
- Magonov, S.N.; Reneker, D.H. Characterization of polymer surfaces with atomic force microscopy. Annu. Rev. Mater. Sci. 1997, 27, 175–222. [Google Scholar] [CrossRef] [Green Version]
- Bar, G.; Delineau, L.; Häfele, A.; Whangbo, M.-H. Investigation of the stiffness change in, the indentation force and the hydrophobic recovery of plasma-oxidized polydimethylsiloxane surfaces by tapping mode atomic force microscopy. Polymer 2001, 42, 3627–3632. [Google Scholar] [CrossRef]
- Zheng, F.; He, C.; Fang, P.; Wang, J.; Xiong, B.; Wang, K.; Liu, F.; Peng, X.; Xu, X.; Xu, Z.; et al. The surface structure of UV exposed poly-dimethylsiloxane (PDMS) insulator studied by slow positron beam. Appl. Surf. Sci. 2013, 283, 327–331. [Google Scholar] [CrossRef]
- Fuard, D.; Tzvetkova-Chevolleau, T.; Decossas, S.; Tracqui, P.; Schiavone, P. Optimization of poly-di-methyl-siloxane (PDMS) substrates for studying cellular adhesion and motility. Microelectron. Eng. 2008, 85, 1289–1293. [Google Scholar] [CrossRef] [Green Version]
- Baudoin, R.; Alberto, G.; Paullier, P.; Legallais, C.; Leclerc, E. Parallelized microfluidic biochips in multi well plate applied to liver tissue engineering. Sens. Actuators B Chem. 2012, 173, 919–926. [Google Scholar] [CrossRef]
- Held, M.; Kašpar, O.; Edwards, C.; Nicolau, D.V. Intracellular mechanisms of fungal space searching in microenvironments. Proc. Natl. Acad. Sci. USA 2019, 116, 13543–13552. [Google Scholar] [CrossRef] [Green Version]
- Brown, X.Q.; Ookawa, K.; Wong, J.Y. Evaluation of polydimethylsiloxane scaffolds with physiologically-relevant elastic moduli: Interplay of substrate mechanics and surface chemistry effects on vascular smooth muscle cell response. Biomaterials 2005, 26, 3123–3129. [Google Scholar] [CrossRef] [PubMed]
- Palchesko, R.N.; Zhang, L.; Sun, Y.; Feinberg, A.W. Development of Polydimethylsiloxane Substrates with Tunable Elastic Modulus to Study Cell Mechanobiology in Muscle and Nerve. PLoS ONE 2012, 7, e51499. [Google Scholar] [CrossRef] [PubMed] [Green Version]
- Poepping, T.; Nikolov, H.N.; Thorne, M.L.; Holdsworth, D.W. A thin-walled carotid vessel phantom for Doppler ultrasound flow studies. Ultrasound Med. Biol. 2004, 30, 1067–1078. [Google Scholar] [CrossRef]
- Monson, K.L.; Goldsmith, W.; Barbaro, N.M.; Manley, G.T. Axial Mechanical Properties of Fresh Human Cerebral Blood Vessels. J. Biomech. Eng. 2003, 125, 288–294. [Google Scholar] [CrossRef] [PubMed]
- Goldman, S.; Solano-Altamirano, J.M.; LeDez, K.M. Gas Bubble Dynamics in the Human Body. In Gas Bubble Dynamics in the Human Body; Academic Press: Waltham, MA, USA, 2018. [Google Scholar]
- Bilgin, S.; Isik, M.; Yilgor, E.; Yilgor, I. Hydrophilization of silicone-urea copolymer surfaces by UV/ozone: Influence of PDMS molecular weight on surface oxidation and hydrophobic recovery. Polymer 2013, 54, 6665–6675. [Google Scholar] [CrossRef]
- Lü, H.-F.; Yan, W.-P.; Liu, Z.-H.; Li, J.-C. Hydrophilic Surface Modification of Polydimethylsiloxane with UV/Ozone Treatment. Guang Pu Xue Yu Guang Pu Fen Xi/Spectrosc. Spectr. Anal. 2016, 36, 1033–1037. [Google Scholar] [CrossRef]
- Zhu, Y. Influence of corona discharge on hydrophobicity of silicone rubber used for outdoor insulation. Polym. Test. 2019, 74, 14–20. [Google Scholar] [CrossRef]
- Oláh, A.; Hillborg, H.; Vancso, G. Hydrophobic recovery of UV/ozone treated poly(dimethylsiloxane): Adhesion studies by contact mechanics and mechanism of surface modification. Appl. Surf. Sci. 2005, 239, 410–423. [Google Scholar] [CrossRef]
- Senzaki, T.; Fujikawa, S. Fast Hydrophobicity Recovery of the Surface-Hydrophilic Poly(dimethylsiloxane) Films Caused by Rechemisorption of Dimethylsiloxane Derivatives. Langmuir 2019, 35, 9747–9752. [Google Scholar] [CrossRef] [PubMed]
- Livingston, P.; Tsuzuki, T.; Boysen, R.I.; Nicolau, D.V. Lateral force contrast for the detection of hydrophilic beads embedded within a PDMS surface. In Proceedings of the Biomedical Applications of Micro- and Nanoengineering III, Adelaide, Australia, 11–13 December 2006. [Google Scholar]
- Zhao, L.H.; Lee, J.; Sen, P.N. Long-term retention of hydrophilic behavior of plasma treated polydimethylsiloxane (PDMS) surfaces stored under water and Luria-Bertani broth. Sens. Actuators A Phys. 2012, 181, 33–42. [Google Scholar] [CrossRef]
- Yoshie, H.; Koushki, N.; Kaviani, R.; Tabatabaei, M.; Rajendran, K.; Dang, Q.; Husain, A.; Yao, S.; Li, C.; Sullivan, J.K.; et al. Traction Force Screening Enabled by Compliant PDMS Elastomers. Biophys. J. 2018, 114, 2194–2199. [Google Scholar] [CrossRef] [PubMed] [Green Version]
- Keough, E.M.; Mackey, W.C.; Connolly, R.; Foxall, T.; Ramberg-Laskaris, K.; McCullough, J.L.; O’Donnell, T.F., Jr.; Callow, A.D. The interaction of blood components with PDMS(polydimethylsiloxane) and LDPE (low-density polyethylene) in a baboon ex vivo arteriovenous shunt model. J. Biomed. Mater. Res. 1985, 19, 577–587. [Google Scholar] [CrossRef] [PubMed]


Publisher’s Note: MDPI stays neutral with regard to jurisdictional claims in published maps and institutional affiliations. |
© 2022 by the authors. Licensee MDPI, Basel, Switzerland. This article is an open access article distributed under the terms and conditions of the Creative Commons Attribution (CC BY) license (https://creativecommons.org/licenses/by/4.0/).
Share and Cite
Tsuzuki, T.; Baassiri, K.; Mahmoudi, Z.; Perumal, A.S.; Rajendran, K.; Rubies, G.M.; Nicolau, D.V. Hydrophobic Recovery of PDMS Surfaces in Contact with Hydrophilic Entities: Relevance to Biomedical Devices. Materials 2022, 15, 2313. https://doi.org/10.3390/ma15062313
Tsuzuki T, Baassiri K, Mahmoudi Z, Perumal AS, Rajendran K, Rubies GM, Nicolau DV. Hydrophobic Recovery of PDMS Surfaces in Contact with Hydrophilic Entities: Relevance to Biomedical Devices. Materials. 2022; 15(6):2313. https://doi.org/10.3390/ma15062313
Chicago/Turabian StyleTsuzuki, Tomoo, Karine Baassiri, Zahra Mahmoudi, Ayyappasamy Sudalaiyadum Perumal, Kavya Rajendran, Gala Montiel Rubies, and Dan V. Nicolau. 2022. "Hydrophobic Recovery of PDMS Surfaces in Contact with Hydrophilic Entities: Relevance to Biomedical Devices" Materials 15, no. 6: 2313. https://doi.org/10.3390/ma15062313