Article

Construction of Al-Mg-Zn Interatomic Potential and the Prediction of Favored Glass Formation Compositions and Associated Driving Forces

Key Laboratory of Advanced Materials (MOE), School of Materials Science and Engineering, Tsinghua University, Beijing 100084, China
*
Author to whom correspondence should be addressed.
Materials 2022, 15(6), 2062; https://doi.org/10.3390/ma15062062
Submission received: 29 January 2022 / Revised: 7 March 2022 / Accepted: 8 March 2022 / Published: 11 March 2022
(This article belongs to the Topic Advanced Forming Technology of Metallic Materials)

Abstract

:
An interatomic potential is constructed for the ternary Al-Mg-Zn system under a proposed modified tight-binding scheme, and it is verified to be realistic. Applying this ternary potential, atomistic simulations predict an intrinsic glass formation region in the composition triangle, within which the glassy alloys are more energetically favored in comparison with their solid solution counterparts. Kinetically, the amorphization driving force of each disordered state is derived to correlate the readiness of its glass-forming ability in practice; thus, an optimal stoichiometry region is pinpointed around Al35Mg35Zn30. Furthermore, by monitoring the structural evolution for various (Al50Mg50)1−xZnx (x = 30, 50, and 70 at.%) compositions, the optimized-glass-former Al35Mg35Zn30 is characterized by both the highest degree of icosahedral ordering and the highest phase stability among the investigated compositions. In addition, the icosahedral network in Al35Mg35Zn30 exhibits a much higher cross-linking degree than that in Al25Mg25Zn50. This suggests that there is a certain correlation between the icosahedral ordering and the larger glass-forming ability of Al35Mg35Zn30. Our results have significant implications in clarifying glass formation and hierarchical atomic structures, and in designing new ternary Al-Mg-Zn glassy alloys with high GFA.

1. Introduction

The low-density and high-strength metal alloys are of increasing interest in a wide variety of industries, including defense, sporting goods, nautical, aeronautical, automotive, and aerospace, among others [1,2,3]. The compelling need for low-density engineering materials is primarily driven by the need to reduce fuel consumption, which simultaneously reduces operational cost [4,5]. Bulk metallic glasses (BMGs), relative newcomers to the world of metal alloys, can possess a diverse array of unique properties due to their inherent glassy microstructure [6,7,8]. For example, typical low-density Al-based BMGs have occupied a special place in the material research field. Their good ductility and high specific strength, combined with excellent corrosion resistance, make them potentially desirable for integration into the marine, medical, and other fields [9,10,11,12]. Research has also shown that Mg-Zn alloys often possess good biodegradability, biocompatibility, and mechanical properties [13,14]. Mg-Zn alloys could form glassy structures over a broad composition range through rapid solidification techniques [15]. Moreover, Al and Mg are the lightweight metals available for industrial purposes, and their surface properties and strength could be significantly improved by alloying with Zn [14]. Therefore, the ternary Al-Mg-Zn system, which is a significant representative of the low-density metal alloys, is selected here for investigation. To exploit the benefits of metallic glasses (MGs), many researchers are focusing their attention on developing a model/theory capable of predicting the glass formation region (GFR) of an alloy system [16,17]. For example, Cui et al. have proposed a novel theoretical model which comprises the formation enthalpy and bond parameter function of metallic glasses and have successfully employed this model to predict the GFR of the ternary Ti-Cu-Zr system [18]. From a physical point of view, the microscopic configuration of a material, either in a disordered state or in a crystalline structure, is governed by its interatomic potential. Once the realistic potential is fitted, the favored glass formation compositions and associated driving forces for all the alloys in the system concerned could be derived through appropriate atomistic simulations.
On a fundamental level, glass-forming ability, as well as various promising mechanical and physical behaviors of MGs, are considered to depend largely upon their inherent hierarchical atomic structures [19]. In 1928, Ramsey [20] proposed that every complex structure, while seemingly random, necessarily includes ordered substructures. Nevertheless, it was not until much later that material researchers began to discover the existence of short-range orders (SROs) in MGs. Many studies have demonstrated that, as the dominant SRO in MGs, the icosahedral (ICO) and ICO-like clusters always possess good configural continuity and structural stability [21]. The formation of densely packed icosahedral ordering would increase the barrier to the formation of a crystalline structure [22,23], but would improve the GFA of a supercooled liquid. However, how these local motifs, representing various SROs, spatially distribute and interconnect with adjacent atomic clusters remains a mystery, and considerable efforts have been made to clarify a higher hierarchy of atomic configuration, i.e., the medium-range orders (MROs) [24,25,26,27,28]. Recently, studies have shown that the plastic deformation capacity of Zr-based glassy alloys could be further enhanced by tailoring the topological orders based on MRO sizes, types, and volume fractions [29]. Comparing the atomic structures in NixZr1−x and CuxZr1−x MGs, it is found that relatively larger fractions of the ICO clusters were obtained in CuxZr1−x MGs near Cu atoms. Meanwhile, a higher population of compacted and topologically ordered configurations and their interpenetrating connections would explain why the GFAs of CuxZr1−x alloys are larger than those of NixZr1−x alloys [30]. The medium-range clusters assemble and pile up in the glassy matrix to further form complicated skeletal networks via the interpenetrating connections and the face-, edge-, and vertex-sharing linking patterns [31,32]. Recent simulations also show that the network connectivities of icosahedra correlate with the macroscopic properties (e.g., shear flows, ductility, strength, etc.) of numerous glassy materials [33,34].
In this work, based on the newly constructed Al-Mg-Zn potential, atomistic simulations are conducted to provide an increased understanding of the underlying mechanism of amorphization transition. The theoretical model proposed in this paper is expected to provide guidance for the composition design of MGs in experiments. Moreover, the atomic-level structures of (Al50Mg50)1−xZnx (x = 30, 50, and 70 at.%), including the optimized stoichiometry of Al35Mg35Zn30, were resolved by multiple analytical approaches. Furthermore, the characteristics of the hierarchical structures were quantitatively evaluated in terms of their rigidity and connectivity in order to interpret the structural origin of GFA.

2. Construction of Al-Mg-Zn Interatomic Potential

To pursue the MD simulations, an interatomic potential was constructed for the ternary Al-Mg-Zn system under a modified TB-SMA formalism [35]. Accordingly, the total potential energy E i of atom i can be calculated by:
E i = j i ϕ ( r i j ) + j i ψ ( r i j )
Here, r i j is the distance between atoms i and j. It has been shown by rule of thumb that the TB-SMA potential is applicable to hcp and fcc metals. Therefore, for the fcc-Al, hcp-Mg, and hcp-Zn, the pair function ϕ ( r i j ) and the density function ψ ( r i j ) of Equation (1) can be written, respectively, as:
ϕ ( r i j ) = { A 1 exp [ P 1 ( r i j r 0 1 ) ] ,           r i j r m 1 A 1 m exp [ P 1 m ( r i j r 0 1 ) ] ( r c 1 r 0 r i j r 0 ) n 1 ,           r m 1 < r i j < r c 1
Ψ ( r i j ) = { A 2 exp [ P 2 ( r i j r 0 1 ) ] ,           r i j r m 2 A 2 m exp [ P 2 m ( r i j r 0 1 ) ] ( r c 2 r 0 r i j r 0 ) n 2 ,           r m 2 < r i j r c 2
Here, P 1 m , A 1 m , P 1 , A 1 , and P 2 m , A 2 m , P 2 , A 2 are another eight potential parameters to be determined by fitting. r c 1 , r c 2 are the cutoff radii of the pair and density functions, and r m 1 , r m 2 are the knots of the pair and density functions. As indicated in Equations (1)–(3), the pair and density functions, including their high derivatives, could smoothly and continuously converge to zero at the cutoff distances, thus obviating the force leaps, energy leaps, and the related non-physical events during the atomistic simulations [36].
The TB-SMA description of the ternary Al-Mg-Zn system is based on the constitutive unary and binary metal systems, i.e., three unary potential parameters for Al-Al, Mg-Mg, and Zn-Zn, respectively, and three binary potential parameters for Al-Mg, Al-Zn, and Mg-Zn, respectively. The Al-Al, Mg-Mg, and Al-Mg potential parameters have been fitted in Ref. [36], and thus were directly applied to this work. These unary and binary potential parameters were determined by fitting the static physical properties of pure metals and compounds obtained from experiments or ab initio calculations. Particularly, in the fitting process of binary potentials, compounds under various compositions or structures were utilized to ensure that the fitted potentials could truly express the interactions among atoms. Since there were insufficient experimental data for unstable elementary substances and virtual intermetallic compounds, the ab initio method will be applied to assist in the construction of their atomic potentials [37,38]. For the detailed ab initio calculation process, please refer to Ref. [36].
The potential parameters for the ternary Al-Mg-Zn system are summarized in Table 1. The related physical properties of hcp-, fcc-, and bcc-Zn derived from the TB-SMA potential, as well as calculated from ab initio or obtained from experiments [39,40], are listed in Table 2. It should be noted that the c/a ratio of Zn is much greater than the ideal value of 1.633; thus, the authors have decided to fit the slightly deviated c/a ratio while allowing hcp to be the lowest energy structure. The static properties of the metallic compounds in binary Al-Zn and Mg-Zn systems are also fitted by this potential and are presented in Table 3 and Table 4, respectively. Obviously, whether it is an elementary substance or intermetallic compound, their physical properties fitted by the TB-SMA potential match quite well with the results from the experiments or ab initio calculations, indicating that the constructed potential is reliable, and thus could be applied to the subsequent atomic simulations of the Al-Mg-Zn system.
We next verified whether this TB-SMA potential could reasonably depict the interactions between atoms under nonequilibrium conditions, i.e., derived the equation of state (EOS) from the TB-SMA potential and then compared it with the corresponding Rose equation [41]. Figure 1 shows the rose equations and EOSs for the Al-Zn and Mg-Zn compounds. It is shown that the n-body parts, pair terms, and total energies of the compounds involved in the figure are all continuous and smooth, without any discontinuities or ‘jumps’ over the entire computational range. Additionally, the EOS energy curve derived from the TB-SMA potential exhibit excellent consistency with the rose equation.

3. Metallic Glass Formation for the Al-Mg-Zn System

3.1. Evaluation of Favored Glass-Forming Compositions

The issue associated with predicting the GFR or quantitative GFA of the Al-Mg-Zn system could be addressed by applying the realistic TB-SMA potential to conduct systematic atomistic simulations, in which solid solution models are employed to compare the relative stability of the AlxMgyZn1−x−y solid solutions versus their competitive amorphous counterparts. This viewpoint has been supported by many theoretical and experimental aspects [42,43,44,45].
According to the equilibrium structures of Al, Mg, and Zn, the fcc and hcp solid solution models containing 6912 atoms have been established [45]. In setting up the solid solution models, the desired solute atoms are added into the simulation models by randomly substituting a certain number of solvent atoms. Periodic boundary conditions are adopted throughout the MD simulations, and the timestep is t = 5 × 10 15   s. The AlxMgyZn1−x−y solid solution models are annealed using the Parrinello–Rahman method [46,47] at 300 K and 0 Pa for about 4 × 10⁶ MD timesteps to reach a relatively stable state (the atomic configuration and the energy of the system were almost unchanged). As a well-known feature for identifying crystalline and amorphous states, the pair-correlation functions g ( r ) are calculated to monitor the structural changes of the AlxMgyZn1−x−y solid solutions [48].
The simulation results indicate that after the structure is completely relaxed, the AlxMgyZn1−x−y models generally exhibit two different states varying the alloy composition, i.e., an amorphous state and a crystalline state. Taking Al40Mg15Zn45 and Al40Mg25Zn35 as examples, the atomic position projections, and their corresponding g ( r ) , are shown in Figure 2 for these two alloy states. Figure 2a reveals that the g ( r ) curve of Al40Mg15Zn45 features apparent crystalline peaks. Accordingly, the atomic positions projection in Figure 2b can also visually reflect this completely ordered state. As for Al40Mg25Zn35 in Figure 2c, the crystalline peaks beyond the second peak have disappeared. Accordingly, the atomic position projection in Figure 2d also exhibits the typical features of short-range ordered, while long-range disordered, arrangement.
According to MD simulations, the glass formation stoichiometry diagram of the Al-Mg-Zn system is derived and exhibited in Figure 3. When the stoichiometry of the alloy falls into the gray dot area in Figure 3, the initial solid solution structures lose stability and collapse, falling into a disordered state. This gray dot area bounded by the Mg-Zn side is thus defined as the metallic glass region; whereas, when an alloy composition is located at the white dot area in Figure 3, the crystalline structure of the initial solid solution can be maintained. This white dot area is consequently classified as the crystalline region. Considering the equivalent atomic radius of Al and Zn and the completely miscible binary equilibrium phase diagram, it is almost impossible to form metallic glasses along the Al-Zn side. Until now, there is has been no report in the literature that the corresponding binary MGs could be synthesized in the Al-Mg system using any experimental methods. This is in accordance with the overall crystalline range in the Al-Mg and Al-Zn sides, as exhibited in Figure 2. As for the Mg-Zn side, only when an alloy composition falls into the central range of 20–70 at.% Zn, are the corresponding metallic glasses, rather than the competing solid solutions, more favorable to be formed. By means of first-principles molecular dynamics, Dai et al. have proposed that the intrinsic GFR of the binary Mg-Zn system to be 25–69 at.% Zn [49]. This is also extremely close to the glassy range in the Mg-Zn side.
After calculating the metallic glass region for the Al-Mg-Zn system, relevant experimental results were collected [50,51,52,53,54,55,56] and marked by the red and green triangles in Figure 3. Apparently, the compositions of these MGs obtained in the experiments all fall within the GFR predicted in this work. We can thus conclude that the intrinsic glass formation region located through MD simulations is effectively supported by the experimental observations.

3.2. Optimization of Glass-Forming Stoichiometries

The glass formation stoichiometry diagram in Figure 3 is not sufficient to meet the requirements of the composition design for AlxMgyZn1−x−y MGs, since it merely denotes the possibility of glass formation, but fails to measure the difficulty or ease of synthesizing MGs at a given composition. Therefore, it is still necessary to pinpoint the optimized compositions inside the identified GFR. From the energetic respect, the amorphization driving force [57] could be written as:
Δ E a m s . s = Δ E a m Δ E s . s
where Δ E a m is the formation energies for the glassy alloys and Δ E s . s is the formation energies for the corresponding solid solutions. According to the driving force criterion, the final phase arises from the competition between the solid solution and the amorphous alloy, and the phase with the largest amorphization driving force is more likely to win this competition and achieve formation. In short, the optimized glass-forming compositions would be further distinguished by a significantly larger Δ E a m s . s value.
Assuming that E Al , E Mg , and E Zn are the experimental lattice energies [58], and MD simulation is employed to calculate the E a m of the AlxMgyZn1−x−y amorphous alloy, Δ E a m can be expressed by:
Δ E a m = E a m [ x E Al + y E Mg + ( 1 x y ) E Zn ]
In determining Δ E s . s , the MC method [59] is applied to calculate the E min of each solid solution. Δ E s . s can be determined by:
Δ E s . s = E min [ x E Al + y E Mg + ( 1 x y ) E Zn ]
After the MD and MC calculations, the corresponding contour map of the amorphization driving force is plotted in Figure 4. It can be seen that the Δ E a m s . s is always negative within the predicted region, indicating that the energy of the glassy alloy is lower than that of its solid solution counterpart; thus, the metallic glass formation is energetically favored. It should be noted that a negative amorphization driving force is a necessary, but insufficient, condition for the alloy system to be more favorable for glass formation. Further, in analyzing Figure 4, we see that the composition area marked by red dots possesses a much lower Δ E a m s . s . Meanwhile, the optimized composition marked by a black pentagram, i.e., Al35Mg35Zn30, is indicated with the lowest Δ E a m s . s . As stated above, the larger the formation enthalpy difference, the greater the driving force of amorphization for an alloy system. Interestingly, the experimental composition of Al40Mg25Zn35 collected in Figure 3 [50] is located near the pinpointed optimized composition site. It is reasonably proved that the metallic glasses near Al35Mg35Zn30 would be more obtainable and thermally stable.

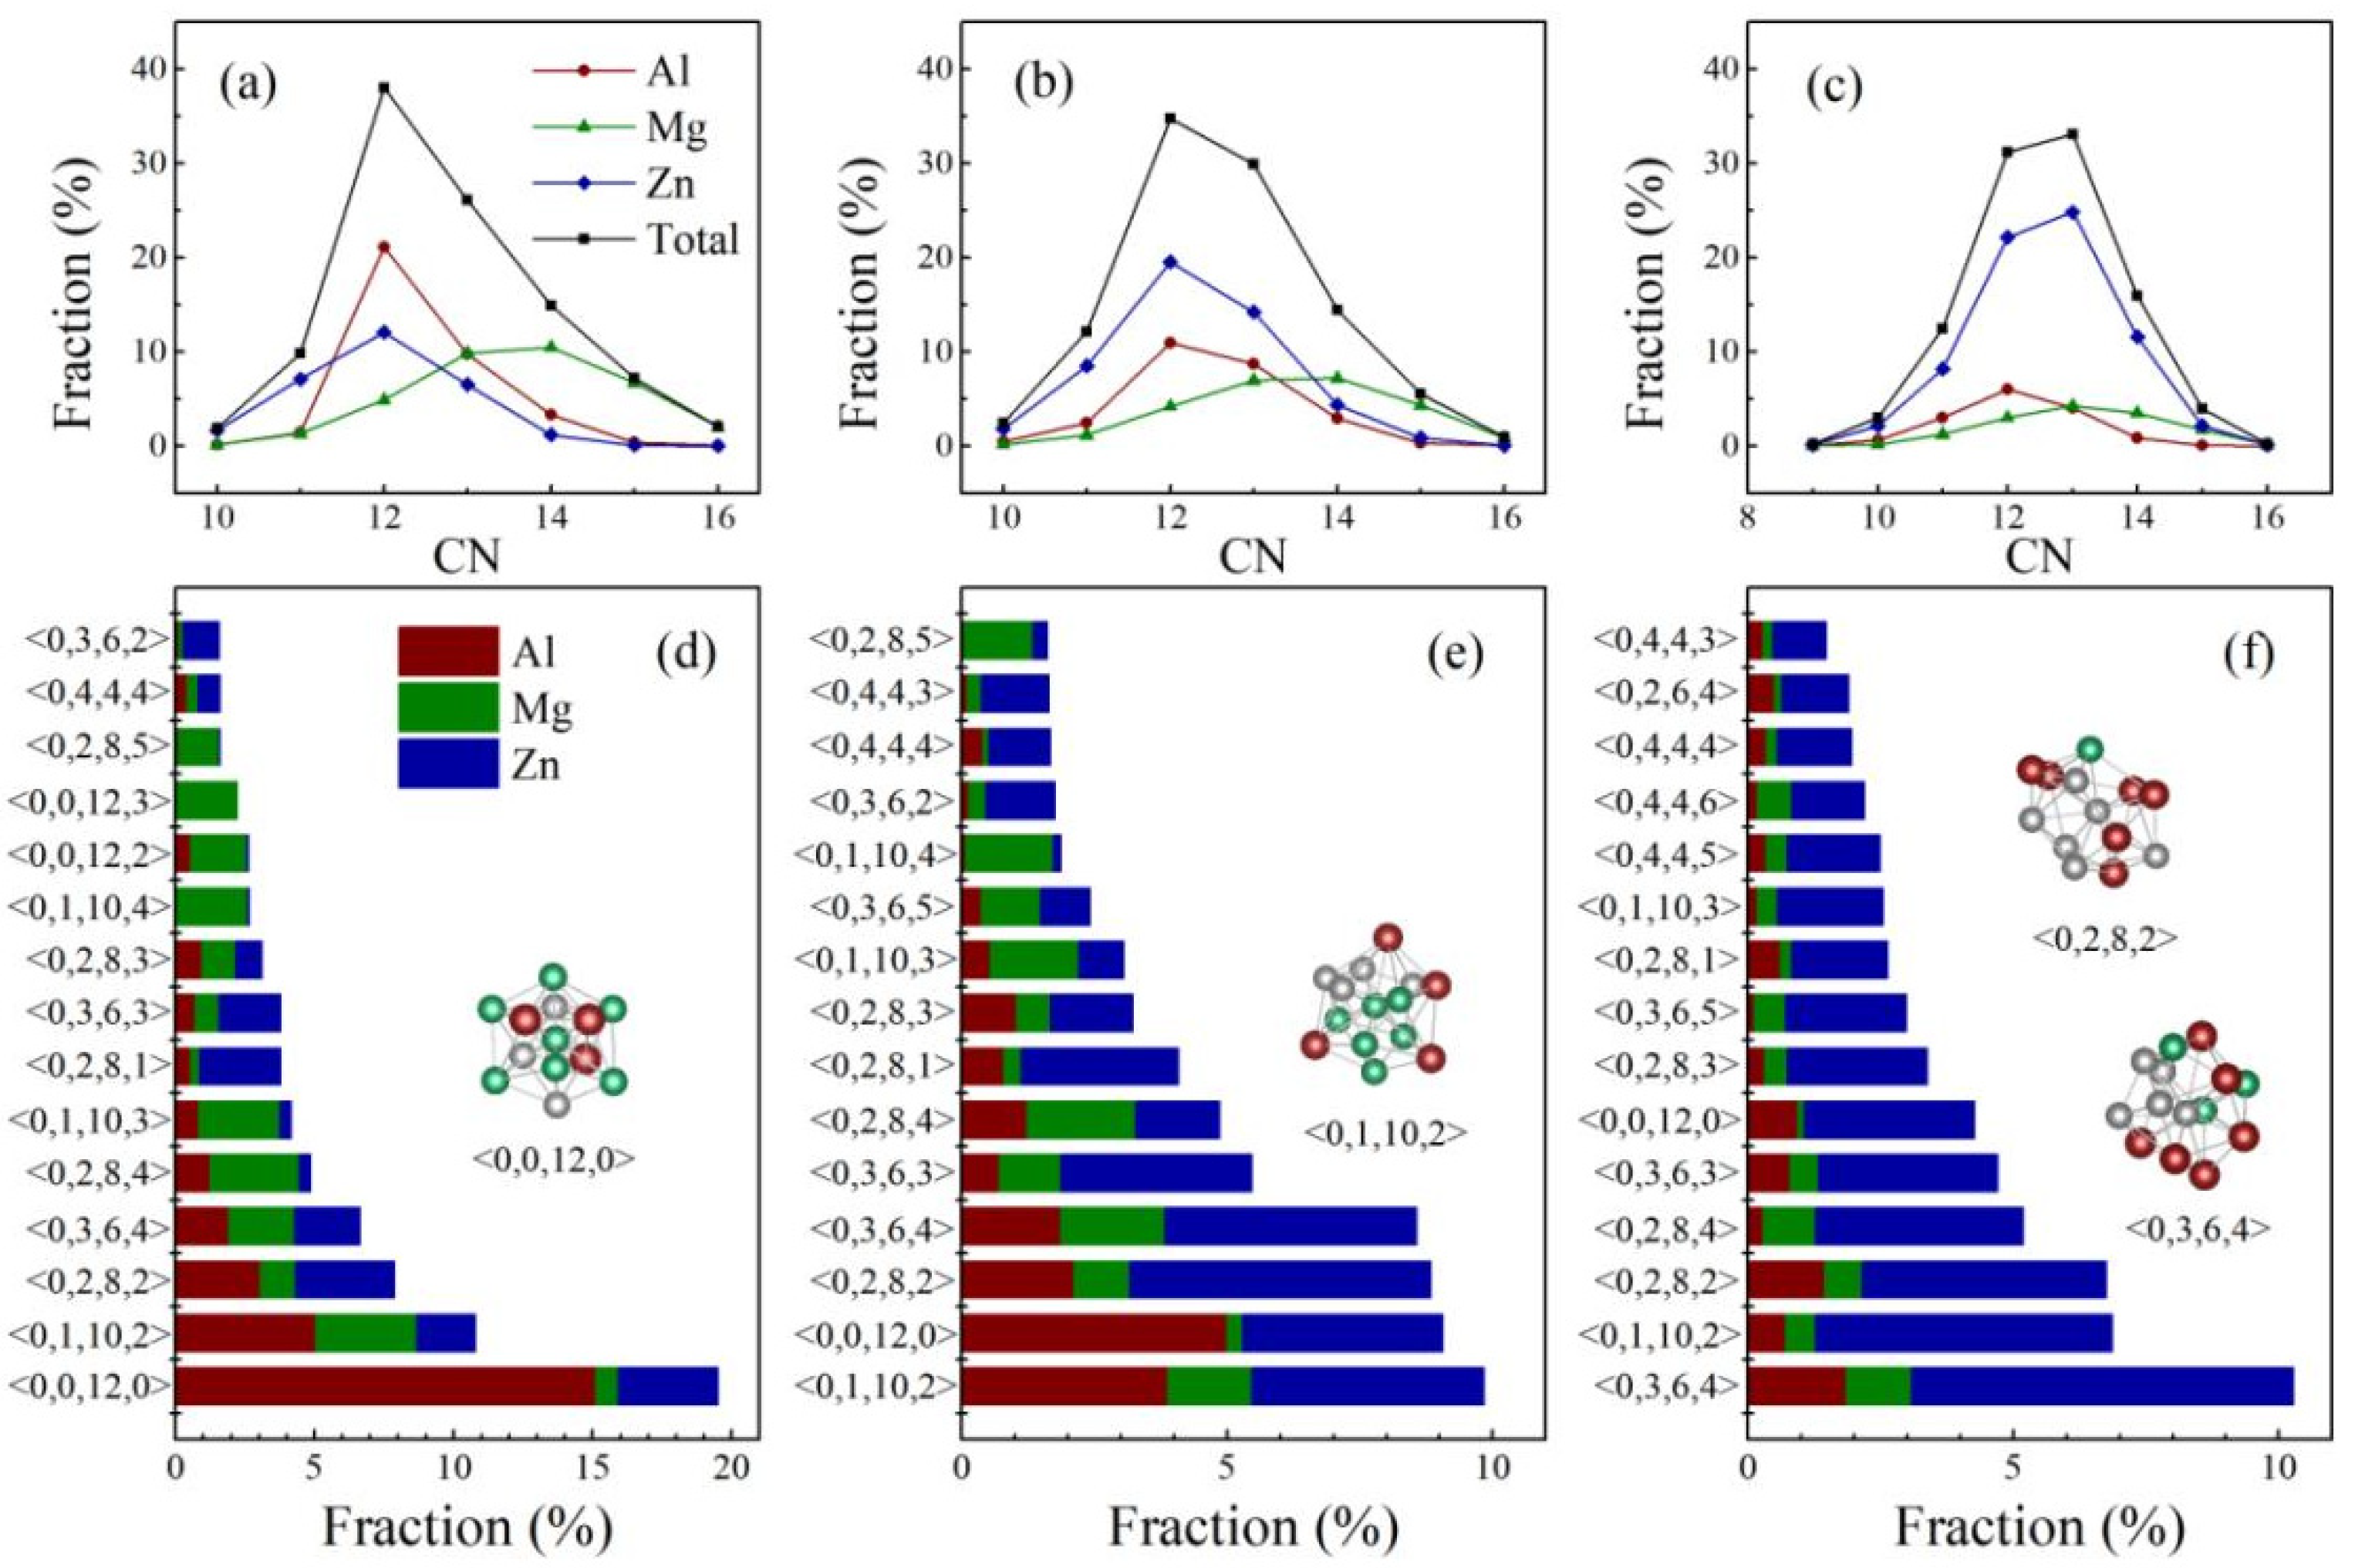
4. Atomic-Level Structure of Al-Mg-Zn Metallic Glasses

4.1. Local Atomic Arrangements in the Short-Range

The Voronoi tessellation method was employed to designate the local short-range orders (SROs) of the MGs [60,61,62]. The distribution variations of the partial and total coordination number (CN) in the MD-derived (Al50Mg50)100−xZnx (x = 30, 50, and 70 at.%) MGs were investigated, as shown in Figure 5a–c. It is seen that the polyhedron with CN = 12 is dominant in both Al35Mg35Zn30 and Al25Mg25Zn50. By further inspecting Figure 5a,b, one can see that the dominating polyhedrons of the Al and Zn atoms are CN = 12, whereas the Mg atoms are mainly surrounded by CN = 14. This could be understood in terms of the atomic radii difference; the relatively larger atomic radius of Mg permits the accommodation of more atoms in its nearest-neighboring shells, and therefore favors larger CNs. However, it can be seen from Figure 5c that the dominant CNs of Al15Mg15Zn70 gradually increase from 12 to 13. As the Zn concentration increases to 70 at.%, the nearest-neighboring shell around each atom is inevitably forced to be packed with more small-sized Zn atoms. Therefore, more atoms would be accommodated in the nearest-neighboring distance, leading to an increase in the total CNs.
Figure 5d–f display the spectrum of the most prevalent Voronoi clusters in the (Al50Mg50)100−xZnx (x = 30, 50, and 70 at.%) MGs. As exhibited in Figure 5d, the most populated clusters around Al are found to be ideal icosahedral <0,0,12,0>, followed by the icosahedra-like [63] clusters, such as <0,3,6,4>, <0,2,8,2>, and <0,1,10,2>. Moreover, the fraction of Al-centered icosahedra (~15.13%) is much higher than that centered on Mg or Zn (~0.82%, 3.57%, respectively), implying a more centralized distribution of SROs around Al. As the Zn concentration increases to 50 at.%, one observes from Figure 5e that the dominant coordination polyhedrons are indexed as <0,3,6,4>, <0,2,8,2>, <0,1,10,2>, and <0,0,12,0>, exhibiting the same prevailing local atomic clusters as the optimized-glass-former, Al35Mg35Zn30. Comparatively, the Voronoi cluster spectrum of Al15Mg15Zn70 in Figure 5f shows that the population of icosahedra-like <0,3,6,4> clusters rank topmost, whereas the fraction of the ideal icosahedra <0,0,12,0> decreases to 4.26%.
The dense clustering of icosahedra or icosahedra-like clusters would lead to the enhancement of glassy stability and the efficient filling of space. Recently, Wu et al. [64] also investigated the cluster energy distributions for different categories of SROs and found that the cluster energies of <0,3,6,4>, <0,2,8,2>, <0,1,10,2>, and <0,0,12,0> are much lower than those of other icosahedral-like clusters. The fractions of various dominant Voronoi clusters in the (Al50Mg50)100−xZnx (x = 30, 50, and 70 at.%) MGs were calculated and illustrated in Figure 6. It can be seen that the fraction of the cluster <0,3,6,4> increases gradually by adding the Zn concentration, whereas the fraction of the clusters <0,2,8,2> and <0,1,10,2> decreases slowly. It is also found that, upon the addition of Zn content, the fraction of the ideal icosahedra <0,0,12,0> gradually increases in the initial stage, reaching its maximum for the optimal composition of Al35Mg35Zn30, and afterwards, experiences a dramatic decrease. Coincidentally, studies in Section 3.2 have indicated that the driving force for amorphization, which is an indicator used to measure the phase stability of MGs, also reaches its maximum for Al35Mg35Zn30. It turns out that Al35Mg35Zn30 is characterized by both the highest degree of icosahedral ordering and the highest phase stability, which proves that some correlation exists between the atomic structure and the glass-forming ability.

4.2. Structural Signature of High Glass-Forming Ability

Previous studies have shown that the full icosahedra <0,0,12,0> (FI) is energetically preferred among various local SROs, as it is absolutely made up of tetrahedra, the densest-packed cluster possible [37,65]. Figure 7 displays the distribution of FIs and their percolated networking in the simulated cells for Al35Mg35Zn30 and Al25Mg25Zn50. It can be seen that in both systems, the FI mainly overlap and interconnect with their adjacent icosahedra via the interpenetrating connections pattern, supplemented by the face-, edge-, and vertex-sharing linking patterns. However, the icosahedral network in Al35Mg35Zn30 is more strongly interpenetrated and developed than that in Al25Mg25Zn50. More extensive icosahedral networks could significantly limit the migration of shared atoms, slowing down the relevant dynamics in supercooled liquids, and subsequently decreasing the critical cooling rate of glass formation. Additionally, the distributed icosahedral network exhibits crystallographically inconsistent five-fold symmetry, which could prevent the nucleation and growth of the crystalline phase. When deviating from the optimized composition Al35Mg35Zn30, the icosahedral network would, to some extent, become disrupted and, according to the findings in Section 3.2, the driving force for amorphization would decrease as well. It is thus demonstrated that the formation of a higher degree of icosahedral ordering could help reduce the total energy of the system and consolidate the structural stabilities.
Of all the four categories of cluster linkages, the volume-sharing linkage is the primary interconnection pattern used in the formation of the icosahedral network. Its extensive use ensures that the system achieves a stable atomic configuration and the most favorable energetic status [66]. To quantitatively characterize how well the volume-sharing linkage works in these two icosahedral networks, their respective connectivity was further examined according to the bond number (N). In general, a higher N value demonstrates that an icosahedra bonds with more adjacent icosahedra through volume sharing [61]. It can be seen from Figure 8a,b that more icosahedra in Al35Mg35Zn30 are involved in the formation of the icosahedral network; when N = 0, the population of isolated clusters in Al25Mg25Zn50 is higher. According to the evaluation of N > 0, the icosahedral network in Al35Mg35Zn30 exhibits a much higher cross-linking degree than that in Al25Mg25Zn50. This is because when the Zn content increases to 50 at.%, the number of clusters <0,0,12,0> experiences a slight decrease and gives way to the icosahedral-like clusters, such as clusters <0,3,6,4>, <0,2,8,2>, and <0,1,10,2>, further leading to a weaker cross-linking degree of the icosahedral network.
The hierarchical atomic structures for the ternary Al-Mg-Zn MGs, including SRO, MRO, and the extended-scale structural skeleton, are illustrated in Figure 9a–c. As shown in Figure 9a, the coordination mode in the SRO is displayed by the <0,0,12,0> cluster around the Al atom. The packing mode in the MRO is shown in Figure 9b, where seven adjacent icosahedra <0,0,12,0> are collectively hybridized together in the pattern of vertex-, edge-, face-, and volume-sharing linkages to form a nano-scale super-cluster. For the connection mode of the extended-scale structural skeleton, only the center atoms of the icosahedra <0,0,12,0> are plotted as points in Figure 9c; a typical cross-linked network containing 52 icosahedra is extracted from Al35Mg35Zn30 MG, where the six colors correspond to various bond numbers. It is observed that the spatial distributions of the icosahedra themselves are not uniform, but rather present a serious density fluctuation. Ultimately, the densely packed spatial network that extends into the glassy matrix would deeply affect the physical and mechanical behavior of the ternary Al-Mg-Zn MGs.

5. Conclusions

In summary, we suggested taking the Al-Mg-Zn TB-SMA potential as the starting point, and that the computational simulations would not only predict the intrinsic GFR to be a convex region bounded by the Mg-Zn side in the composition triangle, but would also pinpoint a subregion around Al35Mg35Zn30 as the optimized stoichiometry area. The detailed evolution of the atomic-level structures in various (Al50Mg50)1−xZnx MGs was then tracked and comprehensively characterized using Voronoi tessellation analyses. It was revealed that the dominant interconnected clusters for (Al50Mg50)1−xZnx MGs are <0,3,6,4>, <0,2,8,2>, <0,1,10,2>, and <0,0,12,0>, respectively, while the population of the ideal icosahedra <0,0,12,0> increases to the maximum value at the optimized composition of Al35Mg35Zn30. Additionally, more interpenetrated and developed icosahedral networks in Al35Mg35Zn30 MG could help reduce the total energy of this system and consolidate the structural stabilities. The glass-forming abilities predicted from the structural and energetic aspects are in well accord here. Our observations establish a link between the glass formation mechanism and the hierarchical atomic structure, providing insight into how one could synthesis glassy materials with high a GFA in future experiments.

Author Contributions

Investigation and writing—original draft preparation, B.C.; conceptualization, J.L. (Jiahao Li) and W.L.; methodology, B.L.; writing—review and editing, J.L. (Jianbo Liu). All authors have read and agreed to the published version of the manuscript.

Funding

The authors are grateful for the financial support from the National Natural Science Foundation of China (51631005), and the Administration of Tsinghua University.

Institutional Review Board Statement

This study did not require ethical approval.

Informed Consent Statement

Not applicable.

Data Availability Statement

The data used to support the findings of the present study are available from the corresponding author upon request.

Conflicts of Interest

The authors declare no conflict of interest.

References

  1. Gutierrez-Urrutia, I. Low density Fe-Mn-Al-C steels: Phase structures, mechanisms and properties. ISIJ Int. 2021, 61, 16–25. [Google Scholar] [CrossRef]
  2. Clancy, A.J.; Anthony, D.B.; De Luca, F. Metal Mimics: Lightweight, strong, and tough nanocomposites and nanomaterial assemblies. Acs. Appl. Mater. Inter. 2020, 12, 15955–15975. [Google Scholar] [CrossRef] [PubMed]
  3. Makineni, S.K.; Singh, M.P.; Chattopadhyay, K. Low-density, high-temperature Co base superalloys. Annu. Rev. Mater. Res. 2021, 51, 187–208. [Google Scholar] [CrossRef]
  4. Pollock, T.M. Weight loss with magnesium alloys. Science 2010, 328, 986–987. [Google Scholar] [CrossRef] [PubMed]
  5. Brenna, M.; Bucci, V.; Falvo, M.C.; Foiadelli, F.; Ruvio, A.; Sulligoi, G.; Vicenzutti, A. A review on energy efficiency in three transportation sectors: Railways, electrical vehicles and marine. Energies 2020, 13, 2378. [Google Scholar] [CrossRef]
  6. Yi, J. Fabrication and properties of micro- and nanoscale metallic glassy wires. Adv. Eng. Mater. 2018, 20, 1700875. [Google Scholar] [CrossRef]
  7. Khan, M.M.; Nemati, A.; Rahman, Z.U.; Shah, U.H.; Asgar, H.; Haider, W. Recent advancements in bulk metallic glasses and their applications. Crit. Rev. Solid State 2018, 43, 233–268. [Google Scholar] [CrossRef]
  8. Jiang, H.Y.; Shang, T.T.; Xian, H.J.; Sun, B.A.; Zhang, Q.H.; Yu, Q.; Bai, H.Y.; Gu, L.; Wang, W.H. Structures and functional properties of amorphous alloys. Small Struct. 2021, 2, 2000057. [Google Scholar] [CrossRef]
  9. Gerard, A.Y.; Lutton, K.; Lucente, A.; Frankel, G.S.; Scully, J.R. Progress in understanding the origins of excellent corrosion resistance in metallic alloys: From binary polycrystalline alloys to metallic glasses and high entropy alloys. Corrosion 2020, 76, 485–499. [Google Scholar] [CrossRef]
  10. Li, H.; Li, Z.; Yang, J.; Ke, H.B.; Sun, B.; Yuan, C.C. Interface design enabled manufacture of giant metallic glasses. Sci. China Mater. 2021, 64, 964–972. [Google Scholar] [CrossRef]
  11. He, T.; Chen, S.; Lu, T.; Zhao, P.; Chen, W.; Scudino, S. High-strength and ductile ultrafine-grained Al-Y-Ni-Co alloy for high-temperature applications. J. Alloys Compd. 2020, 848, 156655. [Google Scholar] [CrossRef]
  12. Peng, S.Y.; Zhang, Y.H.; Cui, B.; Ngai, T.L.; Liu, Y.F.; Xiao, Z.Y.; Chen, W. Lamellar-structured Al-based alloys with high strength and plasticity. J. Alloy Compd. 2021, 865, 158927. [Google Scholar] [CrossRef]
  13. Bai, J.; Xu, Y.; Fan, Q.Z.; Cao, R.H.; Zhou, X.X.; Cheng, Z.J.; Dong, Q.S.; Xue, F. Mechanical properties and degradation behaviors of Zn-xMg alloy fine wires for biomedical applications. Scanning 2021, 12, 4831387. [Google Scholar] [CrossRef] [PubMed]
  14. Dickel, D.E.; Baskes, M.I.; Aslam, I.; Barrett, C.D. New interatomic potential for Mg-Al-Zn alloys with specific application to dilute Mg-based alloys. Modelling Simul. Mater. Sci. Eng. 2018, 26, 045010. [Google Scholar] [CrossRef]
  15. Foroughi, A.; Tavakoli, R. Topological and chemical short-range order and their correlation with glass form ability of Mg-Zn metallic glasses: A molecular dynamics study. Comput. Mater. Sci. 2020, 180, 109709. [Google Scholar] [CrossRef]
  16. Zhao, S.; Li, J.H.; An, S.M.; Li, S.N.; Liu, B.X. Atomistic modeling to investigate the favored composition for metallic glass formation in the Ca-Mg-Ni ternary system. Phys. Chem. Chem. Phys. 2017, 19, 12056–12063. [Google Scholar] [CrossRef] [PubMed]
  17. Dai, R.; Ashcraft, R.; Gangopadhyay, A.K.; Kelton, K.F. Predicting metallic glass formation from properties of the high temperature liquid. J. Non-Cryst. Solids 2019, 525, 119673. [Google Scholar] [CrossRef]
  18. Cui, K.Y.; Deng, Y.L.; Zhang, C.; Zhang, B.W.; Liao, S.Z. Prediction of glass forming ranges in Ti-Ni-Zr, Ti-Cu-Zr and Ti-Cu-Hf systems based on miedema and atomic parameter models. Mater. Trans. 2020, 61, 1200–1204. [Google Scholar]
  19. Niu, X.F.; Yao, G.X.; Qiao, J.W.; Feng, S.D.; Pan, S.P. Effect of Y on the structure-property relationship of Mg65Cu25Y10 metallic glass. Comp. Mater. Sci. 2020, 171, 109285. [Google Scholar] [CrossRef]
  20. Ramsey, F.P. A mathematical theory of saving. Econ. J. 1928, 38, 543–559. [Google Scholar] [CrossRef]
  21. Zhang, P.; Maldonis, J.J.; Besse, M.F.; Kramer, M.J.; Voyles, P.M. Medium-range structure and glass forming ability in Zr-Cu-Al bulk metallic glasses. Acta Mater. 2016, 109, 103–114. [Google Scholar] [CrossRef] [Green Version]
  22. Han, C.Y.; Yang, W.Y.; Lan, Y.K.; Sun, M.H. Al addition on the short and medium range order of CuZrAl metallic glasses. Phys. B 2021, 619, 413237. [Google Scholar] [CrossRef]
  23. Samavatian, M.; Gholamipour, R.; Samavatian, V.; Farahani, F. Effects of Nb minor addition on atomic structure and glass forming ability of Zr55Cu30Ni5Al10 bulk metallic glass. Mater. Res. Express 2019, 6, 065202. [Google Scholar] [CrossRef]
  24. Kbirou, M.; Trady, S.; Hasnaoui, A.; Mazroui, M. Short and medium-range orders in Co3Al metallic glass. Chem. Phys. 2018, 513, 58–66. [Google Scholar] [CrossRef]
  25. Ren, L.; Gao, T.H.; Ma, R.; Xie, Q.; Tian, Z.A.; Chen, Q.; Liang, Y.C.; Hu, X.C. The connection of icosahedral and defective icosahedral clusters in medium range order structures of CuZrAl alloy. J. Non-Cryst. Solids 2019, 521, 119475. [Google Scholar] [CrossRef]
  26. Davani, F.A.; Hilke, S.; Roesner, H.; Geissler, D.; Gebert, A.; Wilde, G. Correlations between the ductility and medium-range order of bulk metallic glasses. J. Appl. Phys. 2020, 128, 015103. [Google Scholar] [CrossRef]
  27. Huang, B.; Yuan, C.C.; Wang, Z.Q.; Tong, Y.; Wang, Q.; Yi, J.; Wang, G.; He, Q.F.; Shek, C.H.; Yang, Y. Influence of short- to medium-range electronic and atomic structure on secondary relaxations in metallic glasses. Acta Mater. 2020, 196, 88–100. [Google Scholar] [CrossRef]
  28. Feng, S.D.; Chan, K.C.; Zhao, L.; Pan, S.P.; Qi, L.; Wang, L.M.; Liu, R.P. Rejuvenation by weakening the medium range order in Zr46Cu46Al8 metallic glass with pressure preloading: A molecular dynamics simulation study. Mater. Des. 2018, 158, 248–255. [Google Scholar] [CrossRef]
  29. Hilke, S.; Roesner, H.; Geissler, D.; Gebert, A.; Peterlechner, M.; Wilde, G. The influence of deformation on the medium-range order of a Zr-based bulk metallic glass characterized by variable resolution fluctuation electron microscopy. Acta Mater. 2019, 171, 275–281. [Google Scholar] [CrossRef]
  30. Ghaemi, M.; Tavakoli, R.; Foroughi, A. Comparing short-range and medium-range ordering in Cu-Zr and Ni-Zr metallic glasses—Correlation between structure and glass form ability. J. Non-Cryst. Solids 2018, 499, 227–236. [Google Scholar] [CrossRef]
  31. Pekin, T.C.; Ding, J.; Gammer, C.; Ozdol, B.; Ophus, C.; Asta, M.; Ritchie, R.O.; Minor, A.M. Direct measurement of nanostructural change during in situ deformation of a bulk metallic glass. Nat. Commun. 2019, 10, 2445. [Google Scholar] [CrossRef] [PubMed]
  32. Yang, M.H.; Li, J.H.; Liu, B.X. Fractal analysis on the cluster network in metallic liquid and glass. J. Alloy Compd. 2018, 757, 228–232. [Google Scholar] [CrossRef]
  33. Xie, Z.C.; Gao, T.H.; Guo, X.T.; Qin, X.M.; Xie, Q. Network connectivity in icosahedral medium-range order of metallic glass: A molecular dynamics simulation. J. Non-Cryst. Solids 2014, 406, 31–36. [Google Scholar] [CrossRef]
  34. Wang, C.C.; Wong, C.H. Interpenetrating networks in Zr-Cu-Al and Zr-Cu metallic glasses. Intermetallics 2012, 22, 13–16. [Google Scholar] [CrossRef]
  35. Li, J.H.; Dai, X.D.; Wang, T.L.; Liu, B.X. A binomial truncation function proposed for the second-moment approximation of tight-binding potential and application in the ternary Ni-Hf-Ti system. J. Phys. Condens. Matter 2007, 19, 271–296. [Google Scholar] [CrossRef]
  36. Zhao, S.; Li, J.H.; Liu, J.B.; Li, S.N.; Liu, B.X. Atomistic approach to design favored compositions for the ternary Al-Mg-Ca metallic glass formation. RSC Adv. 2015, 5, 93623–93630. [Google Scholar] [CrossRef]
  37. Kresse, G.; Hafner, J. Ab-initio molecular dynamics for liquid metals. Phys. Rev. B 1993, 47, 558–561. [Google Scholar] [CrossRef] [PubMed]
  38. Kresse, G.; Furthmüller, J. Efficient iterative schemes for ab initio total-energy calculations using a plane-wave basis set. Phys. Rev. B 1996, 54, 11169. [Google Scholar] [CrossRef] [PubMed]
  39. Garland, C.W.; Dalven, R. Elastic constants of zinc from 4.2°K to 77.6°K. Phys. Rev. 1958, 111, 1232. [Google Scholar] [CrossRef]
  40. Porter, F.C. Zinc Handbook: Properties, Processing, and Use in Design; Marcel Dekker: New York, NY, USA, 1991. [Google Scholar]
  41. Rose, J.H.; Smith, J.R.; Guinea, F.; Ferrante, J. Universal features of the equation of state of metals. Phys. Rev. B Condens. Matter Mater. Phys. 1984, 29, 2963–2969. [Google Scholar] [CrossRef]
  42. Wang, W.H.; Dong, C.; Shek, C.H. Bulk metallic glasses. Mater. Sci. Eng. R 2004, 44, 45–89. [Google Scholar] [CrossRef]
  43. Schroers, J. Processing of bulk metallic glass. Adv. Mater. 2010, 22, 1566–1597. [Google Scholar] [CrossRef] [PubMed]
  44. Basu, J.; Murty, B.S.; Ranganathan, S.J. Glass forming ability: Miedema approach to (Zr, Ti, Hf)-(Cu, Ni) binary and ternary alloys. J. Alloys Compd. 2008, 465, 163–172. [Google Scholar] [CrossRef]
  45. Dai, Y.; Li, J.H.; Che, X.L.; Liu, B.X. Proposed long-range empirical potential to study the metallic glasses in the Ni-Nb-Ta system. J. Phys. Chem. B 2009, 113, 7282–7290. [Google Scholar] [CrossRef]
  46. Parrinello, M.; Rahman, A. Polymorphic transitions in single crystals: A new molecular dynamics method. J. Appl. Phys. 1981, 52, 7182. [Google Scholar] [CrossRef]
  47. Allen, M.P.; Tildesley, D.J. Computer Simulation of Liquids; Oxford University Press: New York, NY, USA, 1989. [Google Scholar]
  48. Dai, Y.; Li, J.H.; Che, X.L. Glass formation region of the Ni-Nb-Ta ternary metal system determined directly from n-body potential through molecular dynamics simulations. J. Mater. Res. 2009, 24, 1815–1819. [Google Scholar] [CrossRef]
  49. Dai, Y.; Li, J.H.; Liu, B.X. First-principles molecular dynamics simulations to study the crystal-to-amorphous transition in the Mg-Zn system. Intermetallics 2012, 29, 75–79. [Google Scholar] [CrossRef]
  50. Din, S.U.; Chishti, S.Y. Synthesis and characterization of Al40Mg25Zn35 amorphous powder by rapid solidification. Powder Technol. 2001, 114, 51–54. [Google Scholar] [CrossRef]
  51. Niikura, A.; Tsai, A.P.; Nishiyama, N.; Inoue, A.; Masumoto, T. Amorphous and quasi-crystalline phases in rapidly solidified Mg-Al-Zn alloys. Mater. Sci. Eng. A 1994, 182, 1387–1391. [Google Scholar] [CrossRef]
  52. Richter, R.; Baxter, D.V.; Stromolsen, J.O. Quantum corrections to the conductivity in Mg-based metallic glasses. Phys. Rev. B 1988, 38, 10421. [Google Scholar] [CrossRef] [PubMed]
  53. Calka, A.; Polk, D.E.; Giessen, B.C.; Matyja, H.; Sande, J.V.; Madhava, M. A transition-metal-free amorphous alloy: Mg70Zn30. Scripta Metall. 1977, 11, 65–70. [Google Scholar] [CrossRef]
  54. Calka, A.; Radlinski, A.P. Amorphization of Mg-Zn alloys by mechanical alloying. Mater. Sci. Eng. A 1989, 11, 131–135. [Google Scholar] [CrossRef]
  55. Calka, A. The room-temperature stability of amorphous Mg-Zn alloys. J Phys. F Met. Phys. 1986, 16, 1577. [Google Scholar] [CrossRef]
  56. Richter, R.; Baxter, D.V.; Stromolsen, J.O. Quantum corrections to the conductivity in Mg70Cu30-0Au0, Mg70Cu30-1Au1, Mg70Cu30-3Au3, Mg70Cu30-9Au9 and Mg70Zn30-0Au0, Mg70Zn30-3Au3. Mater. Sci. Eng. 1988, 99, 183. [Google Scholar] [CrossRef]
  57. Gorsse, S.; Orveillon, G.; Senkov, O.N.; Miracle, D.B. Thermodynamic analysis of glass-forming ability in a Ca-Mg-Zn ternary alloy system. Phys. Rev. B 2006, 73, 224202. [Google Scholar] [CrossRef] [Green Version]
  58. Lide, D.R.; Bruno, T.J. CRC Handbook of Chemistry and Physics; CRC Press: Boca Raton, FL, USA, 2012. [Google Scholar]
  59. Dai, X.D.; Li, J.H.; Liu, B.X. Molecular statics calculation of the formation enthalpy for ternary metal systems based on the long-range empirical interatomic potentials. Appl. Phys. Lett. 2007, 90, 131904. [Google Scholar] [CrossRef]
  60. Finney, J.L. Random packings and the structure of simple liquids. The geometry of random close packing. Proc. R. Soc. Lond. Ser. A 1970, 319, 479–493. [Google Scholar]
  61. Cheng, Y.Q.; Ma, E.; Sheng, H.W. Atomic level structure in multicomponent bulk metallic glass. Phys. Rev. Lett. 2009, 102, 245501. [Google Scholar] [CrossRef] [PubMed]
  62. Li, J.H.; Zhao, S.Z.; Dai, Y.; Cui, Y.Y.; Liu, B.X. Formation and structure of Al-Zr metallic glasses studied by Monte Carlo simulations. J. Appl. Phys. 2011, 109, 113538. [Google Scholar] [CrossRef]
  63. Sheng, H.W.; Luo, W.K.; Alamgir, F.M.; Bai, J.M.; Ma, E. Atomic packing and short-to-medium-range order in metallic glasses. Nature 2006, 439, 419–425. [Google Scholar] [CrossRef]
  64. Wu, S.Q.; Wang, C.Z.; Hao, S.G.; Zhu, Z.Z.; Ho, K.M. Energetics of local clusters in Cu64.5Zr35.5 metallic liquid and glass. Appl. Phys. Lett. 2010, 97, 21901. [Google Scholar] [CrossRef]
  65. Guan, P.F.; Fujita, T.; Hirata, A.; Liu, Y.H.; Chen, M.W. Structural origins of the excellent glass forming ability of Pd40Ni40P20. Phys. Rev. Lett. 2012, 108, 175501. [Google Scholar] [CrossRef] [PubMed]
  66. Zemp, J.; Celino, M.; Schonfeld, B.; Loeffler, J.F. Icosahedral superclusters in Cu64Zr36 metallic glass. Phys. Rev. B Condens. Matter Mater. Phys. 2014, 90, 144108. [Google Scholar] [CrossRef]
Figure 1. The total energies (red dash line), pair terms (green solid line), and n-body parts (blue solid line) variation with lattice constants calculated using the rose equation (black solid line), and the TB-SMA potential for compounds of AlZn, AlZn3, Al3Zn, MgZn, MgZn2, and Mg3Zn.
Materials 15 02062 g001
Figure 2. The atomic position projections and the total pair-correlation functions, g ( r ) , (a,b) the crystalline structure (Al40Mg15Zn45); (c,d), the amorphous phase (Al40Mg25Zn35). Red, green, and blue circles represent Al, Mg, and Zn atoms, respectively.
Materials 15 02062 g002
Figure 3. The glass formation stoichiometry diagram obtained from MD simulations at 300 K for the Al-Mg-Zn system.
Materials 15 02062 g003
Figure 4. The distribution diagram of the amorphization driving force derived from the MC and MD simulations for the ternary Al-Mg-Zn system.
Materials 15 02062 g004
Figure 5. The partial and total CNs distribution of the MD-derived metallic glasses: (a) Al35Mg35Zn30, (b) Al25Mg25Zn50, (c) Al15Mg15Zn70. The spectrum of the most frequent Voronoi clusters in the MD-derived metallic glasses: (d) Al35Mg35Zn30, (e) Al25Mg25Zn50, (f) Al15Mg15Zn70.
Materials 15 02062 g005
Figure 6. The variations in the fractions of the prevailing local clusters for (Al50Mg50)100−xZnx (x = 30, 50, and 70 at.%) MGs.
Materials 15 02062 g006
Figure 7. The distribution of FIs and their networking in the simulated cells for the Al35Mg35Zn30 and Al25Mg25Zn50 metallic glasses. For clarity, only the front half of the icosahedral network is shown in both (a,b).
Materials 15 02062 g007
Figure 8. The variations in (a) the population, and (b) the corresponding fractions of different icosahedra with various bond numbers in Al35Mg35Zn30 and Al25Mg25Zn50.
Materials 15 02062 g008
Figure 9. The hierarchical atomic structures for Al35Mg35Zn30: (a) The coordination mode in the local SRO is displayed by a typical Al-centered icosahedra <0,0,12,0>. (b) The packing mode in the MRO is characterized by a super-cluster formed among 7 neighboring FIs; each FI is highlighted with a dashed circle. The Al, Mg, and Zn atoms are colored green, red, and gray, respectively. (c) As for the extended scale, only the center atom of each FI is plotted as a point, and the connection mode of the structural skeleton is exhibited by a cross-linked patch containing 52 FIs. The six colors correspond to various bond numbers.
Materials 15 02062 g009
Table 1. The potential parameters for the Al-Mg-Zn system.
Potential ParametersAl-AlMg-MgZn-ZnAl-MgAl-ZnMg-Zn
p18.77646010.37307012.36512610.2382847.9068919.350041
A1 (10−19 J)0.4021840.1457800.1229400.1907120.5183580.436637
rm1 (Å)2.7643943.5223082.2875062.6544302.6678922.590032
n1444444
p1m2.5585583.8508435.4325863.4476991.3286613.962105
A1m (10−19 J)2.9172120.5385353.5726683.4571610.5058612.898628
rc1 (Å)4.6070235.4870153.8752544.4210715.3753734.800655
p25.2494664.3750616.4037493.4398226.3590769.050849
A2 (10−38 J2)4.7381550.9518870.6009211.8908993.5585401.873409
rm2 (Å)3.7868742.5885163.8911202.6360214.3309743.521581
n2555555
p2m0.0004770.0003780.0003890.0004390.0002860.000486
A2m (10−38 J2)1.1140671.1303930.1460810.4416380.3763326.968794
rc2 (Å)6.5153246.2500006.0398216.9960066.5389815.166639
r0 (Å)2.8643213.2035672.7517822.9991312.8080512.977674
Table 2. The physical properties (bulk modulus (B0, Mbar), elastic constants (Cij, Mbar), cohesive energies (Ec, eV), and lattice constants (a, c (Å)) of hcp-Zn, fcc-Zn, and bcc-Zn, fitted using the potential and obtained from experiments [39,40] or ab initio calculations.
Physical Propertieshcp-Znfcc-Znbcc-Zn
FittedExperimentsFittedAb InitioFittedAb Initio
a or a, c (Å)2.651, 4.6142.665, 4.9473.8913.9323.0983.135
Ec (eV/atom)1.3481.3501.3301.3251.3171.264
C11 (Mbar)1.631.771.0861.1060.3110.365
C12 (Mbar)0.4280.3480.5040.5220.8510.813
C13 (Mbar)0.4520.528
C33 (Mbar)0.4030.685
C44 (Mbar)0.3250.4590.0120.0050.1070.127
B0 (Mbar)0.7030.7000.6980.7170.6710.664
Table 3. The physical properties of the Al-Zn intermetallic compounds fitted using the potential and calculated from ab initio.
Physical PropertiesB2-AlZnL12-AlZn3L12-Al3Zn
FittedAb InitioFittedAb InitioFittedAb Initio
a (Å)3.2013.1963.9523.9654.0614.022
Ec (eV/atom)2.2492.3961.9342.0002.8512.846
C11 (Mbar)0.5640.4071.1861.3540.9151.048
C12 (Mbar)0.7280.7670.5010.4370.5970.617
C44 (Mbar)0.2350.2160.1050.0230.2410.257
B0 (Mbar)0.6730.6470.7290.7430.7030.761
Table 4. The physical properties of the Mg-Zn intermetallic compounds fitted using the potential (first line) and obtained from experiments or ab initio calculations (second line).
Physical PropertiesMgZnMgZn3Mg3ZnMgZn2
B2L12L12C14
a or a, c (Å)3.4404.1424.4295.3066, 8.2746
3.3064.0414.3315.2073, 8.5315
Ec (eV/atom)1.5081.4591.4931.522
1.5101.4381.4921.541
B0 (Mbar)0.5200.5920.4450.609
0.5010.5950.4130.653
Publisher’s Note: MDPI stays neutral with regard to jurisdictional claims in published maps and institutional affiliations.

