Author Contributions
Conceptualization, K.W.; methodology, X.Z. and C.L.; software, C.L. and N.Z.; validation, X.Z.; formal analysis, C.L.; investigation, N.Z. and N.Z.; resources, Z.S.; data curation, C.L.; writing—original draft preparation, C.L. and K.W.; writing—review and editing, K.W. and X.Z; visualization, N.Z.; supervision, Z.S.; project administration, Z.S.; funding acquisition, Z.S. All authors have read and agreed to the published version of the manuscript.
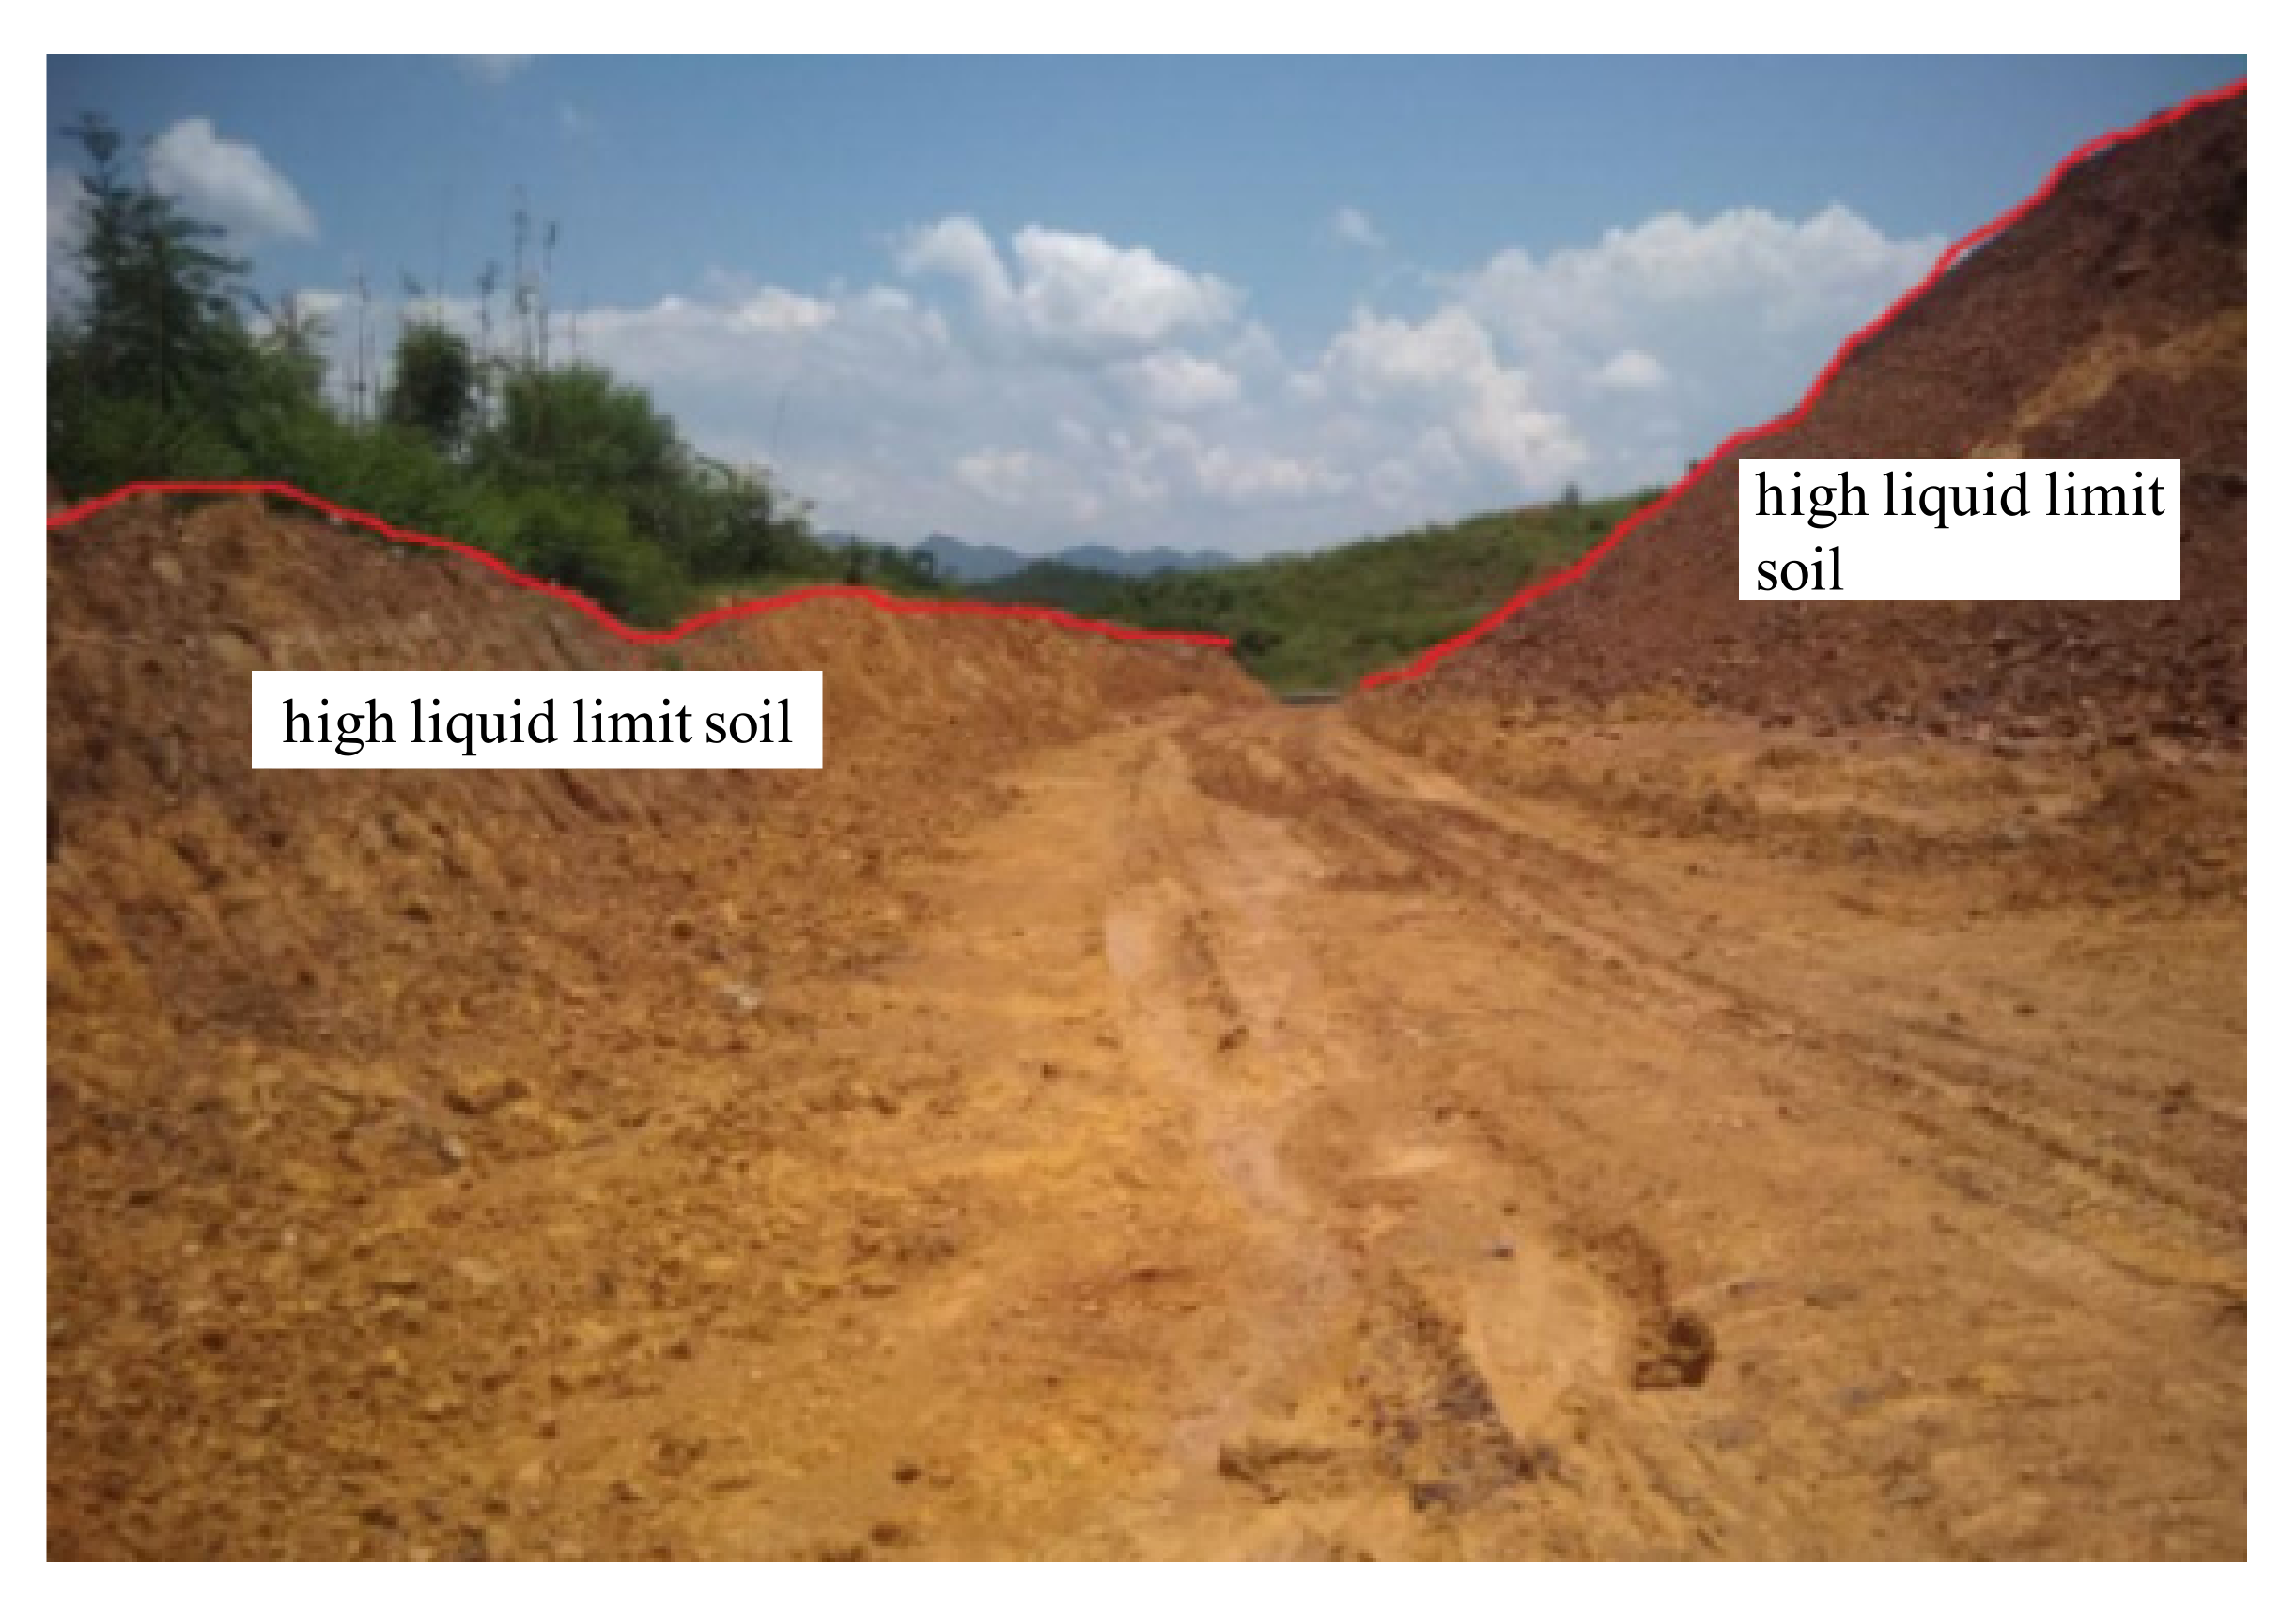
Figure 1.
High liquid limit soil in Liyu highway.
Figure 1.
High liquid limit soil in Liyu highway.
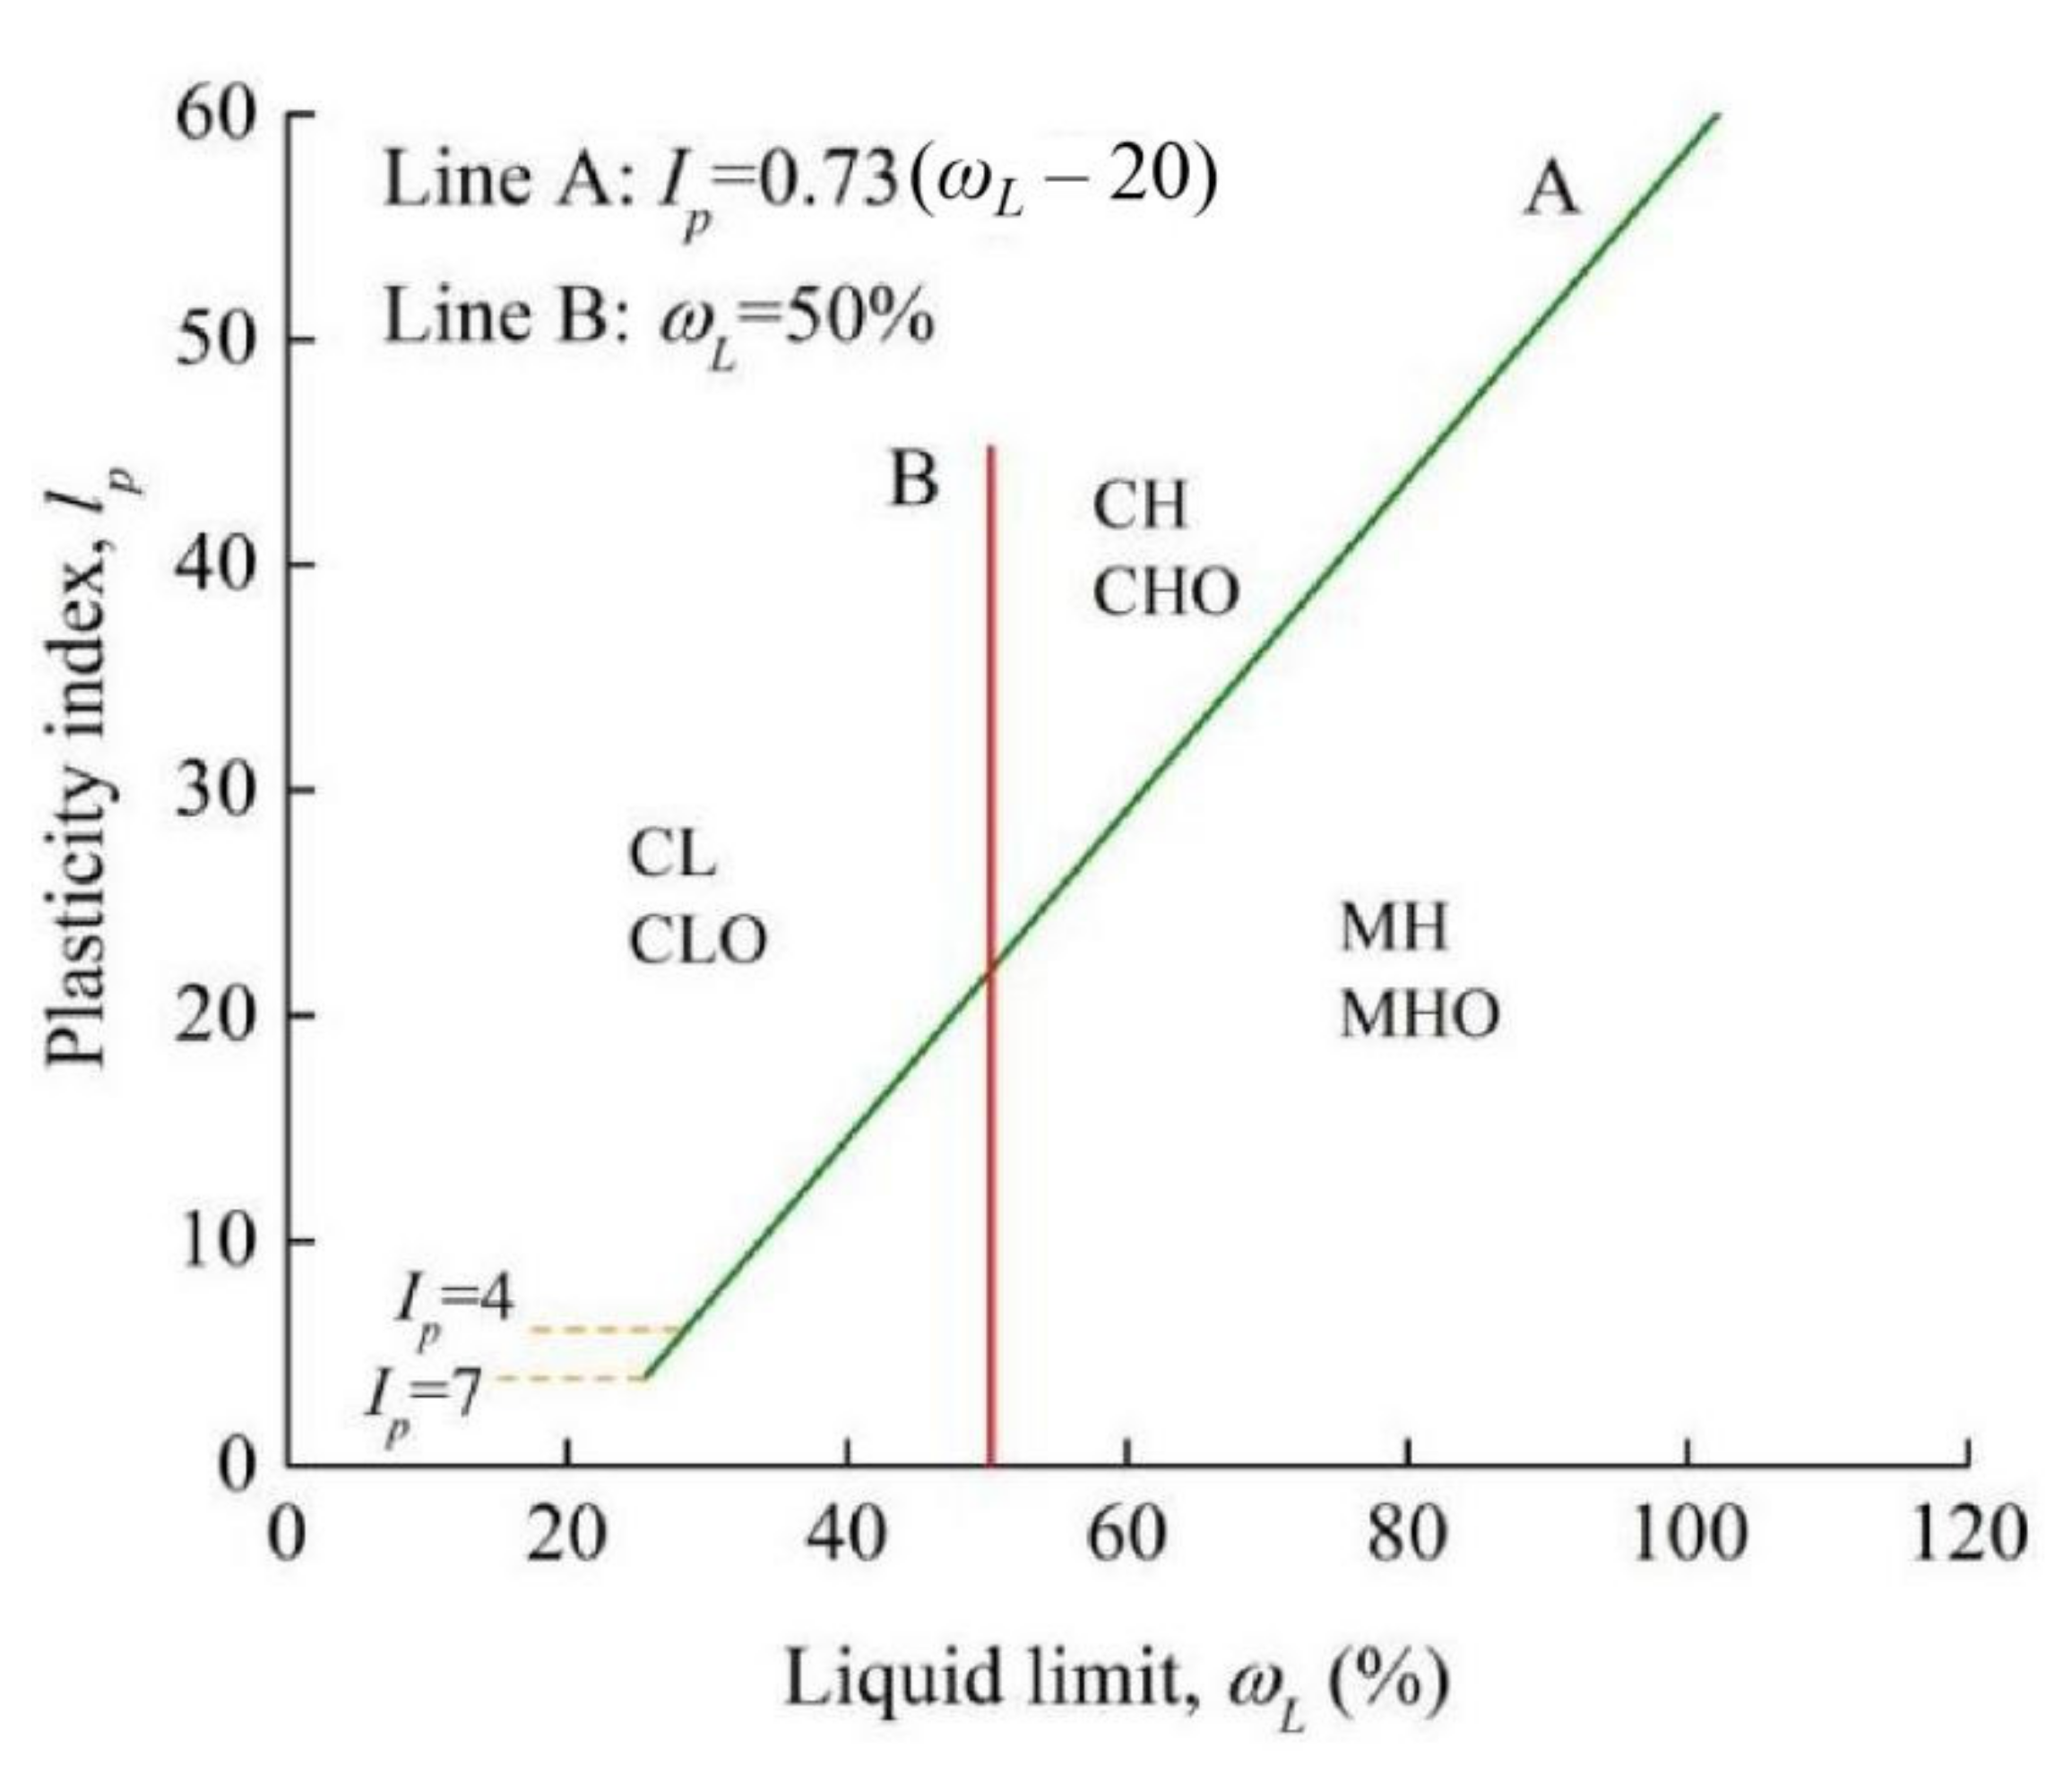
Figure 2.
Plasticity chart.
Figure 2.
Plasticity chart.
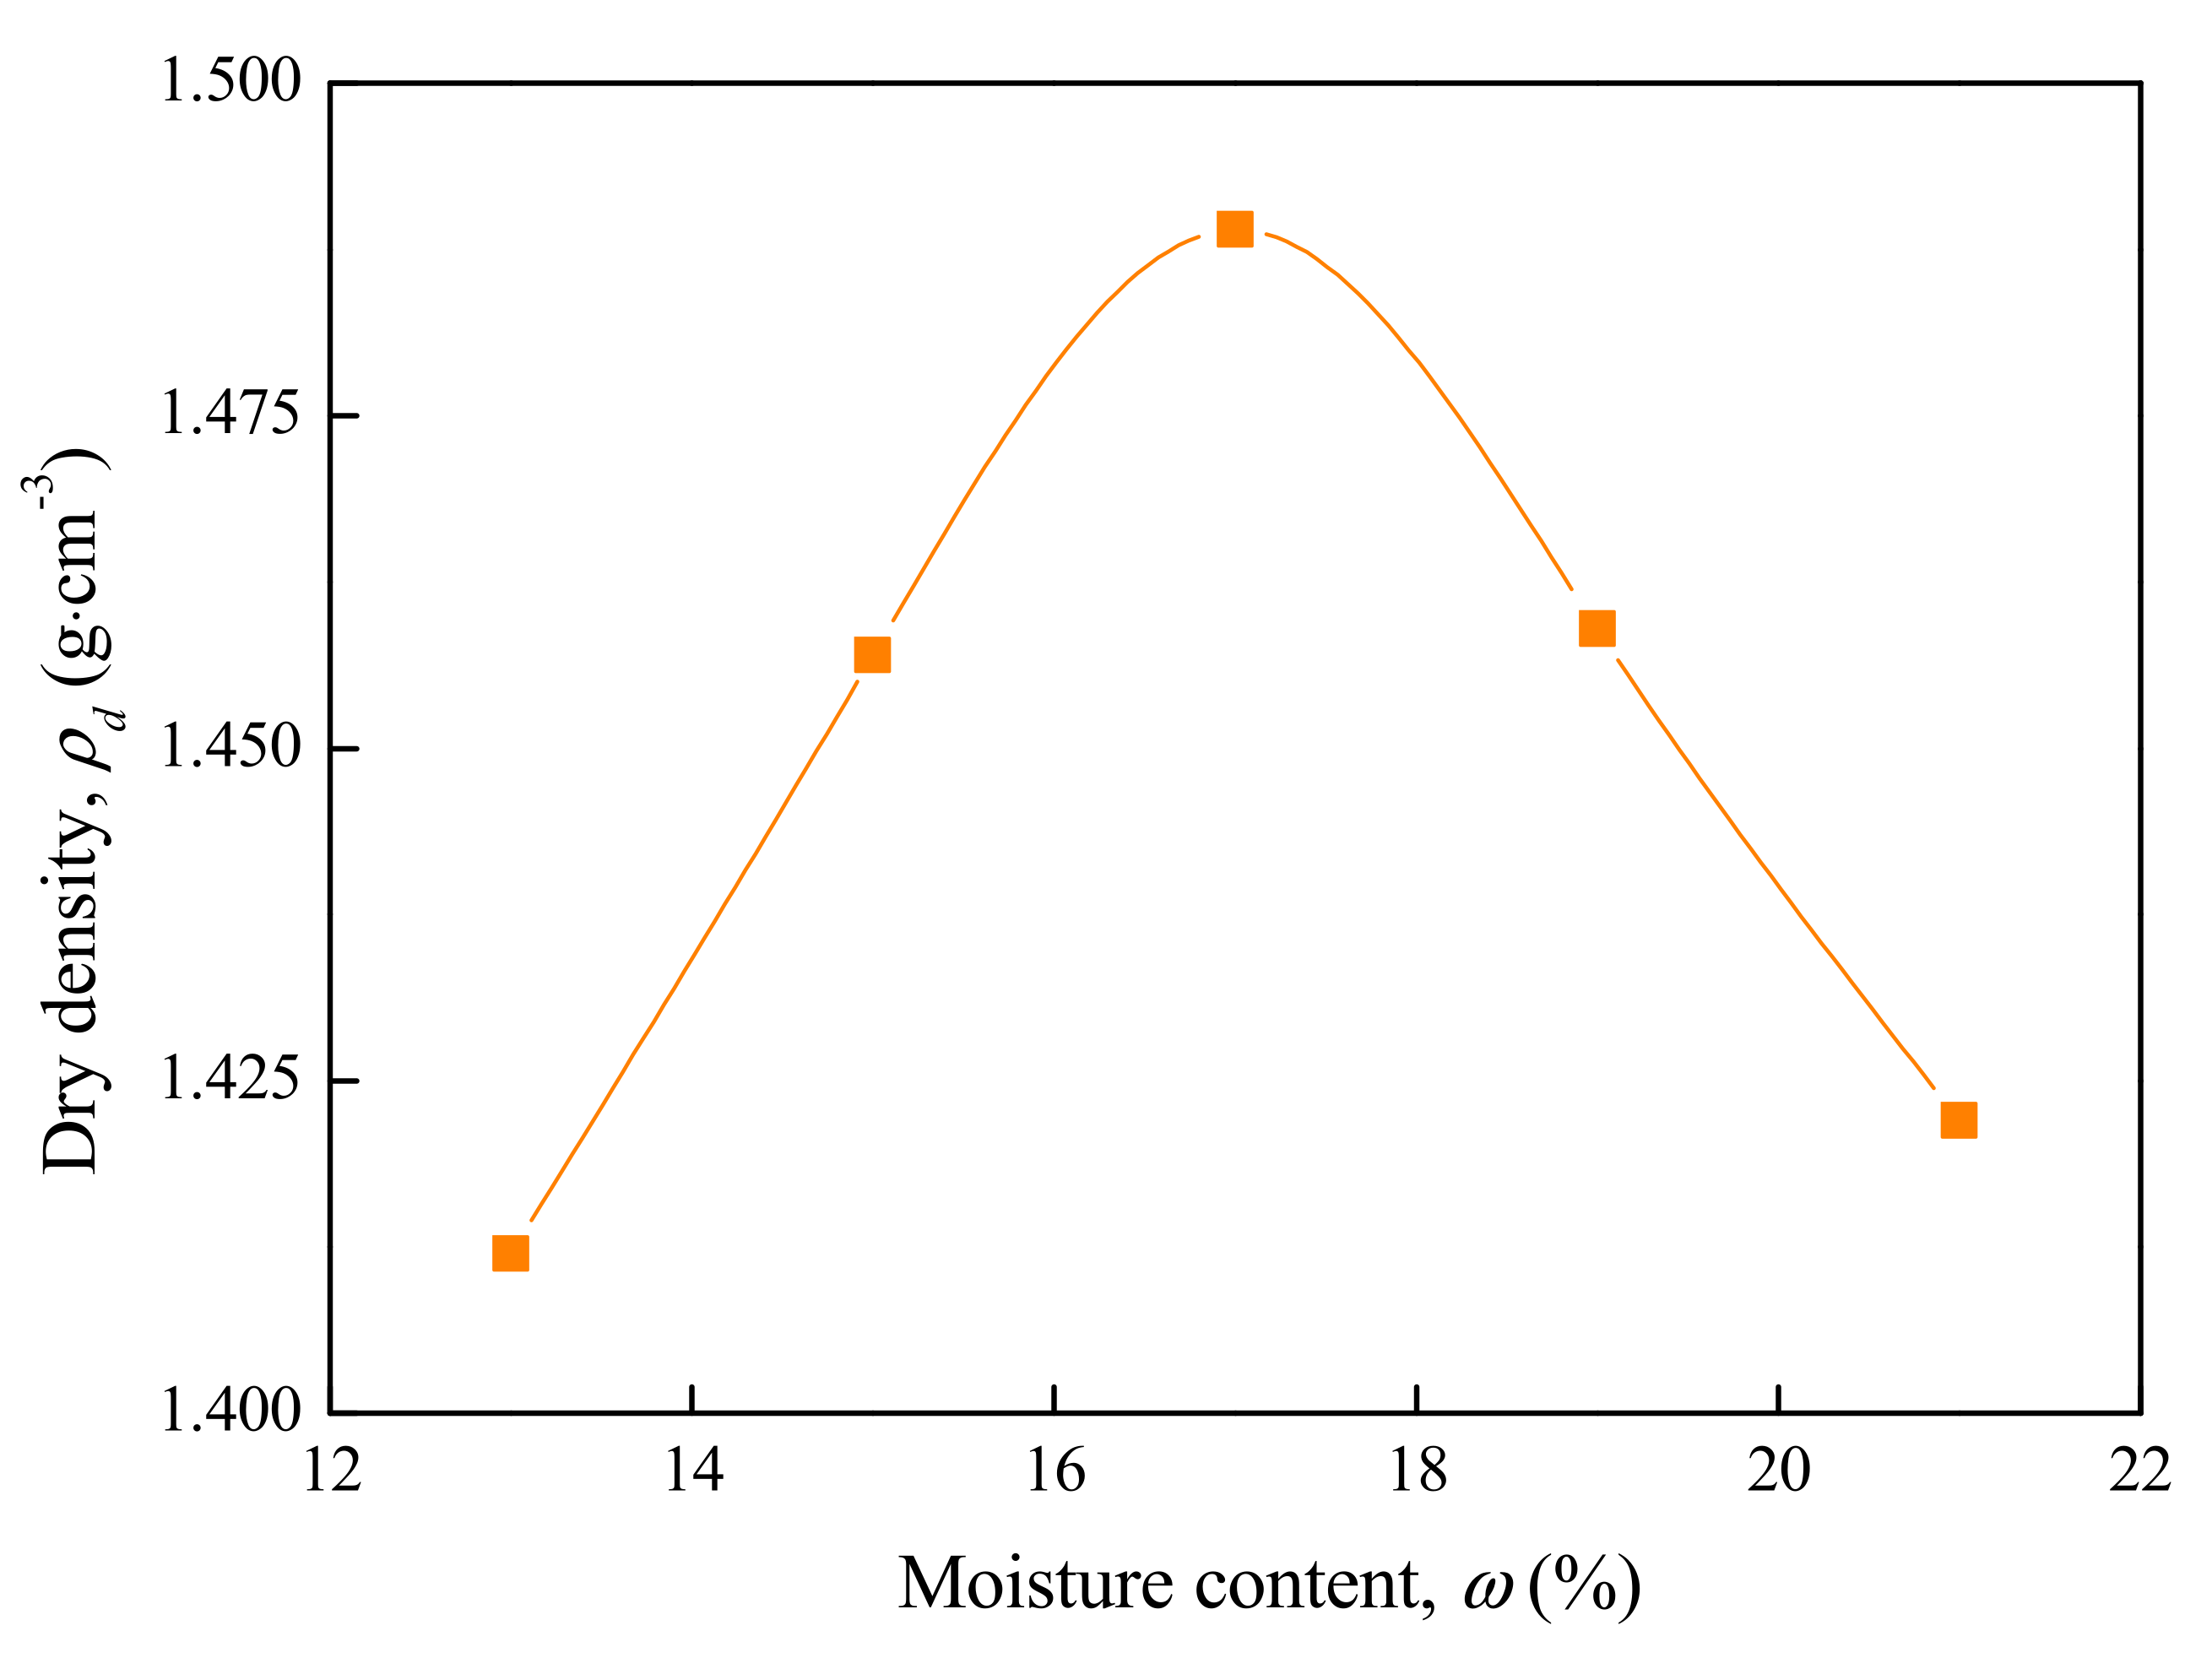
Figure 3.
Relationship between dry density and moisture content.
Figure 3.
Relationship between dry density and moisture content.
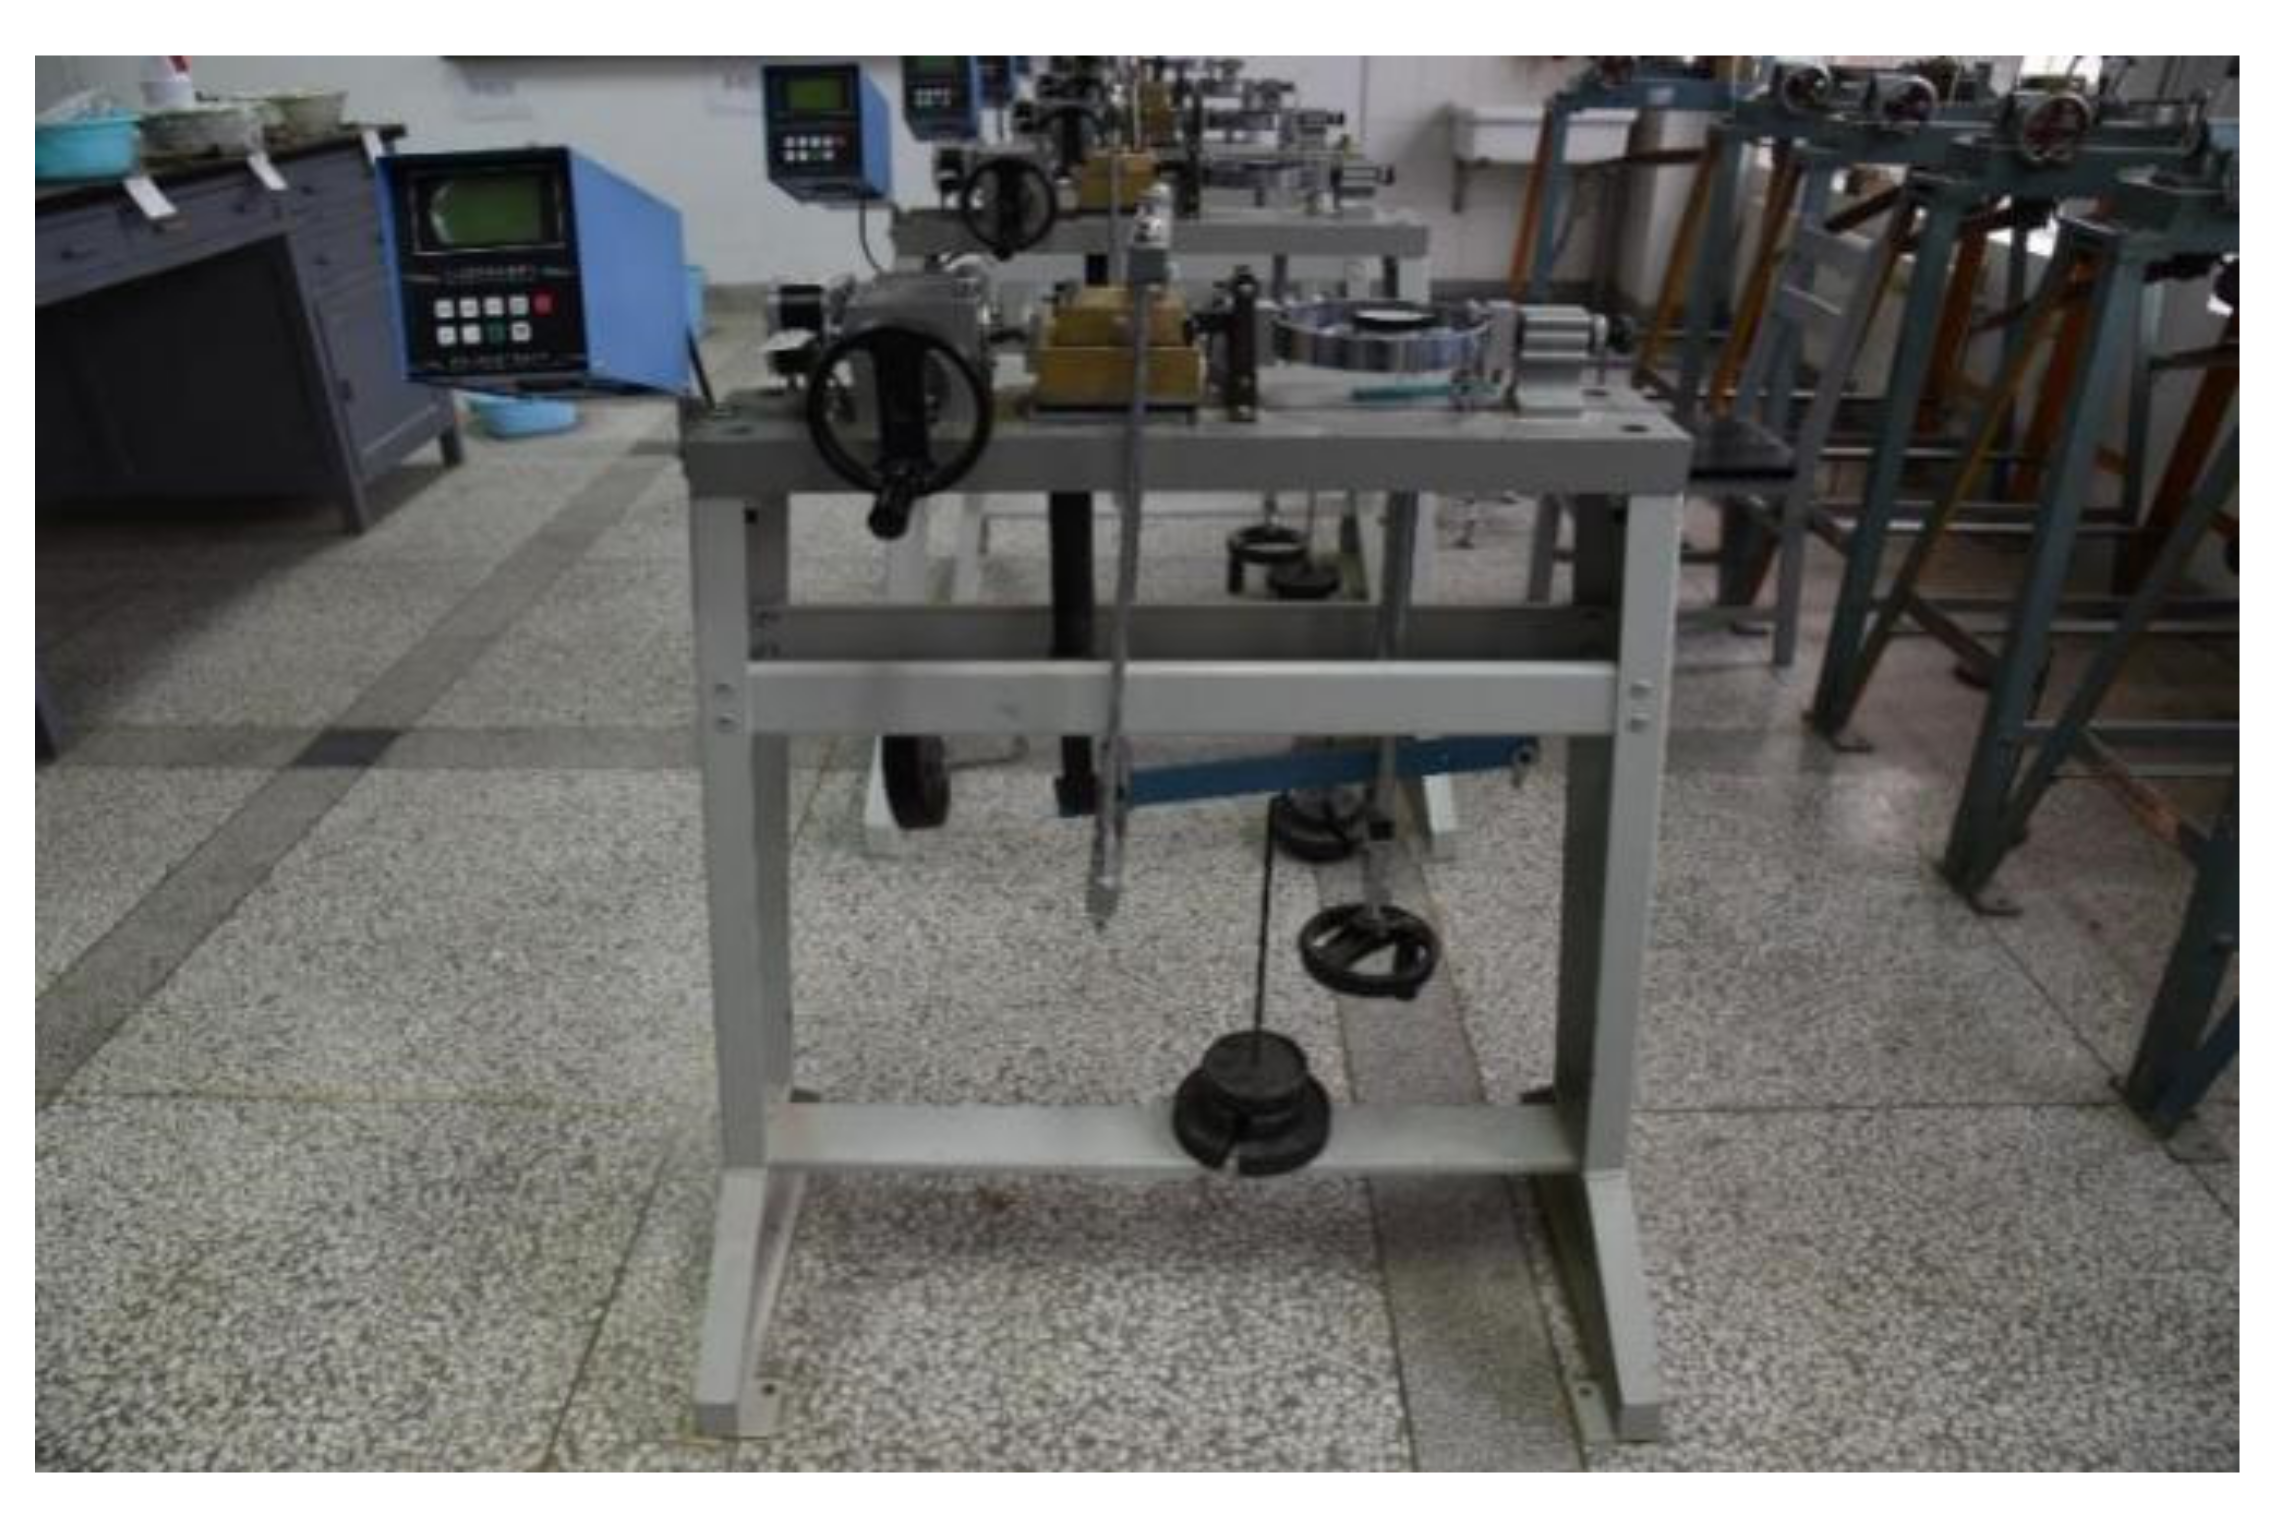
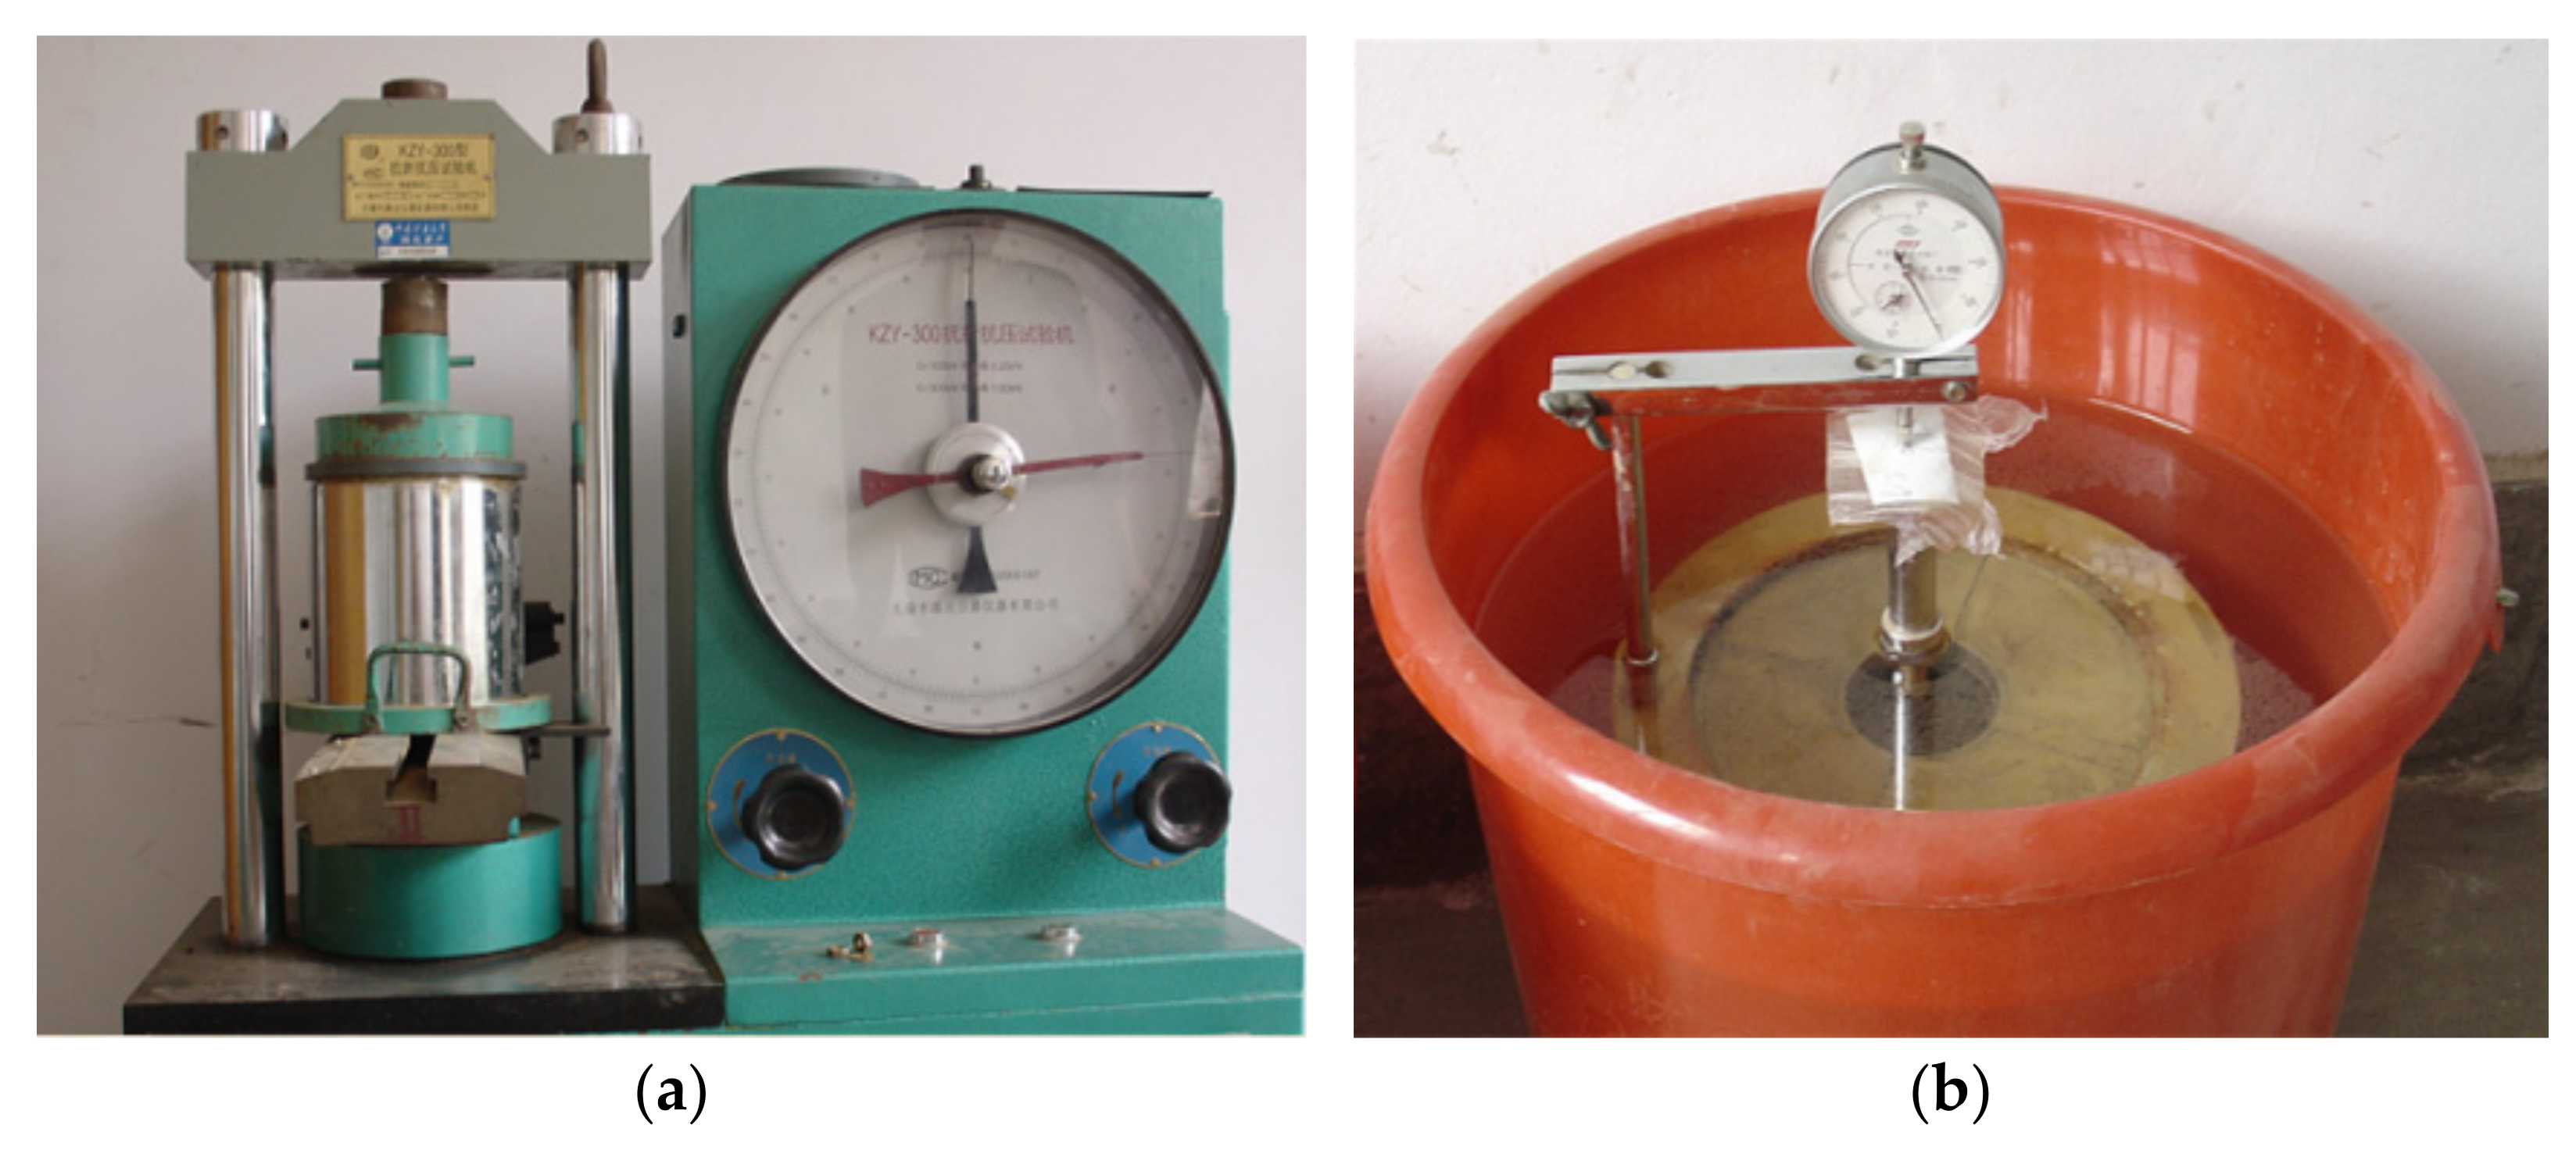
Figure 4.
Shear test system.
Figure 4.
Shear test system.
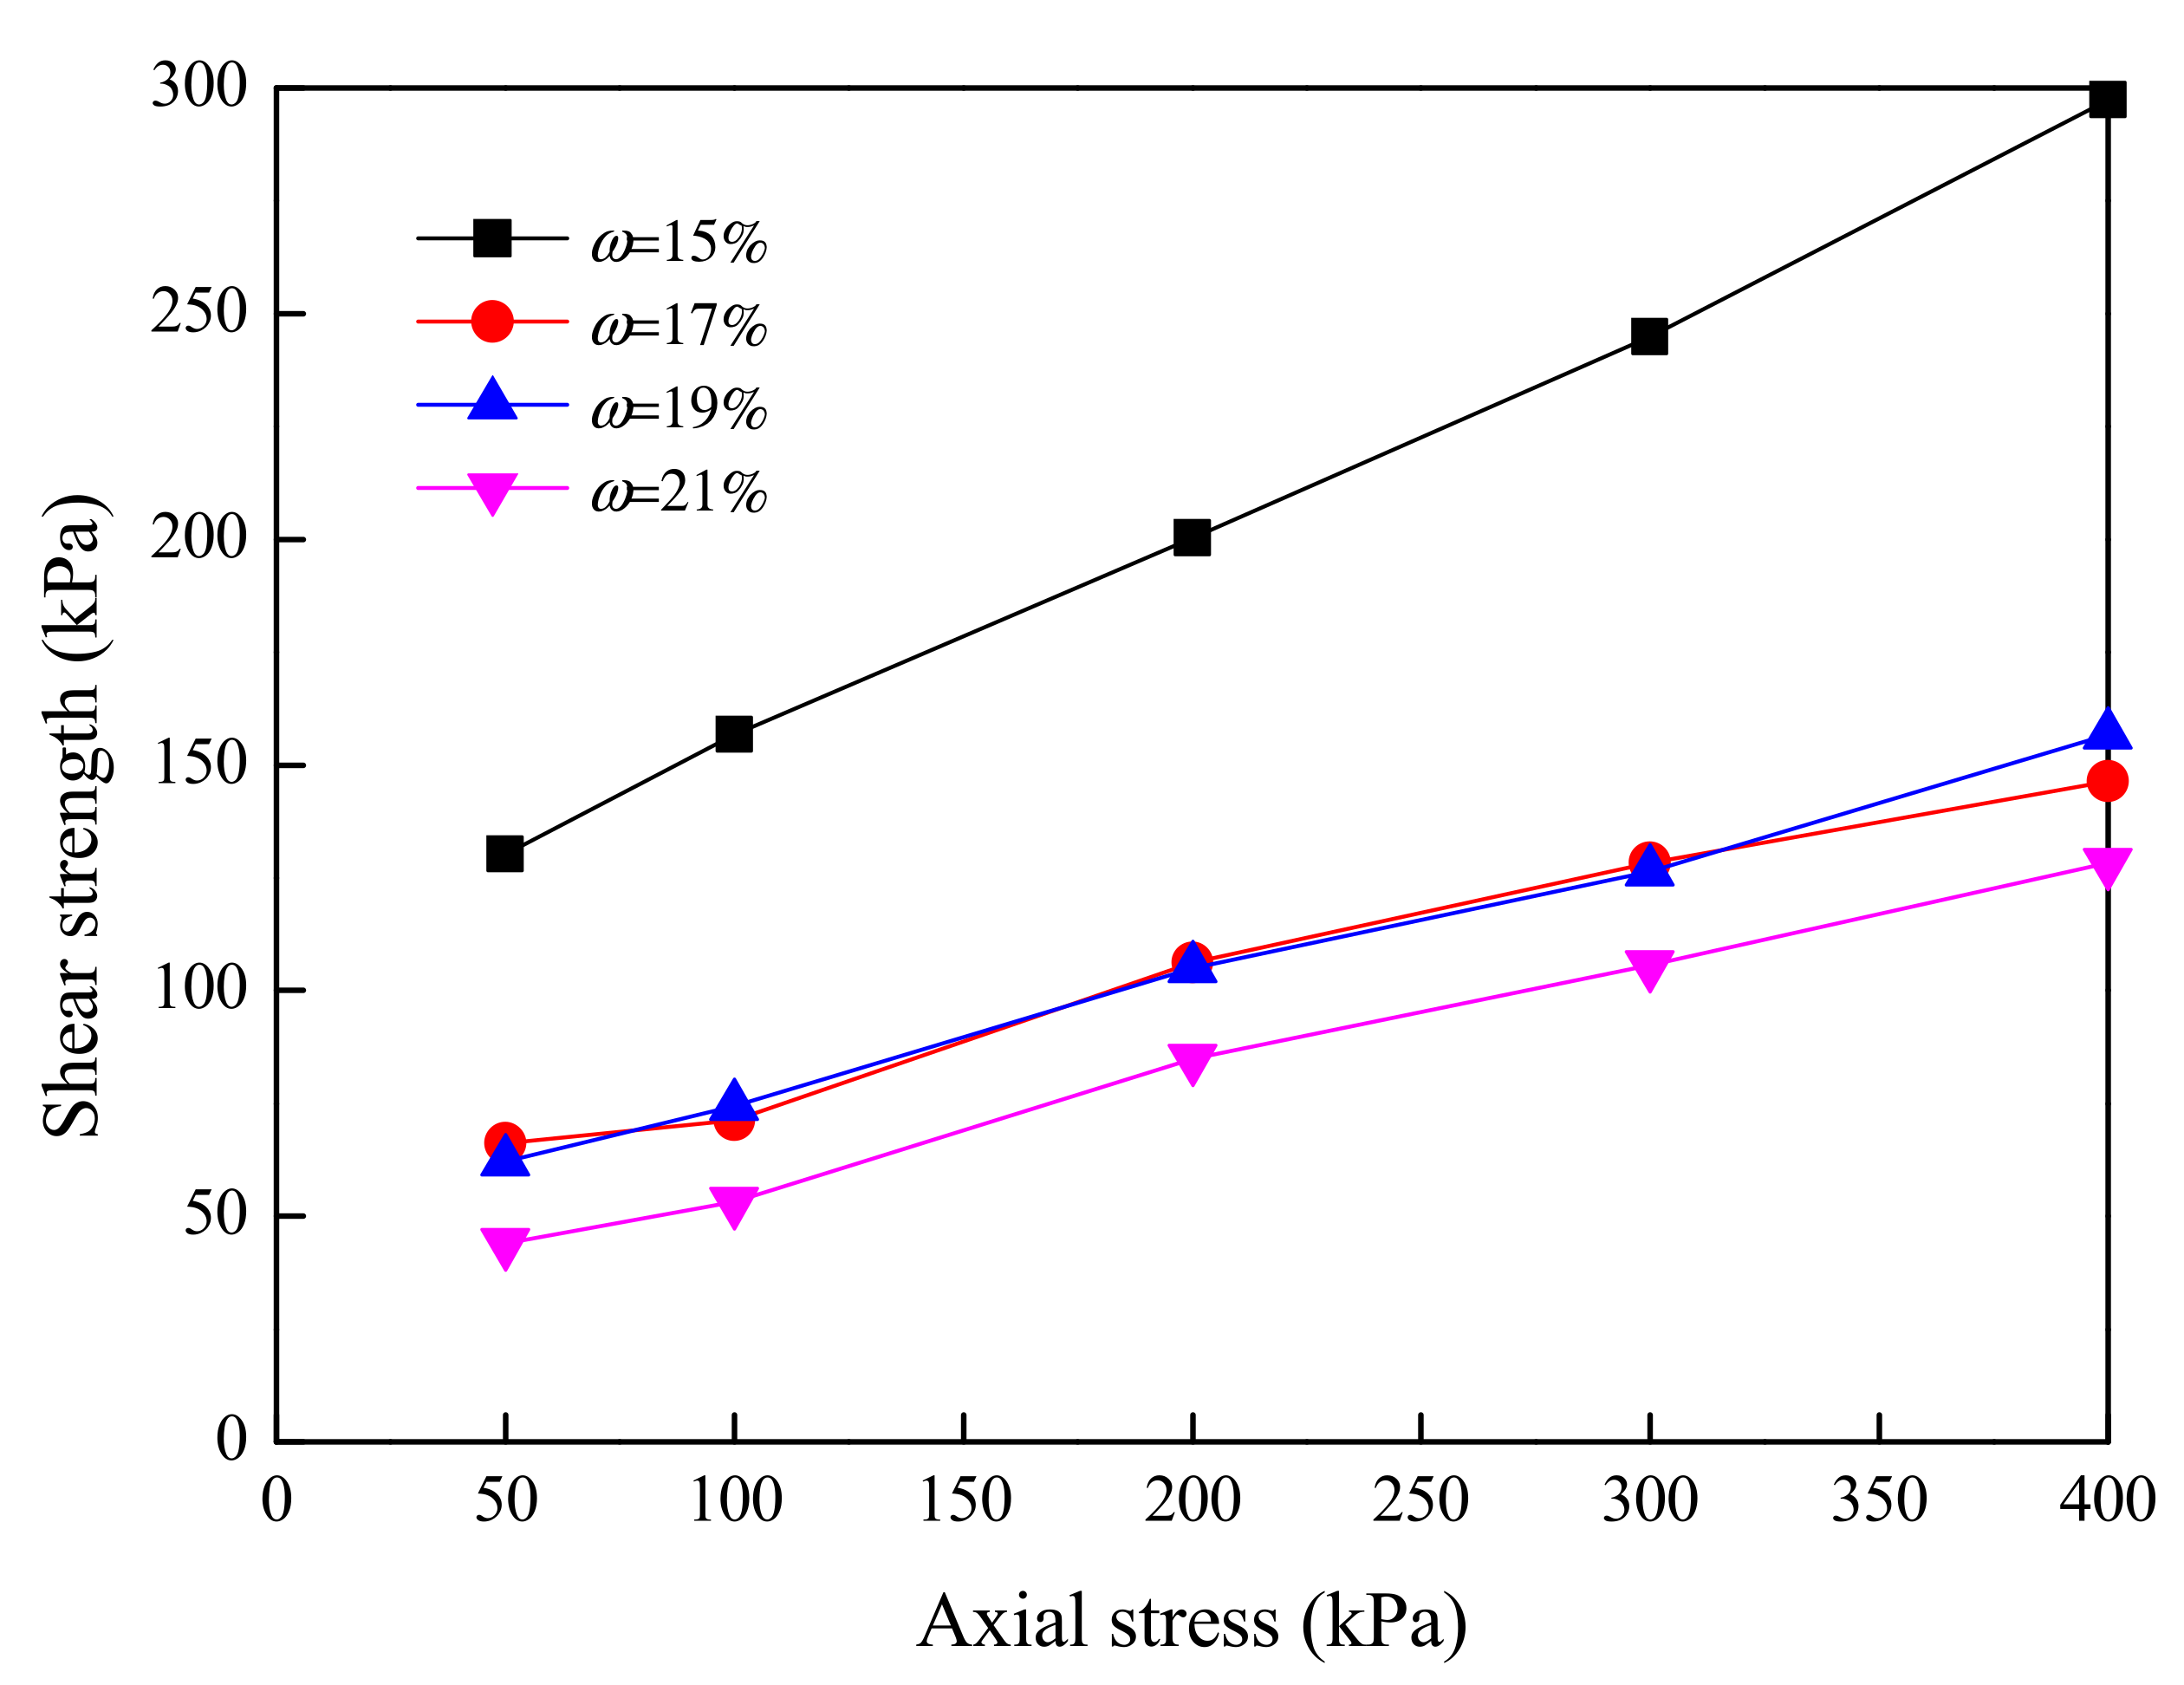
Figure 5.
Relationship between shear strength and axial load under the conditions of different moisture contents.
Figure 5.
Relationship between shear strength and axial load under the conditions of different moisture contents.
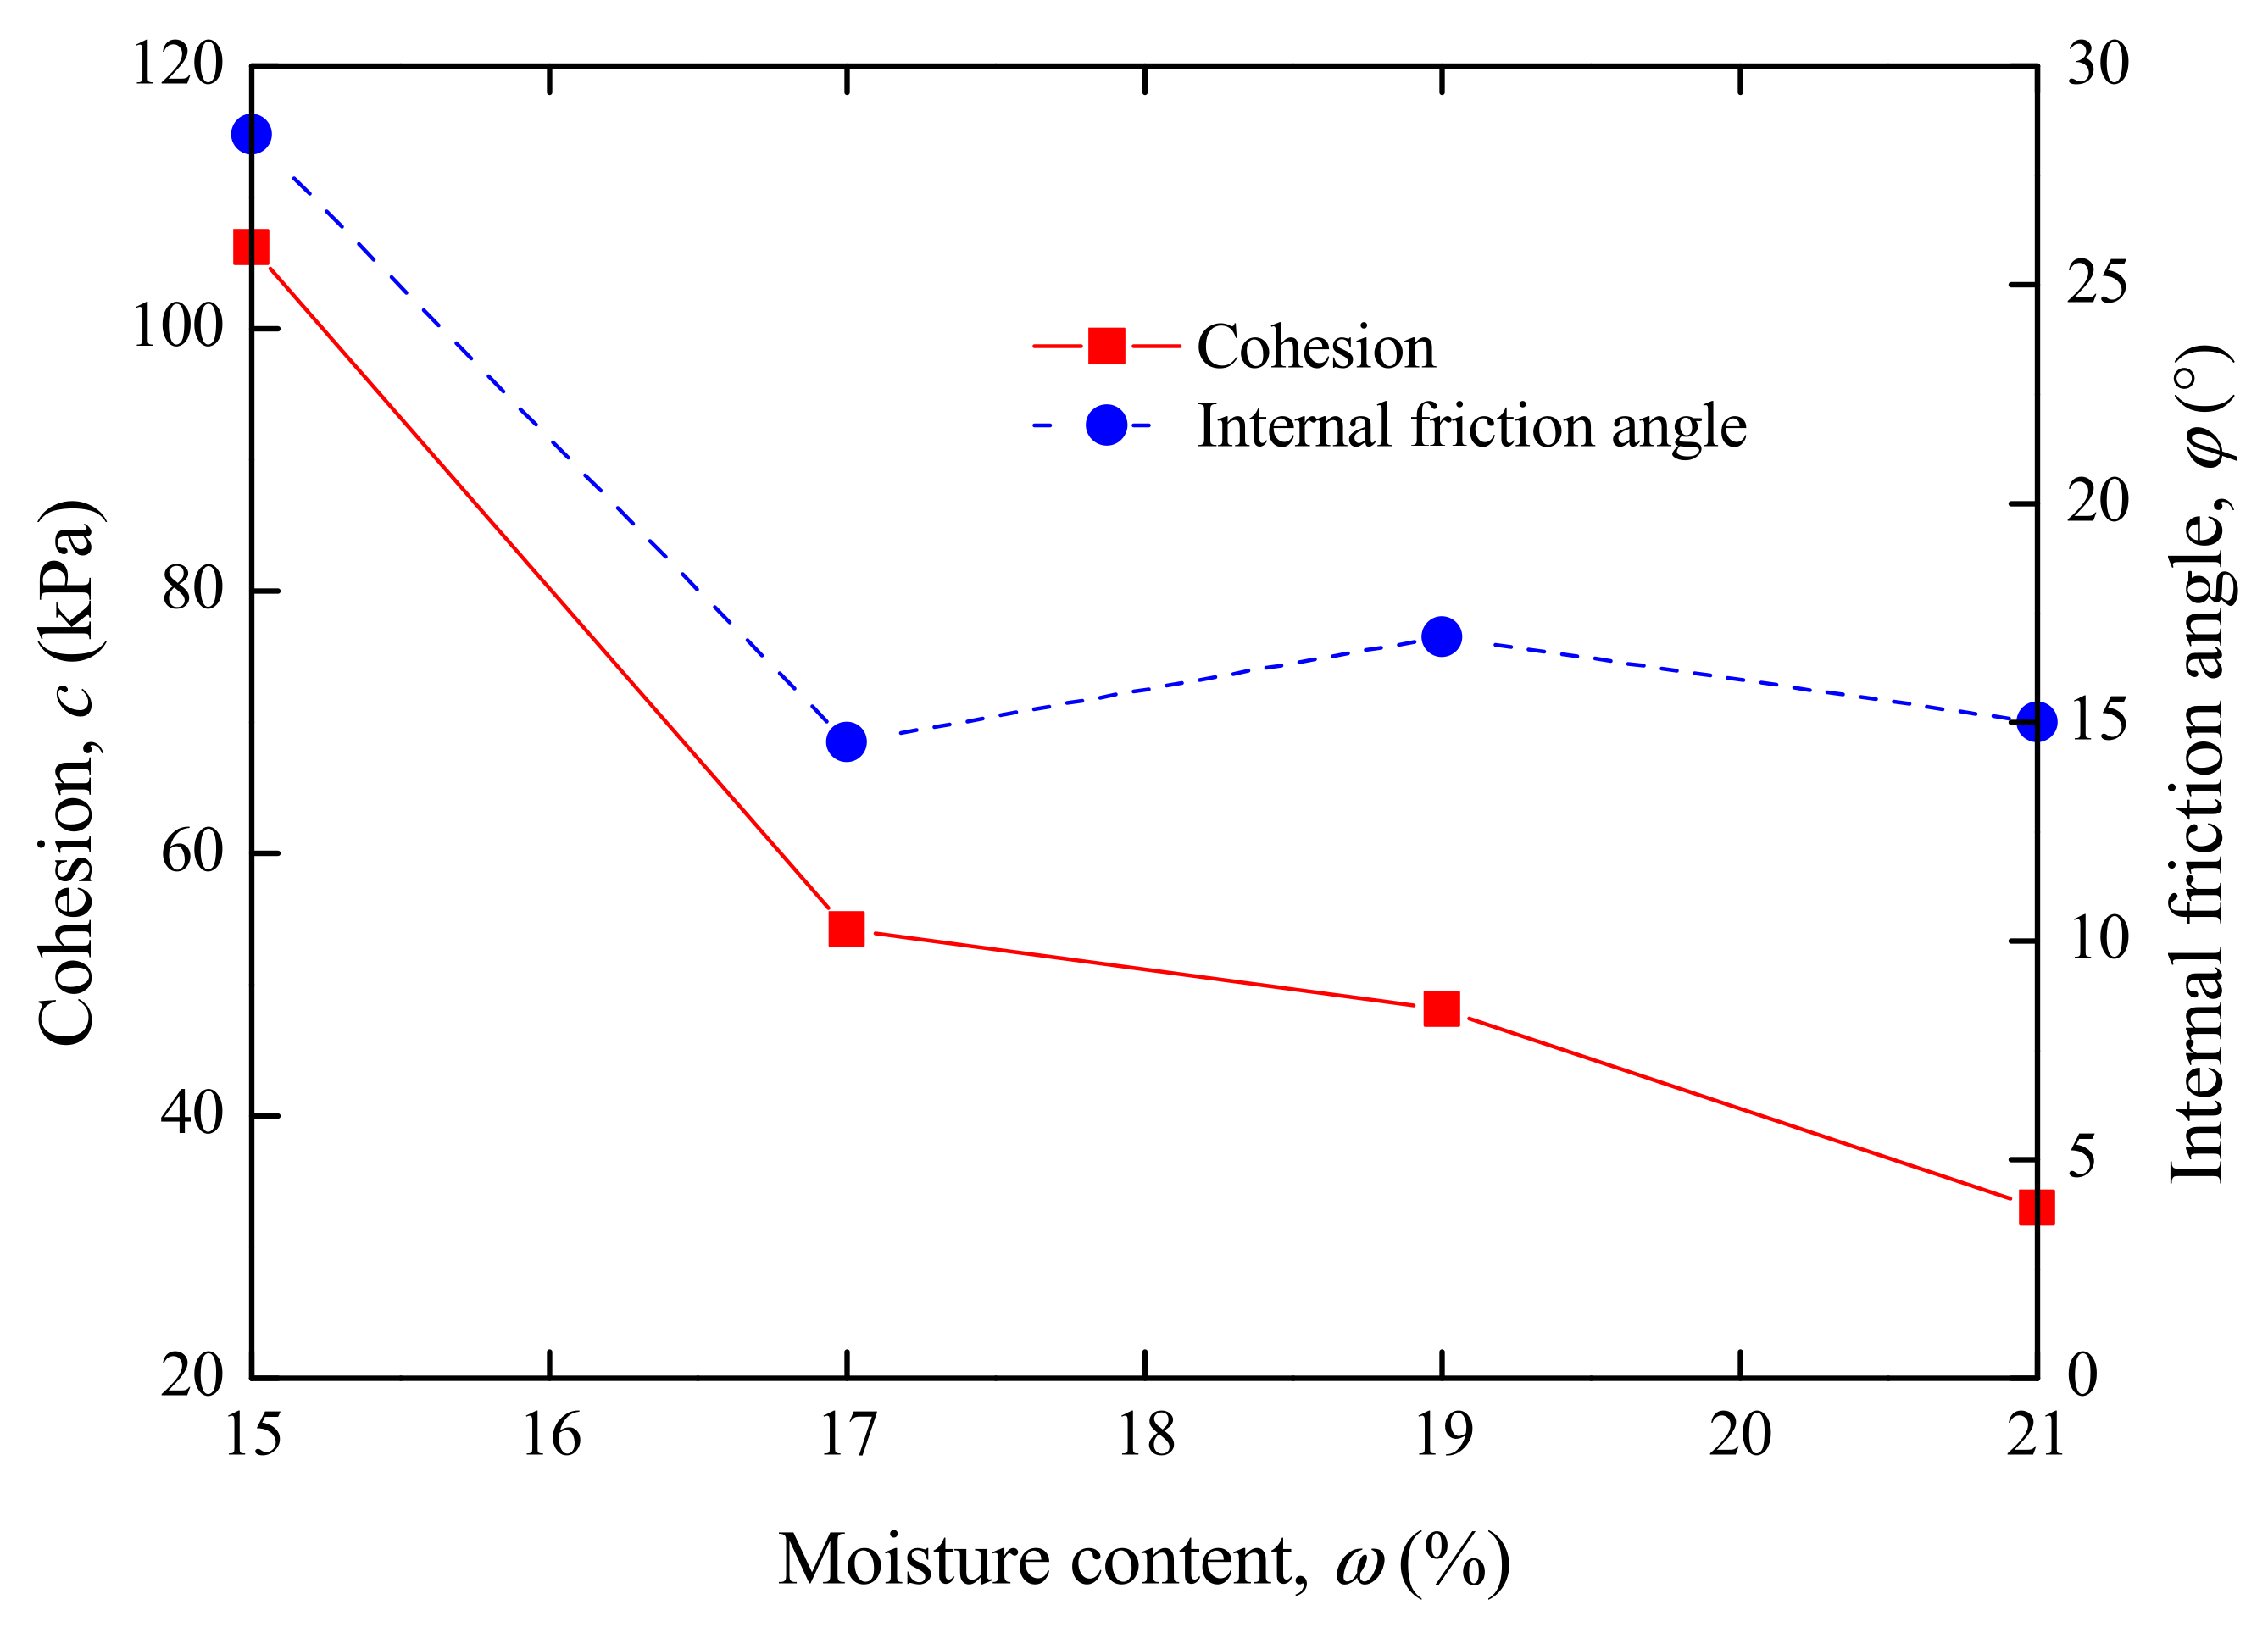
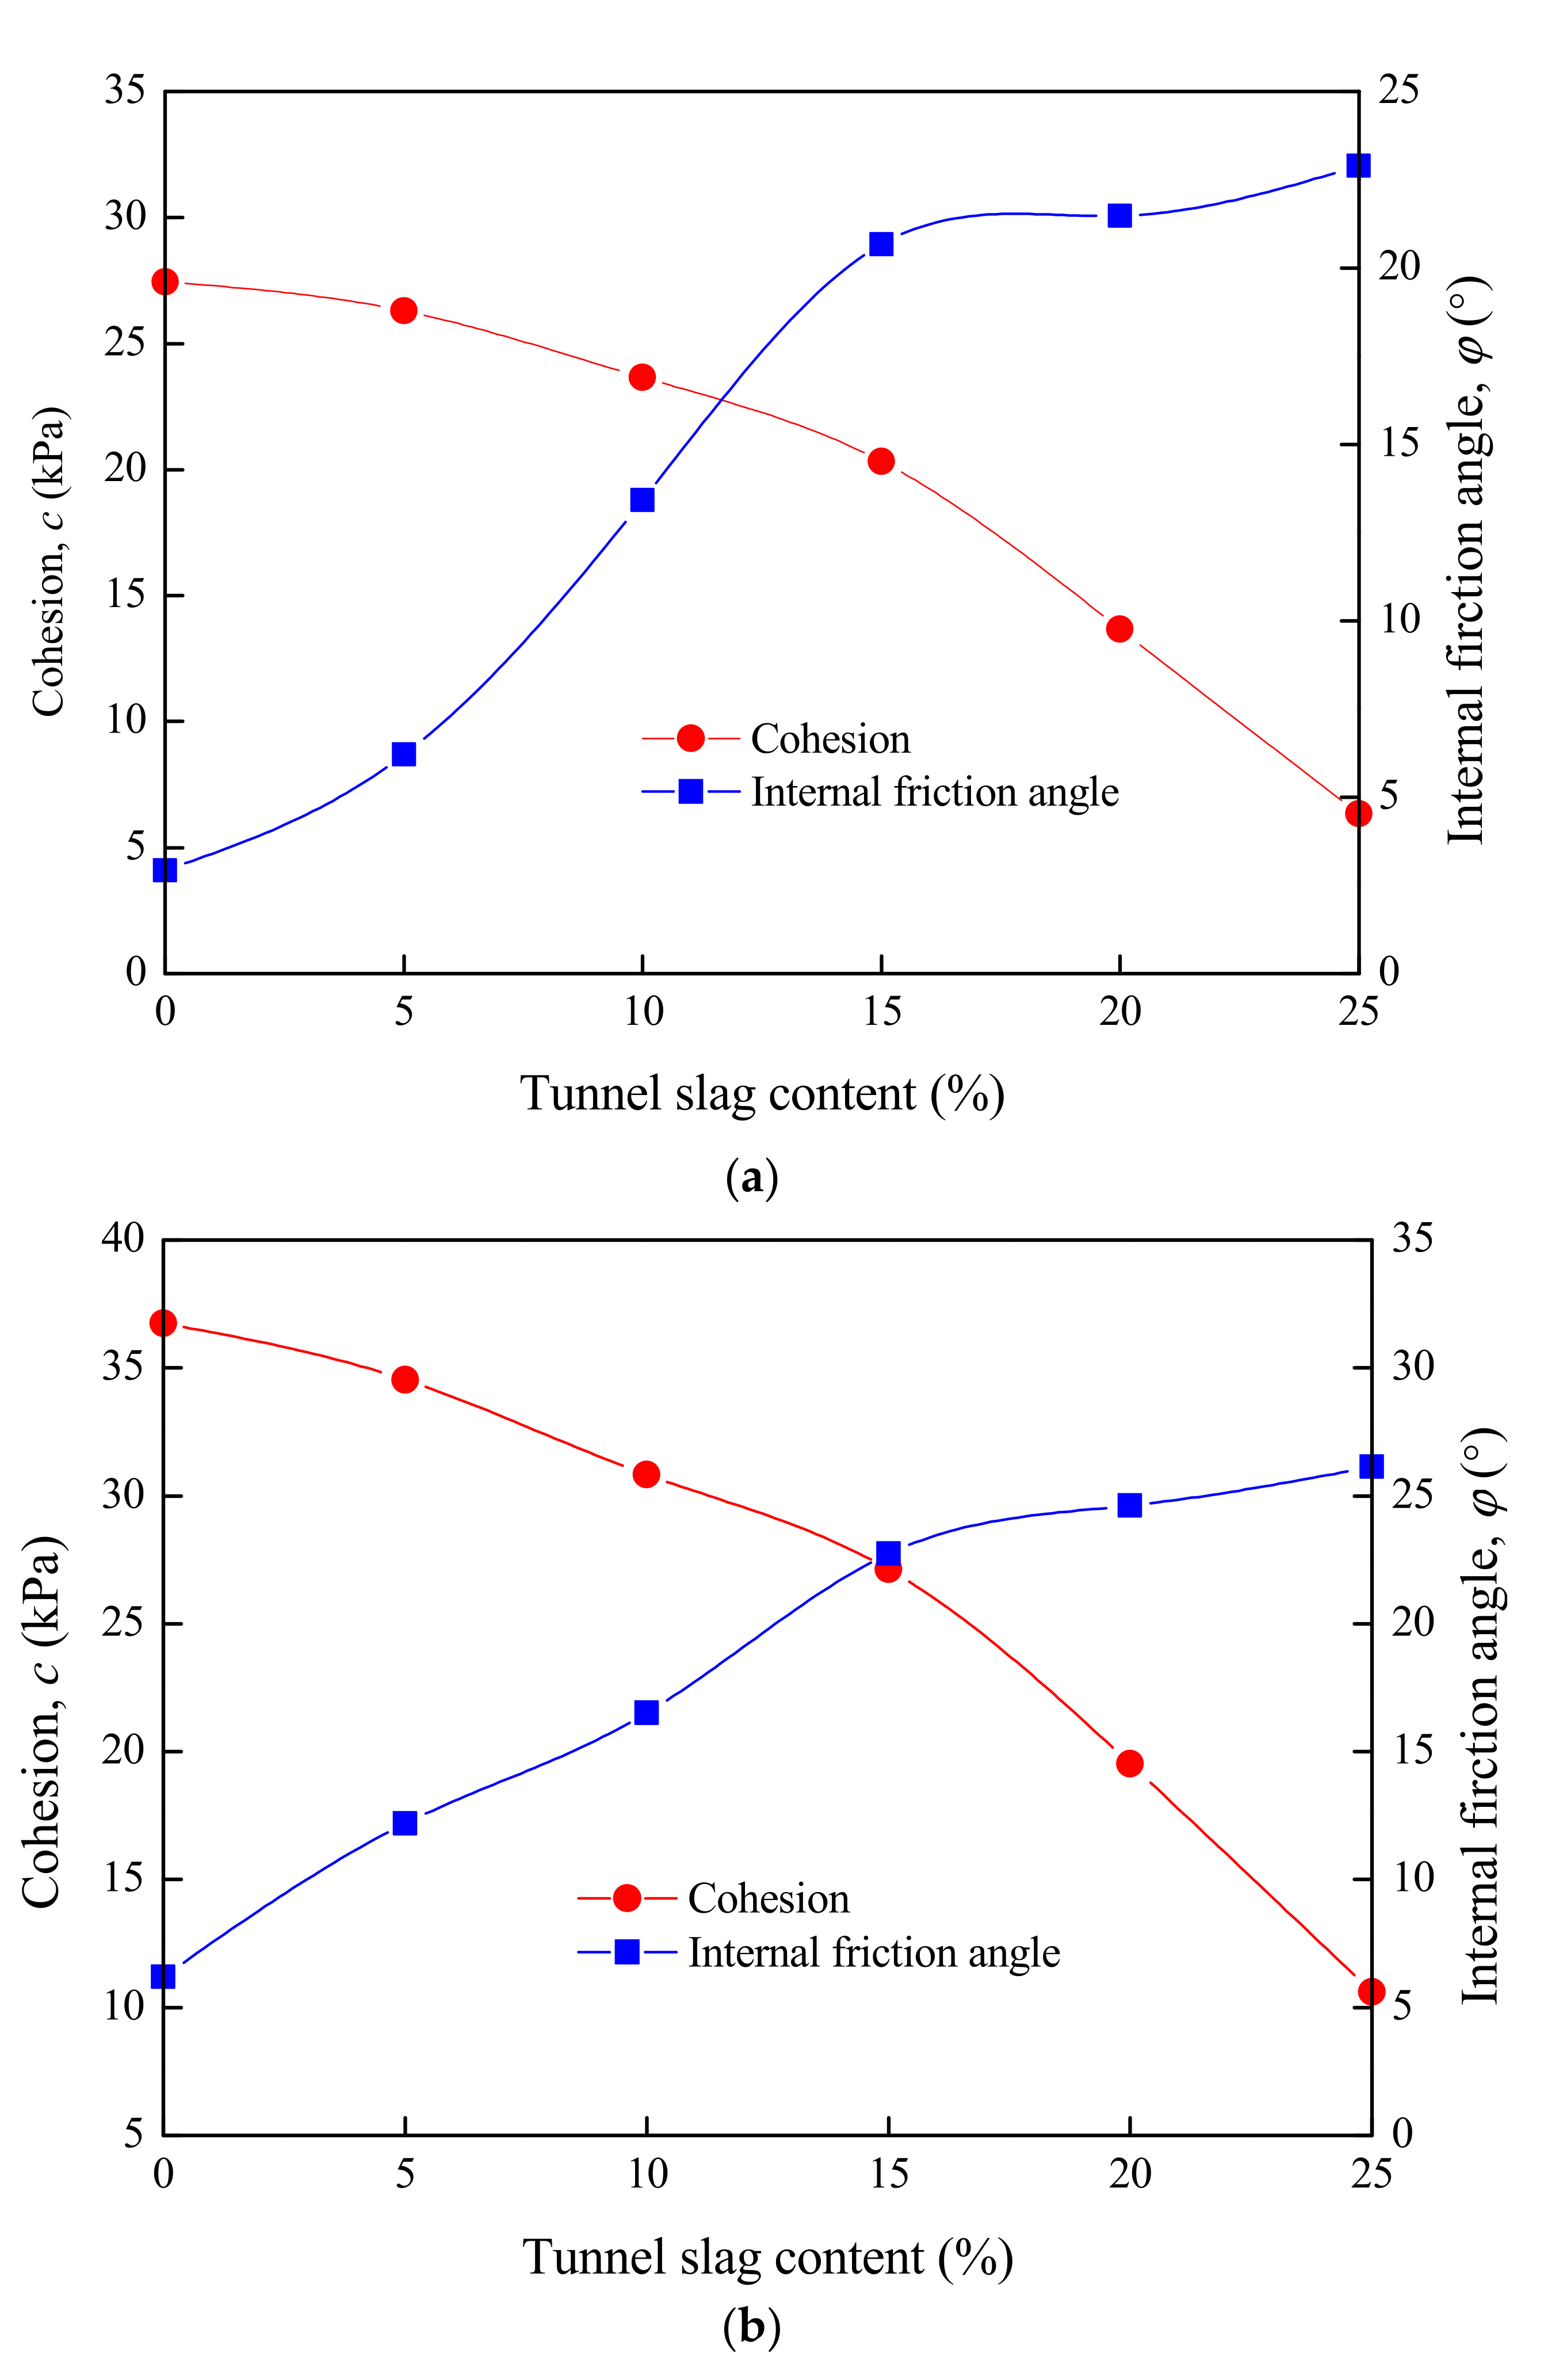
Figure 6.
Relationship between cohesion (internal friction angle) and moisture content.
Figure 6.
Relationship between cohesion (internal friction angle) and moisture content.
Figure 7.
Soil sample dilation experiment. (a) Preloading of sample. (b) Water absorption.
Figure 7.
Soil sample dilation experiment. (a) Preloading of sample. (b) Water absorption.
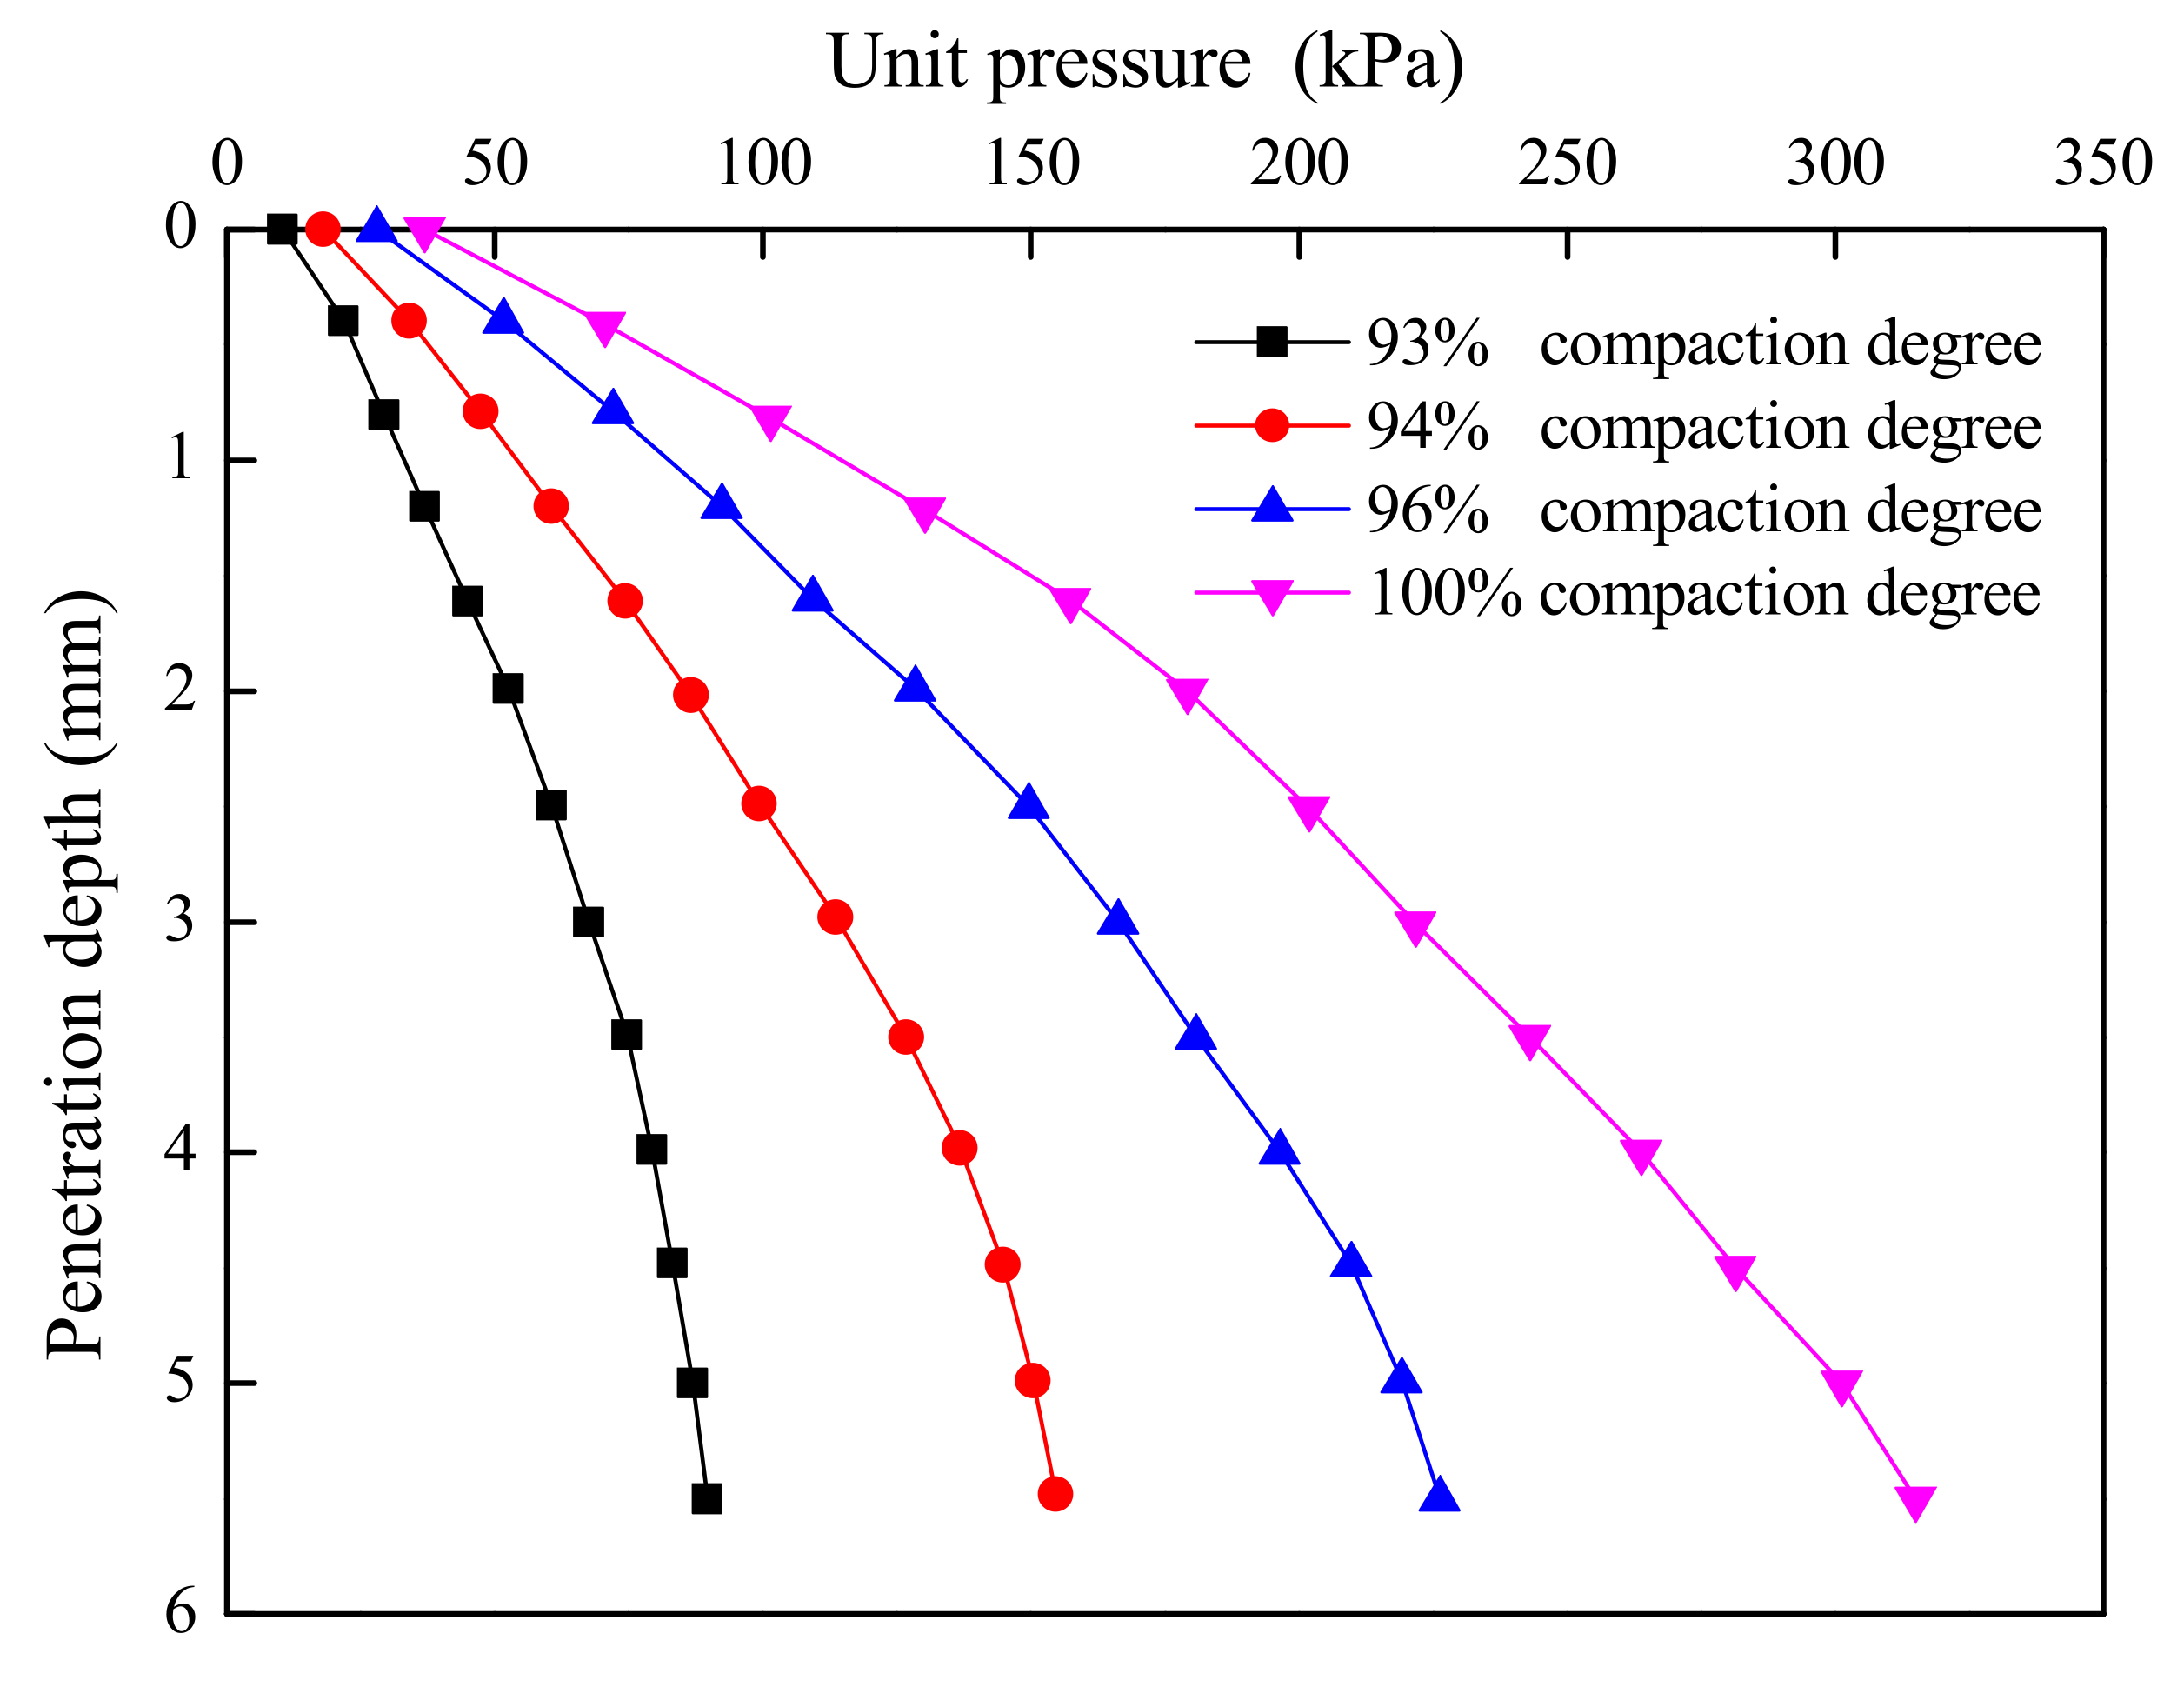
Figure 8.
Penetration test results.
Figure 8.
Penetration test results.
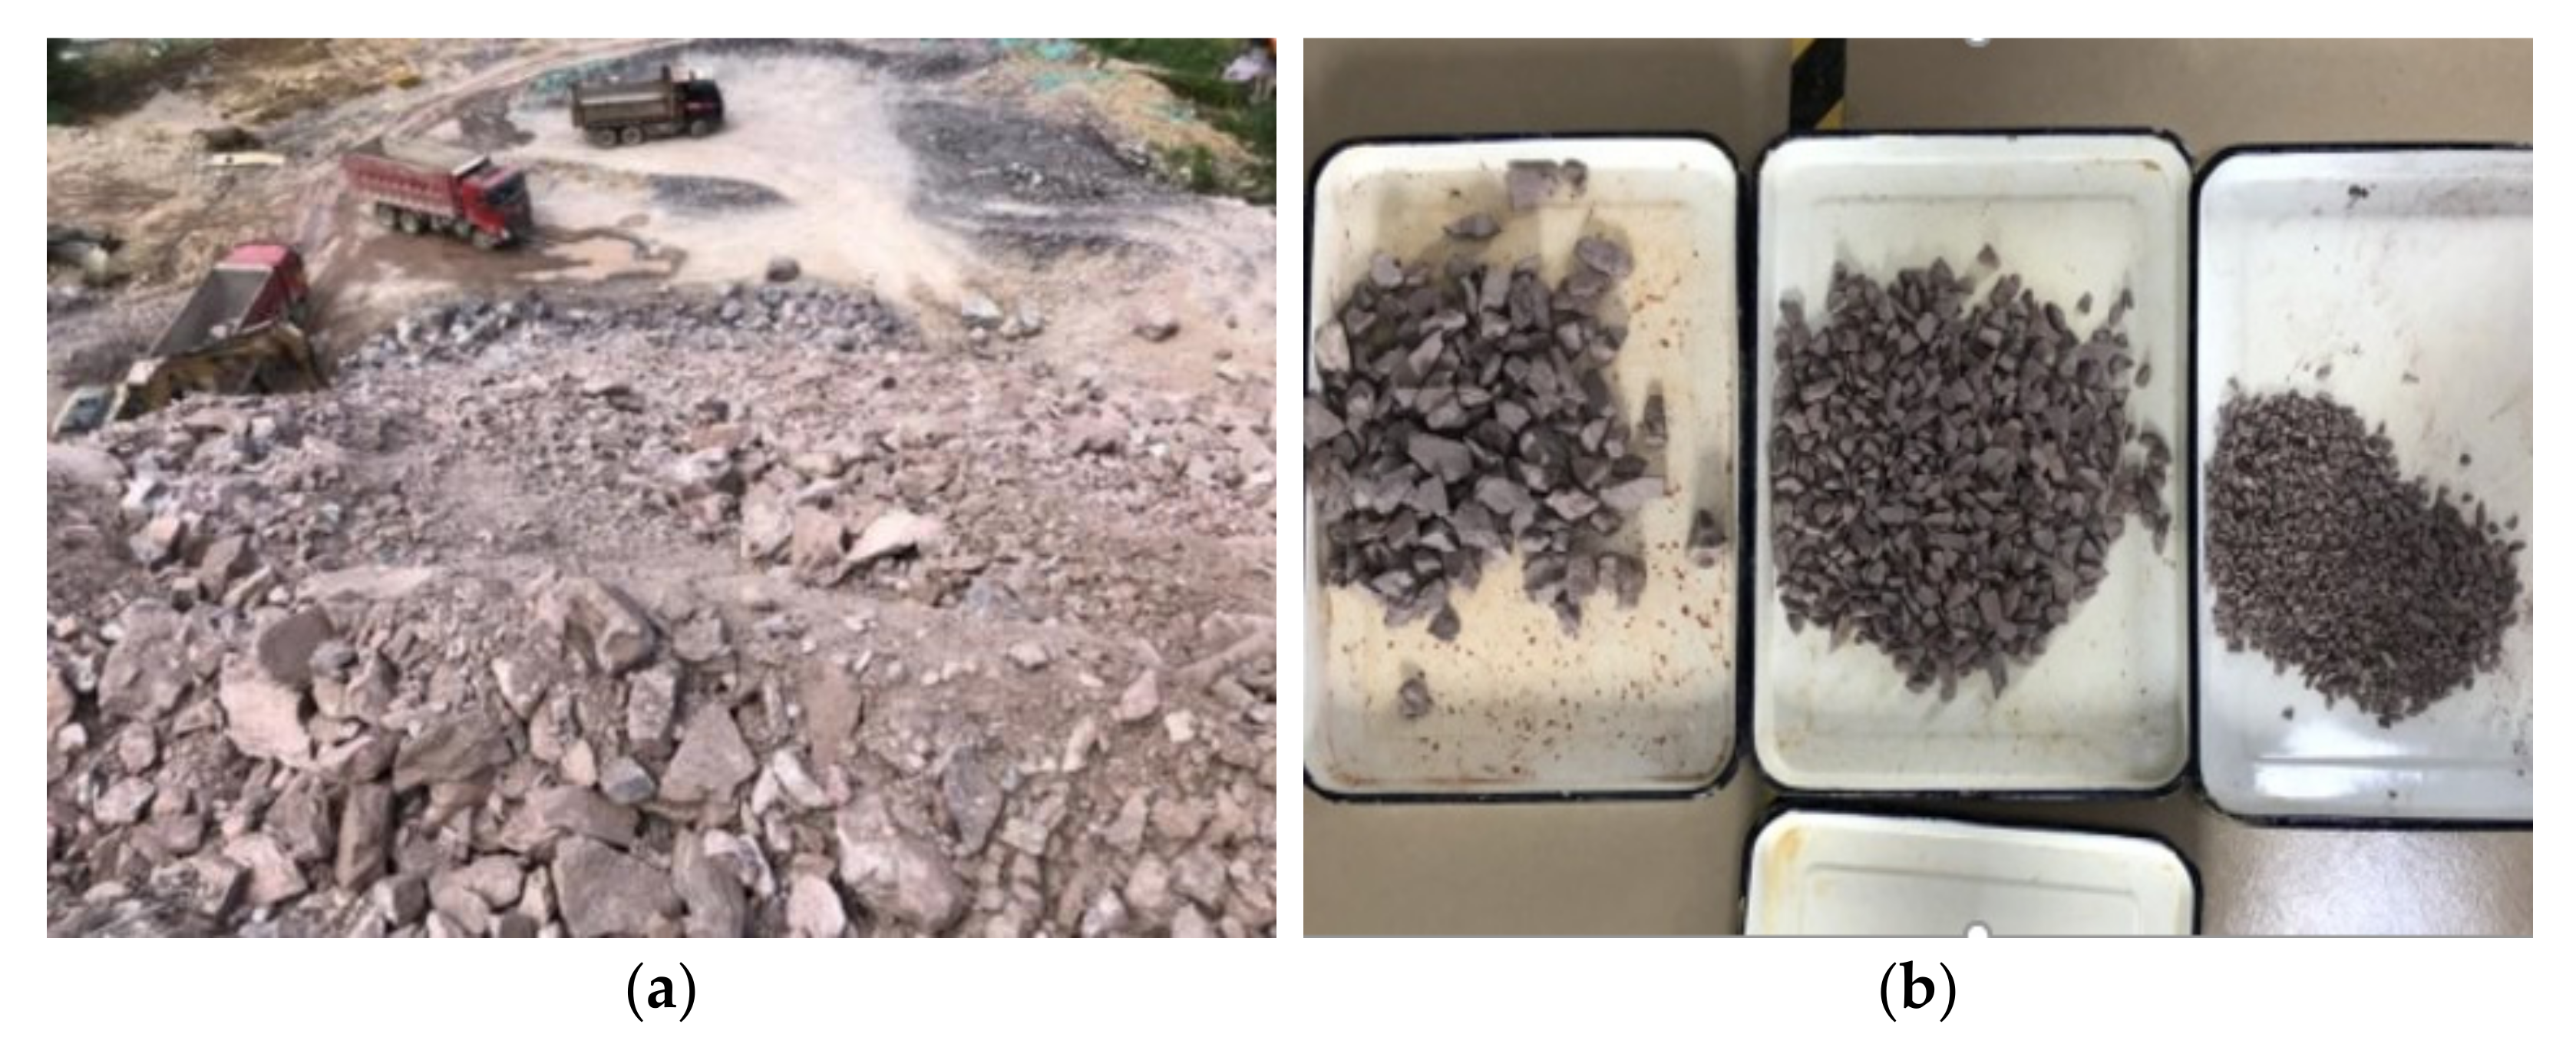
Figure 9.
Tunnel slag taken from Wenwei tunnel. (a) Original rocks after blasting. (b) Tunnel slag used in the experiment.
Figure 9.
Tunnel slag taken from Wenwei tunnel. (a) Original rocks after blasting. (b) Tunnel slag used in the experiment.
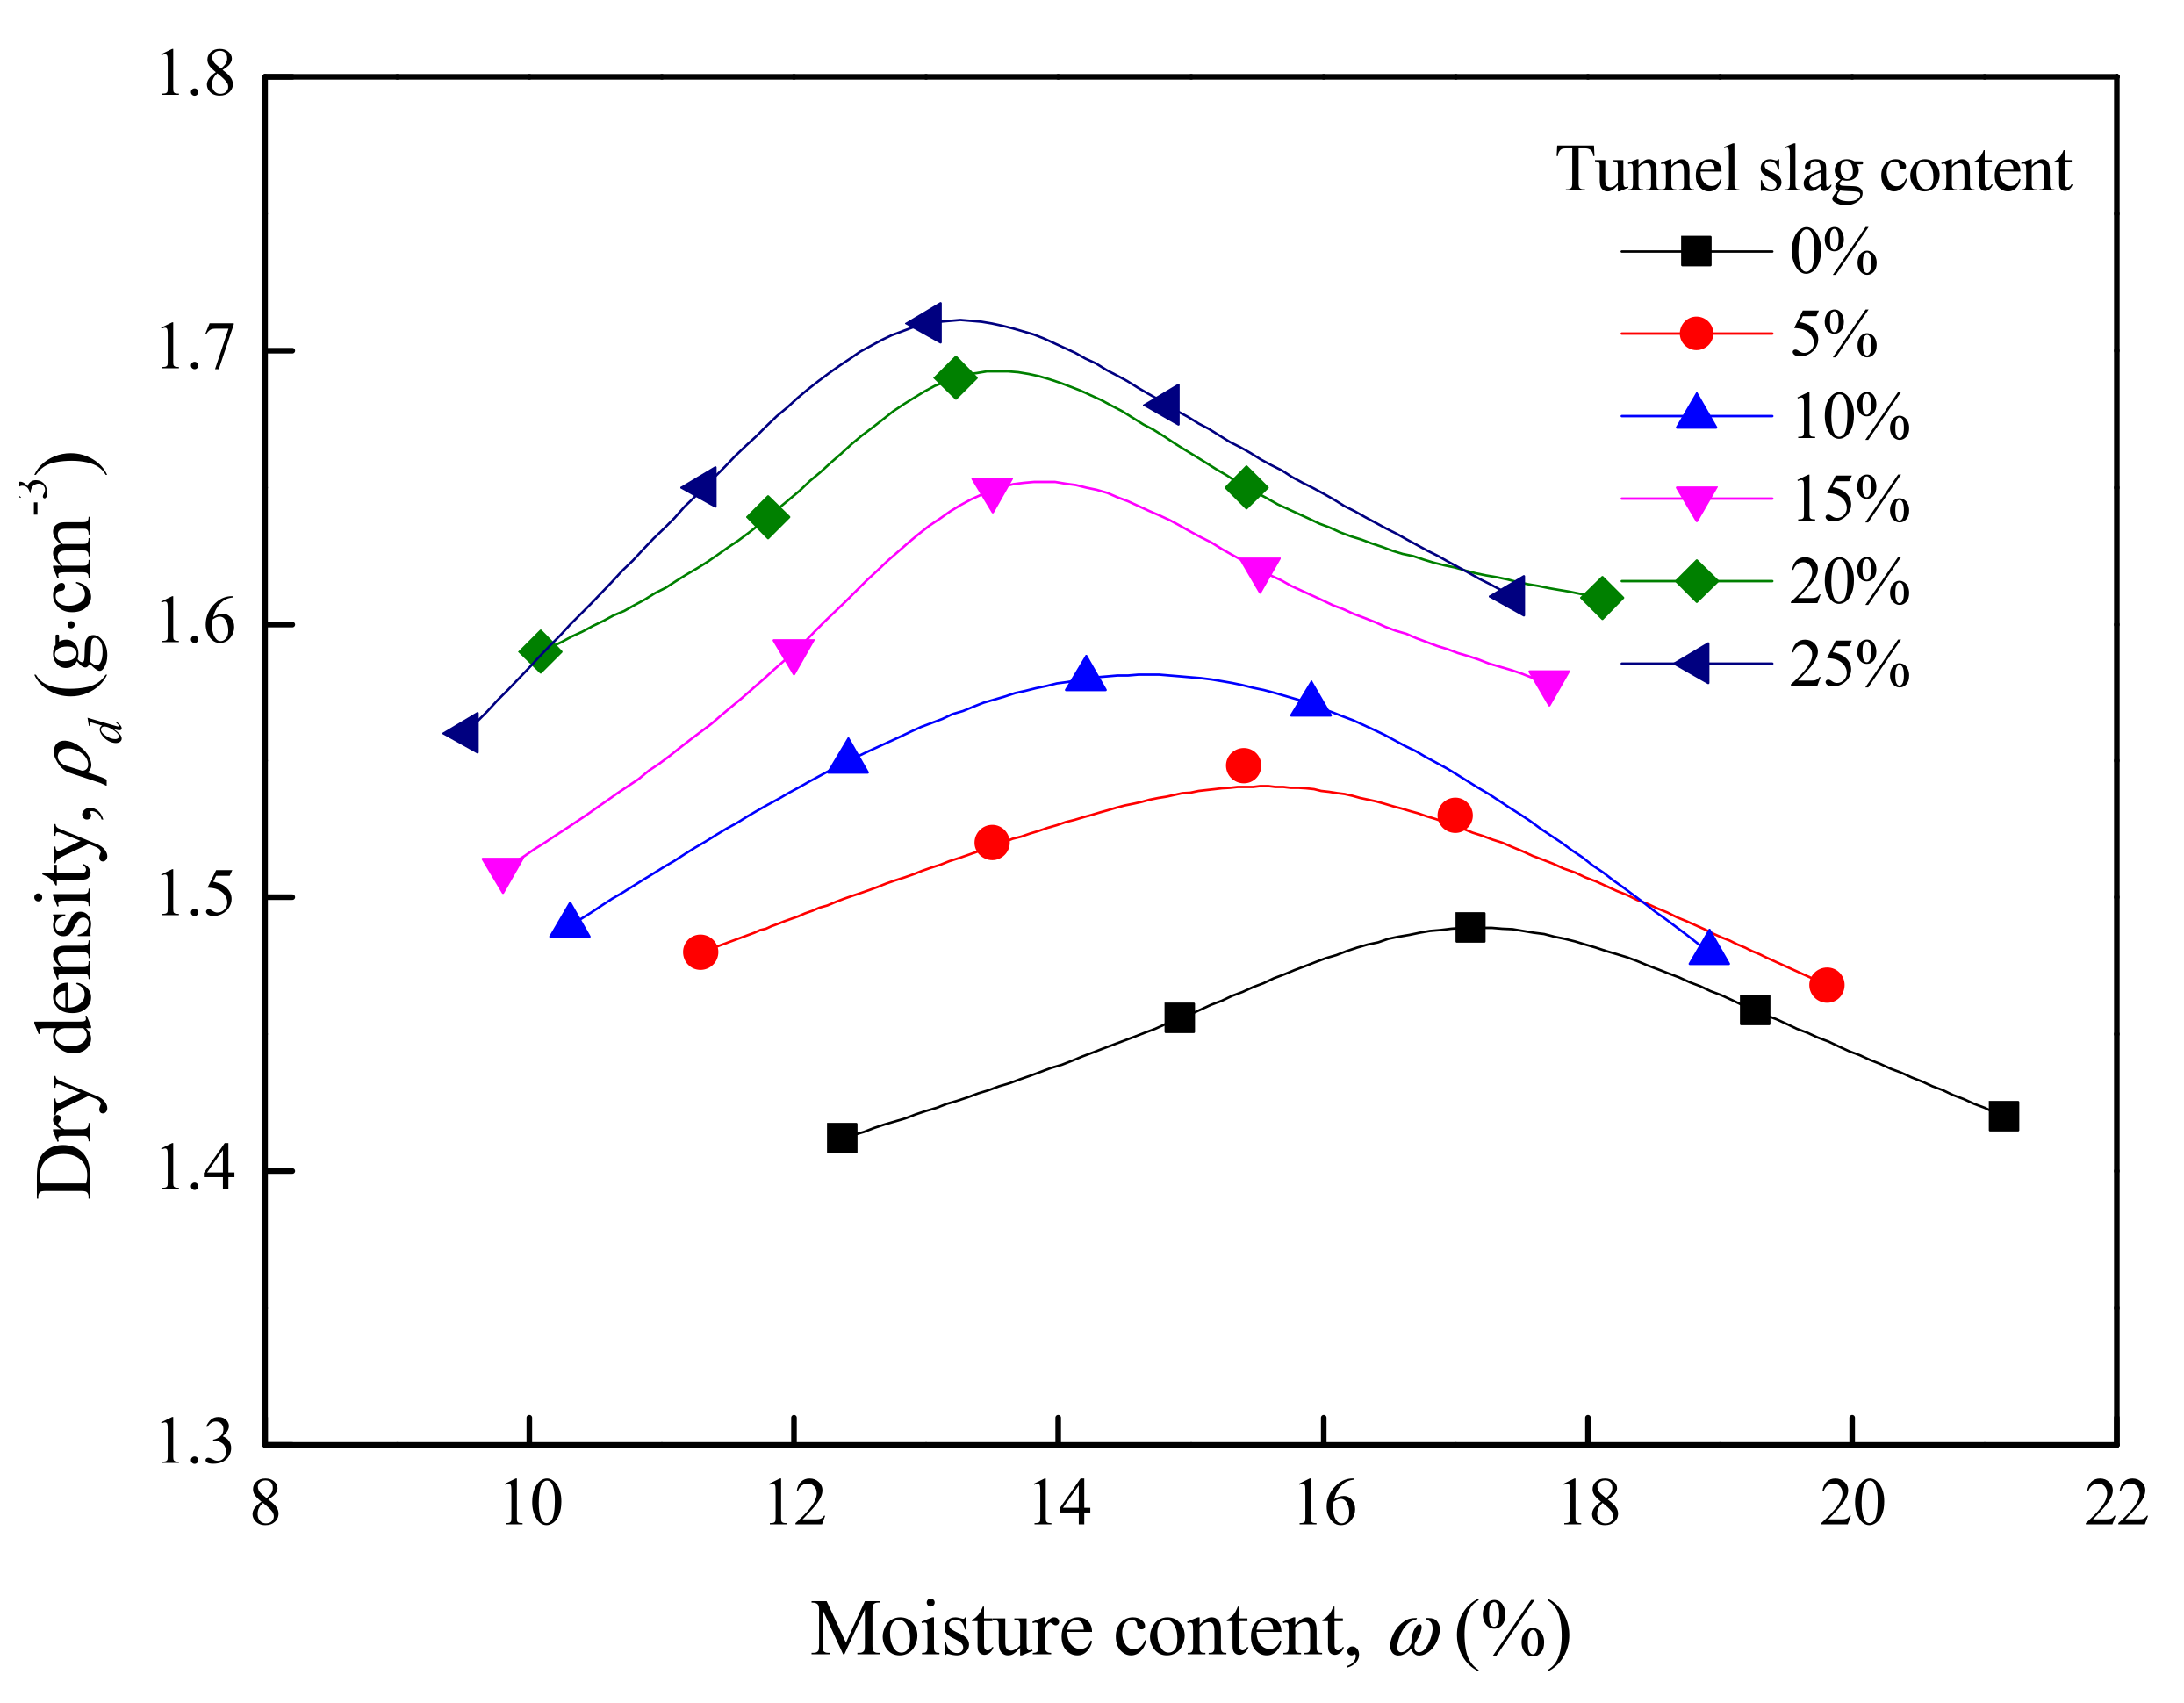
Figure 10.
Relationship between dry density and moisture content of tunnel-slag-improved high liquid limit soil.
Figure 10.
Relationship between dry density and moisture content of tunnel-slag-improved high liquid limit soil.
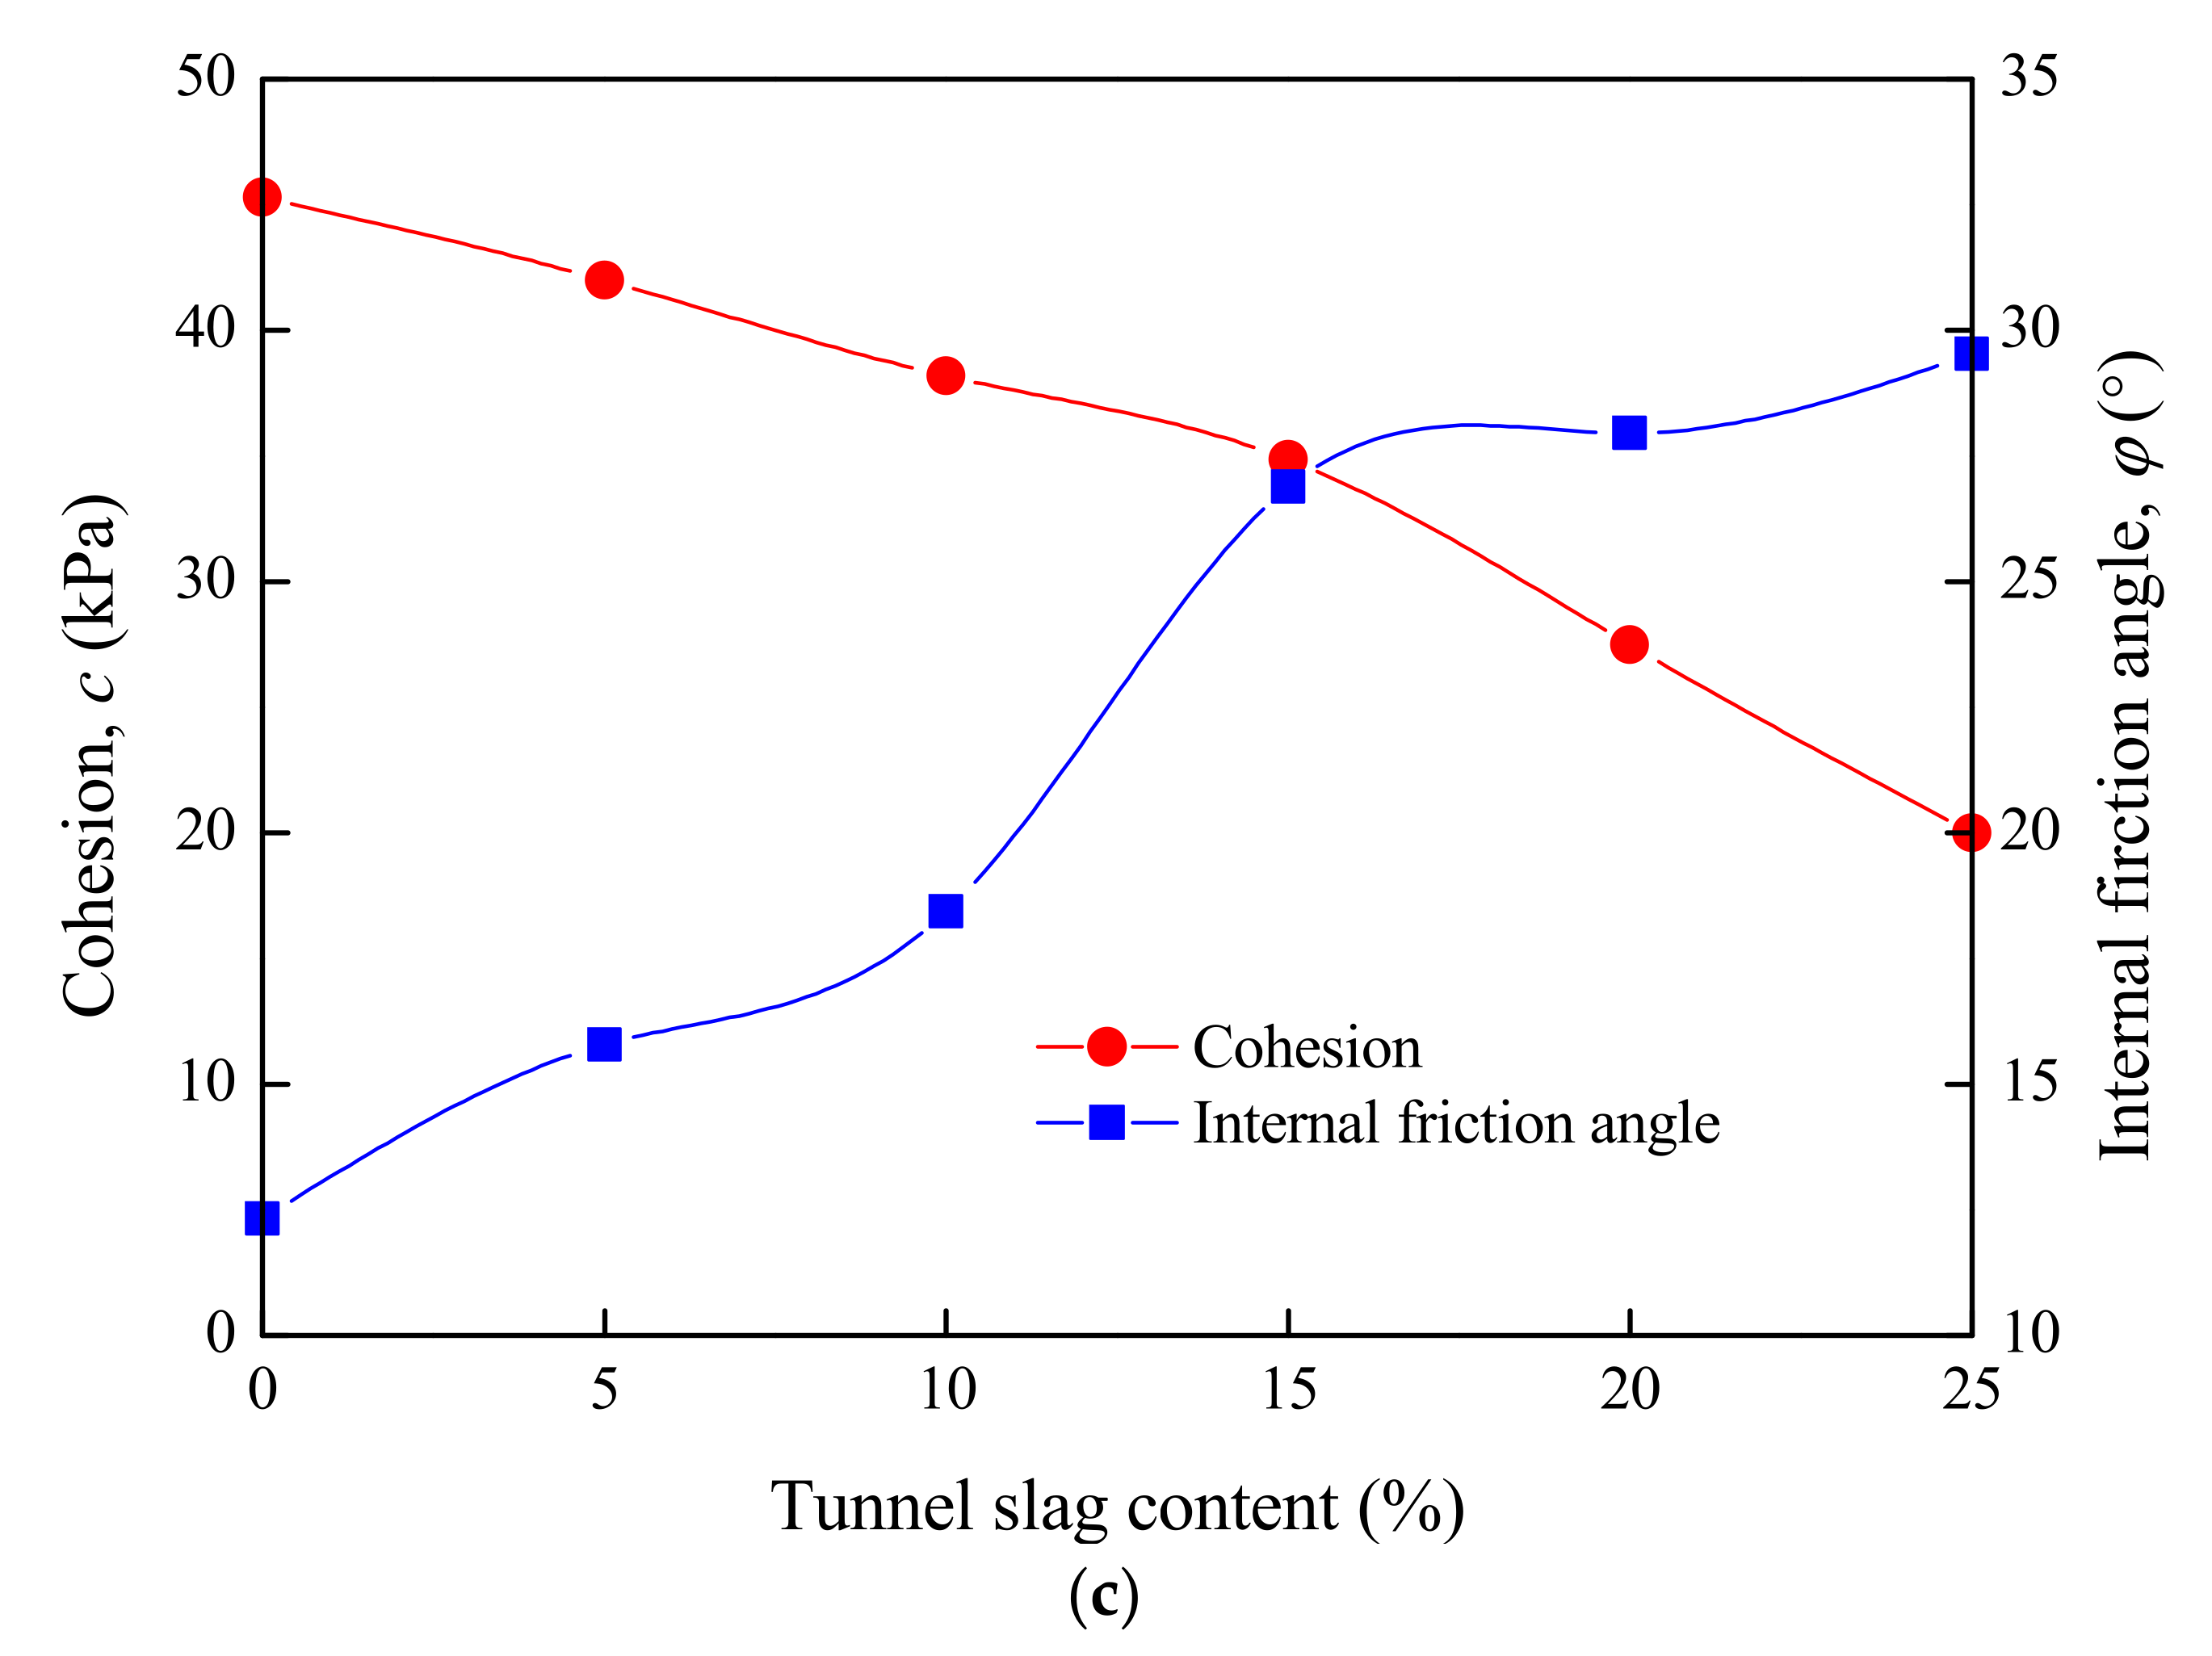
Figure 11.
Cohesion and internal friction angle of tunnel-slag-improved high liquid limit soil. (a) Cohesion and internal friction angle under the condition of compaction degree of 93%. (b) Cohesion and internal friction angle under the condition of compaction degree of 94%. (c) Cohesion and internal friction angle under the condition of compaction degree of 96%.
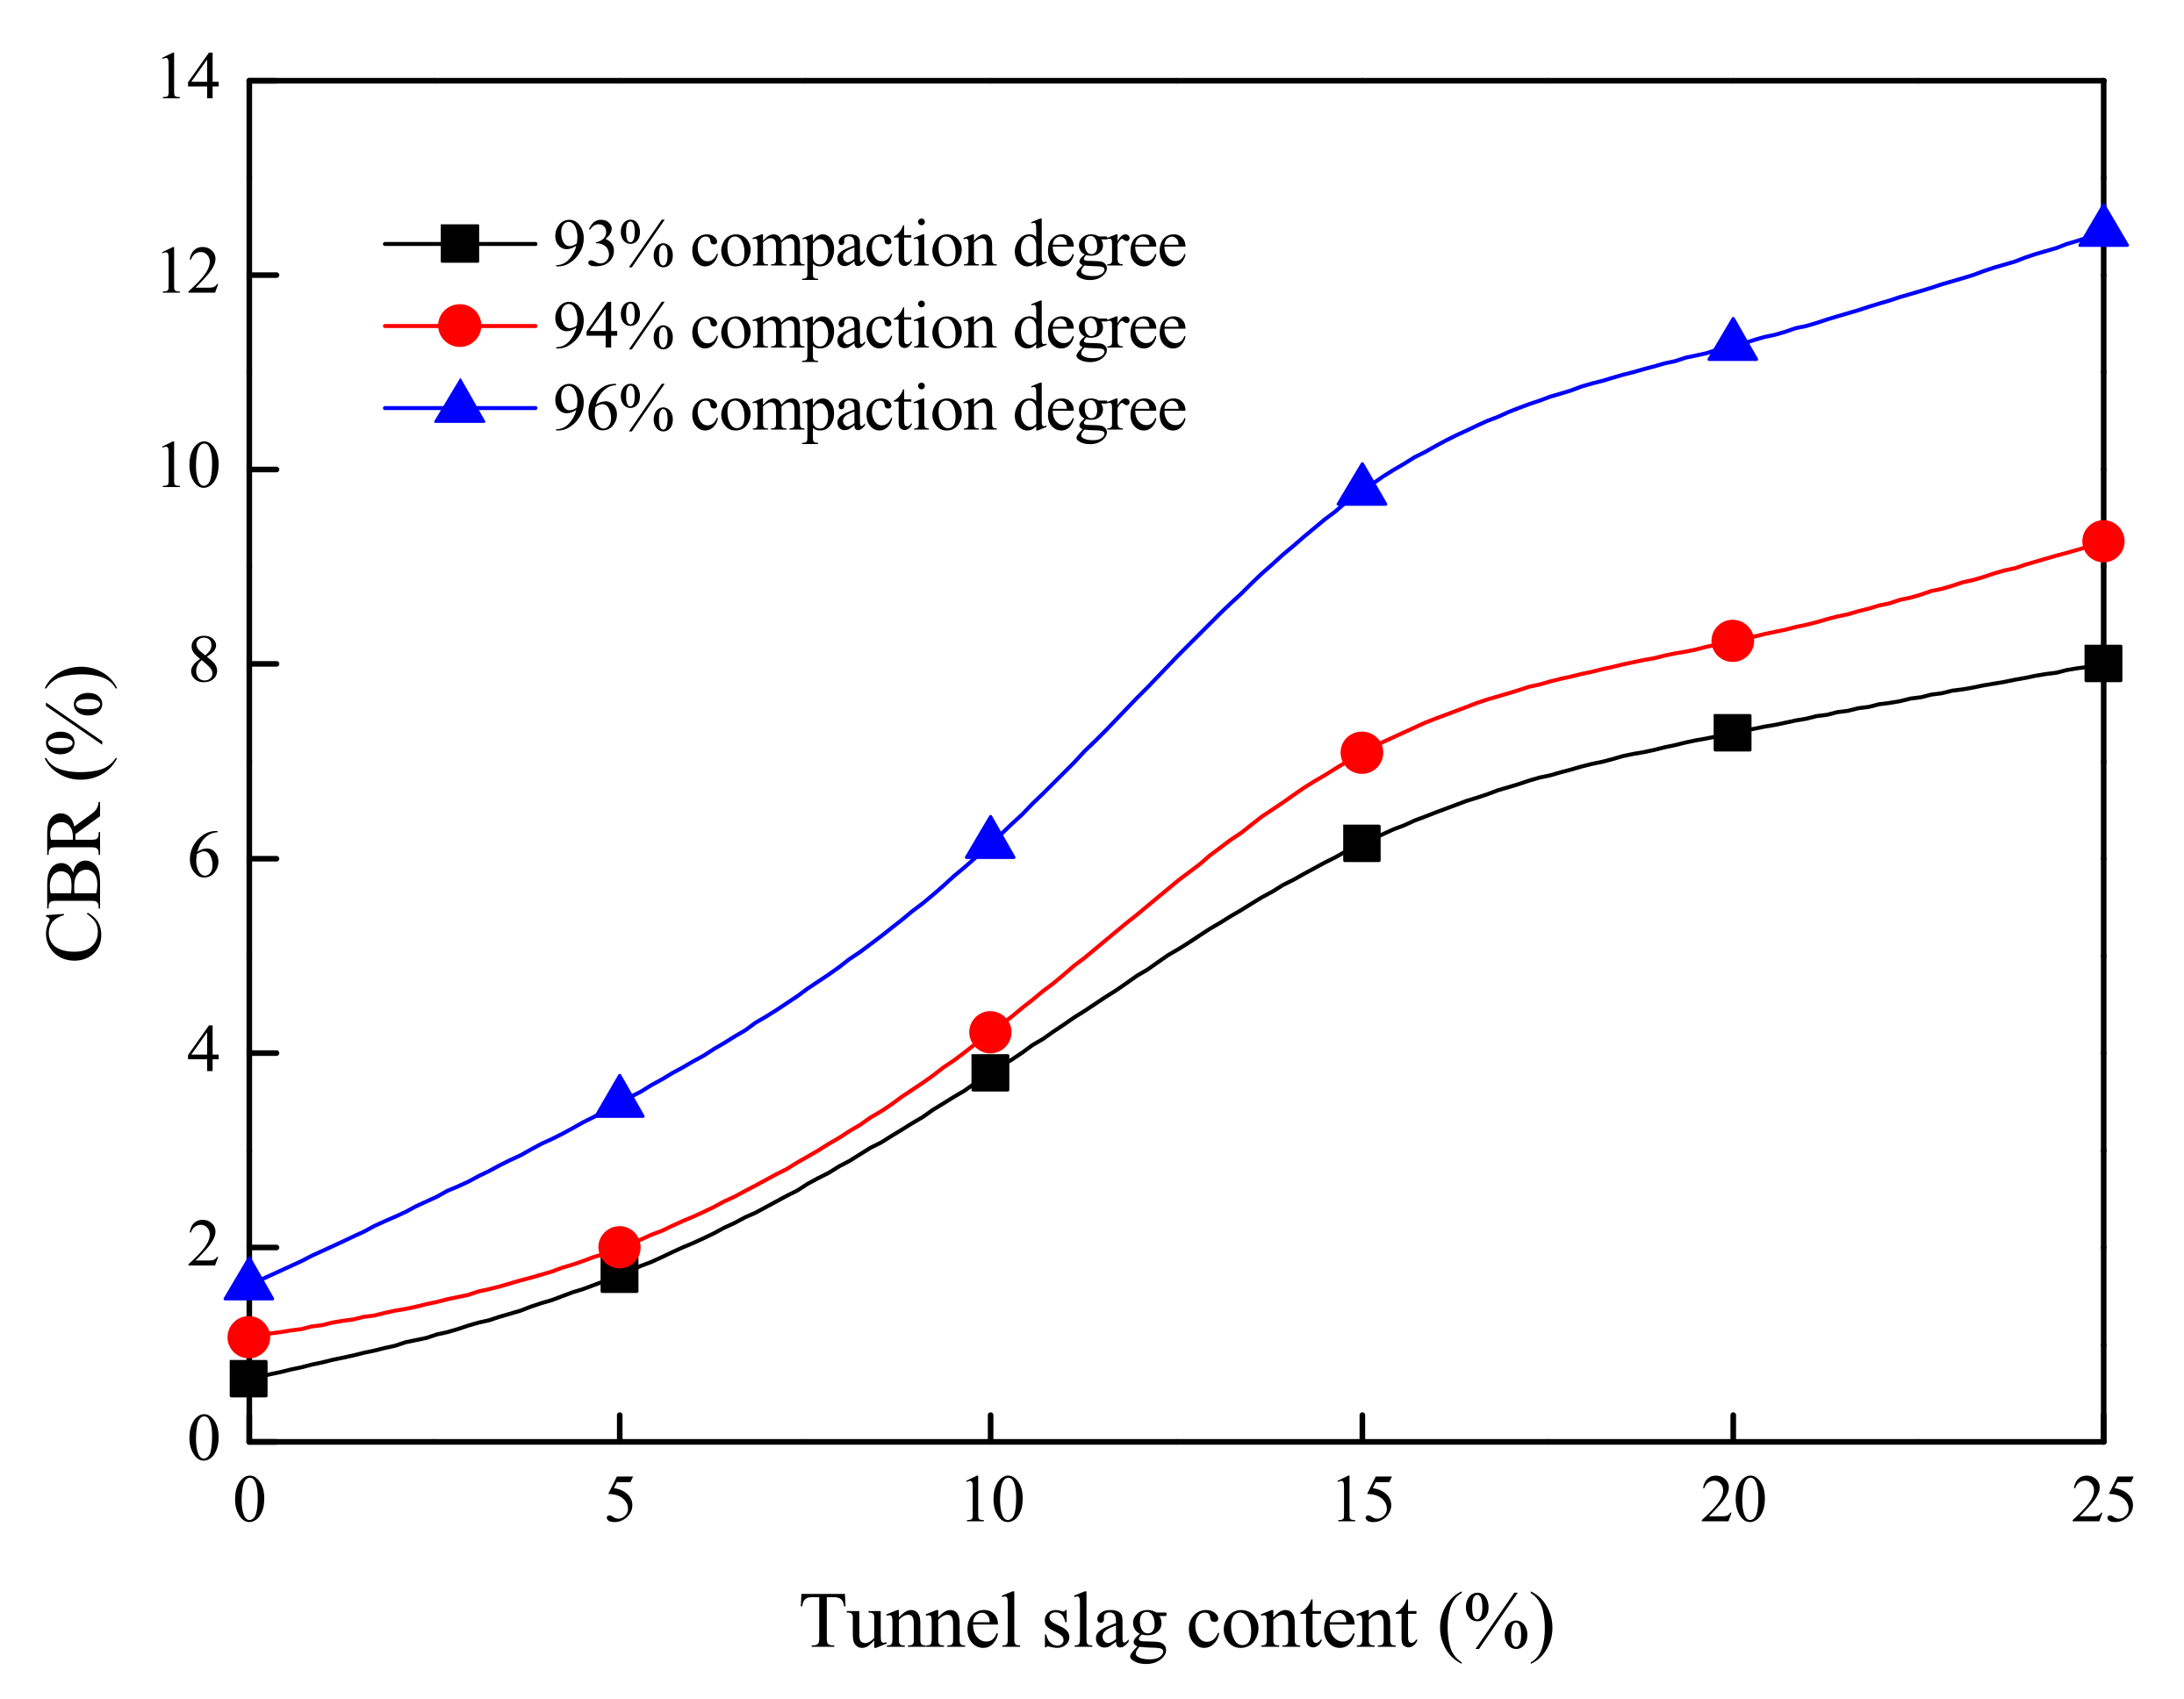
Figure 12.
Relationship between CBR and tunnel slag.
Figure 12.
Relationship between CBR and tunnel slag.
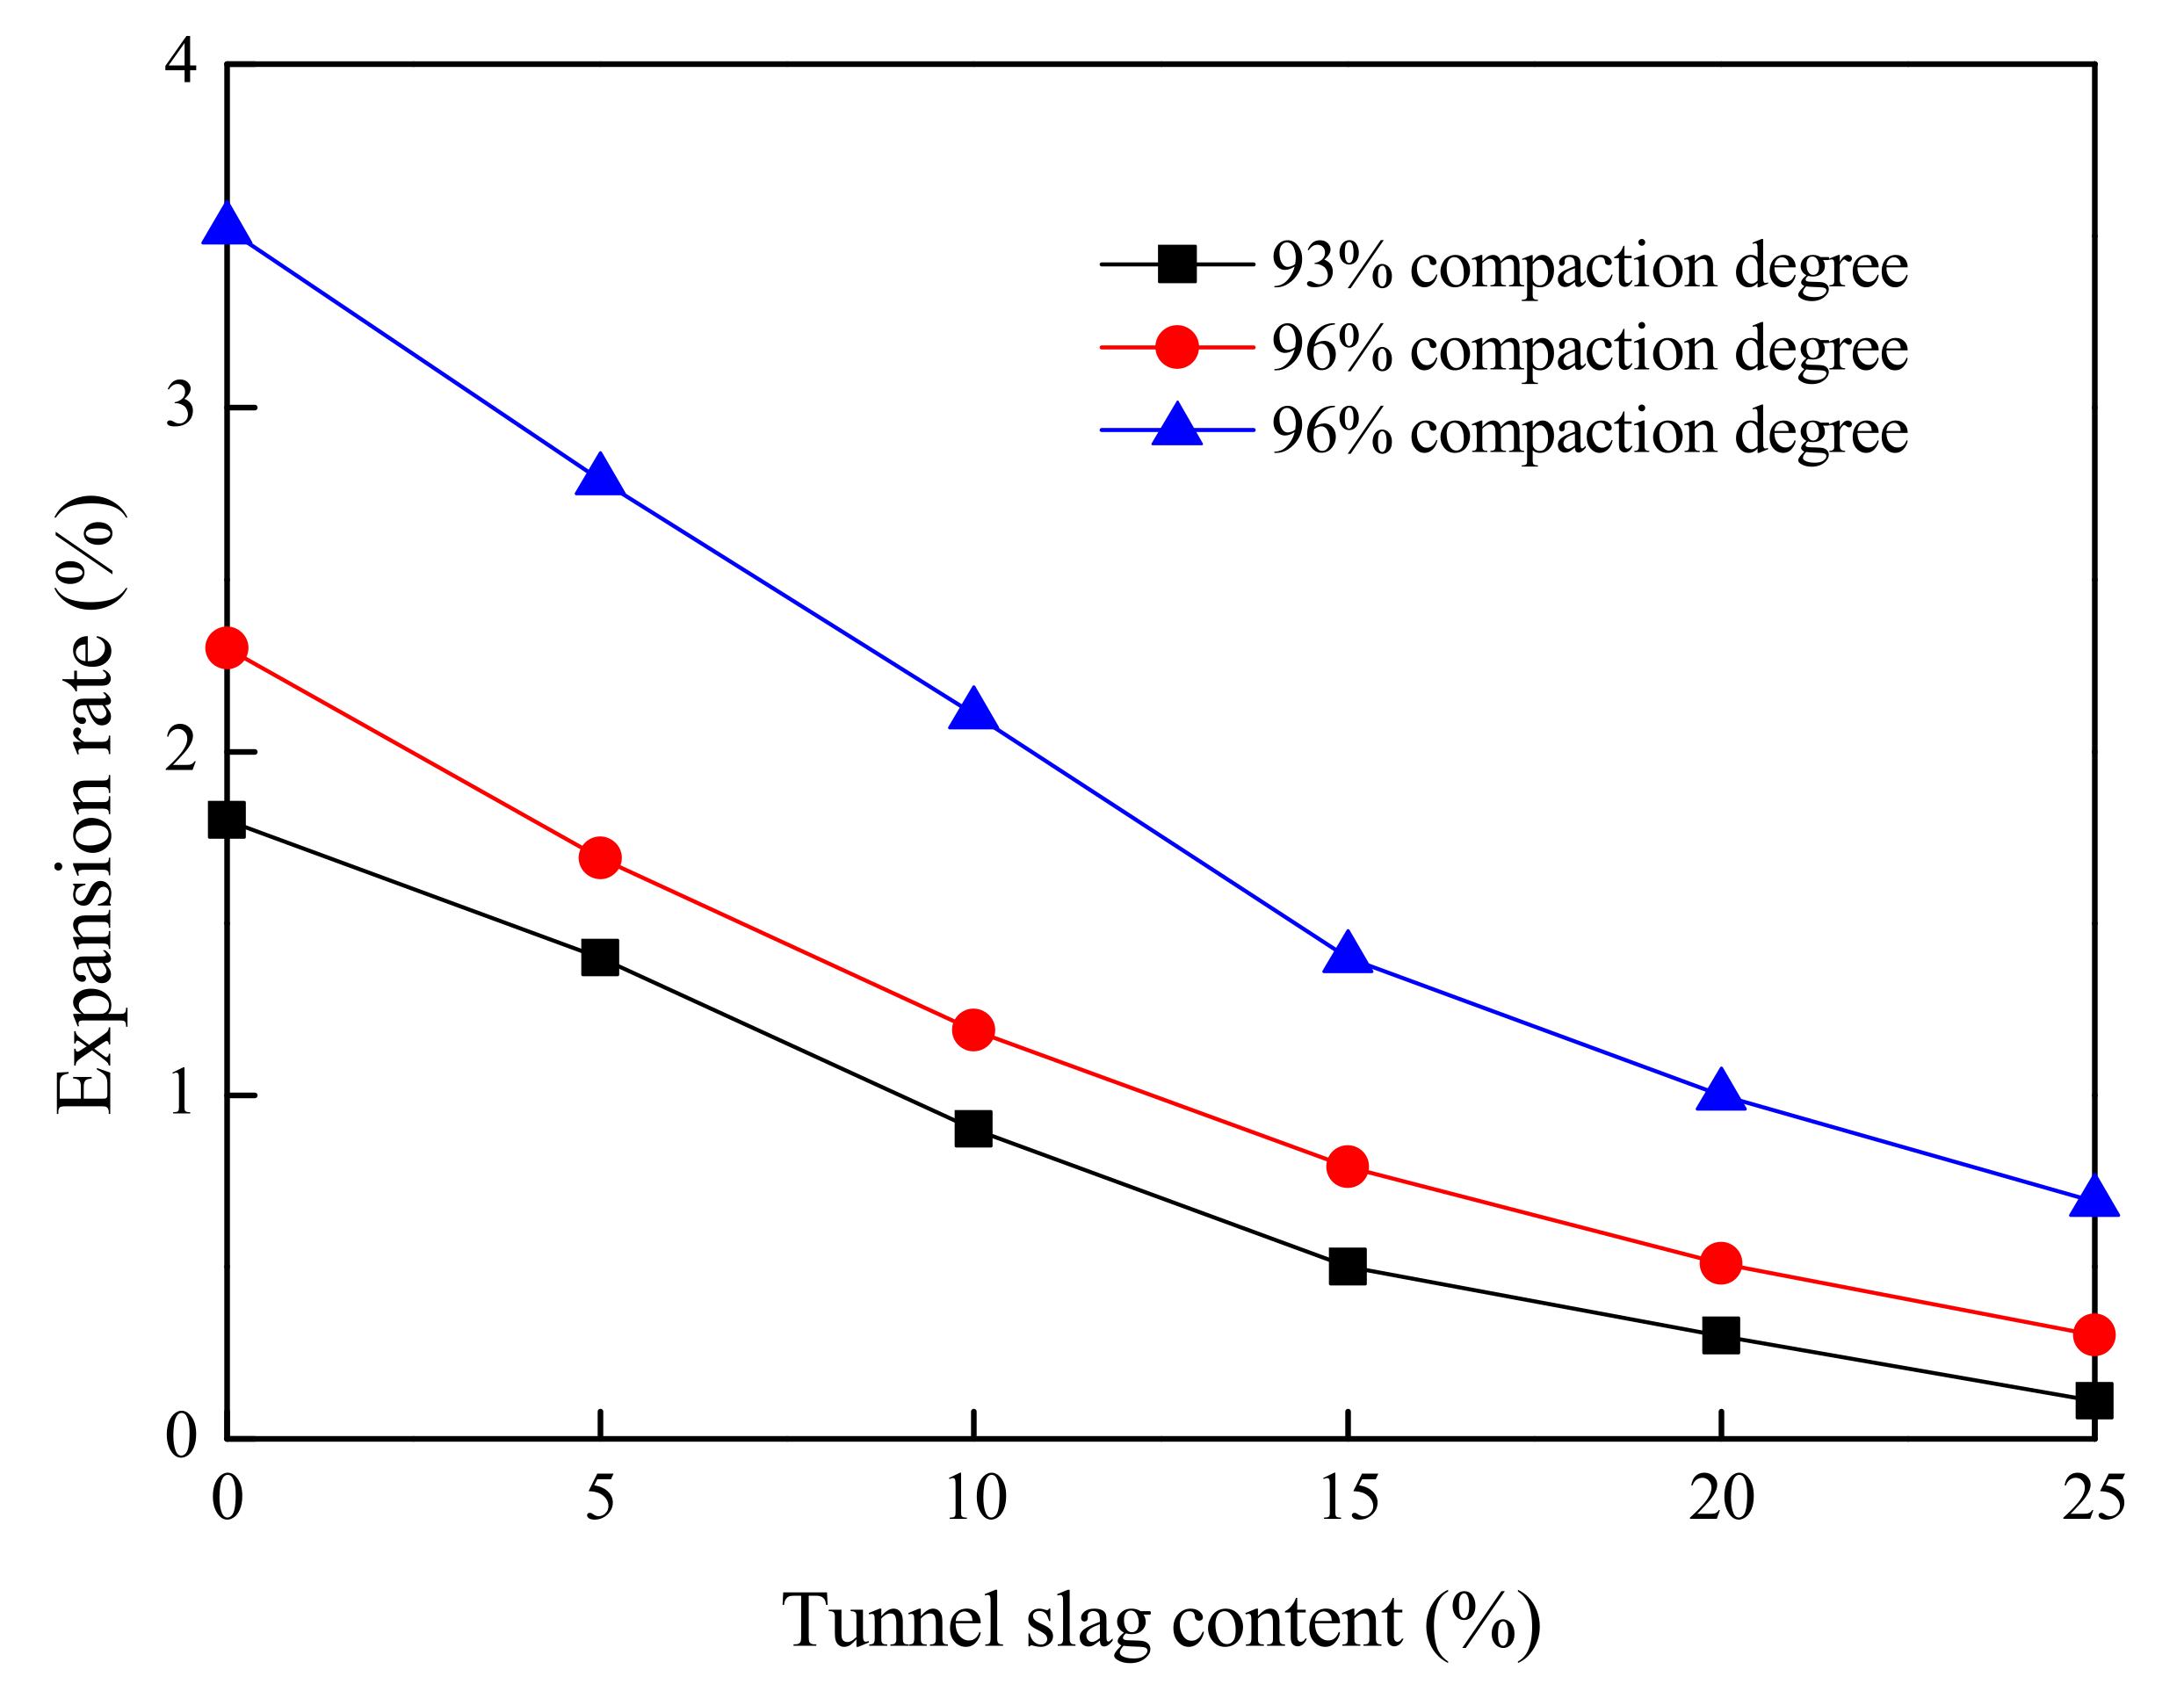
Figure 13.
Relationship between expansion rate and tunnel slag.
Figure 13.
Relationship between expansion rate and tunnel slag.
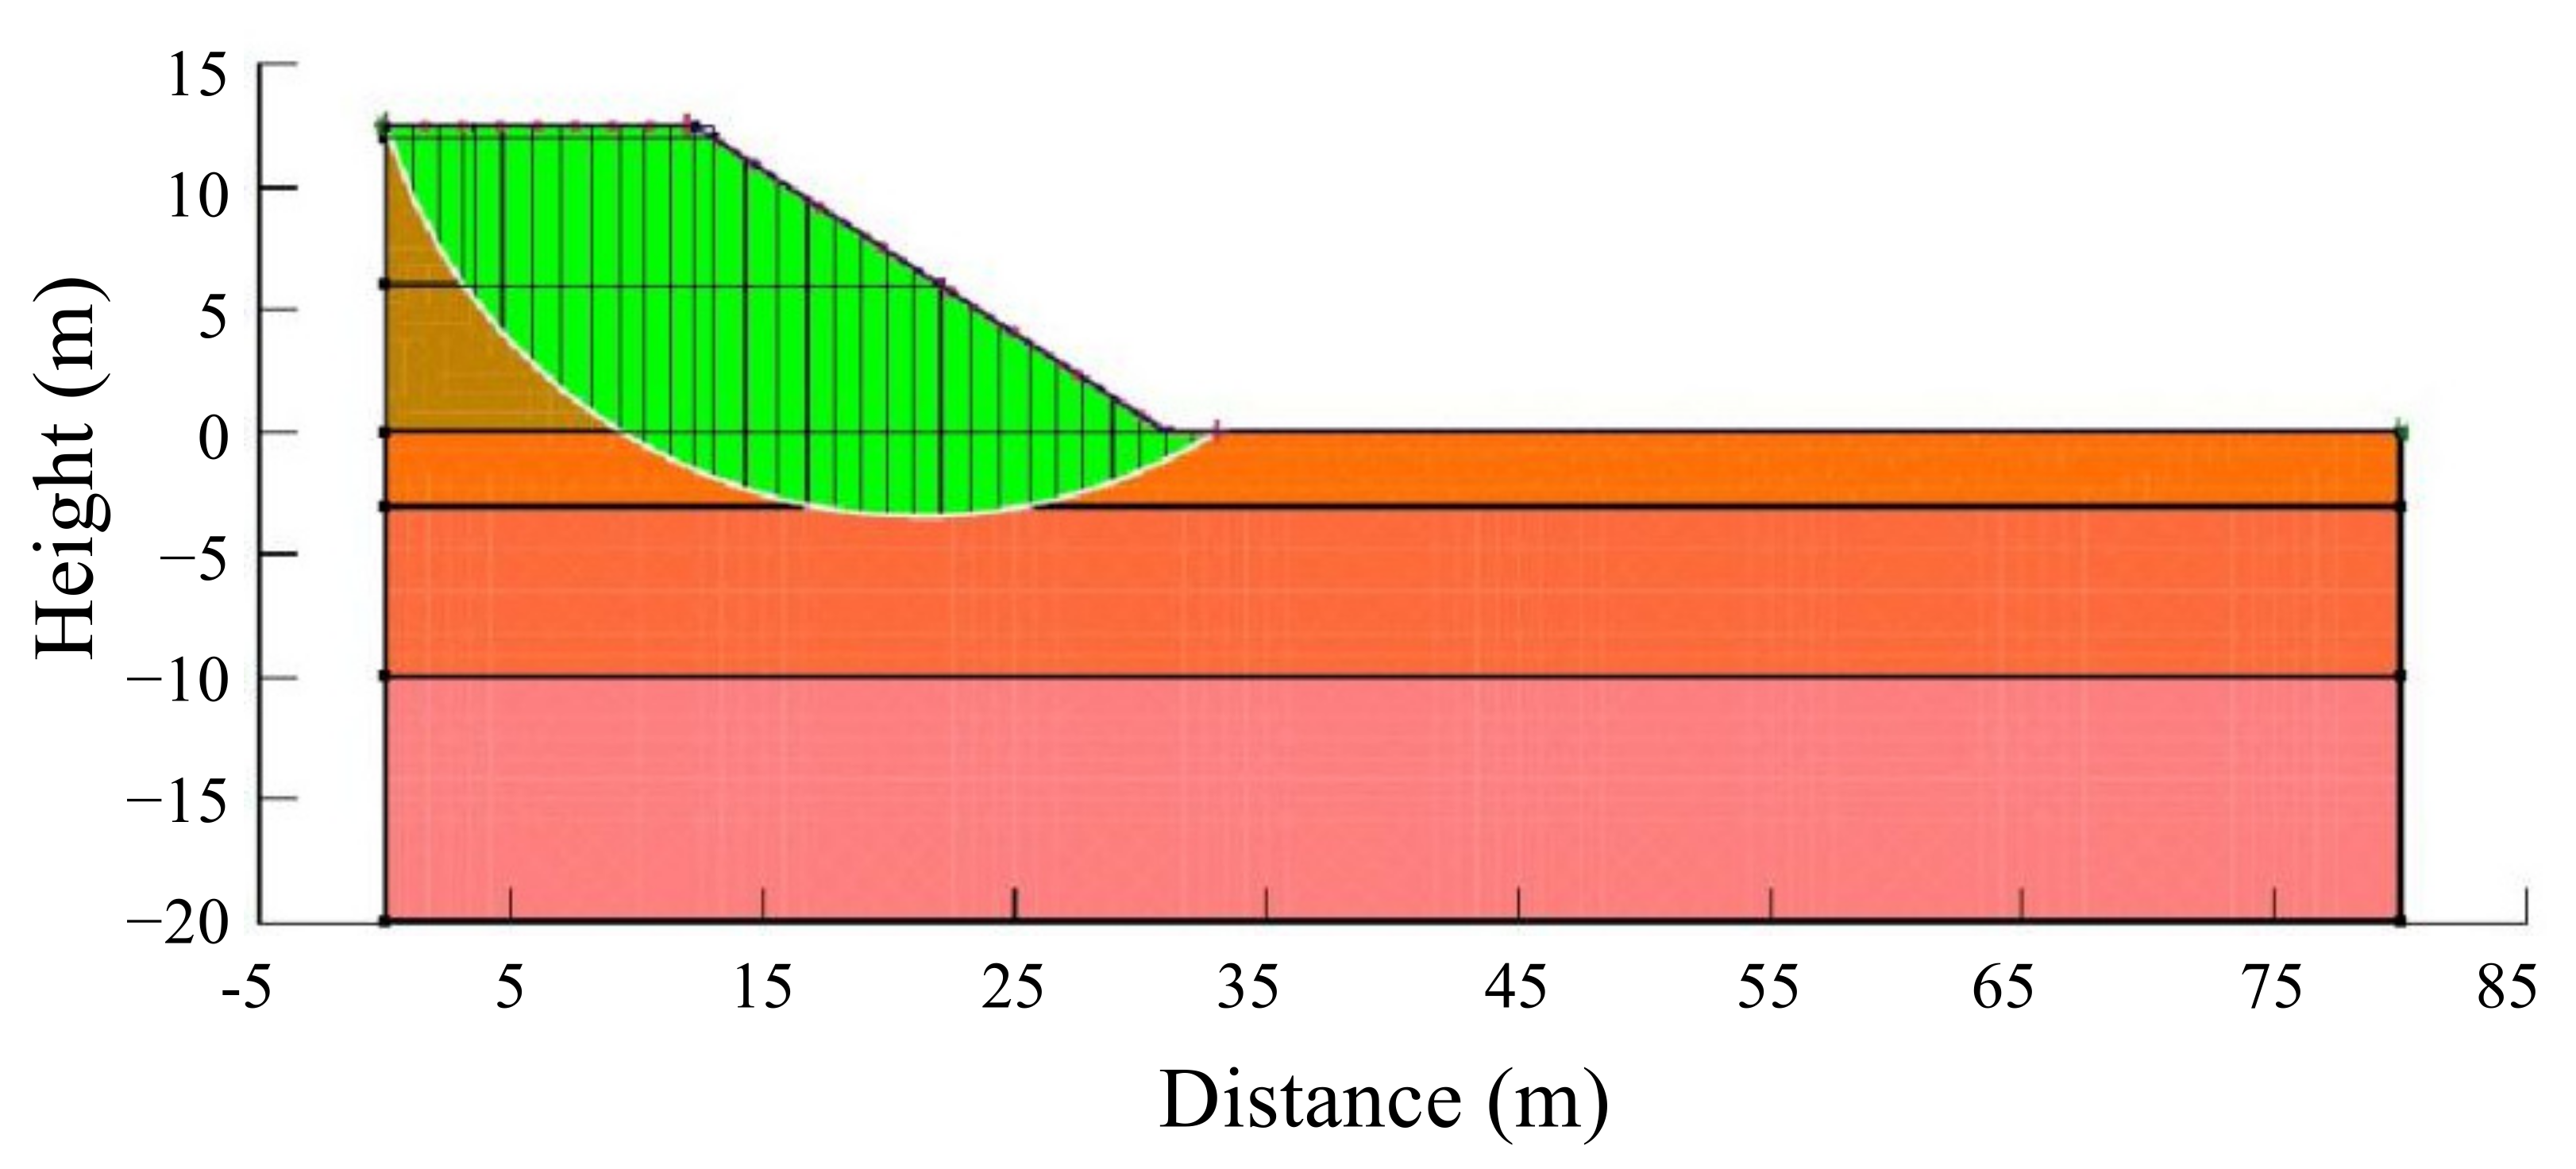
Figure 14.
Numerical model.
Figure 14.
Numerical model.
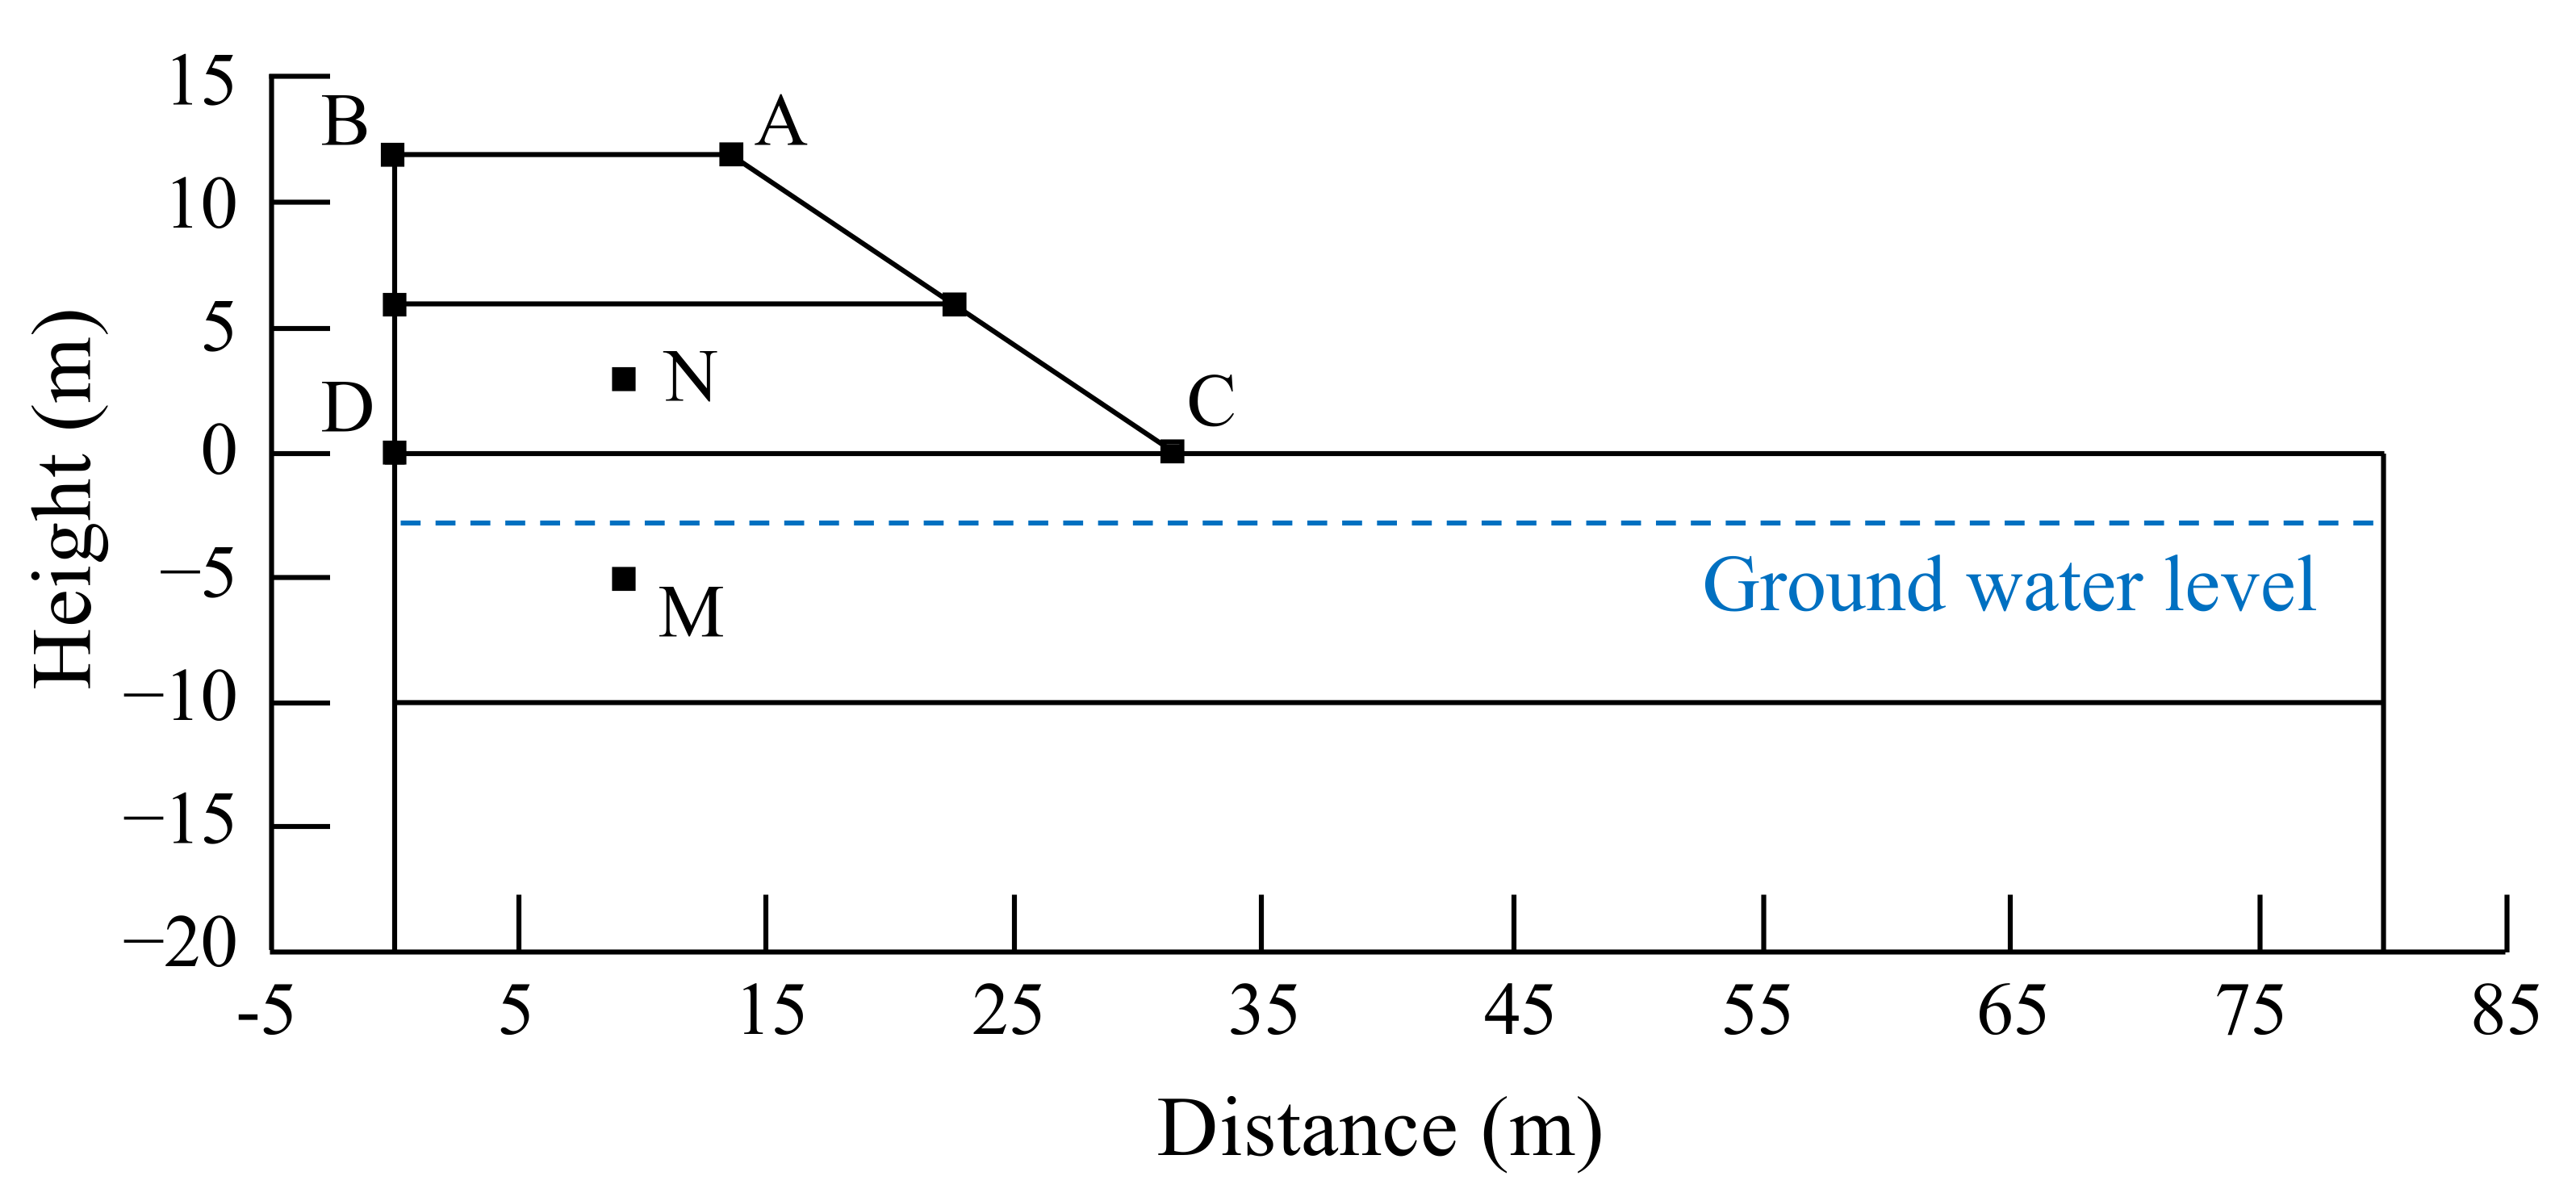
Figure 15.
Diagram of critical failure state of subgrade slope.
Figure 15.
Diagram of critical failure state of subgrade slope.
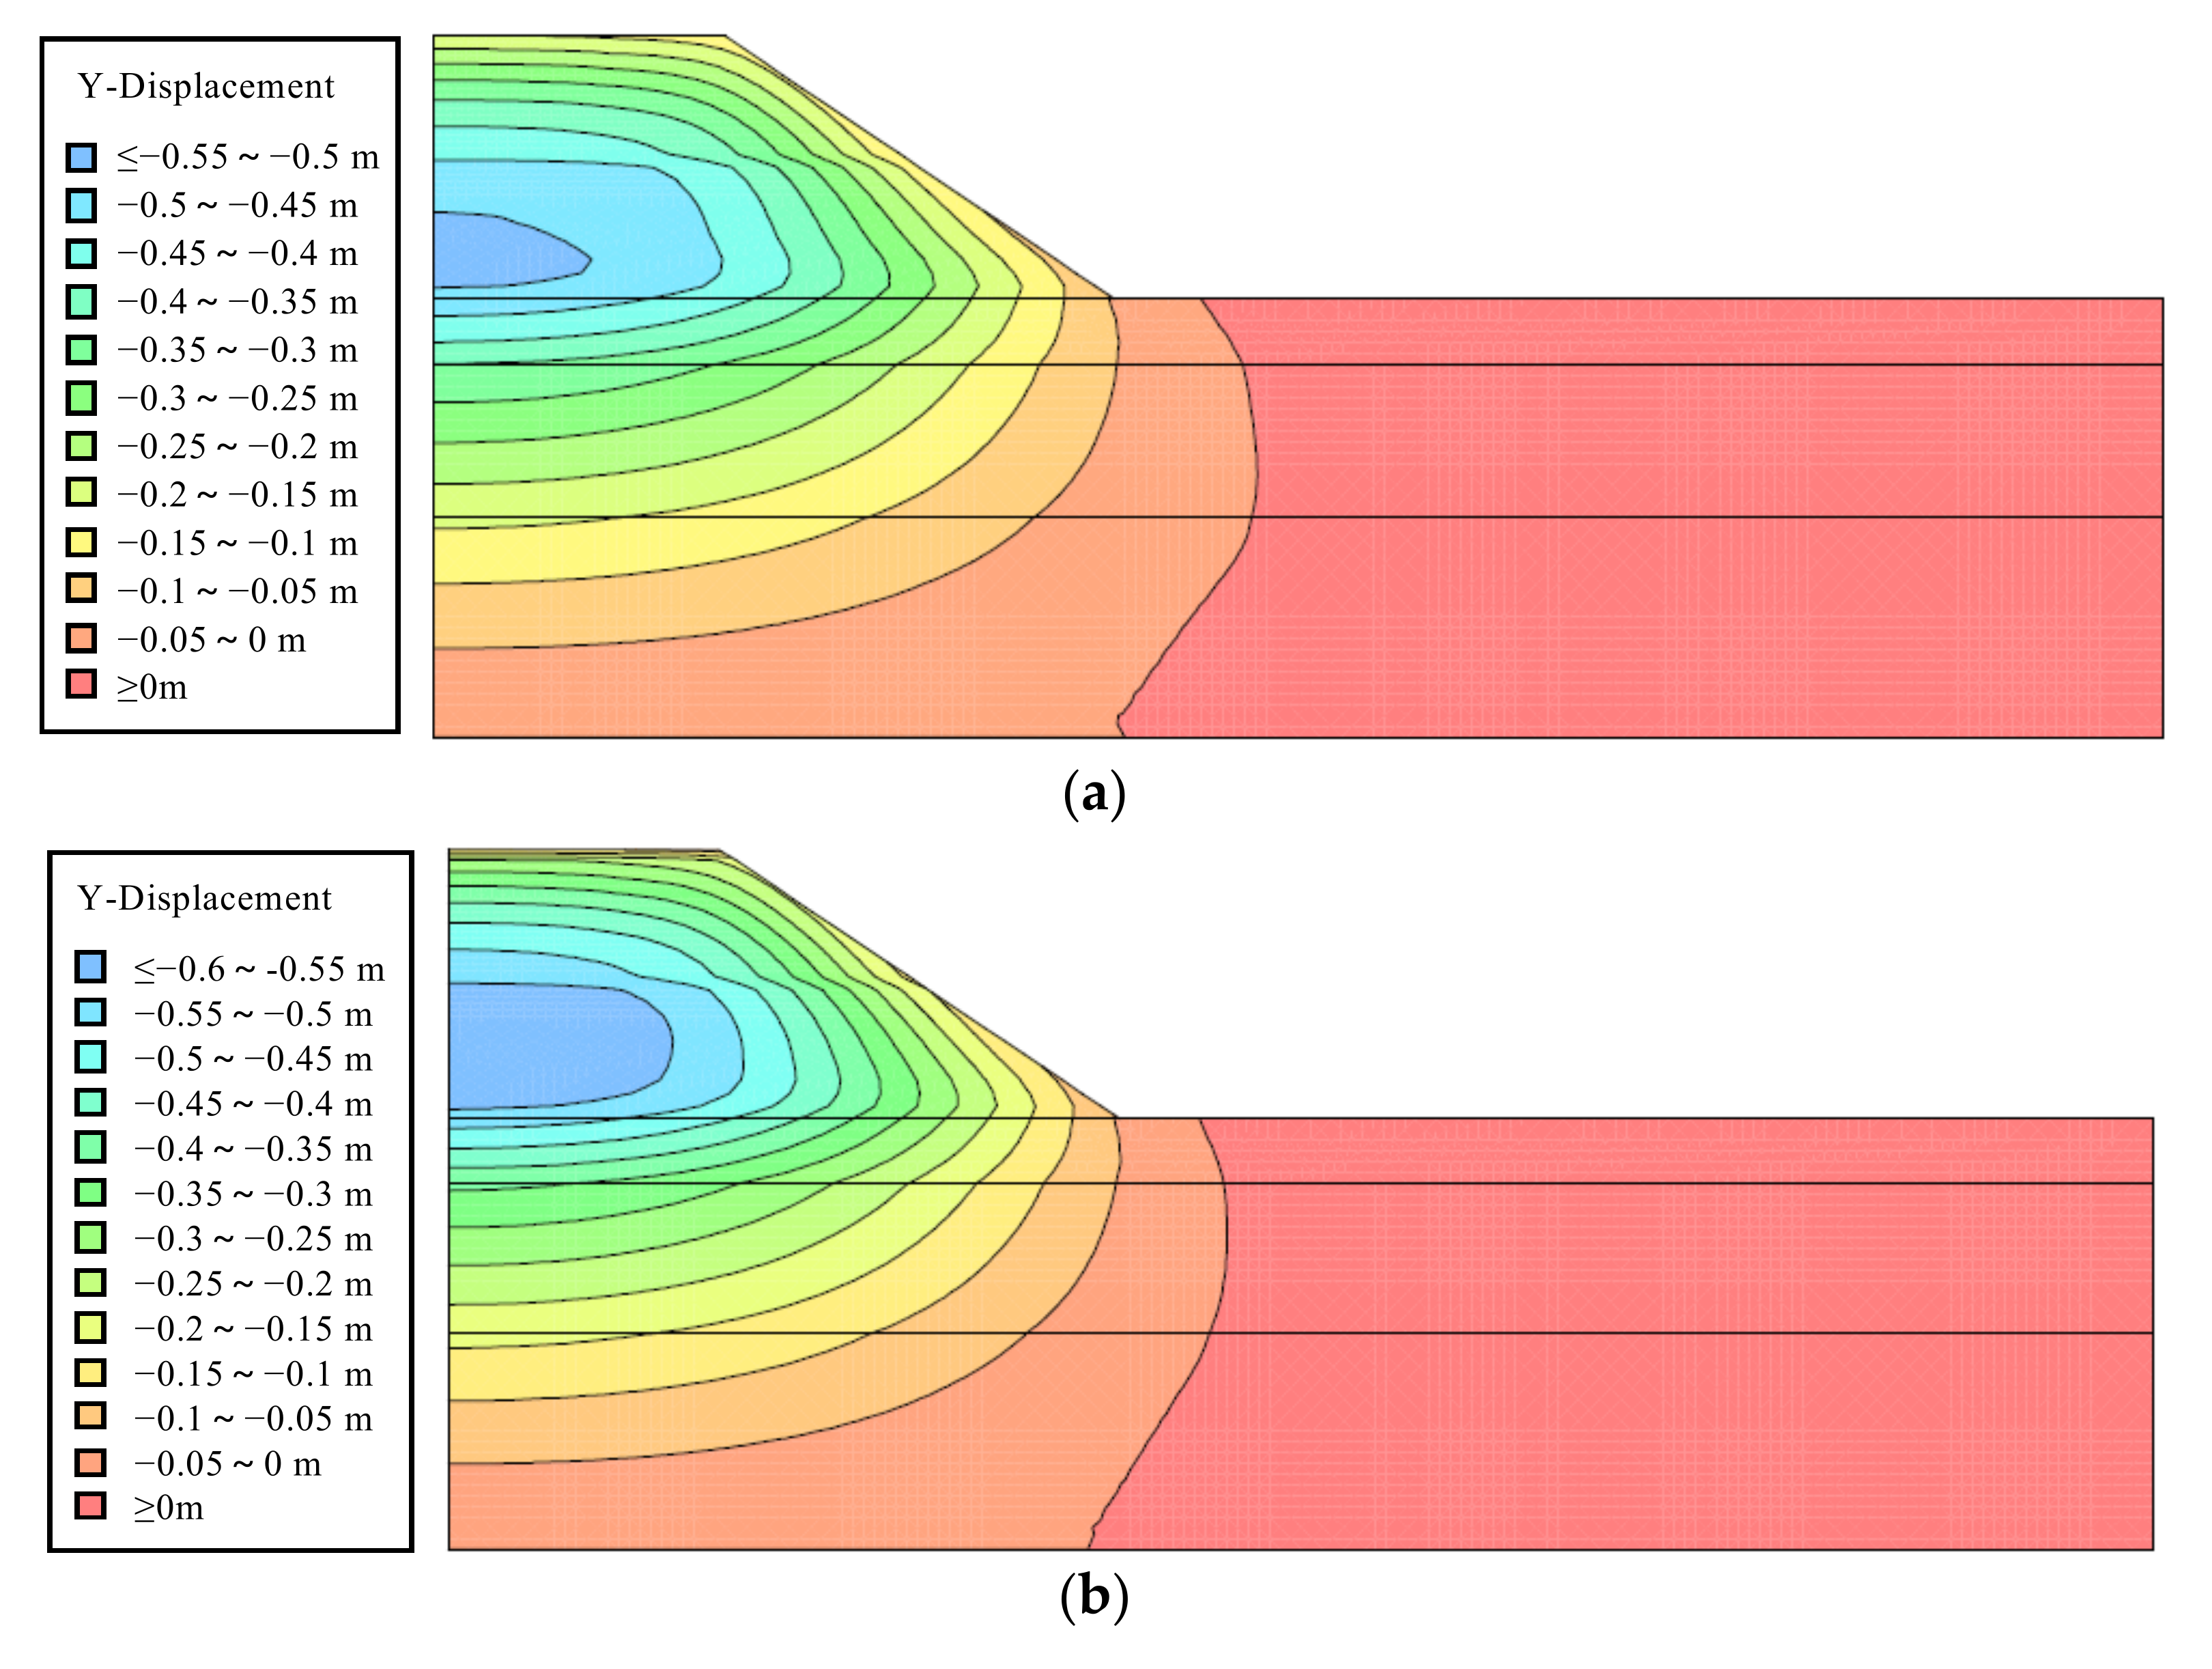
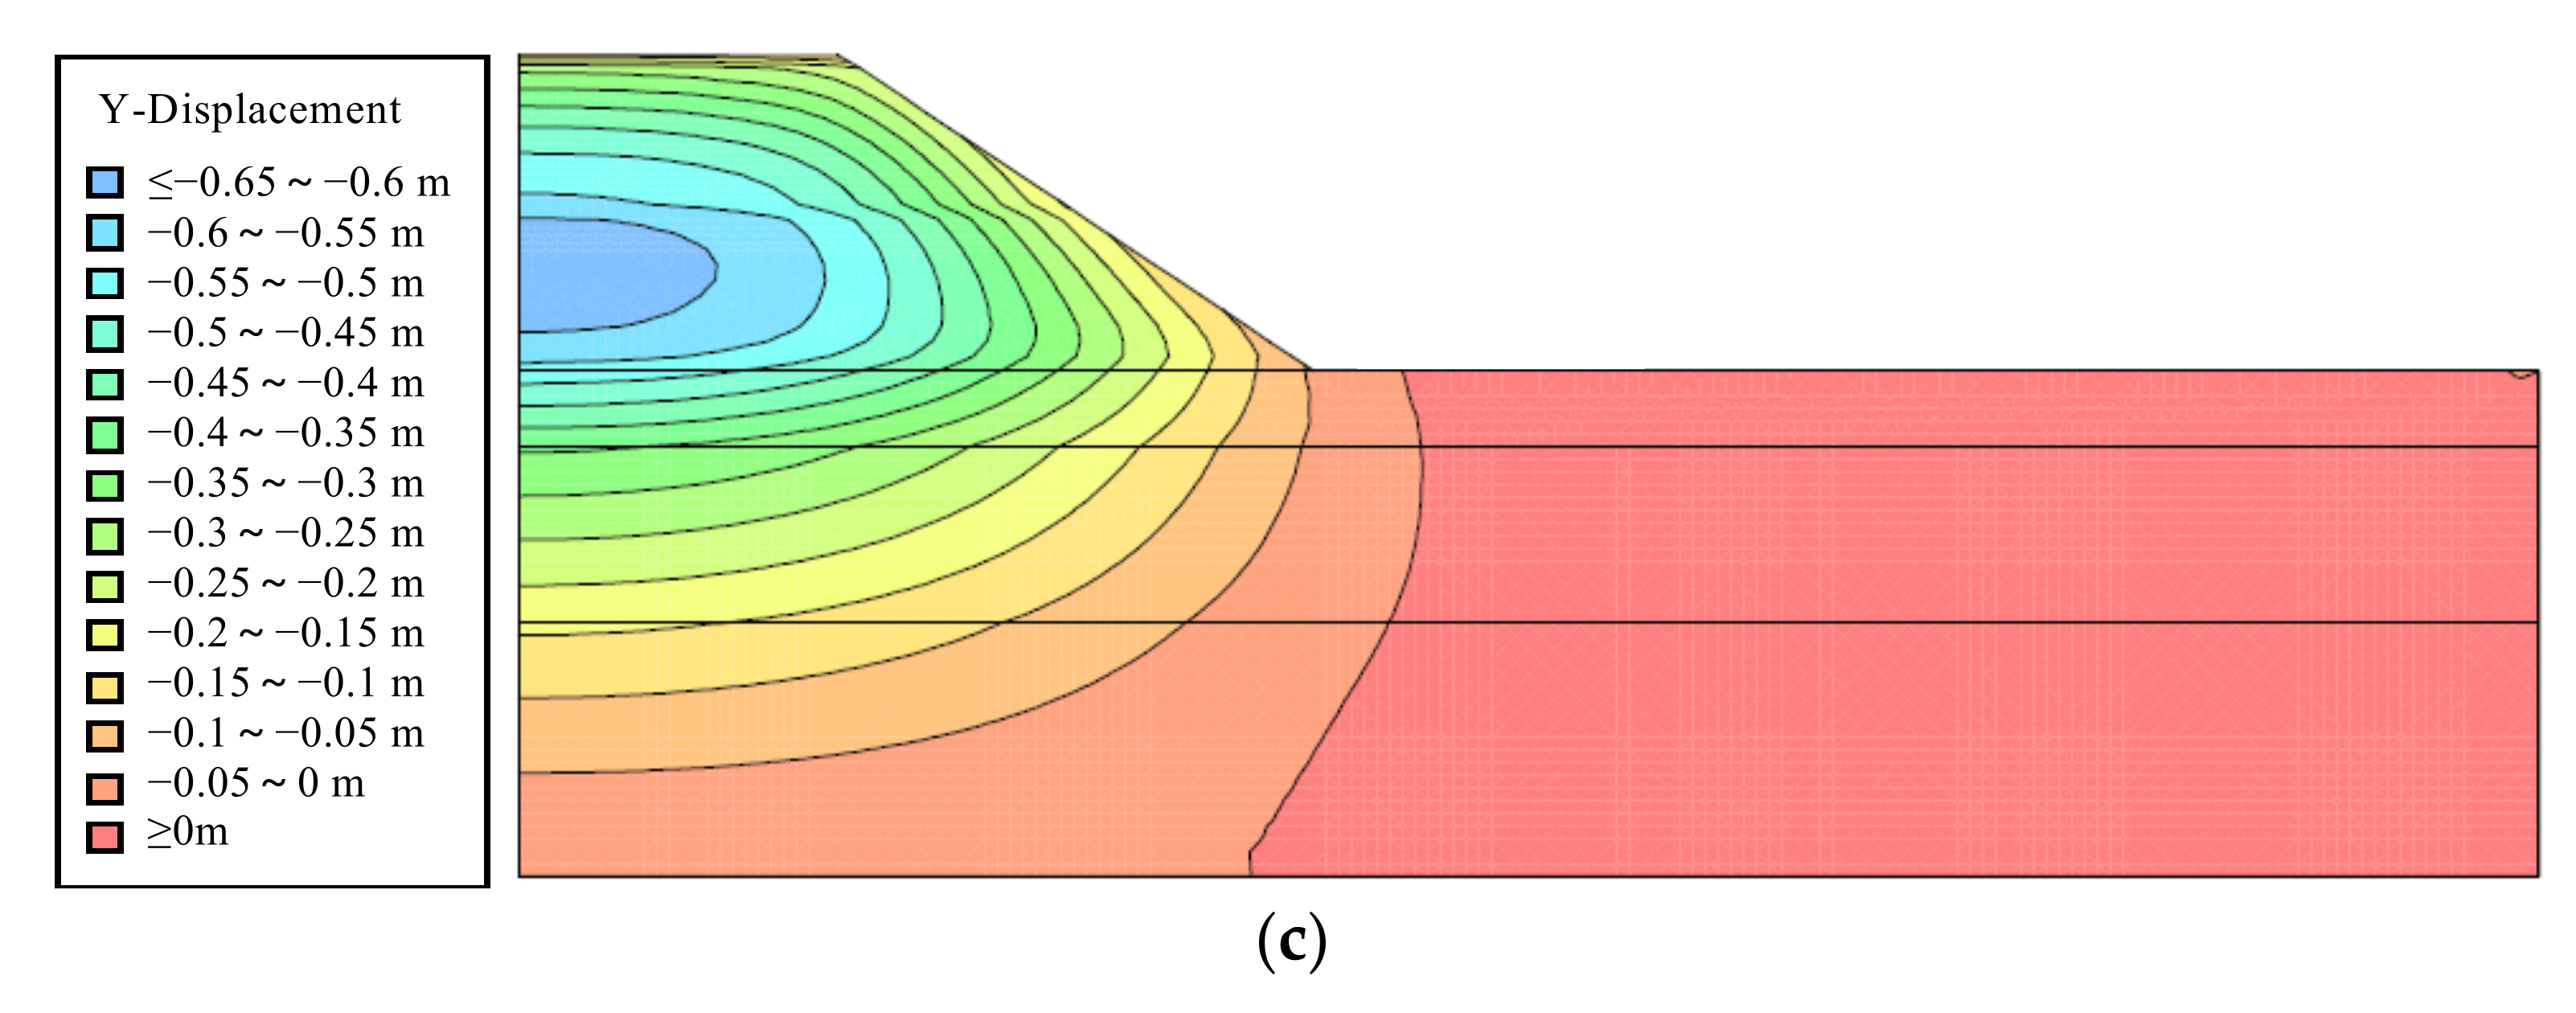
Figure 16.
Displacement nephograms at different times. (a) Displacement nephogram at the end of consolidation. (b) Displacement nephogram after one-year operation. (c) Displacement nephogram after two-year operation.
Figure 16.
Displacement nephograms at different times. (a) Displacement nephogram at the end of consolidation. (b) Displacement nephogram after one-year operation. (c) Displacement nephogram after two-year operation.
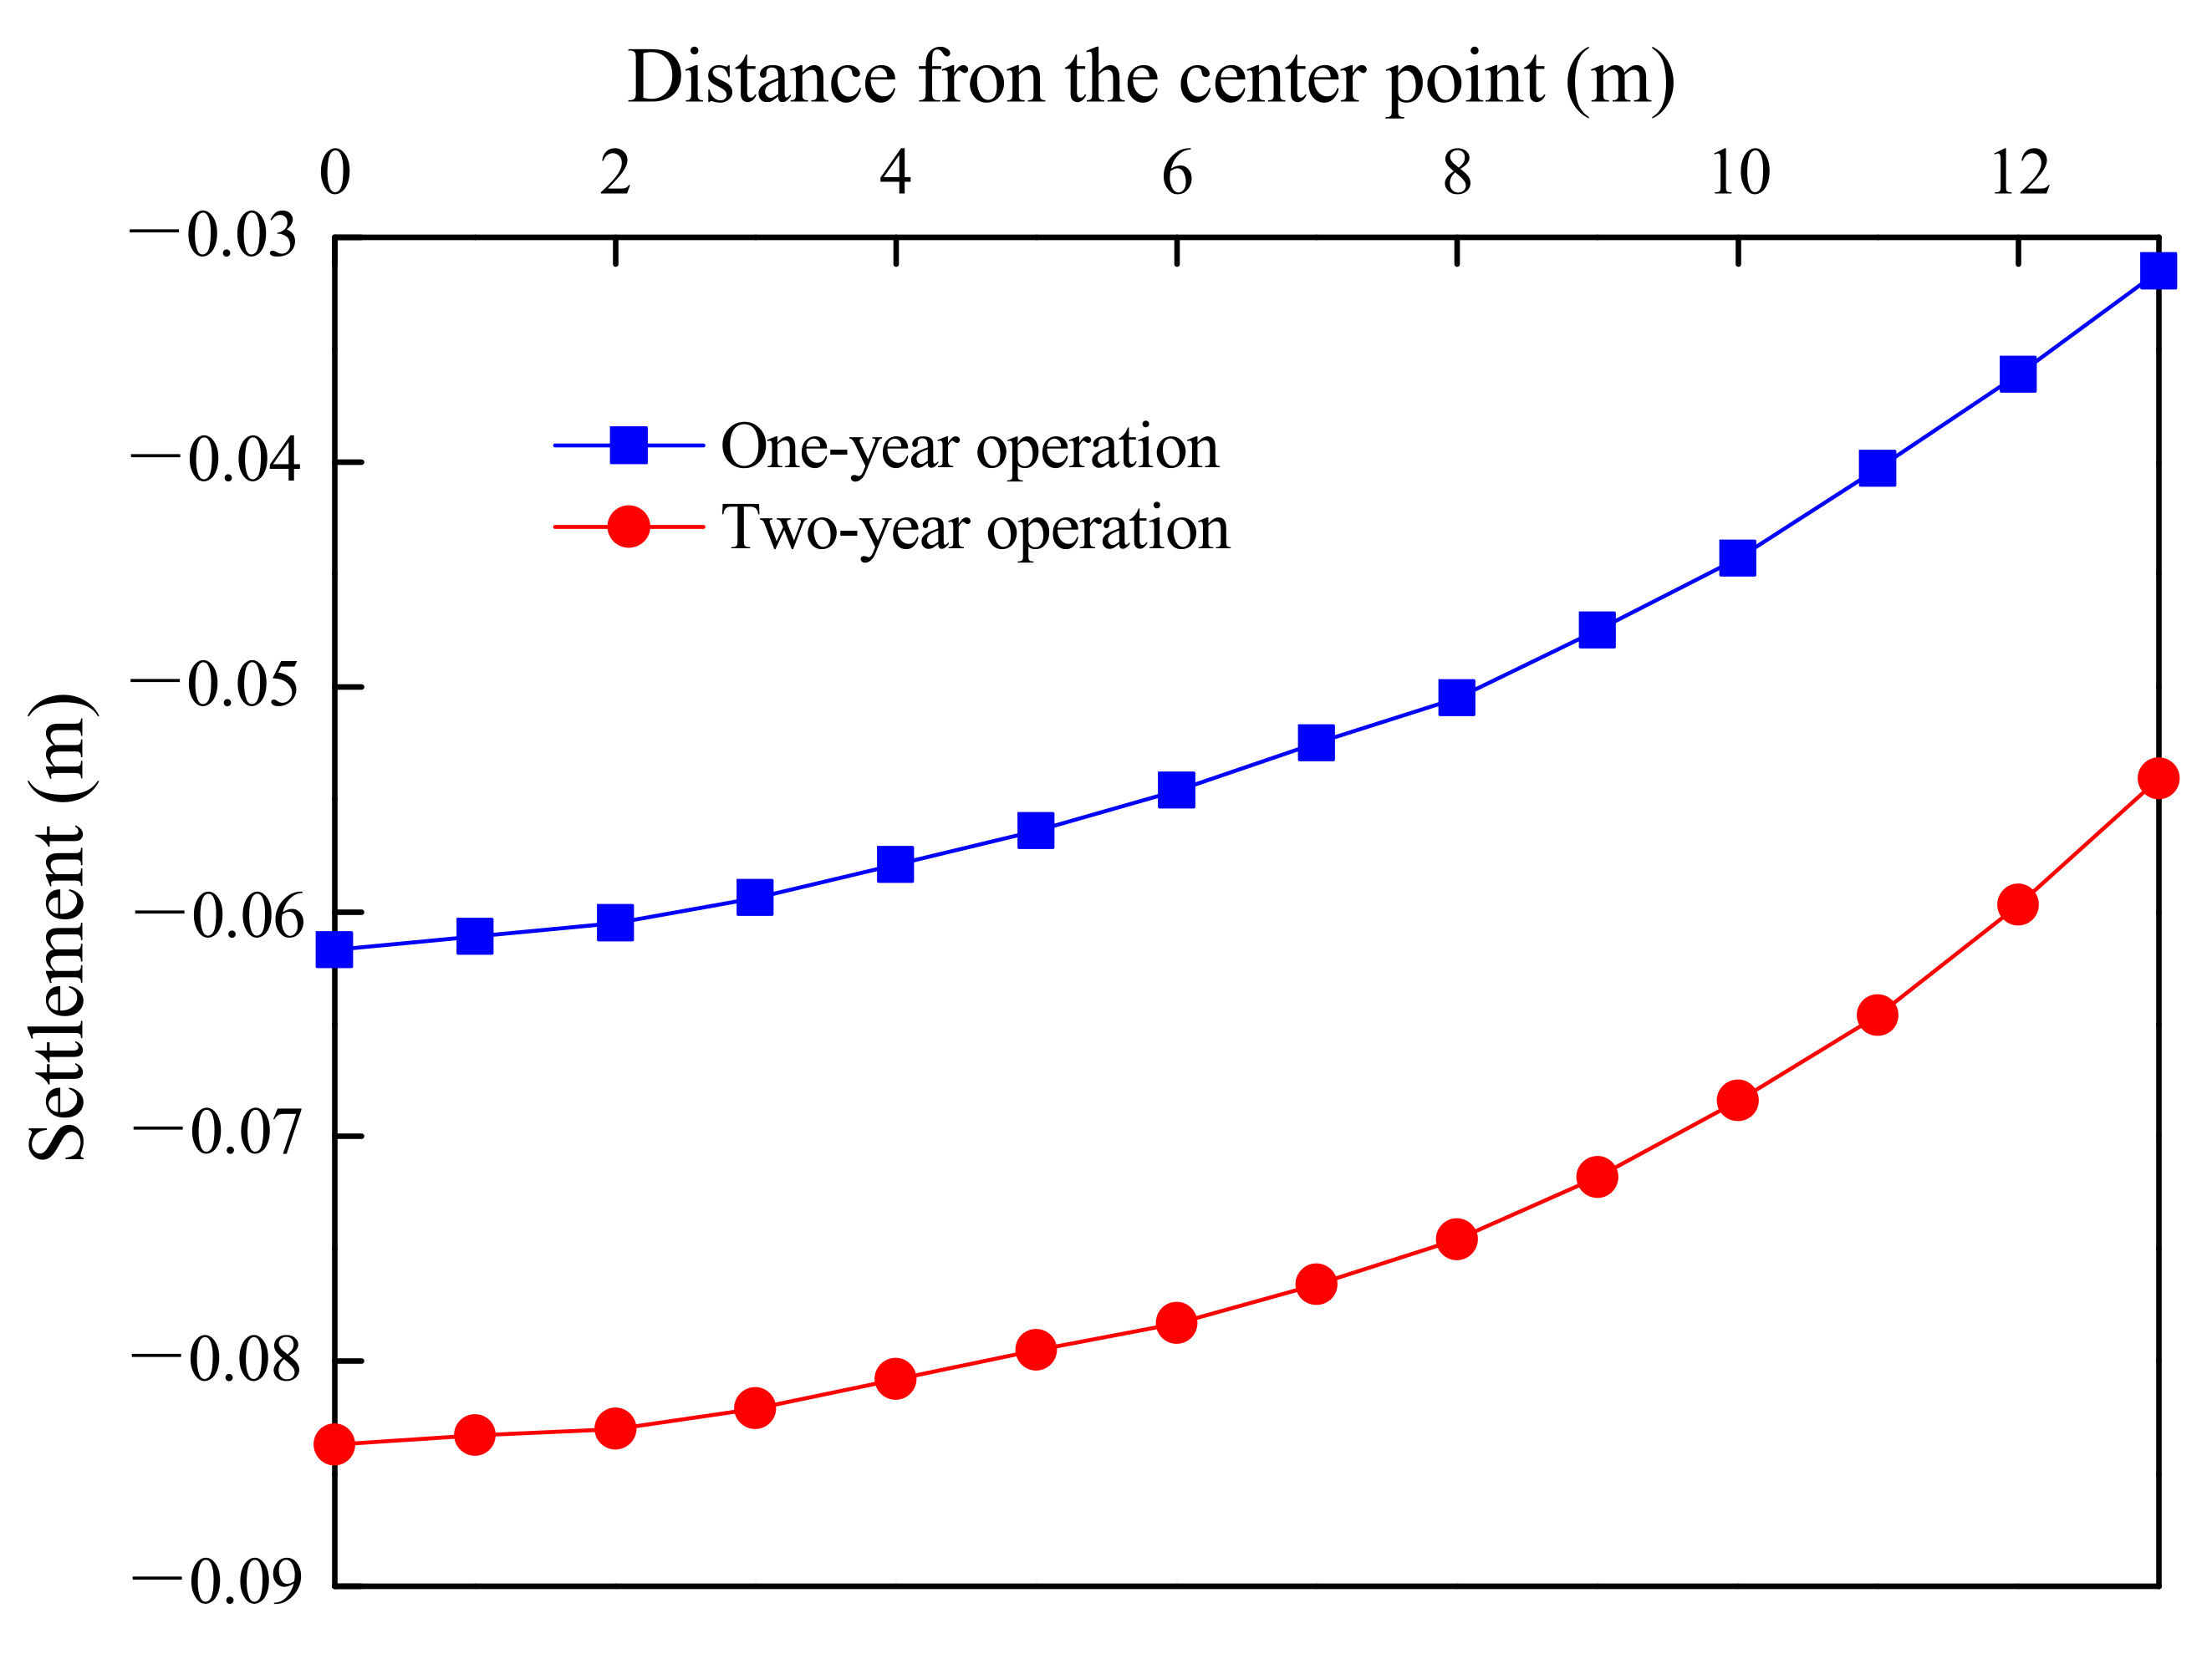
Figure 17.
Subgrade surface settlements after one- and two-year operations.
Figure 17.
Subgrade surface settlements after one- and two-year operations.
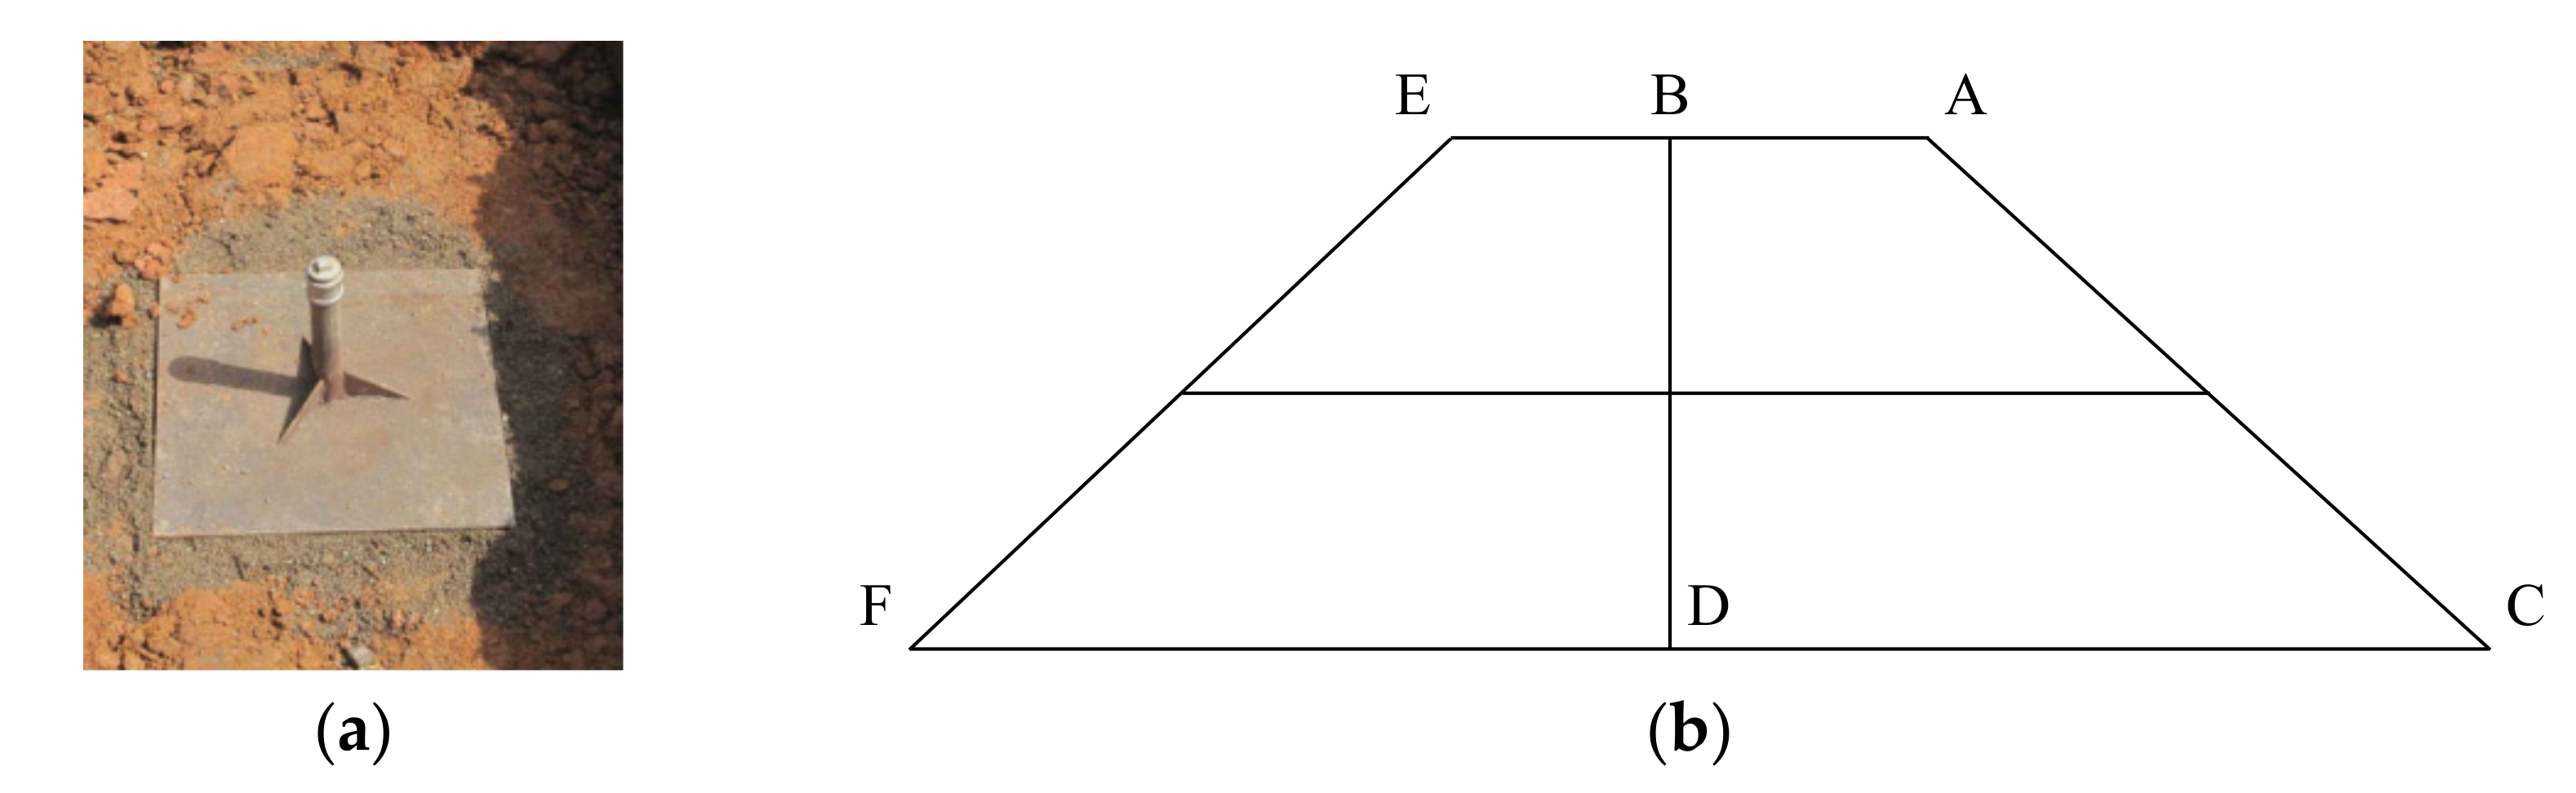
Figure 18.
Illustrnd arrangement of settlement plates. (a) Settlement plate. (b) Layout of monitoring points.
Figure 18.
Illustrnd arrangement of settlement plates. (a) Settlement plate. (b) Layout of monitoring points.
Table 1.
Coarse screening analysis data.
Table 1.
Coarse screening analysis data.
| Pore Size (mm) | Accumulated Quality of Remaining Soil (g) | Quality of Filtered Soil (g) | Mass Percentage of Filtered Soil to Soil Sample (%) |
|---|
| 40 | 0 | 2000 | 100 |
| 20 | 22.1 | 1977.9 | 98.9 |
| 10 | 102.2 | 1897.8 | 94.9 |
| 5 | 162.7 | 1837.3 | 91.9 |
| 2 | 249.6 | 1750.4 | 87.5 |
Table 2.
Fine screening analysis data.
Table 2.
Fine screening analysis data.
| Pore Size (mm) | Accumulated Quality of Remaining Soil (g) | Quality of Filtered Soil (g) | Mass Percentage of Filtered Soil to Fine Screening Soil Sample (%) | Mass Percentage of Filtered Soil to Soil Sample (%) |
|---|
| 2 | 249.6 | 1750.4 | 100 | 87.5 |
| 1 | 299.8 | 1700.2 | 97.1 | 85.0 |
| 0.5 | 362.9 | 1637.1 | 93.5 | 81.9 |
| 0.25 | 433.5 | 1566.5 | 89.5 | 78.3 |
| 0.075 | 482.4 | 1517.6 | 86.7 | 75.9 |
Table 3.
Analysis of mineral composition and chemical components.
Table 3.
Analysis of mineral composition and chemical components.
| Mineral Composition | SiO2 | Fe3O4 | Al2O3 | CaO | Ca2+ | Mg2+ | Cl− | SO42− |
|---|
| Percentage (%) | 56.19 | 7.02 | 33.58 | 3.30 | 0.002 | 0.0012 | 0.0617 | 0.05 |
Table 4.
Relationship between mineral composition and Sa.
Table 4.
Relationship between mineral composition and Sa.
| Mineral Composition | Montmorillonite | Illite | Kaolinite | Halloysite |
|---|
| Silicon–aluminum molecular ratio Sa | >4 | 3.0–3.2 | 2.0–2.2 | 2.0–2.2 |
Table 5.
Compaction test results.
Table 5.
Compaction test results.
| Number | 1 | 2 | 3 | 4 | 5 | 6 |
|---|
| Expected moisture content, ωe (%) | 13 | 15 | 17 | 19 | 21 | Natural moisture content |
| Density, ρ (g·cm−3) | 1.58 | 1.67 | 1.74 | 1.77 | 1.76 | 1.77 |
| Moisture content, ω (%) | 12.4 | 14.3 | 17.1 | 19.3 | 21.1 | 30.3 |
| Dry density, ρd (g·cm−3) | 1.41 | 1.46 | 1.49 | 1.48 | 1.45 | 1.36 |
Table 6.
Minimum CBR requirements for filling materials of subgrade.
Table 6.
Minimum CBR requirements for filling materials of subgrade.
| Subgrade Name | Depth below Pavement Bottom (cm) | Minimum CBR of Filling Material (%) |
|---|
| Highway, First-Class Road | Second-Class Road |
|---|
| Upper roadbed | 0~30 | 8 | 6 |
| Lower roadbed | 30~80 | 5 | 4 |
| Upper embankment | 80~150 | 4 | 3 |
| Lower embankment | Larger than 150 | 3 | 2 |
Table 7.
Test results for sample CBR.
Table 7.
Test results for sample CBR.
| Compaction Degree (%) | Dry Density before Water Absorption (g·cm−3) | Dry Density after Water Absorption (g·cm−3) | Expansion Rate (%) | CBR (%) | Pore Size (mm) |
|---|
| 93 | 1.39 | 1.38 | 1.80 | 0.66 | 40 |
| 94 | 1.40 | 1.39 | 2.30 | 1.08 | 20 |
| 96 | 1.43 | 1.40 | 3.50 | 1.63 | 10 |
| 100 | 1.49 | 1.45 | 5.80 | 2.95 | 5 |
Table 8.
Resilience moduli under the conditions of different moisture contents.
Table 8.
Resilience moduli under the conditions of different moisture contents.
| Number | Compaction Degree (%) | Moisture Content (%) | Resilience Modulus (MPa) |
|---|
| 1 | 96 | 15.2 | 20.5 |
| 2 | 16.3 | 22.1 |
| 3 | 17.0 | 24.2 |
| 4 | 18.2 | 21.6 |
| 5 | 19.5 | 18.4 |
Table 9.
Resilience moduli under the conditions of different compaction degrees.
Table 9.
Resilience moduli under the conditions of different compaction degrees.
| Number | Moisture Content (%) | Compaction Degree (%) | Resilience Modulus (MPa) |
|---|
| 1 | 17.2 | 93 | 20.1 |
| 2 | 94 | 22.4 |
| 3 | 96 | 26.3 |
Table 10.
Physical properties of tunnel slag.
Table 10.
Physical properties of tunnel slag.
| Density (g·cm−3) | Apparent Density (g·cm−3) | Crushing Index (%) | Particle Size, d (mm) |
|---|
| 5 ≤ d < 10 | 10 ≤ d < 20 | 20 ≤ d < 40 |
|---|
| 1.65 | 2.71 | 18.5 | 28% | 42% | 30% |
Table 11.
The optimal moisture content and maximum dry density of tunnel-slag-improved high liquid limit soil.
Table 11.
The optimal moisture content and maximum dry density of tunnel-slag-improved high liquid limit soil.
| Number | Tunnel Slag Content (%) | Optimal Moisture Content (%) | Maximum Dry Density (g·cm−3) |
|---|
| 1 | 0 | 17.2 | 1.49 |
| 2 | 5 | 15.4 | 1.55 |
| 3 | 10 | 14.2 | 1.58 |
| 4 | 15 | 13.5 | 1.65 |
| 5 | 20 | 13.2 | 1.69 |
| 6 | 25 | 13.0 | 1.71 |
Table 12.
Physical and mechanical parameters of soils obtained from geological survey report and experimental tests.
Table 12.
Physical and mechanical parameters of soils obtained from geological survey report and experimental tests.
| Group | Bulk Density (kN/m3) | Thickness (m) | Young’s Modulus E (MPa) | Poisson’s Ratio, μ | Cohesion, c (kPa) | Internal Friction Angle, φ (°) |
|---|
| Improved high liquid limit soil | 16.5 | 12 | 2.8 | 0.3 | 35 | 28 |
| Subclay | 18.6 | 3 | 2.7 | 0.33 | 19.3 | 23 |
| Residual clay | 19.2 | 7 | 6.6 | 0.32 | 22 | 27 |
| Strongly weathered silty sandstone | 20.1 | 10 | 9.4 | 0.31 | 15.1 | 35 |
Table 13.
Safety factors of subgrade slope.
Table 13.
Safety factors of subgrade slope.
| Analysis Method | Swedish Arc Method | Bishop Slice Method | Janbu Method | Morgenstern–Price Method |
|---|
| Safety factor | 1.457 | 1.501 | 1.392 | 1.548 |
Table 14.
Accumulated settlement of the section K58 + 350.
Table 14.
Accumulated settlement of the section K58 + 350.
| Days | Accumulated Settlement (mm) |
|---|
| A | B | E | C | D | F |
|---|
| 0 | - | - | - | 0 | 0 | 0 |
| 5 | - | - | - | 10.3 | 87.1 | 10.1 |
| 10 | - | - | - | 18.4 | 184.1 | 18.0 |
| 25 | - | - | - | 29.3 | 205.5 | 28.5 |
| 40 | - | - | - | 31.2 | 216.2 | 30.4 |
| 45 | - | - | - | 30.1 | 298.8 | 29.4 |
| 50 | 0 | 0 | 0 | 29.4 | 388.9 | 28.6 |
| 65 | 17.6 | 18.8 | 18.0 | 37.1 | 411.3 | 36.2 |
| 80 | 29.3 | 31.5 | 29.9 | 40.1 | 426.2 | 39.1 |
| 95 | 39.1 | 42.2 | 39.9 | 42.0 | 438.5 | 40.9 |
| 110 | 47.6 | 51.6 | 48.6 | 43.3 | 449.0 | 42.3 |
| 125 | 55.0 | 60.0 | 56.2 | 44.2 | 458.1 | 43.2 |
| 140 | 61.5 | 67.4 | 62.8 | 44.8 | 467.8 | 43.8 |
| 155 | 67.0 | 74.0 | 68.5 | 45.3 | 472.4 | 44.2 |
| 170 | 71.8 | 79.5 | 73.3 | 45.6 | 477.3 | 44.5 |
| 185 | 76.0 | 84.2 | 77.6 | 45.9 | 481.0 | 44.8 |
| 200 | 79.9 | 88.7 | 81.6 | 46.1 | 484.2 | 45.0 |
| 215 | 83.6 | 92.8 | 85.4 | 46.2 | 487.1 | 45.1 |
| 230 | 87.1 | 96.7 | 89.0 | 46.3 | 489.6 | 45.2 |
Table 15.
Comparison of subgrade settlements between numerical results and monitoring data.
Table 15.
Comparison of subgrade settlements between numerical results and monitoring data.
| Position | Settlement (mm) | Error |
|---|
| Numerical Result | Monitoring Data | Difference (mm) | Percentage (%) |
|---|
| A | 84.5 | 87.1 | 2.6 | 3.1 |
| B | 98.4 | 96.7 | −1.7 | −1.7 |
| C | 44.3 | 46.3 | 2.0 | 4.4 |
| D | 480.0 | 489.6 | 9.6 | 2.0 |


