1. Introduction
Increasing demands on components’ functionality has led to novel concepts for their manufacturing, together with the application of progressive materials [
1,
2,
3]. The high tempered steels undergo the conventional quenching process when a component is rapidly cooled down from a high temperature, followed by tempering in the furnace at an elevated temperature. The final hardness and the corresponding microstructure is usually a function of tempering temperature. Such heat treatment produces a matrix in which the outstanding combination of hardness and toughness is mixed. Components made of these steels are produced mostly via machining cycles and a subsequent final surface treatment. The term hard machining (hard turning) is usually associated with the steels of hardness above 50 HRC. On the other hand, some aspects predominant in hard turning cycles can be found during machining of the steels below this threshold as well, especially the formation of a surface white layer (WL) as a re-hardened matrix [
4]. WL is produced on machined surface when the temperature in the flank wear land is above 770 °C followed by the high cooling rate. Such conditions are met when flank wear
VB exceeds a certain threshold [
2,
4]. Thermally softened layer (dark region) lying below the near surface WL usually cannot be recognized in the case of high tempered samples due to the shadowing effect of the previous tempering in the furnace during heat treatment. WL thickness is affected mainly by the size of
VB region and the main cutting motion
vc [
4,
5,
6,
7,
8]. In contrast with grinding, dislocation density in WL after turning is usually higher, causing severely strained matrix [
4,
8,
9]. Despite high temperatures and superimposing high stresses, the size of the carbides inside WL remains unchanged, whereas martensite matrix is refined down to several tens of nanometers [
8,
10,
11,
12]. Li et al. [
11] also reported the steep grain size gradient in the near surface region. Ramesh et al. [
12] investigated microstructure of WL of hardened steel 52100 and discussed the significance of thermal cycle. The deep insight into thermal cycle during formation of WL was reported by Hosseini et al. [
13] as well. It should be mentioned that the surface state of quenched steel remarkably affects its functional properties as was reported in new studies [
14,
15,
16]. Contribution of WL depends on the manner in which surface after hard turning is exploited [
17,
18]. Presence of WL is acceptable in the sliding contact whereas the cycling rolling contact is quite sensitive to the surface re-hardening [
17,
18,
19].
Machining cycles are usually performed at constant cutting conditions in production of real industrial components whereas tool wear and the corresponding cutting edge geometry change. Developed deviations in tool geometry affect energy consumption and the corresponding cutting force. It should be noted that this energy is converted into the heat and high temperatures in the cutting zone strongly affect the surface state of turned parts. It was reported that WL at low
VB is low or missing [
20], followed by continuous increase in cutting force and WL thickness at higher
VB. However, measured components
Fc and
Fp are composed of those consumed in the tool-chip interface (
Fγ) and flank wear land (
Fα). For this reason, only the shear and normal components of
Fα should be involved in correlation analyses in which surface state of produced parts is analysed.
Wang and Liu [
8] employed Green’s function in order to distinguish between
Fα and
Fγ and their normal and shear components). The authors demonstrated the strong correlation between
VB and WL thickness as well as the growth of
Fα and moderate decrease in
Fγ when flank wear becomes more developed. However, Neslušan et al. [
7] reported on the methodology for experimental decomposition of cutting force components and indicated that the components of
Fγ grow due to crater wear. The authors carried out the measurement of cutting force components and their decomposition as a function of
VB. It is worth mentioning that cutting force components (especially their shear components) can be linked with the thermal load of the machined surface as almost the whole mechanical energy consumed by the turning process is converted into heat. For this reason, cutting force decomposition also provides information about the superimposing thermal effects.
This study investigates the surface state of the high tempered bearing steel after turning. The investigation is focused on the observation of surface roughness, WL thickness and its microhardness as a function of
VB, as well as cutting speed
vc based on the measurement of cutting force components and their decomposition, as reported in [
7]. Finally, the thermal load of the produced surfaces is discussed as well. As contrasted with the previous studies [
5,
6,
8], this study provides deeper insight into pure contribution of the shear and normal components in the different regions and their relationship to the thermal load. As compared with the study of Wang and Liu [
8] or our previous work [
7], this study also discusses contribution of the thermal cycle duration, as well as the role of specific heat to the thickness of WL. Finally, as compared with [
7], thermal cycle and the produced WL are investigated as a function of cutting speed and supplemented by the measurement of microhardness in WL.
2. Experimental Setup
The experiments were performed on the high tempered steel 100Cr6 (40 ± 2 HRC, temperature of austenitisation 840 °C, quenching temperature 60 °C followed by 2 h tempering at 530 °C). The sample dimensions were: outer diameter 55 mm, inner diameter 40 mm, and length 70 mm. Details associated with turning process are listed in
Table 1. Cutting feed, depth, and speed were chosen on the base of recommendations provided by the producer of inserts. Moreover, these cutting conditions can be considered as the conventional parameters for hard machining cycles, especially when the cutting depth and feed should be kept low with respect of thermal softening effect in the cutting zone.
The inserts with sufficiently high VB were used in this study to make WL as thick as possible. Furthermore, the influence of variable cutting speed (as the additional aspects remarkably contributing to WL thickness) was investigated as well.
The decomposition of cutting force components is illustrated in
Figure 1. Separation of the shear and normal components
Fαt,
Fαtn,
Fγt, and
Fγtn was carried out by the use of a sample with a variable cutting depth [
6]. Further details about the methodology, the employed equations, a brief sketch of the turned sample, and the appearance of tool wear land, can be found in the previous study [
7].
The cutting edge geometry alterations were investigated by Alicona 5 device (IF-Edge MasterModule) (Alicona Imaging GmbH, Graz, Austria) at the different phases of VB. The rake angle γn as well as the cutting edge radius rn were obtained from 25 measurements regularly distributed along the cutting edge length. Chip’s morphology was observed in scanning electron microscope (SEM) ZEISS Auriga Compact (AZoNetwork UK Ltd., Manchester, UK). The surface roughness was measured by Hommeltester T 2000 (Hommelwerke GmbH, Schwenningen, Germany) along 4 × 0.8 mm length (probe T 100).
Measurement of Fc as well as Fp was carried out by the use of a dynamometer Kistler 9441 (sampling frequency 2 kHz, DasyLab software- measX GmbH, Aachen, Germany). Fc as well as Fp were obtained by averaging the three repetitive passes after the signal filtration (the low pass filter 20 Hz). To reveal the microstructural transformations induced by hard turning (for ap = 0.25 mm and direction of Fc), 10 mm long pieces were prepared for metallographic observations (etched by 5% Nital for 8 s). Microhardness measurement of HV 0.05 in WL was carried out only for samples turned by the insert of VB = 0.8 mm because the thickness of WL was sufficiently high only for this VB. Microhardness measurements were carried out using an Innova Test 400 TM (50 g for 10 s) (Innovatest, Maastricht, The Netherlands) on the cross sectional cuts after metallographic observations. Five repetitive measurements of WL thickness, microhardness, and surface roughness were carried out (average values as well as the corresponding standard deviations were calculated and provided in the paper).
3. Results and Discussion
The recorded cutting force evolutions (as that illustrated in
Figure 2) show five different stages. The initial stage is associated with zero cutting depth (elastic deformation of the produced surface only [
21]) whereas the consecutive stages represent the increasing
ap in which chip is generated. Measured
Fc as well as
Fp are progressively growing along with
ap but saturation of this growth can be observed at higher
VB and
ap.
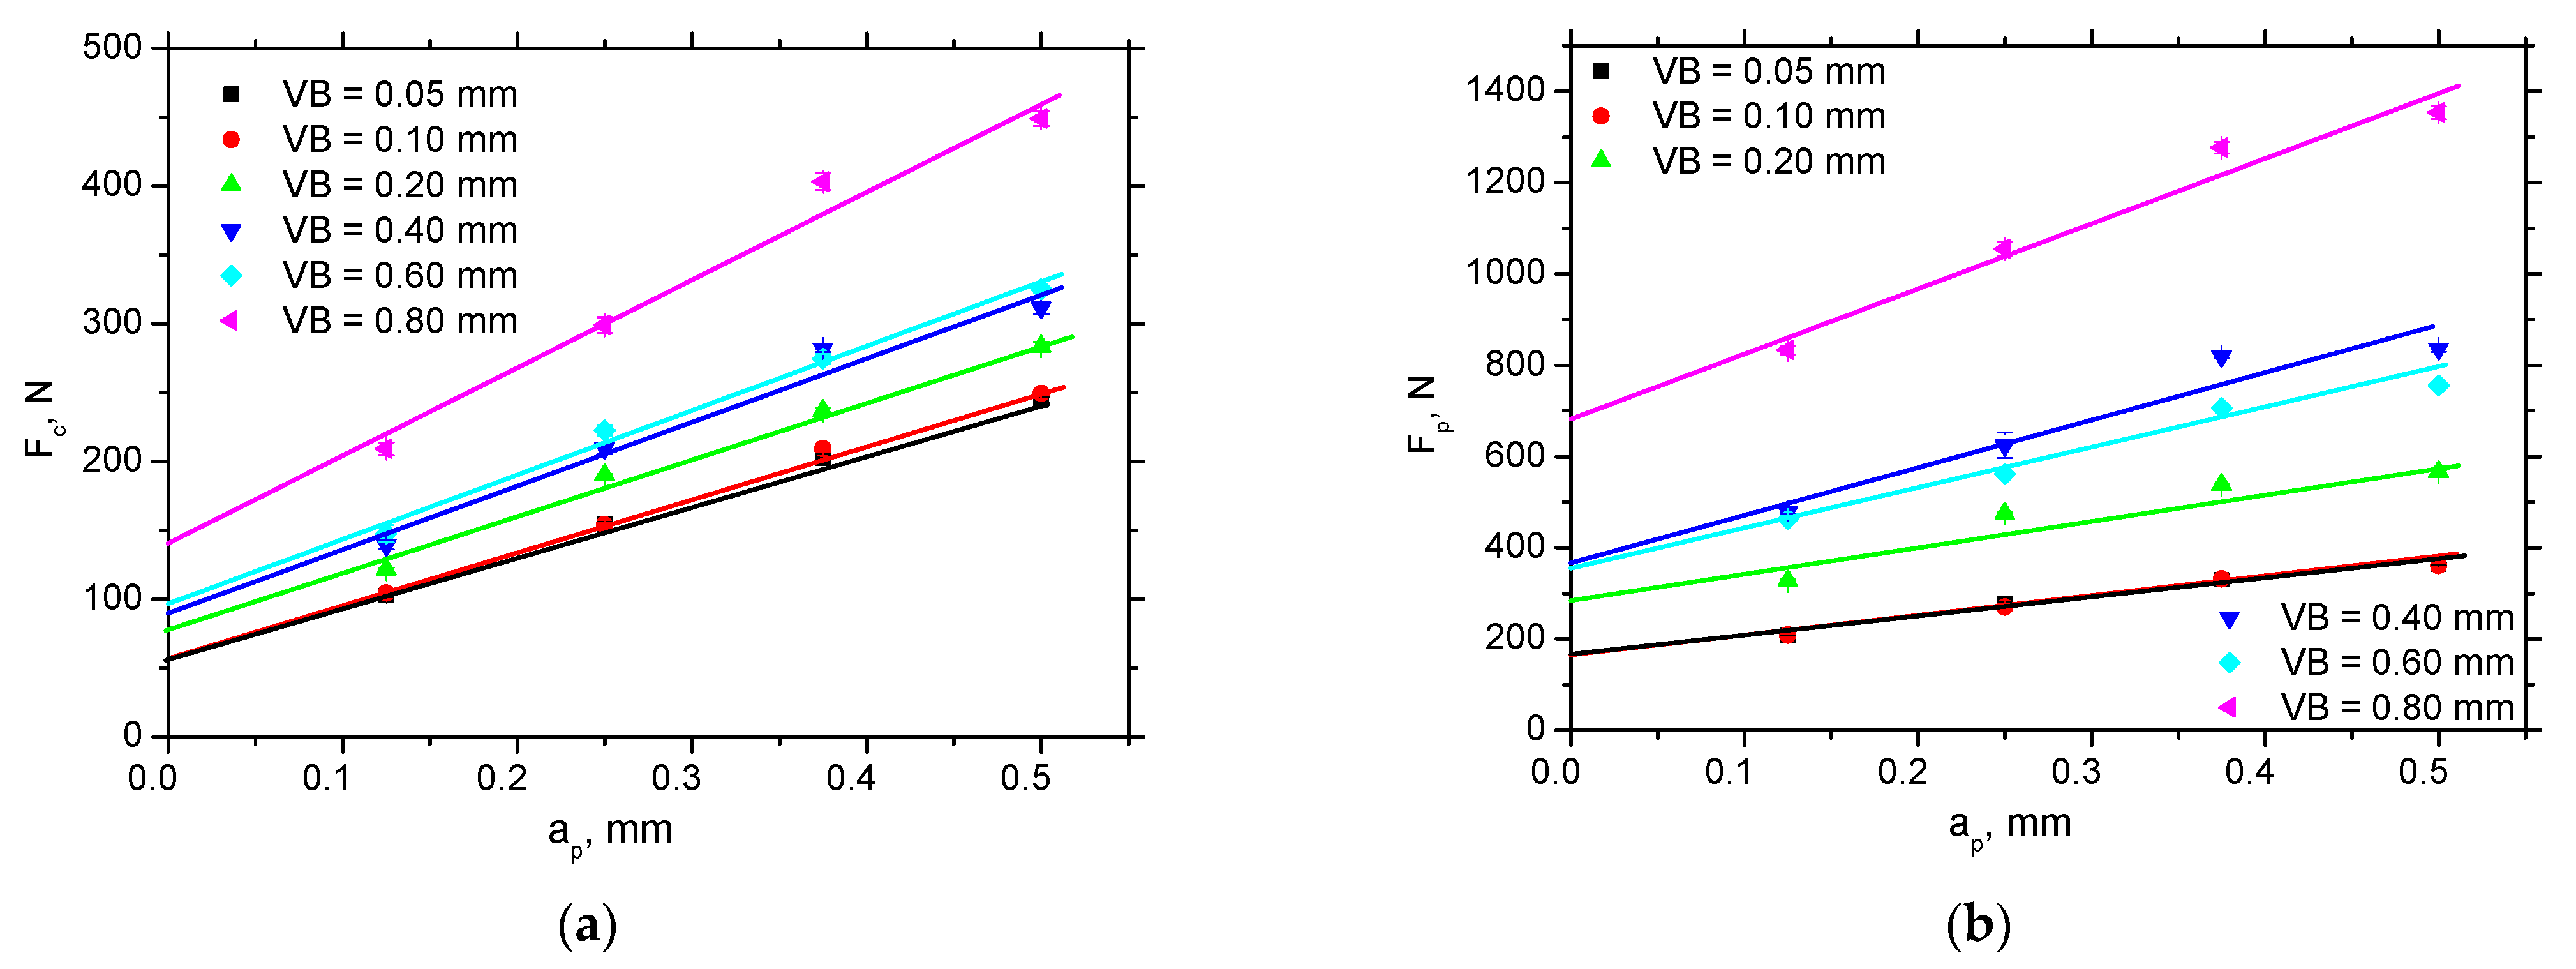
The evolution of
VB versus a
p appears to be linear (see
Figure 3). It is known that the cutting forces grow along with cutting depth is driven by the power law but the exponent for the cutting depth is near by 1 [
3]. For this reason, the linear fit for the measured components is reasonable. The increase in
Fp is higher than
Fc. A much steeper increase can be found for
VB = 0.8 mm, whereas only a moderate one can be reported for lower
VB (especially in the case of
Fc). The similar evolution can be found for the extracted components
Fαt and
Fαtn (see the values in
Table 2). The average friction coefficient (
Fαt/
Fαtn) drops down along with
VB due to predominate grow of
Fαtn components (see also the values in
Table 2). Note that the values in
Table 2 represent the average values in the flank wear land. In reality, a heterogeneous distribution is observed [
22] but the simplified uniform model is employed in this particular case.
It was reported [
8] that
Fγ moderately decreases along with
VB in hard tuning. On the other hand, it was also demonstrated [
23,
24] that the components associated with chip formation are unchanged when turning annealed steel. It should be considered that the process of tool wear is complex and involves the alterations of tool rake geometry as well (see appearance of the cutting edge in [
7]). For this reason,
Fγc and
Fγp also grow (see
Figure 4) as a results of altered rake angle and cutting edge radius (see
Table 2).
Figure 4 also depicts that the changes in the rake angle geometry strongly affect the normal components of
Fγ as compared with the shear one.
Plasticity in the cutting zone in the case of hardened matrix is due to its self-heating (matrix softens and becomes formable [
25,
26]) as well as the superimposing high hydrostatic pressure [
27]. However, matrix softening occurs near the cutting edge only and vanishes along with increasing distance from the tool-chip interface. For this reason,
Fγc and
Fγp are growing versus
ap. The changes in shear instability and the corresponding shape of produced segmented chips (see
Figure 5) are due to the alterations in thermal and stress state in the tool-chip interface as a result of altered tool rake geometry [
2,
7,
28]. It can be seen that the more developed crater wear increases the distance between the neighbouring segments, their size, and degree of chip segmentation [
7], as well as the corresponding segmentation frequency [
3]. This is a result of prolonged accumulation of stress ahead of the cutting edge and its abrupt release when the segment is initiated by the brittle cracking on the free surface [
25]. Such behaviour has been already reported [
3,
28].
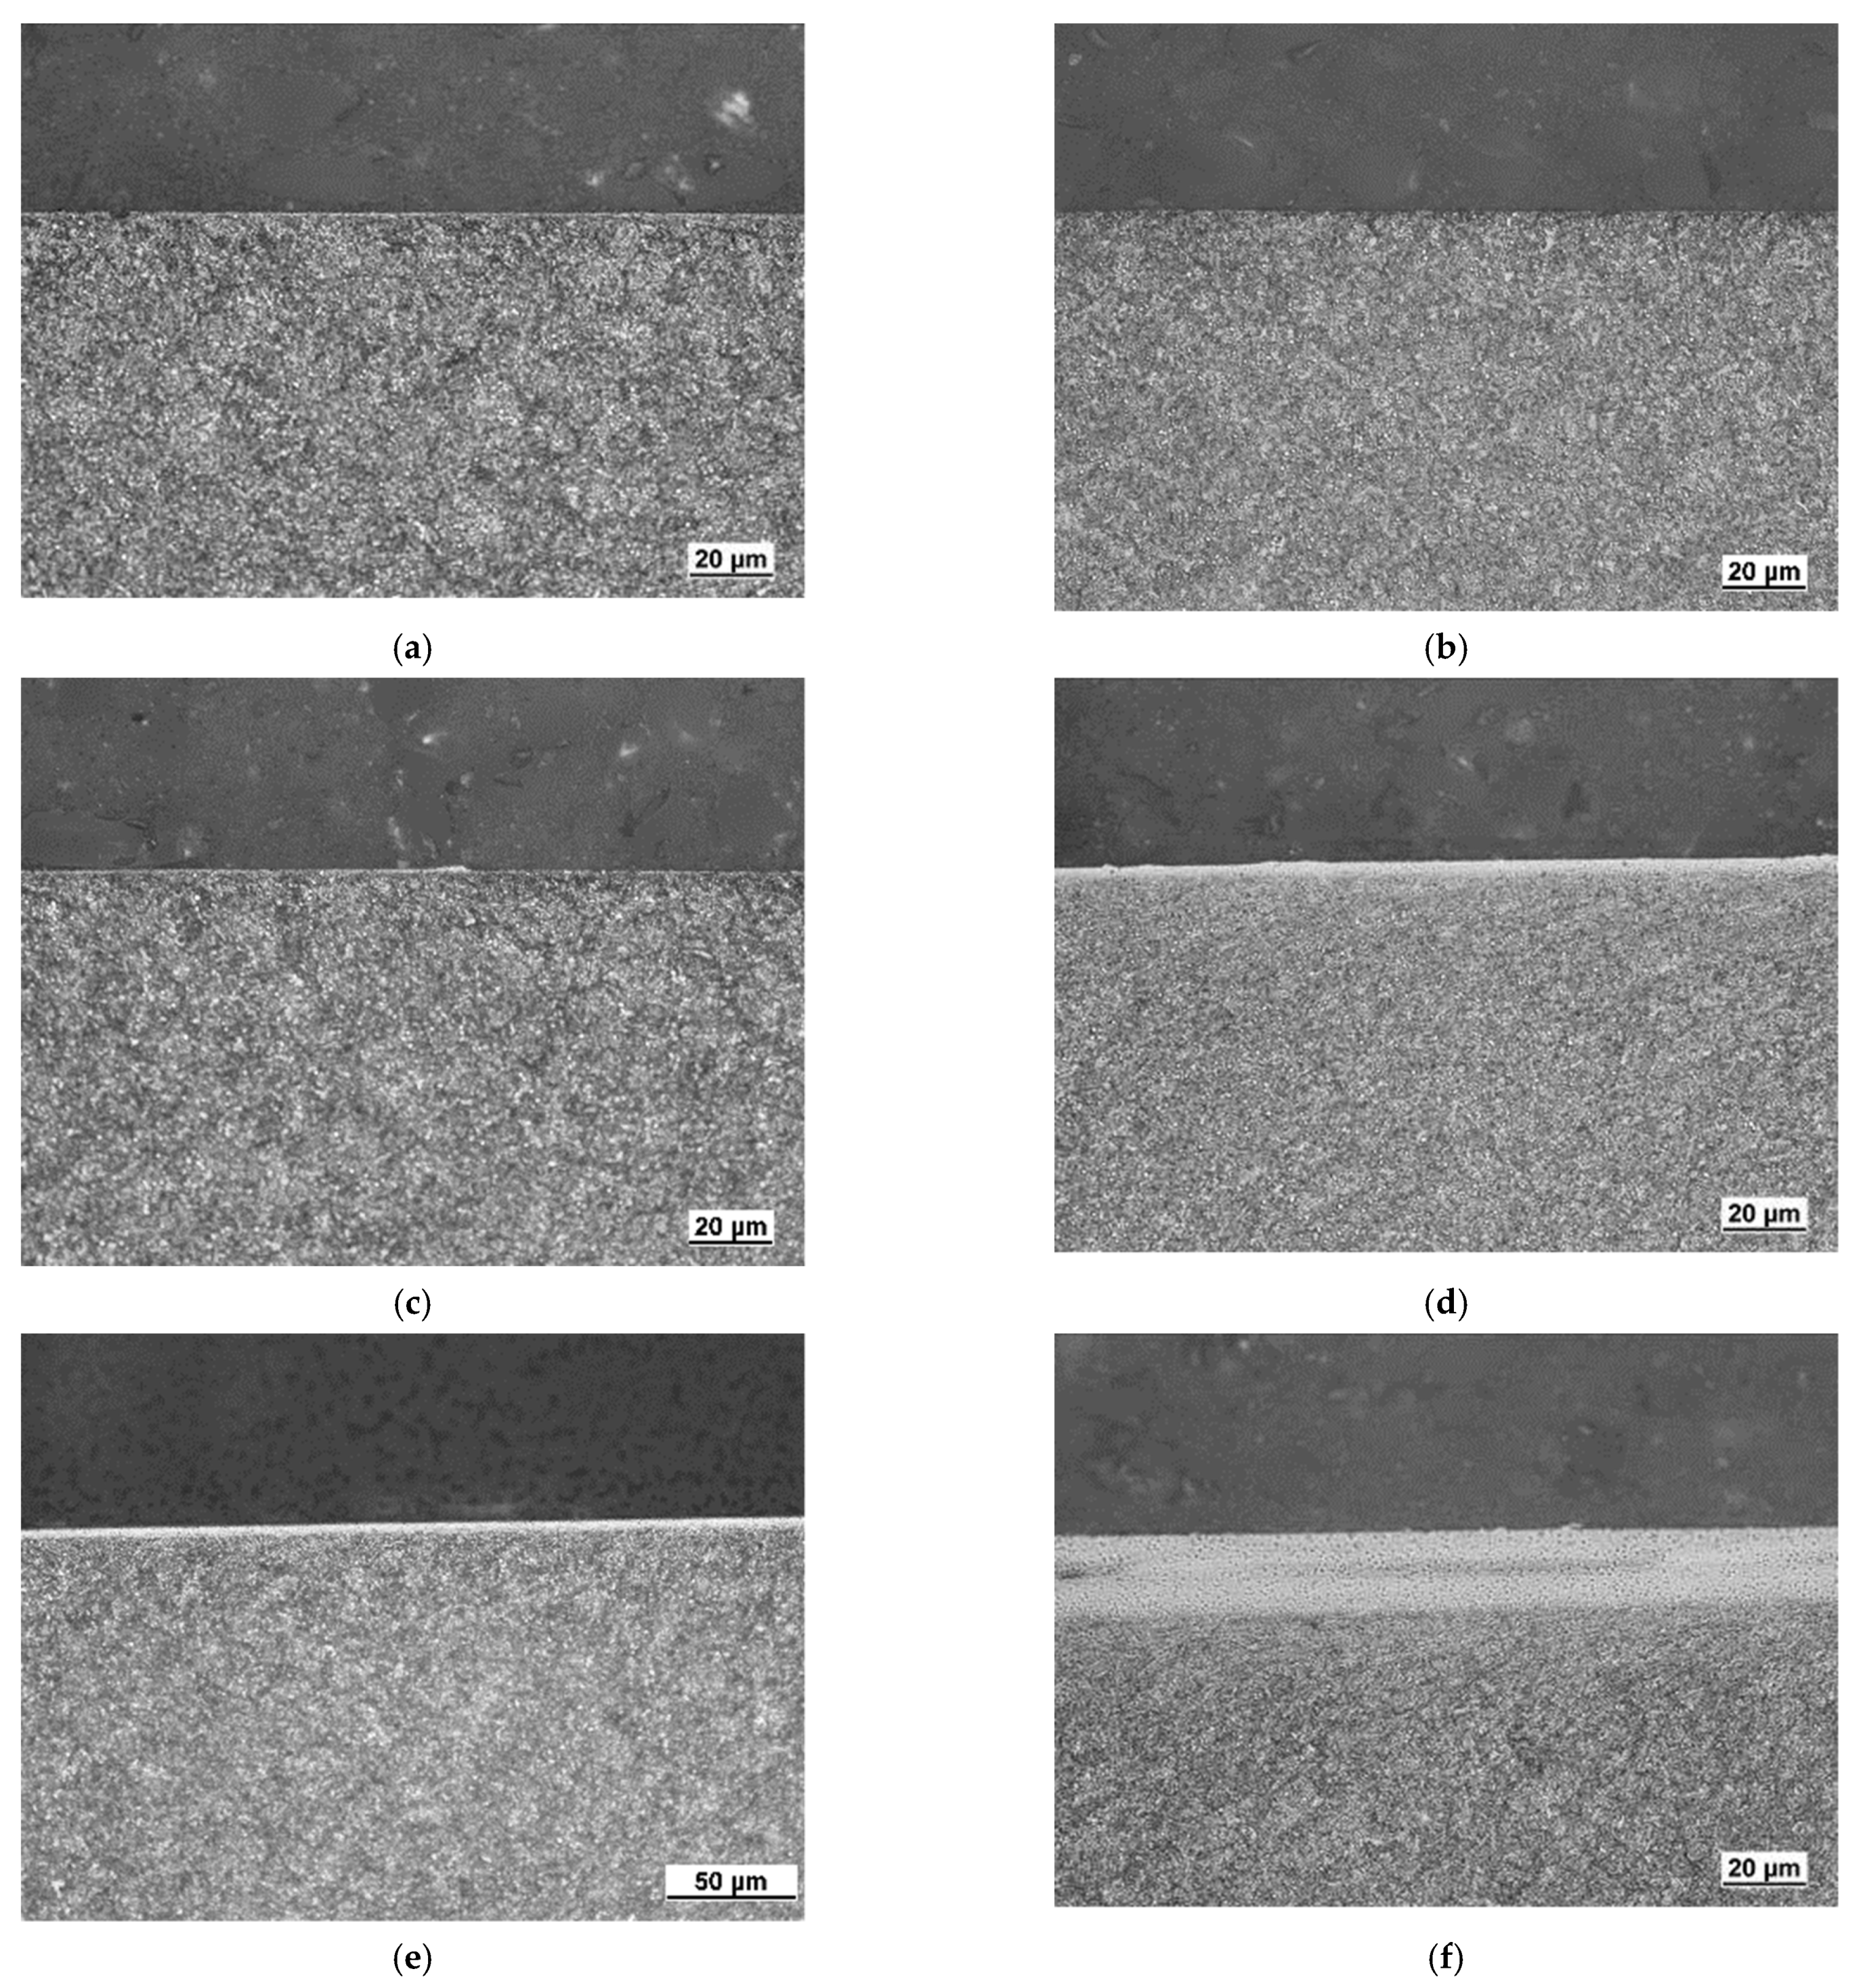
Figure 6 shows the typical WL produced during turning of hardened as well as tempered steels. Its white colour is due to flatness of the surface after etching and the corresponding missing phases contrast. Presence of the re-hardened layer indicates that the machined surface temperature exceeds austenitising temperature followed by the rapid cooling [
2,
14]. WL for lower
VB is discontinuous and quite thin, progressively growing with
VB, see
Figure 6.
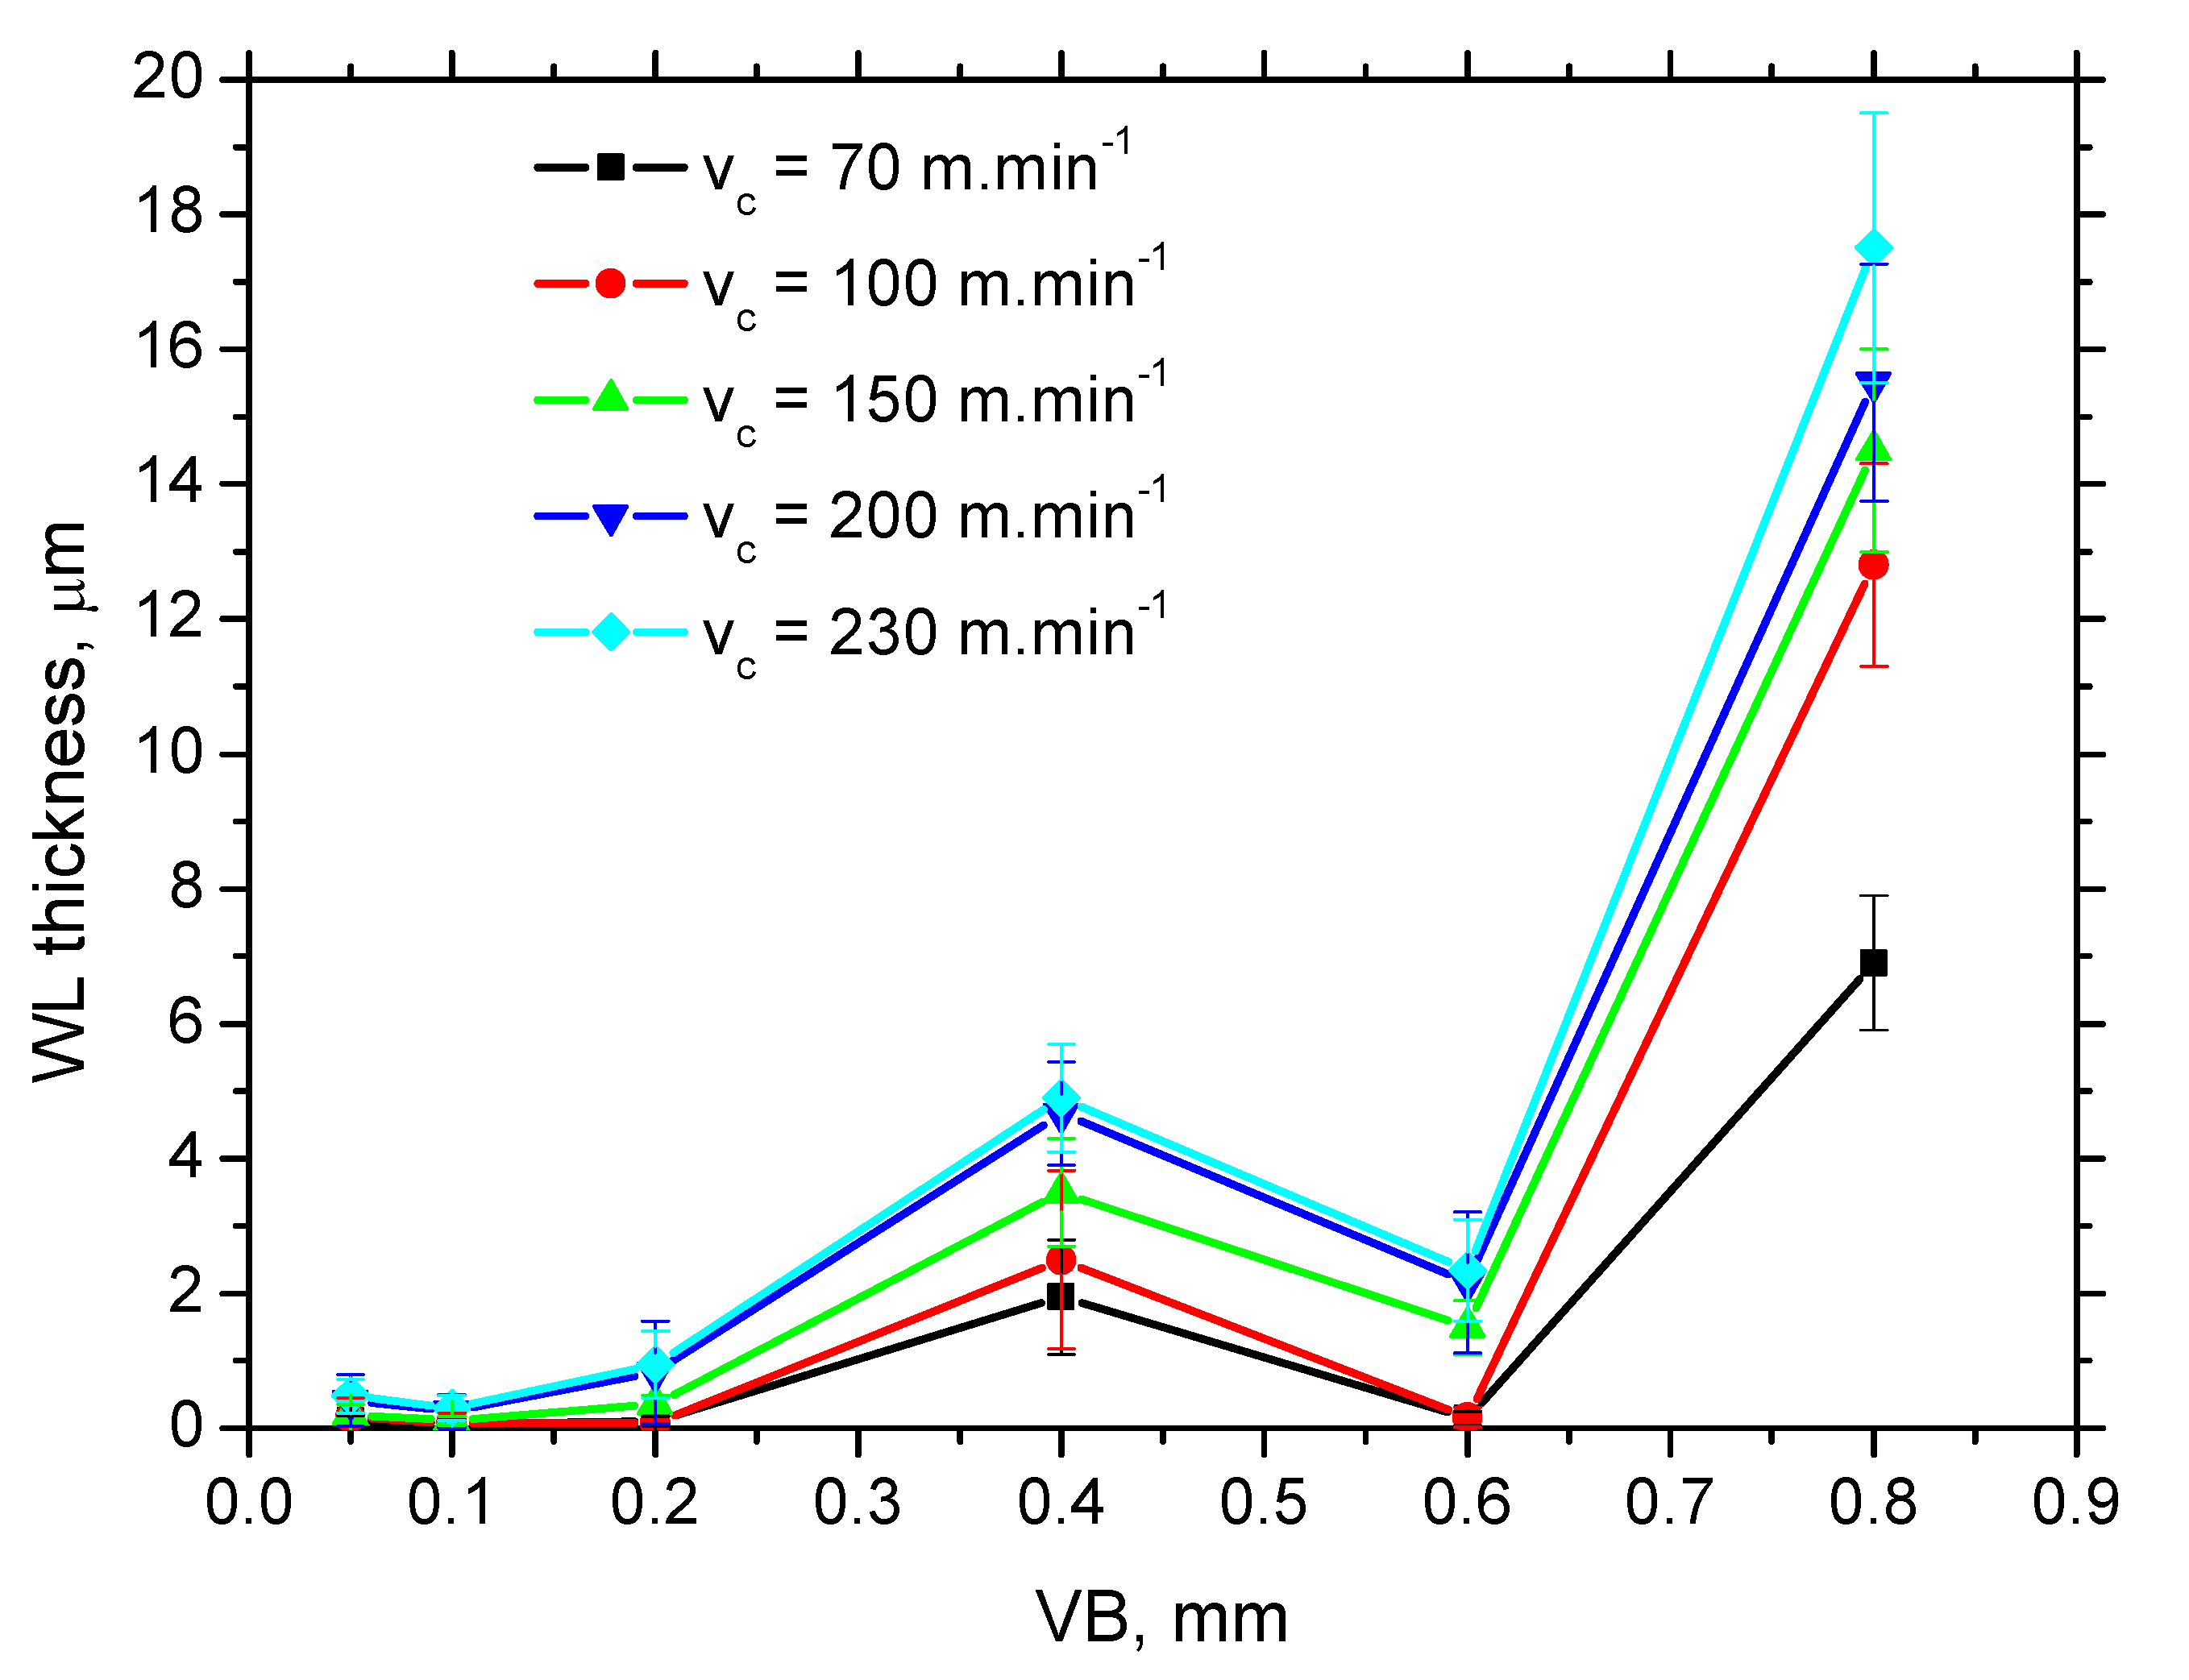
Figure 7 also shows that a local minimum occurs in the region of insert wear in which the tool geometry is markedly altered, see also
Figure 6.
Figure 7 also depicts that WL thickness grows along with increasing
vc as well, but the contribution of
VB prevails.
The growth of WL thickness fits well with findings of Chaudhari and Hashimoto [
20]. Authors reported that growth of the normal force is only sluggish in the initial phase of tool wear in which WL cannot be found, followed by a much steeper increase in force as soon as the continuous WL increases in thickness along with increasing
VB.
Figure 7 and
Table 2 indicate the low
Fαt and
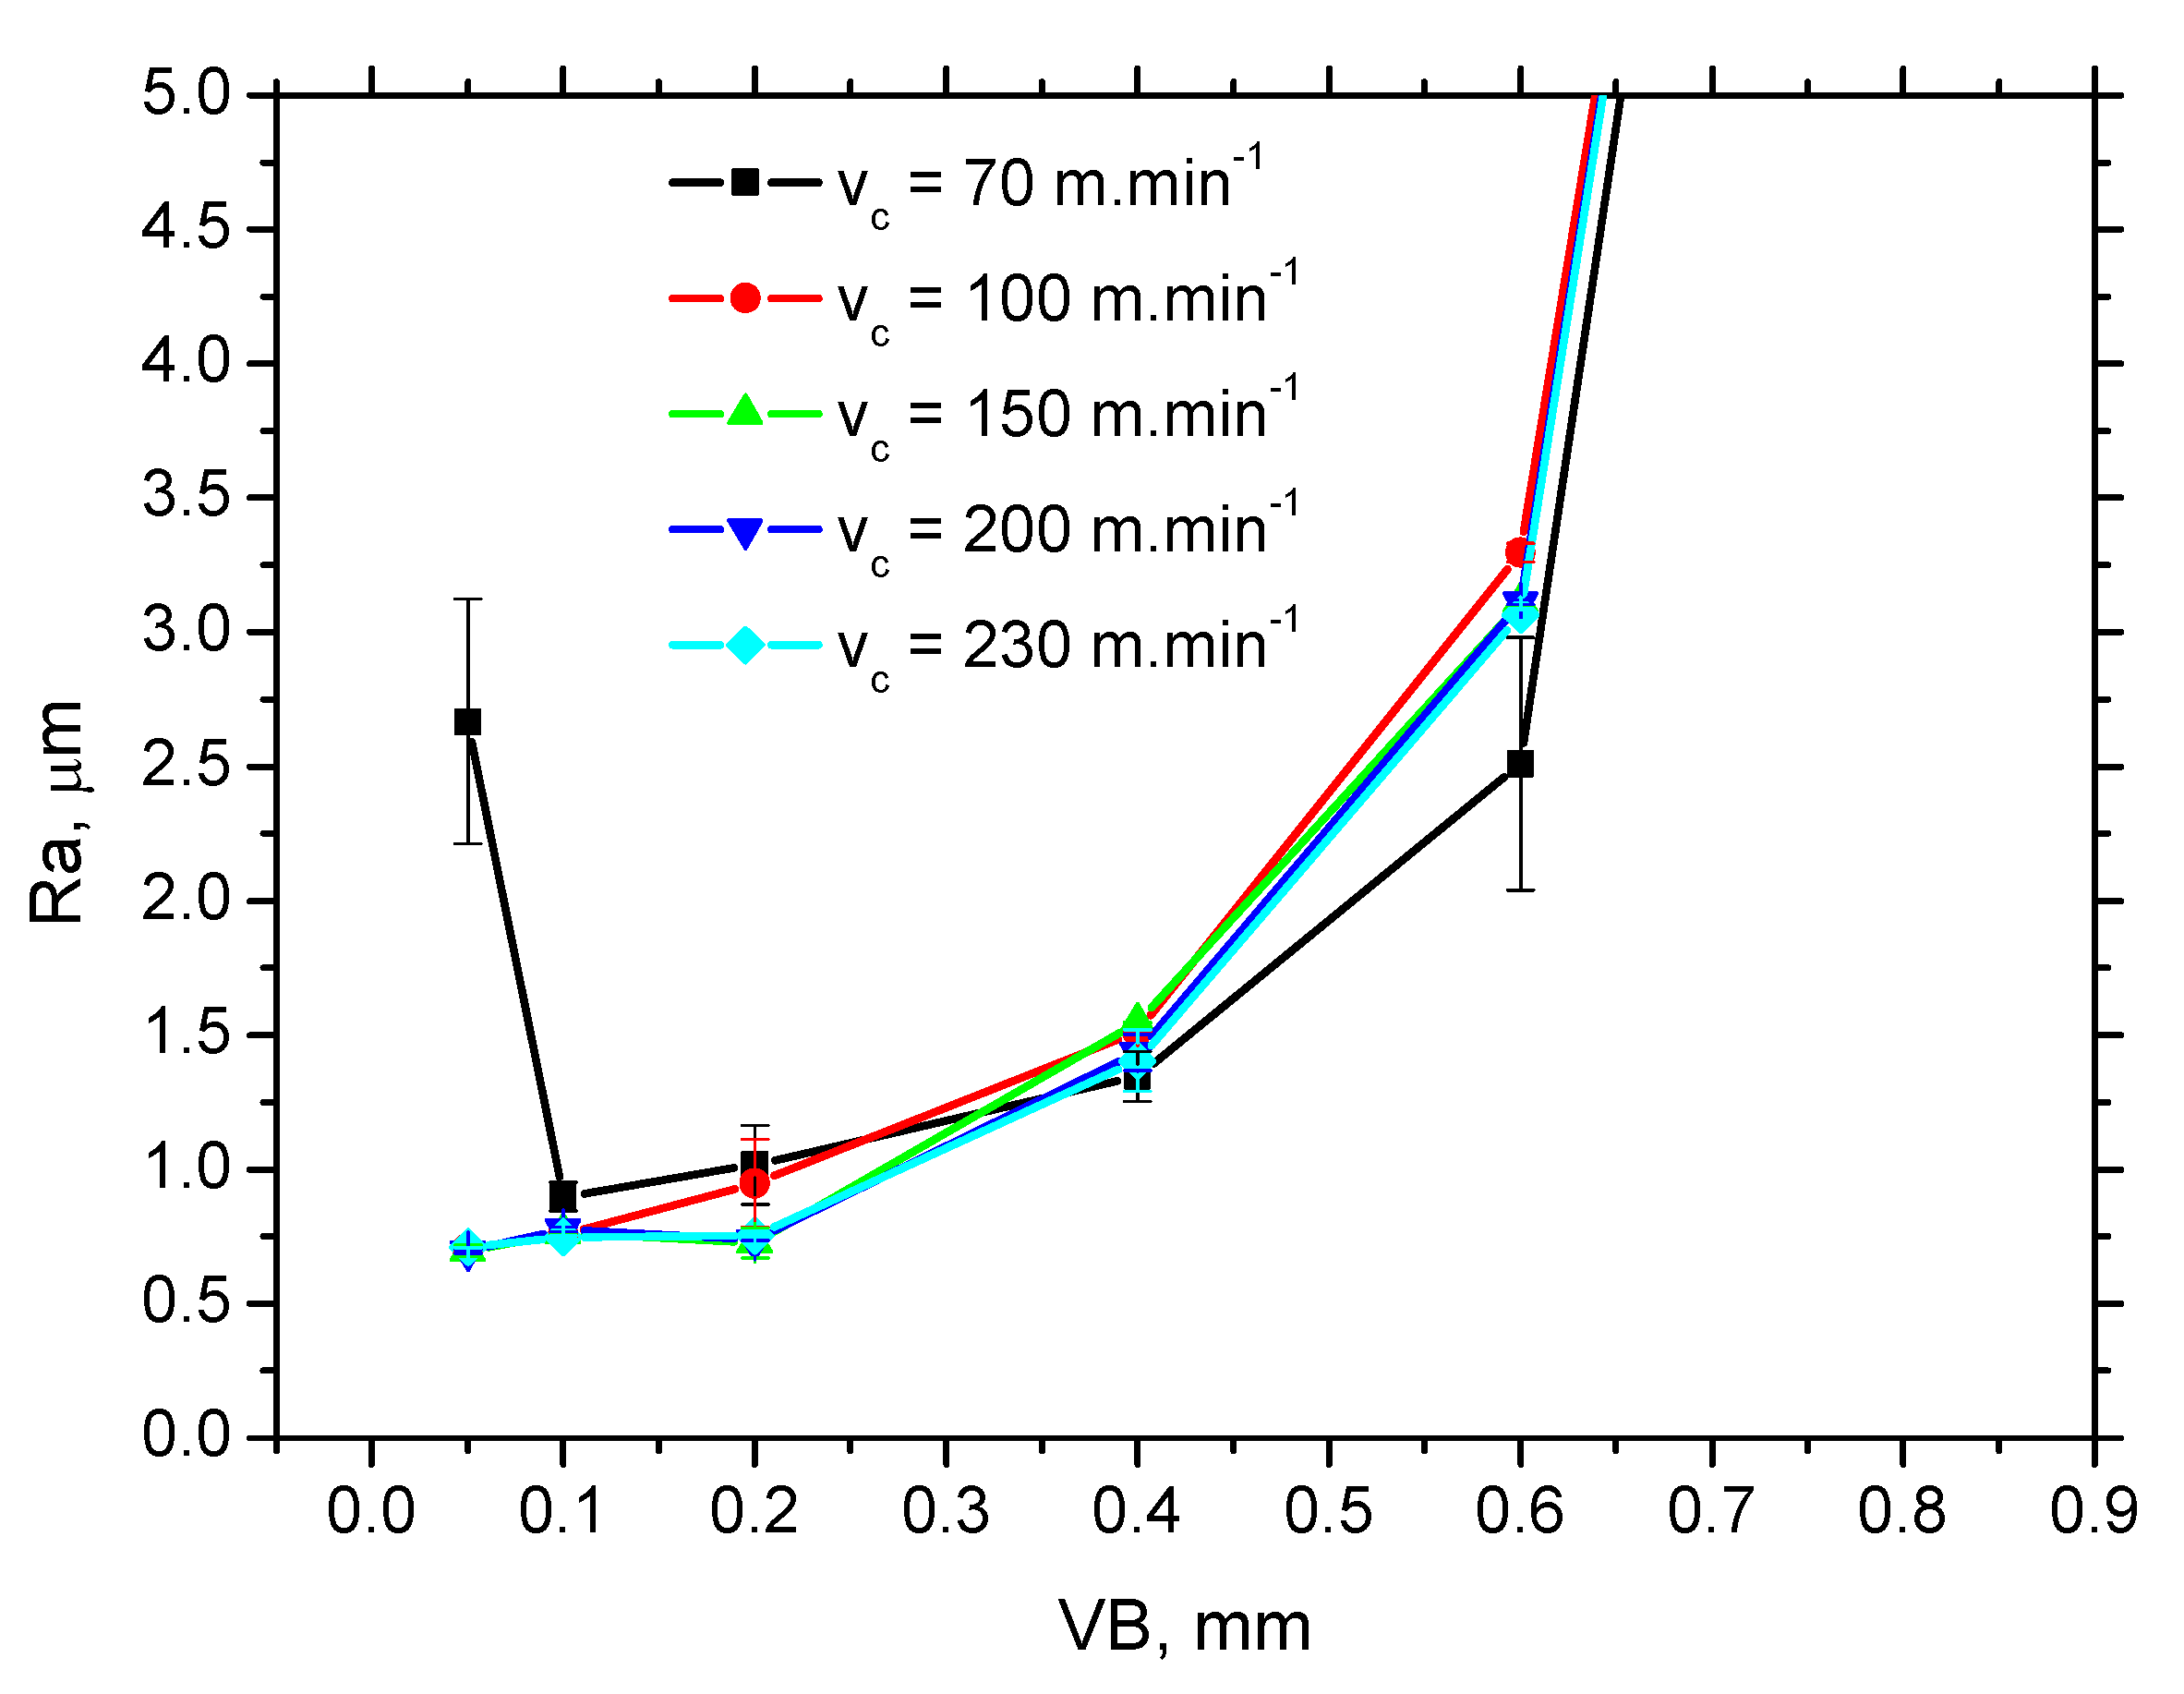
Fαtn corresponds with the low thickness of WL and vice versa. Moreover, the altered cutting edge shape and geometry, together with the increasing cutting force components, affect the new surface generation expressed in terms of its topography (surface roughness), see
Figure 8 and
Figure 9. Increasing intensity of machined material side flow increases the height of surface irregularities and the corresponding values of
Ra. The values of the shear and normal components per 1 mm of
VB (last two columns in
Table 2) indicate that the straightforward correlation between the high
Fαt and
Fαtn and WL thickness is quite debatable as the specific mechanical load per 1 mm of
VB decreases along with
VB. Expressed in other words, it can be reported that the average stress in the
VB region decreases with
VB. For this reason, the thermal effect and its duration should also be taken into account.
The time interval
τ during which the produced surface is exposed to the elevated temperatures is driven by
vc and
VB as follows:
The heat generated in the
VB region
Qα can be calculated as follows:
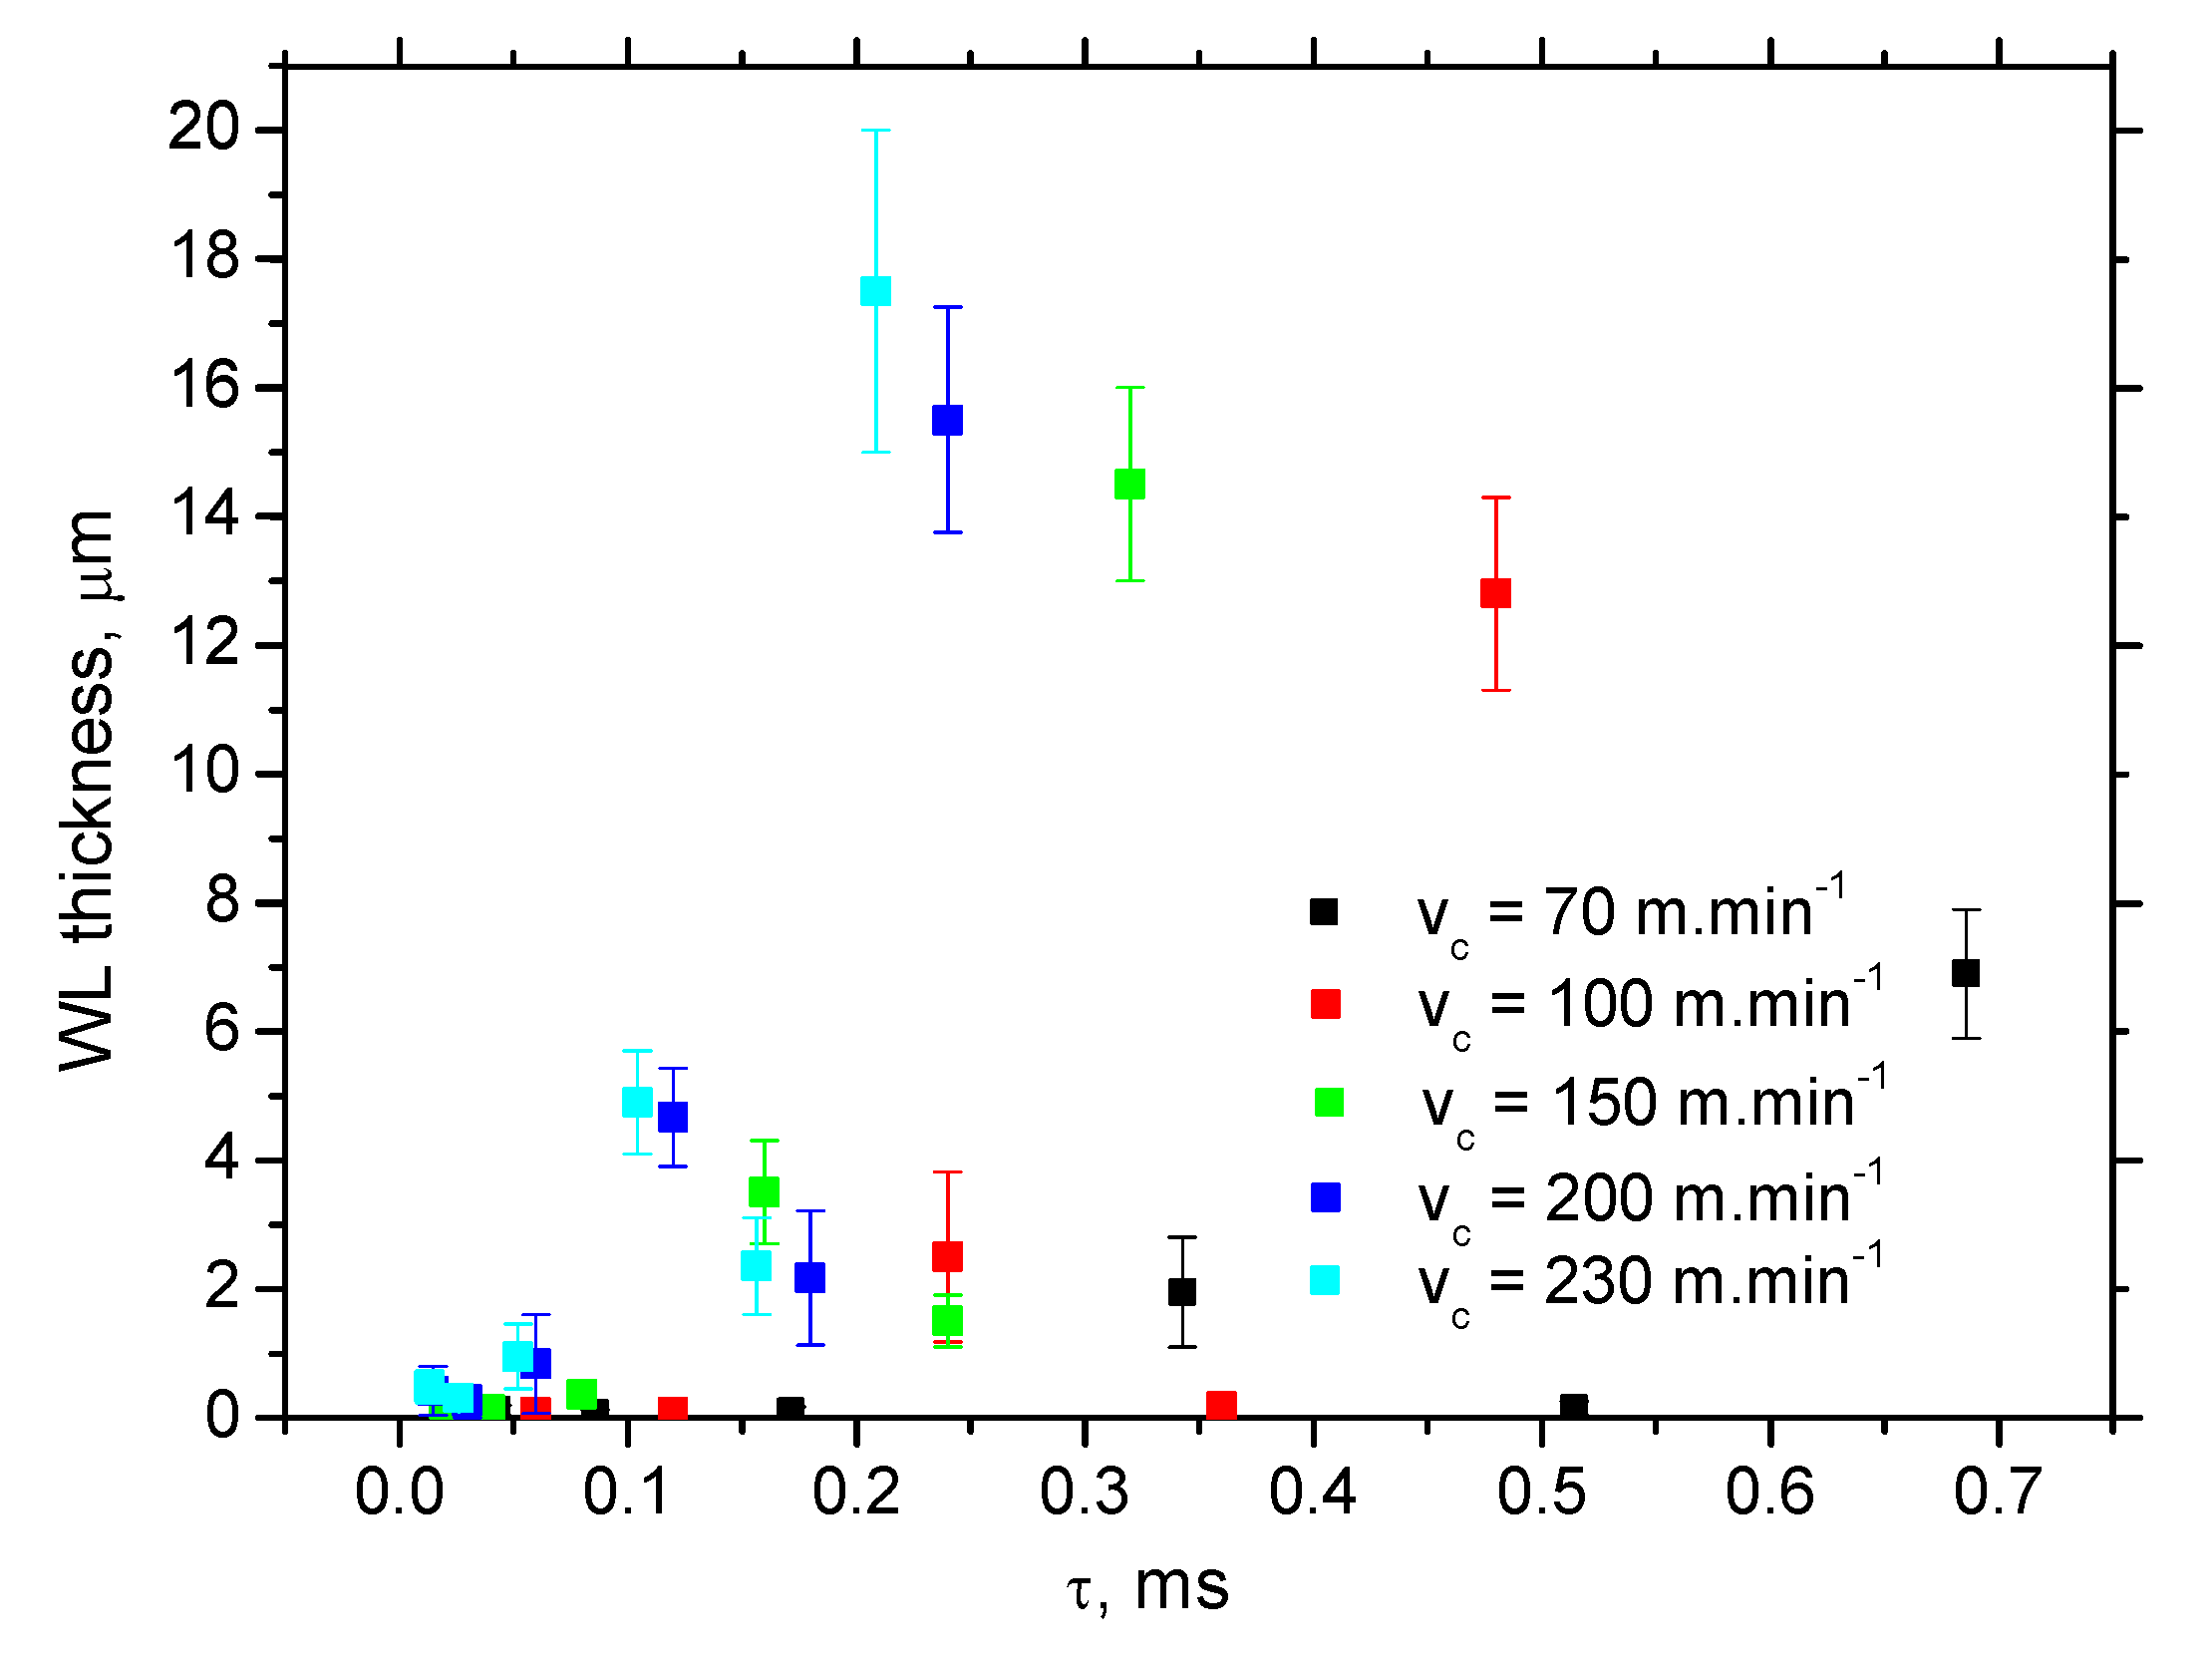
Calculations and
Figure 10 show that WL thickness only increases with
τ when the
vc is kept constant. As soon as the influence of
vc is considered, the pure contribution of
τ is quite controversial. The increasing
vc reduces the time
τ during which the produced surface is exposed to the heat (and the corresponding elevated temperatures) but WL thickness increases. Therefore, the superimposing contribution of
τ and
Qα (see
Figure 11) should be taken into account and specific heat
Qα′ should be calculated as follows:
Figure 12 depicts that the specific heat
Qα′ better explains the contribution of the thermal load to the WL thickness. WL thickness increases with
vc progressively for all
VB. However, the evolution of
VB versus
Qα′ with respect of WL thickness shows that a lower WL thickness is obtained for
VB = 0.6 mm despite the higher
Qα′ as compared with
VB = 0.4 mm. Such an evolution strongly correlates with the evolution of the
Fαtn components (see
Figure 4) which indicates that the formation of WL is not a pure product of the thermal cycle (austenitising followed by rapid self-cooling), but that the influence and superimposing contribution of the mechanical load should be considered as well. Expressed in other words, the phase transformation in the
VB region is under stress which affects its dynamics, extent, and hardness.
Figure 13 demonstrates that the microhardness HV 0.05 in WL progressively drops down with
vc. The thicker the WL is produced, the lower the microhardness is and vice versa, see
Figure 14. It is considered that the microhardness of WL is mainly driven by (i) the rate of cooling which should be higher at lower
vc due to the lower accumulation of thermal energy expressed in
Qα′ and (ii) the superimposing contribution of higher
Fαtn.
The thermal softening which also affects the deeper regions below the near surface WL is only minor (in this particular case) as this effect is shadowed by the previous thermal softening during samples tempering in the furnace.


 ,
, 


