Article

Experimental Investigation of Shear Keys for Adjacent Precast Concrete Box Beam Bridges

1
Department of Civil Engineering, Zhejiang University, Hangzhou 310058, China
2
Huahui Engineering Design Group Co., Ltd., Shaoxing 312000, China
3
Center for Balance Architecture, Zhejiang University, Hangzhou 310007, China
*
Author to whom correspondence should be addressed.
Materials 2022, 15(4), 1459; https://doi.org/10.3390/ma15041459
Submission received: 29 January 2022 / Revised: 11 February 2022 / Accepted: 11 February 2022 / Published: 16 February 2022

Abstract

:
Longitudinal cracking in shear keys is one of the most frequently recurring problems in the adjacent precast concrete box beam bridges. The relative displacement across the shear key (RDSK) under loads has been used as a direct indicator for shear key cracking. Therefore, accurately simulating the interface between the shear key and beam or providing the correct relationship between shear transfer and RDSK is key to evaluating the damage of the shear key. In this study, the shear transfer properties of four types of composite specimens were studied by static displacement-controlled bi-shear (SDS), cyclic force-controlled bi-shear (CFS), and cyclic displacement-controlled bi-shear (CDS) tests. Two finite element models (FEMs) were established to calibrate and validate the interfacial material parameters. The results showed that adding reinforcement bars over the joints that connect the block and the overlay could improve the bearing capacity of the shear key. Formulae were proposed for the relation between shear force transfer and RDSK in engineering applications. The values of the interfacial material parameters used in the traction–separation model to simulate the interface between the shear key and beam were recommended.

1. Introduction

Adjacent precast concrete box beam bridges are widely used in short- to medium-span bridges. However, one of the most significant issues for this type of bridge is the longitudinal cracking of the shear keys. Generally, it is believed that cracked shear keys compromise the load transfer between beams [1,2]. In extreme cases, the load on a single beam exceeds its designed allowable load, leading to accidents [3]. However, field observation also found that the load transfer between beams could still be maintained for partially cracked shear keys [4,5,6]. Therefore, it is necessary to reasonably evaluate the damage and load transfer capacity of shear keys to predict the remaining service life of bridges and select appropriate maintenance and reinforcement strategies.
Some researchers conducted destructive tests on structures to evaluate the load transfer performance of cracked shear keys. Wang et al. [7] carried out a static load test on a structure composed of six beams connected by concrete shear keys. They found that at a load level of 70 kN, two shear keys cracked with relative displacement across the shear key (RDSK) of approximately 0.02 and 0.04 mm, respectively. As the load increased, the crack in the shear keys propagated and eventually failed at a load level of 140 kN, twice the cracking load. Yuan et al. [8,9] conducted four tests on two-beam structures connected by transverse post-tensioning (PT) and partially or fully cracked shear keys, which were cast with nonshrink grout. Over millions of cycles, the load levels increased from 80 to 400 kN, and the PT force dropped from 445 to 0 kN. The results showed that when the transverse PT force decreases from 445 to 45 kN, the load can still be transferred effectively, and the RDSK remains stable. Miller et al. [10] carried out three cyclic loading tests on four-beam structures connected by transverse tie rods and shear keys, cast with nonshrink grout. In the first two tests, there were initial cracks at shear keys in the middle caused by temperature, and in the third test, there were initial cracks near the beam end. During the cyclic loading, the cracks in the first two tests propagated, while the cracks in the third test did not. They found that the load was effectively transferred, and the load distribution changed by no more than 1% during all three tests. However, according to the test result of Leng et al. [11], it may be due to the position of the load and crack. Leng et al. tested an eight-beam structure connected only by concrete shear keys. They set different crack lengths on the first and the fourth shear keys to assess the influence of crack length and transverse position on load distribution. They found that the crack at the first shear key had a significant impact on the load distribution, but that at the fourth did not. These destructive tests indicate that the cracking of shear keys does not mean load transfer failure, and the ultimate bearing capacity may be much larger than the cracking load. However, destructive tests are unsuitable for bridges in service to evaluate residual capacity; the finite element method is more appropriate.
Since RDSK has been used as a direct indicator for shear key cracking [4,7,8,9,12,13,14], it is crucial to accurately simulate the interface of the beam and shear key in finite element models (FEMs) using solid elements. Three commonly used methods are the full bond [15,16,17], friction [13,18,19,20,21], and traction–separation model [13,21,22,23]. Full bond is suitable for the interface of concrete and grout materials with strong bonding ability, such as epoxy, MgNH4PO4, and UHPC, but not for commonly used nonshrink grout and concrete. Shear and flexural tests showed that the former is more prone to cracks in the concrete, while the latter is more prone to cracks in the interface [8,9,15,17,23,24,25,26,27,28,29]. Friction applies when the shear key has already cracked at the interface. The traction–separation model can be used for all of the above materials, uncracked and cracked. To sum up, the traction–separation model is more suitable for the interface of concrete and grout materials such as nonshrink grout and concrete. However, the material parameters used in this model were usually reversely determined by direct tensile or direct shear tests [17,20,29]. The problem is that the interface of the two materials in these tests was flat; factors such as joint configuration and cast direction, which affect the properties of concrete-like materials [30,31], were not considered. Murphy et al. [17] simulated the shear test of joint specimens by material parameters obtained from these tests, resulting in much larger cracking loads in the simulation than those in the experiment. Material parameters determined from tests on joint specimens have not been reported yet.
The grillage method is another common method to simulate adjacent box-beam bridges to analyze the load distribution between beams [32,33,34,35]. Two transverse connection types are usually used, namely shear transfer systems and shear–flexure transfer systems. For the shear transfer system, beams are simulated as longitudinal grillage members with transverse outriggers, and shear keys are represented by the pinned joints between the outriggers of adjacent beams. Cracks in shear keys are indicated by lowered vertical stiffness, resulting in larger RDSK [36,37]. For the shear–flexure transfer systems, the longitudinal properties of beams are simulated by longitudinal grillage members; the transverse properties of beams and shear keys are simulated by equivalent transverse grillage members. Cracks in shear keys are indicated by the lowered stiffness of the transverse grillage members [38]. The shear transfer system is recommended for bridges with partial depth shear keys [32]. Although there have been many studies on the shear performance of shear keys, the focus was on cracking loads and maximum shear loads [15,17,20,23,24,25,28,29]. There was little quantitative information about the effects of shear key cracking on vertical stiffness or the relation between shear transfer and RDSK.

2. Objectives

The main objectives of this study were to investigate the relationship between shear transfer and RDSK for transverse connection before and after shear key cracking and determine interfacial material parameters between beams and shear keys cast with concrete. To this end, the following studies were performed in this work:
  • Static displacement-controlled bi-shear (SDS), cyclic force-controlled bi-shear (CFS), and cyclic displacement-controlled bi-shear (CDS) tests were conducted on four types of composite specimens to investigate the shear transfer performance;
  • Based on the test results, curves and expressions for the relation between shear and RDSK of different types of transverse connections were proposed;
  • Two FEMs were developed to calibrate and validate the interfacial material parameters.

3. Experimental Program

3.1. Configuration

Four connection details used to evaluate the shear transfer performance are shown in Figure 1. Type I and Type II specimens consisted of one concrete middle block and two concrete edge reaction blocks with grout joints between them. These two specimen types were 600 mm long, 270 mm in height, and 400 mm wide. Type III and Type IV specimens added a 70-mm-height concrete overlay and four 8-mm-diameter U-shaped steel bars (N1) based on Type I and Type II. Reinforcing steel bars in concrete blocks to prevent cracking are not drawn in Figure 1 for simplicity. Three-dimensional samples of N1 bars are shown in Figure 1e. N1 bars are spaced at 300–400 mm in the longitudinal direction in bridges; for safety reasons, 400 mm was used here as the width of specimens. Type II–IV connections had been widely used in Zhejiang Province in China before 2004 [39], and the bridges using these connection types now more or less experience longitudinal cracking problems. Type I was adopted here as a control for Type II and Type IV.

3.2. Specimen Preparation

The specimens were cast in three steps. Middle and edge concrete blocks were cast in the first step, joints in the second step, and overlays in the third step. During each cast, the concrete was vibrated by concrete vibrators to prevent imperfect filling. All steps were 30 days apart and moist-cured for 28 days. Companion cubes were cast synchronously at each step to determine the actual compressive strength of the cast material. The cohesion and friction properties of the interface between blocks and joints are mainly affected by the surface treatment of the blocks. In this study, the surfaces of blocks were roughened to an amplitude of 6 mm by a concrete scrabbler [40]. The whole procedure is presented in Figure 2. For better data acquisition by the digital image correlation (DIC) instrument, the front surfaces of specimens were polished, painted white, and black speckles added before tests.
Blocks and joints were constructed with commercial, ready-mixed concrete with a targeted 28-day compressive strength of 40 MPa (C40) and overlay of 30 MPa (C30) [41,42,43]. The constituents of the concrete are shown in Table 1. The average strength of the companion cubes was 46.1 and 45.2 MPa for C40 in the first and second cast and 34.6 MPa for C30 in the third cast [42]. N1 bars and stirrups in blocks had a nominal yield strength of 300 MPa (HPB 300) [44]. Other steel bars in blocks had a nominal yield strength of 400 MPa (HRB 400) [45].

3.3. Setup

The bi-shear test was performed using the setup depicted in Figure 3. A specimen was set on steel plates under edge blocks; the load was applied by a high-performance testing machine produced by INSTRON Company through a thin cushion and a steel plate placed on the top of the specimen. The machine could output displacement and load synchronously. The DIC instrument and dial gauges recorded displacement under load at the front and back surfaces, respectively (see Figure 4). DIC recorded the whole displacement field of the front surface during testing, and the data of specified points were extracted and analyzed for different purposes. Taking the front surface of the Type III specimen as an example (see Figure 5), Points 14 to 16 were used to calculate RDSK (Δ); Point 1 to compare with the displacement output by the loading machine; Points 2 to 37 to analyze displacement variation in the vertical direction; Points 38 to 41 to analyze boundary displacements, and Points 42 to 45 to calculate the cracking opening. On the back surface, dial gauges only recorded Points 14 to 16. Δ was calculated using Equation (1):
Δ = ( w 14 + w 16 ) / 2 w 15 | front   or   back
where wi is the vertical displacement of Point i (i = 14–16).

3.4. Test Pocedure

Three different shear test types were conducted in sequence to evaluate the shear performance of four connection details before and after cracking, namely SDS, CFS, and CDS test.
In the SDS test, the displacement was applied at a rate of 0.02 mm/s until the specimen failed. The displacement field, cracks, associated cracking loads, and final failure mode were recorded during the test.
In the CFS test, the load varied linearly between 15 kN and the specified control force at a frequency of 1 Hz. In the first CFS test, the control force was set at approximately 60% of the cracking load obtained by the SDS test. This value was proposed on the assumption that the properties of the interface material are similar to concrete, for which 60% of the maximum tensile stress could be regarded as the elastic limit [46]. The control forces of the second and third CFS tests were determined based on the result of the last test. The controlled force increased if the specimen was uncracked in the previous test. Otherwise, it decreased. A total of 1400 cycles were applied in one test for two main reasons: (1) supposing that the structure was overloaded once a week over a 20-to-30-year period; and (2) too much data generated by DIC during the test, causing storage problems. An SDS test on the same specimen would follow if no cracks appeared after the CFS test. The displacement field and the failure mode were recorded during the test.
In the CDS test, the displacement varied linearly between 0.2 mm and the specified control displacement at a frequency of 1 Hz. The CDS test was proposed based on the phenomenon that RDSK could remain steady after shear key cracking during cyclic loading [8,9]. In addition, to compare dynamic load capacity with static load capacity under the same displacement, one static loading was conducted every 20 cycles. The control displacement was increased by 0.1 mm after each static loading. Figure 6 shows the loading procedure. The displacement field and the failure mode were recorded during the test.

3.5. Results and Discussion

The following notation of specimen names was used throughout this study: the first three letters stand for the test type; the number following the first three letters represents the type of specimen, and the last digit indicates the replicate number of the specimen. For example, Specimen SDS-II-3 indicates the third Type II specimen subjected to the SDS test.
The following method was used to determine the average value: (1) the arithmetic mean value of the measured values was used as an average value, and (2) data greater than or less than 15% of the arithmetic mean were excluded from the mean calculation [41,42].
The value of shear force V was set to half of the load F output by the machine.

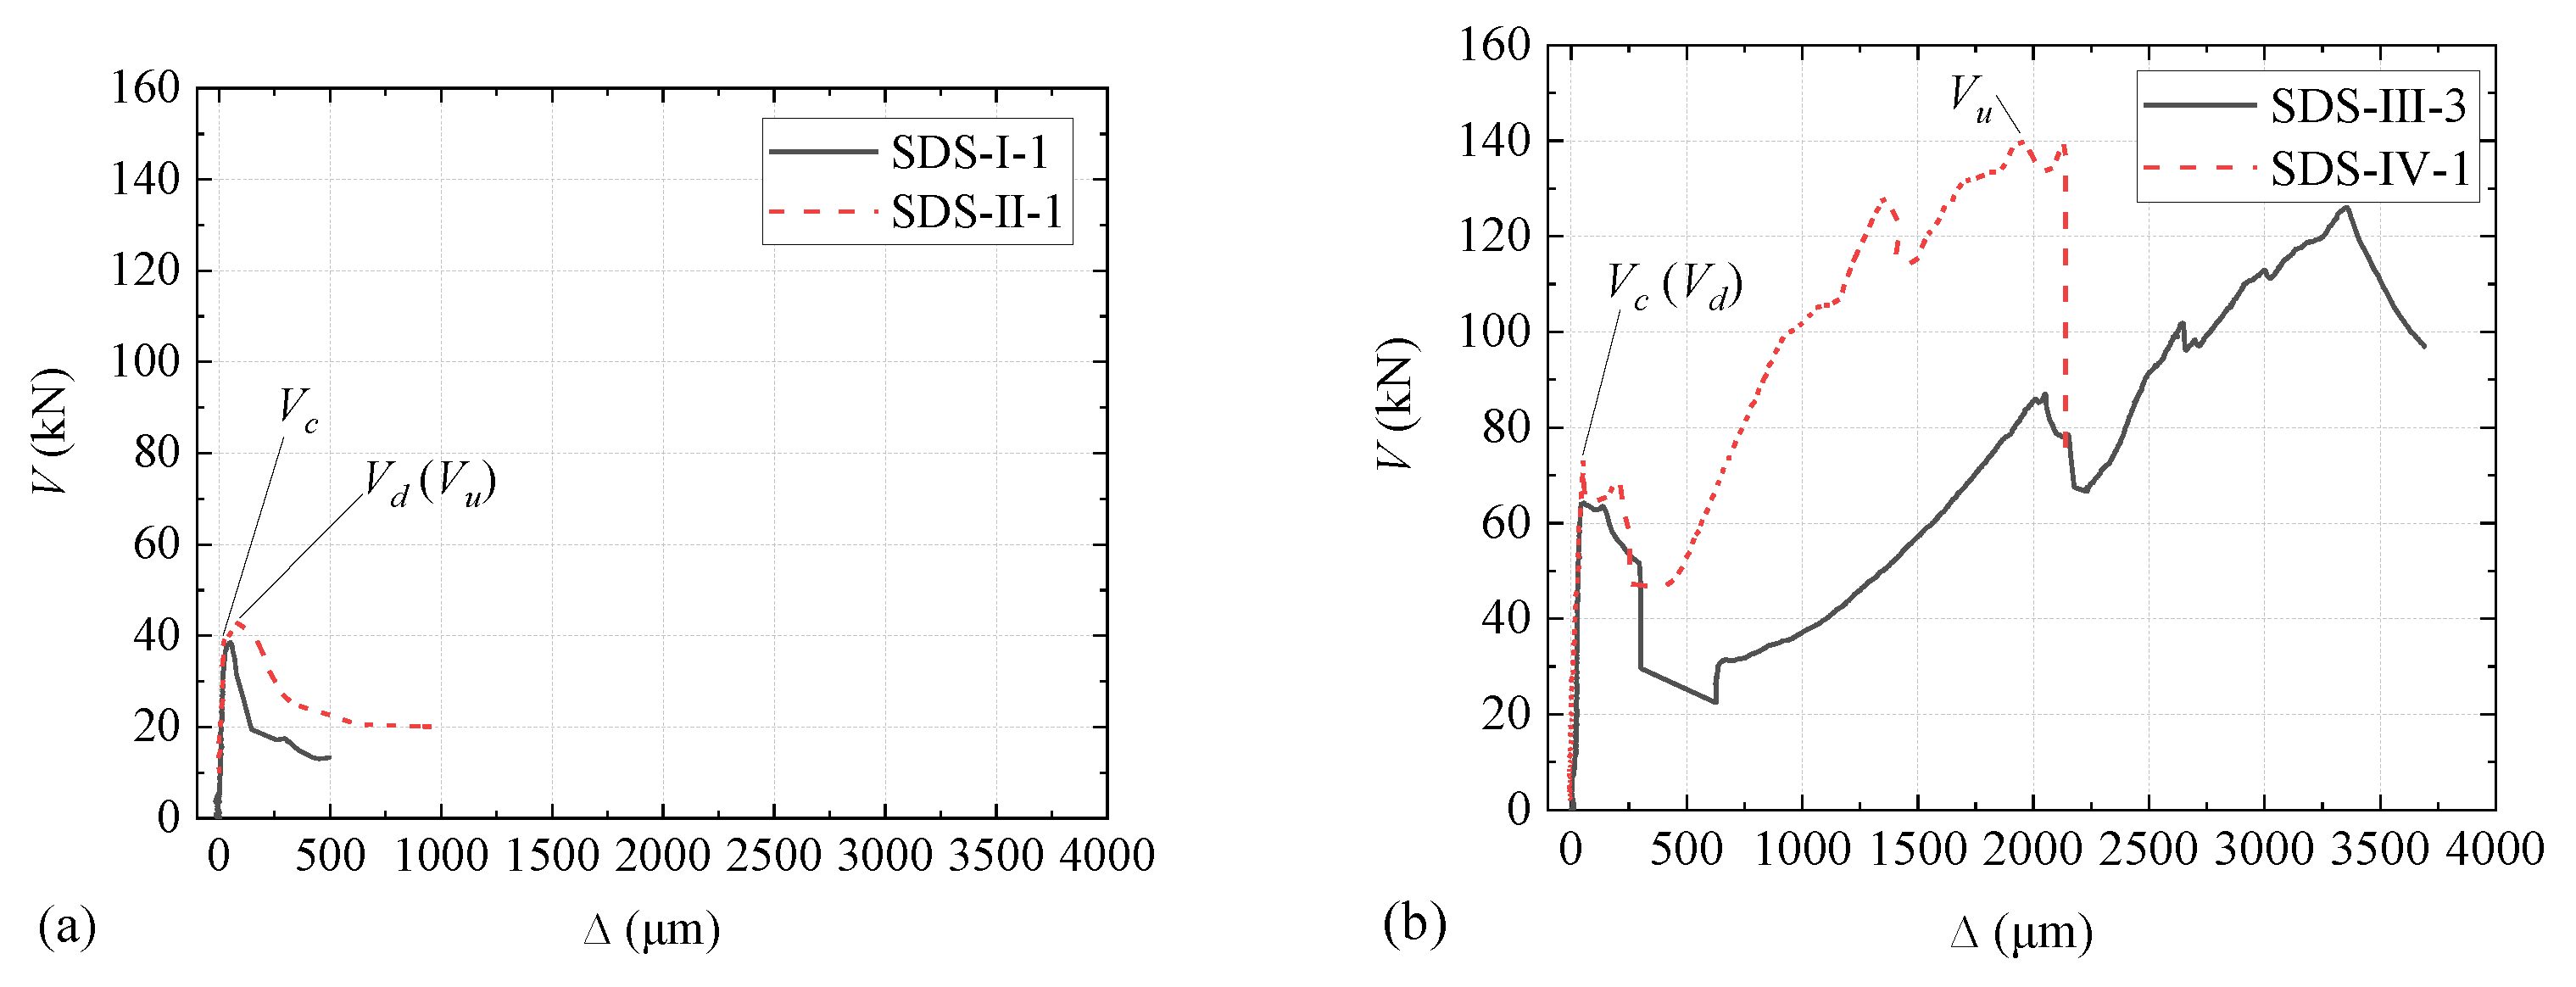
3.5.1. Results of SDS Test

The typical V-∆ curves for four types of specimens are plotted in Figure 7. As shown, the V-∆ curves for Type I and Type II specimens are similar; the curves are approximately linear until a sudden failure occurs at the interface of block and joint. Figure 8 shows such a failure mode. The typical V-∆ curves for Type III and Type IV specimens are also similar, and the curves can be divided into two stages. In the first stage, the curves are similar to that of Type I and Type II; the interface of block and joint cracked during this stage, and the upper end of the crack extended to the bottom of the overlay (see Figure 9). In the second stage, V increases slowly and almost linearly with ∆ until another sudden failure. During this stage, the upper end of the crack slowly reached up to the top of the overlay (see Figure 9).
The cracking shear force (Vc), the maximum shear force in the first ascending stage (Vp), the minimum shear force in the second ascending stage (Vd), the maximum shear force in the whole process (Vu), the corresponding slips across the joint (∆p and ∆u), the stiffness before and after cracking (kc and kp), and crack opening (Co) for each specimen are listed in Table 2. The value of kc is the slope of the ascending curve in the first stage, calculated by Equation (2):
k c = 0.6 V c / Δ 0.6
where ∆0.6 is the value of ∆ corresponding to 0.6Vc on the V-∆ curve. The value of kp is the slope of the ascending curve in the second stage.

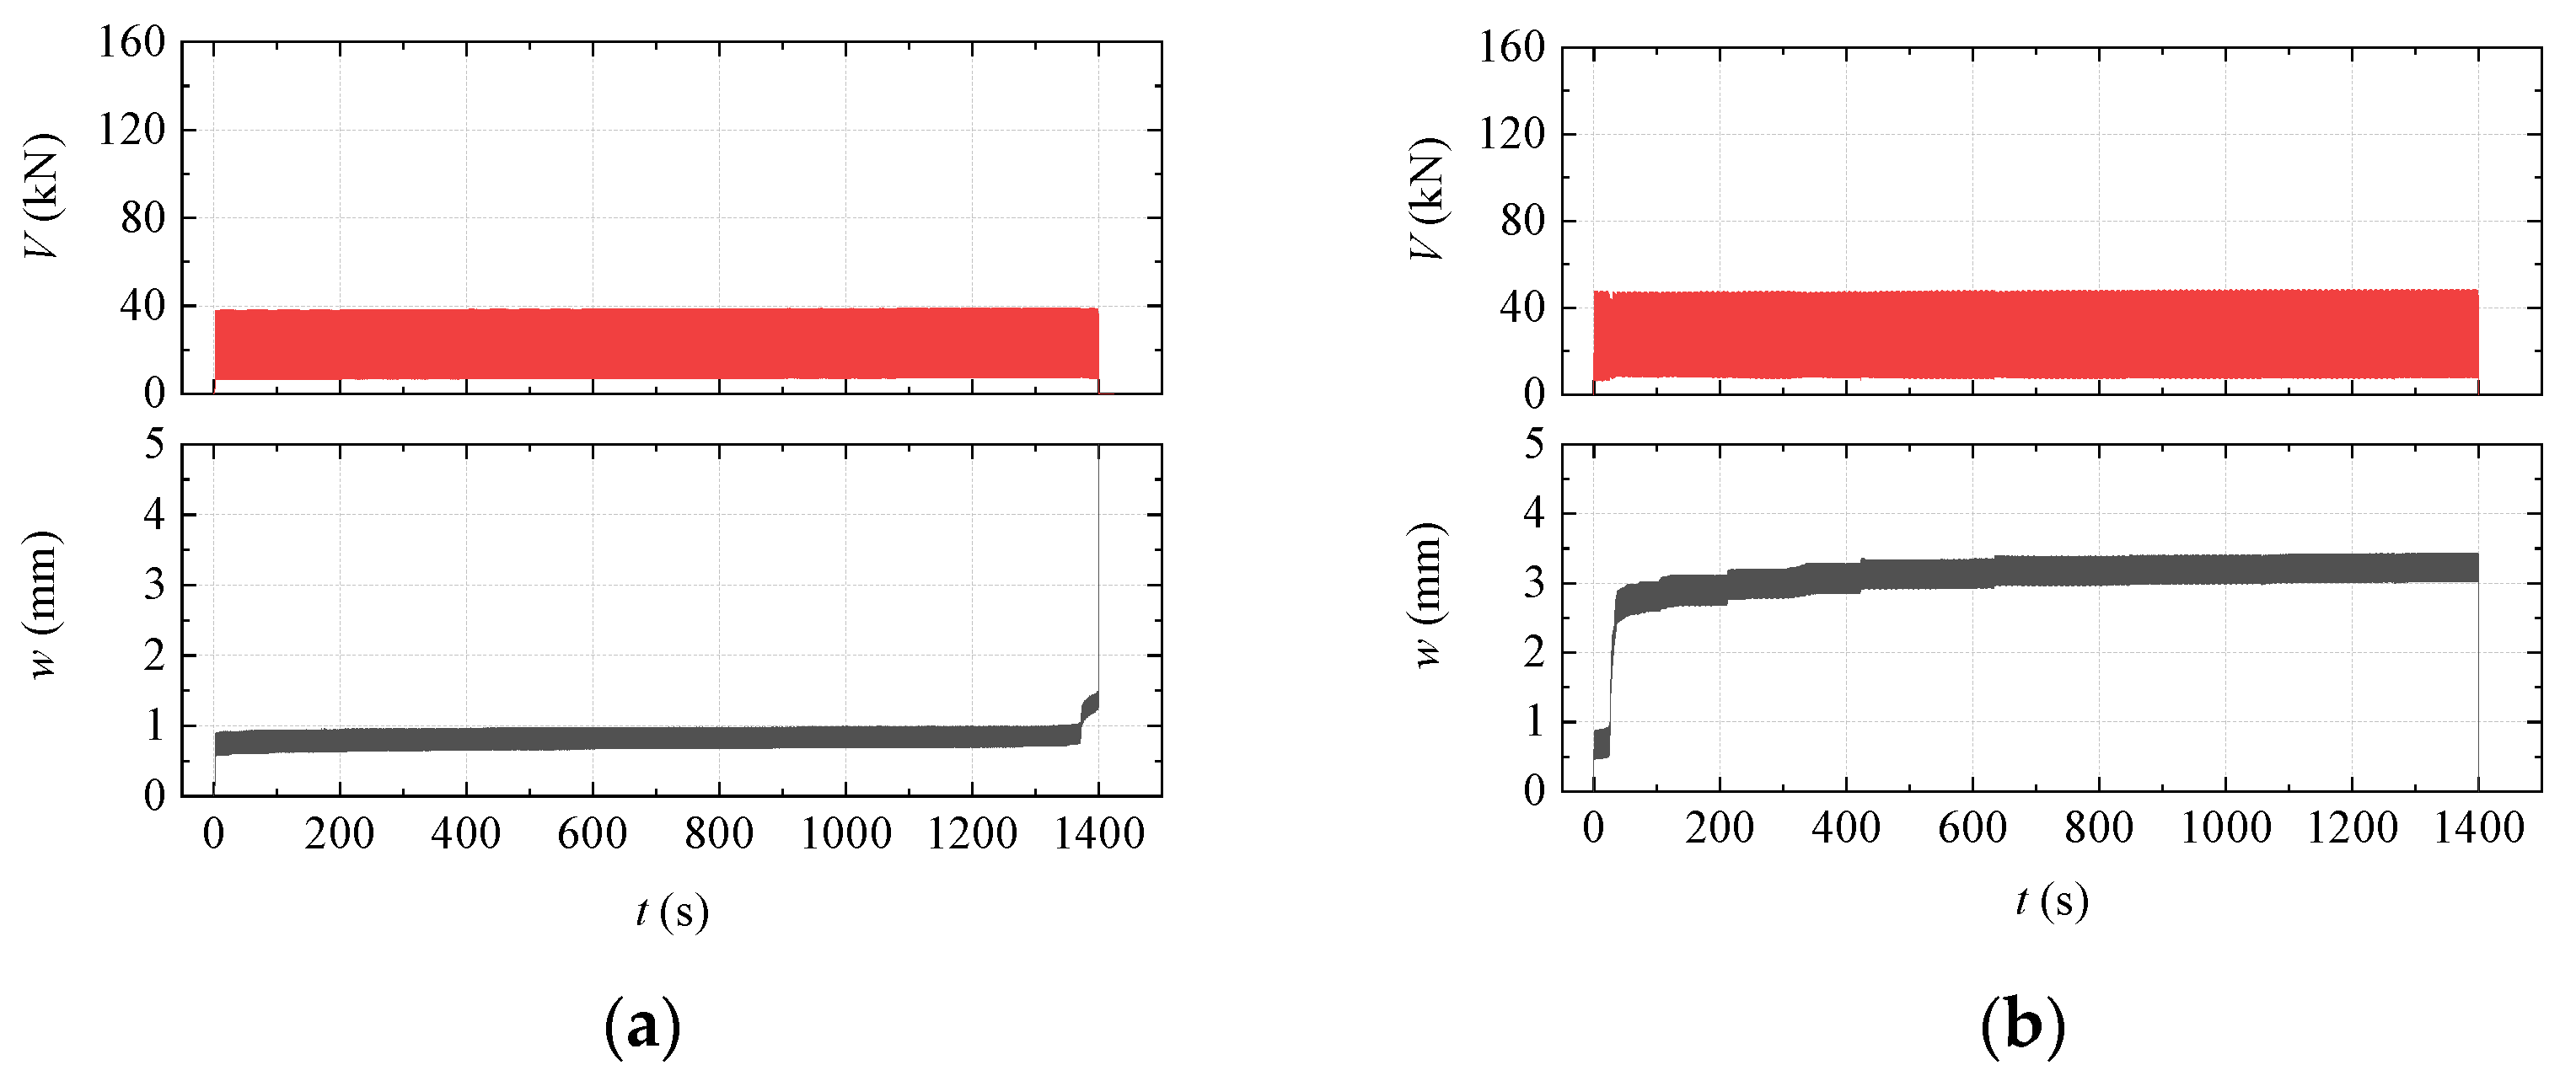
3.5.2. Results of CFS Test

The results of the CFS test are summarized in Table 3. The results agreed well with the previous assumption about the elastic limit (0.6 Vc). Figure 10 shows specimens’ typical V-t and w-t curves during testing, where w is the displacement output by the machine and t is the time. V-∆ curves are not presented here because the specimen response lagged significantly behind the added load during cyclic loading.
For Type I and Type II specimens, once the specimen cracked, w increased quickly, and the specimen failed (see Figure 10a). In contrast, w found a new equilibrium position after several adjustment cycles for cracked Type III and Type IV specimens (see Figure 10b).

3.5.3. Results of CDS Test

The results of the CDS test are summarized in Table 4. The average cracking and maximum shear force under dynamic loading ( V c d and V u d ) of Type I to Type IV did not change much compared to those of the SDS test. The typical V-t and w-t curves are shown in Figure 11. Once the specimen of Type I and Type II cracked, increasing w did not result in increasing V synchronously, and the specimen failed quickly (see Figure 11a). In contrast, V increased with w for the Type III and Type IV specimens after cracking and could remain steady when w was relatively low (see Figure 11b).

3.5.4. Comparison of Different Connection Types

Using N1 bars and an overlay increased both the Vc and Vu of specimens. The Vc and Vu of the Type III connection were 1.5 and 3.4 times larger than those of the Type I connection, respectively. Moreover, the Vc and Vu of the Type IV connection were 1.2 and 2.9 times larger than those of the Type II connection, respectively. Type I and Type II connections failed quickly after cracking, while Type III and Type IV connections could still transfer shear force effectively. In addition, the shear transferring was steady when the force or displacement was not very high after cracking for Type III and Type IV connections.

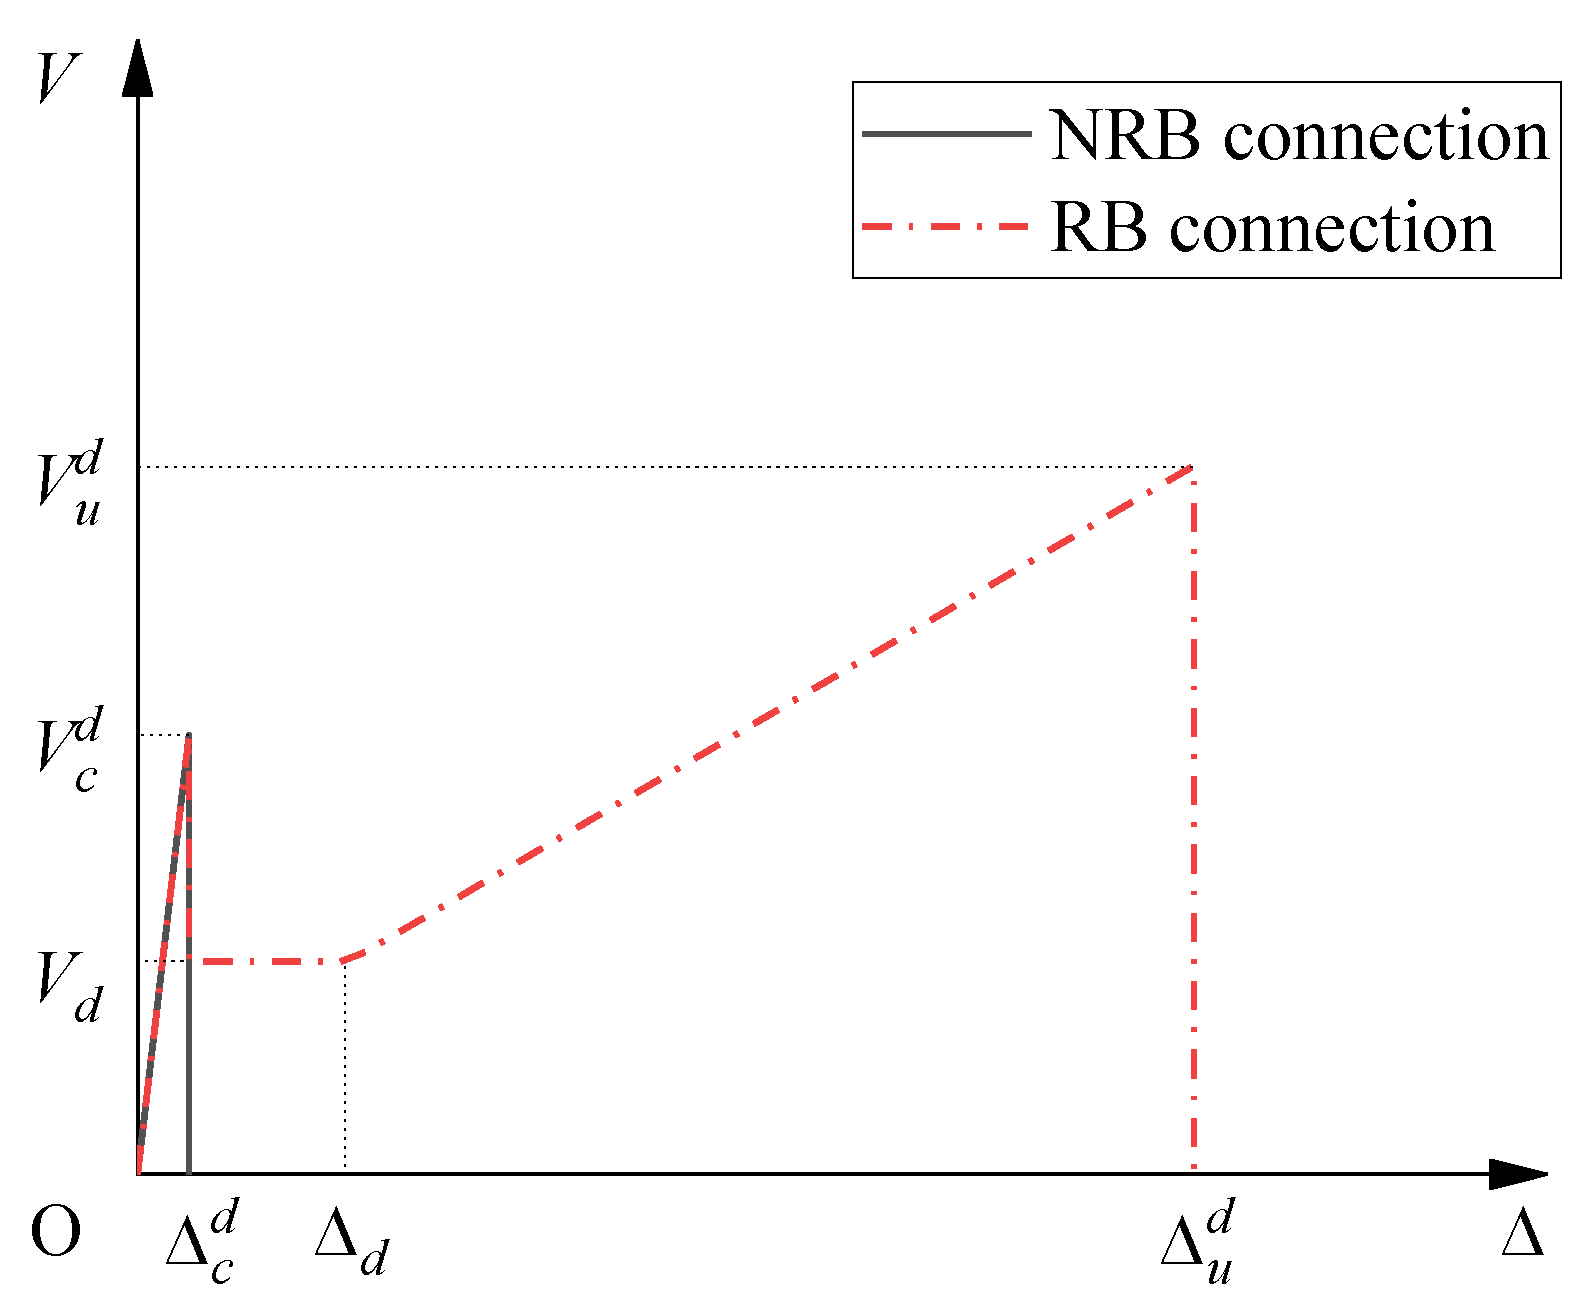
3.5.5. Relationship between V and ∆

Little research has been done on the relationship of V and ∆ for shear key connections used in adjacent box-beam bridges. Generally, when the shear key is intact, ∆ is assumed to be zero, and when the shear key is damaged, V is set to the product of ∆ and the stiffness of the shear key or just assumed as zero in the calculation [32,36,47].
Ye et al. [28] investigated the shear performance of shear keys by monolithically increasing force-controlled bi-shear tests. They presented two typical τ-∆ curves, where τ was the shear stress obtained from dividing V by the interface area (see Figure 12). Both the blocks and joints were cast with concrete. Curve 1 and Curve 2 presented shear keys without and with reinforcing steel bars connecting blocks and joints, respectively. For both curves, stress τ increased with ∆ slowly before ∆ around 130 μm; then, an almost linear relationship between τ and ∆ was obtained until cracking. After the cracking, a minor increase in τ resulted in a large increase in ∆. The specimen without reinforcing steel bars failed at this time. Then, the specimen with reinforcing bars came into another almost linear relationship between τ and ∆ until it failed. Because the load was monolithically increasingly applied in their study, the load dropping after cracking for specimens with reinforcing bars was not captured. Uneven surfaces of specimens may explain why τ increased slowly with ∆ at the very beginning.
Rizkalla et al. [48] investigated the performance of flat and keyed joints used in shear wall panels with a compressive preload pressure of 2 MPa and 4 MPa normal to the shear-resistant surface under a direct shear test. Both outside blocks and the joint were cast with concrete. At first, the load was subjected to force control. After the maximum load was attained, the test continued with stroke control. The load–slip curves obtained from the test with different key configurations were similar. They presented a typical load–slip curve for multiple shear key connections, as shown in Figure 13. The curve is linear before cracking and has a load drop after the maximum load. For compressive stress used normal to the connection, the load remains steady even at large slips.
Instead of keyed joints, some researchers studied the relationship between the shear force and slip at two concrete interfaces cast at different times by bi-shear or direct shear tests [49,50,51]. The shapes of the shear–slip curves for specimens without and with steel bars at the interface are similar to those depicted in Figure 7a,b, respectively.
Based on the results of all these tests, the V-∆ curves can be simplified into two types, one without reinforcing bars as Type I and Type II connection (NRB connection), and the other with reinforcing bars as Type III and Type IV connection (RB connection), as shown in Figure 14. As the results of the CFS and CDS tests showed that the elastic limit is around 0.6 Vc, and when ∆ is in the descending part, the NRB connection could not provide steady shear transfer; the relationship between V and ∆ can be simplified as:
V = { k c Δ ( 0 Δ Δ c d ) 0 ( Δ > Δ c d )
where 0.6 ∆c is recommended for the value of Δ c d . Similarly, the shear transfer in the second descending part for the RB connection can also be set to zero. In addition, the relationship between V and ∆ for the RB connection can be simplified as:
V = { k c Δ ( 0 Δ Δ c d ) V d ( Δ c d < Δ < Δ d ) V d + k p ( Δ Δ d ) ( Δ d Δ Δ u d ) 0 ( Δ > Δ u d )
where Δ u d is the correction value of ∆u based on the difference in static and dynamic motion.

4. FE Analysis

In the present study, FE analyses were performed using the software Abaqus 2018. Two FEMs were established, one based on the SDS test of the Type I specimen to calibrate the interface parameters and the other based on the Type III specimen to validate the interface parameters.

4.1. FEMs

The concrete blocks, joints, overlays, and steel plates were modeled with 8-node brick elements. Steel bars were modeled with 2-node trusses. The concrete damaged plasticity (CDP) model was used to model concrete behavior. The classical metal plasticity model with isotropic hardening was used to model steel behavior. Hard contact and friction were used to model the interface between the specimen and steel plate. The traction–separation constitutive model was used to model the interface of the block and joint. Full bond was used at the overlay–block and overlay–joint interfaces. Steel bars were embedded in the whole model. The two FEMs are shown in Figure 15.

4.2. Traction–Separation Constitutive Model
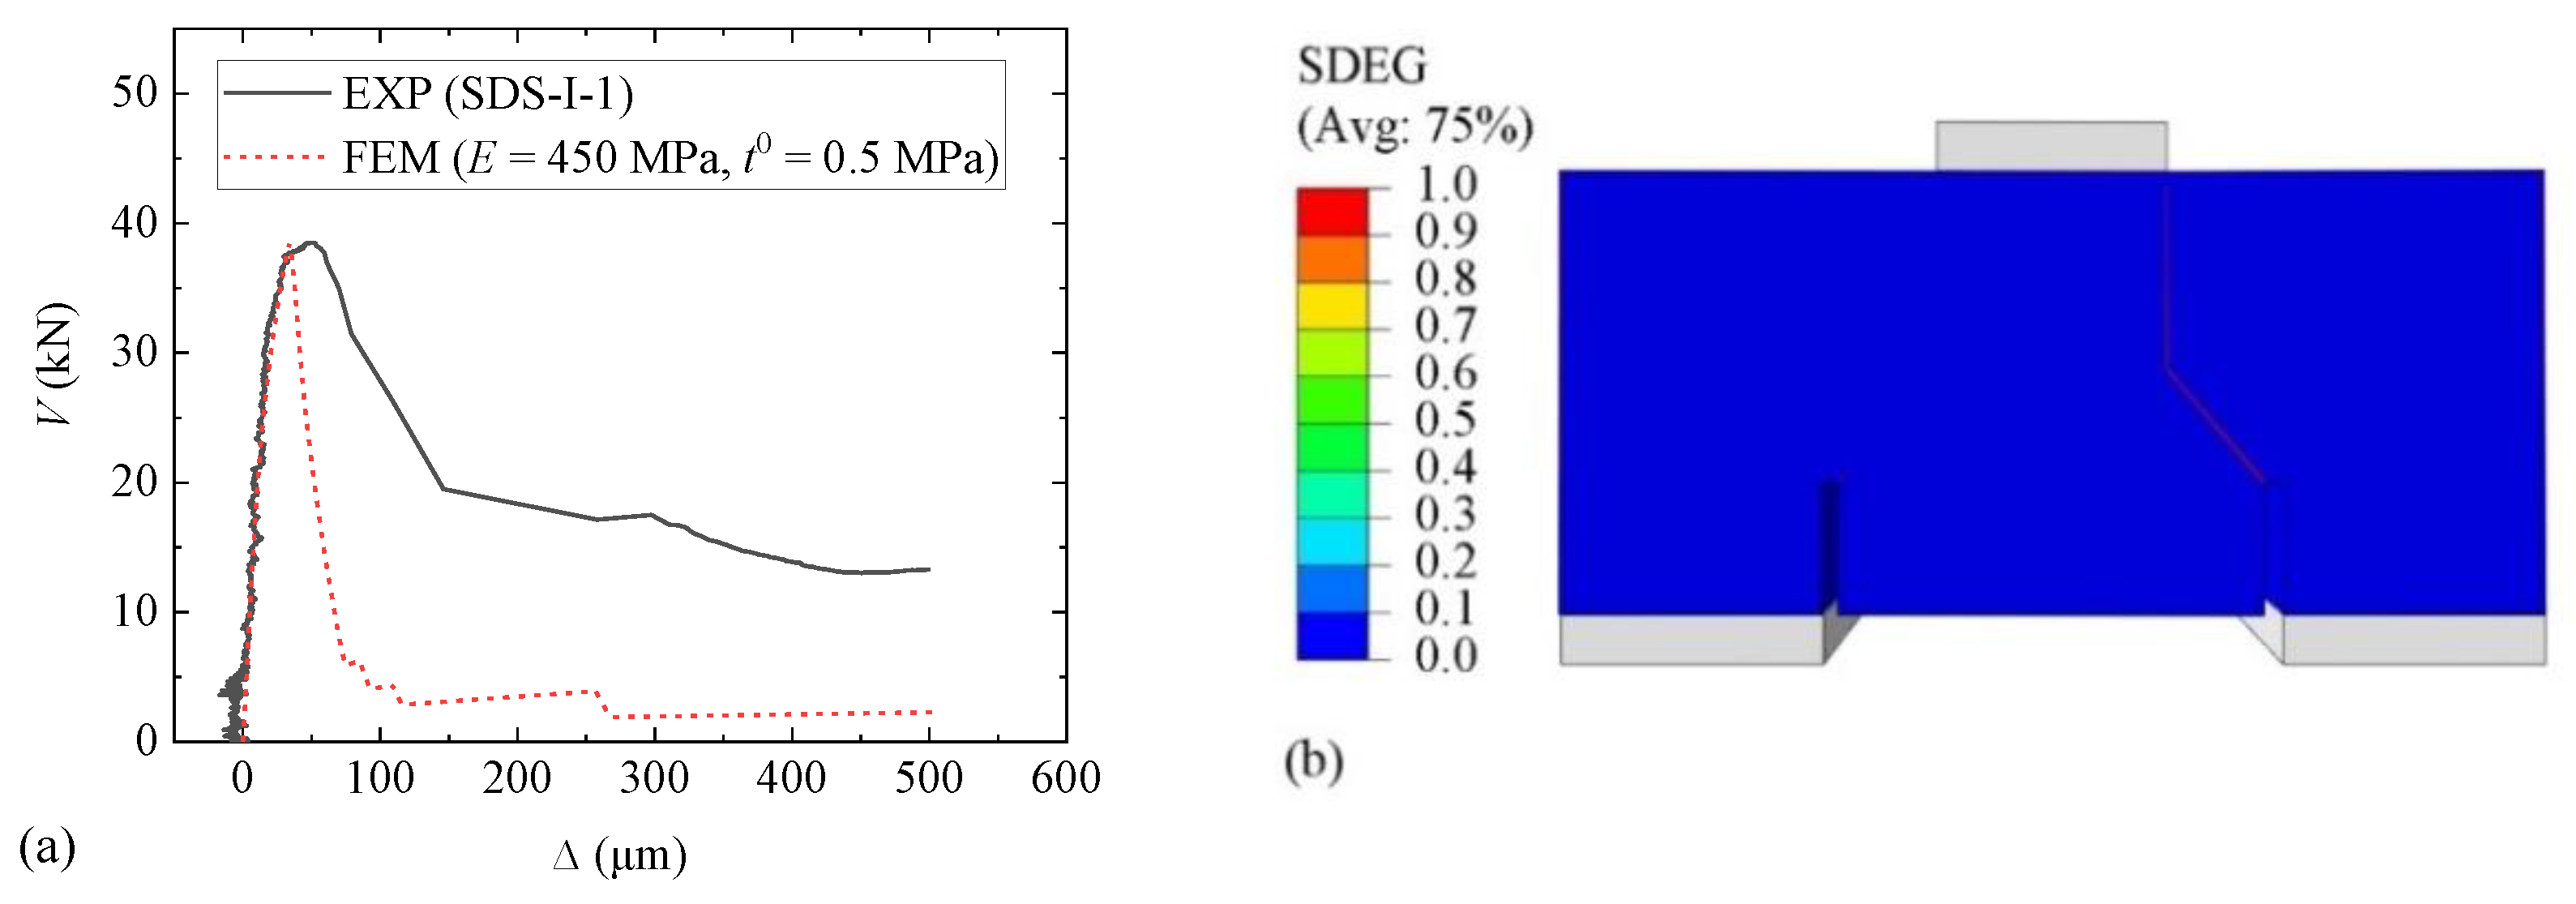
The traction–separation constitutive model offers a method to model thin bonded interfaces whose geometric thickness may be considered to be zero for all practical purposes [52]. The constitutive thickness of interfaces is 1 unit by default and can be specified by users. Note that other input parameters in the model are based on the defined thickness value. The default number 1 was adopted in this study, and the length unit is mm.
The whole traction–separation model contains linear elastic traction–separation, damage initiation criteria, and a damage evolution model. The linear elastic traction–separation model contains stiffness parameters En, Es, and Et, representing normal and tangential stiffness components. The quadratic nominal stress criterion was used in this study as a damage initiation criterion and can be represented as
( t n t n 0 ) 2 + ( t s t s 0 ) 2 + ( t t t t 0 ) 2 = 1
where tn, ts, and tt represent the normal and tangential stress components; t n 0 , t s 0 , and t t 0 represent peak values of the nominal stress when the deformation is either purely normal to the interface or purely in the first or the second shear direction. The symbol <> used in Equation (5) represents the Macaulay bracket with the usual interpretation. Damage is initiated only when the left part of Equation (5) equals 1. Once damage initiation has occurred, damage evaluation is determined on the fracture energy. In this study, the stiffness, peak stress, and fracture energy components in different directions were assumed to be the same [13], referred to as E, t0, and G below.
In the FEM, the initial values of stiffness components were set to 380 MPa, deduced from the direct shear test on specimens composed of concretes cast at different times conducted by Harries et al. [50]. They used concretes with 28-day compressive strengths of 41.5 MPa and 29.1 MPa for old and new parts, respectively, and the interfaces were roughened to at least 6.4 mm amplitude before casting the new part. The initial values of peak stress components were determined by Vc divided by the connection area projected to the vertical plane. The initial values of fracture energy components were set to 0.1 N/mm based on that of concrete [53]. Then, these material parameters were calibrated during simulation so that the V-∆ curves of the model could match the experimental results.

4.3. FE Results

A comparison of the V-∆ curves resulting from the calibrated FEM and the experimental result (EXP) for Specimen SDS-I-1 is shown in Figure 16a. E and t0 were calibrated to 450 MPa and 0.5 MPa, respectively. Values of fracture energy components ranging from 0.01 to 1.00 N/mm had been tried during the simulation, but little changed in the shape of V-∆ curves. The curves matched well in the ascending part but not in the descending part. However, the descending part is of minor importance; thus, the result is acceptable. The scalar stiffness degradation (SDEG), indicating the damage degree of model elements, is shown in Figure 16b, where SDEG = 0 indicates intact status and SDEG = 1 failure status. The damage status is similar to that shown in Figure 8a. For all Type I specimens, values of stiffness components with a range of 120 to 450 MPa and peak stress components with a range of 0.5 to 0.6 MPa are recommended.
A comparison of the V-∆ curves for the second FEM result using material parameters obtained from the first FEM and the experimental result of SDS-III-1 is shown in Figure 17a. Values of stiffness components and peak stress components were 450 MPa and 0.5 MPa, respectively, the same as those for Specimen SDS-I-1. Both ascending parts before and after cracking showed good agreement, and the damage status shown in Figure 17b is similar to that in Figure 9a.

5. Conclusions

Static and dynamic bi-shear tests were conducted on four types of transverse connections used in adjacent box-beam bridges to evaluate their shear transfer performance before and after cracking. FEMs were developed to calibrate and validate the interfacial material parameters. Based on the results obtained from this study, the following conclusions can be drawn:
  • Adding overlays and reinforcing bars increased Vc and Vu by 53% and 235%, respectively, for the Type I specimen, and by 21% and 187%, respectively, for the Type II specimen.
  • All four types of connection could remain intact under the dynamic loading under approximately 0.6Vc. When the Type I and Type II connections cracked, the load transfer failed quickly under cyclic loading. Although the Type III and Type IV connections cracked, the load transfer could still be maintained under a relatively low force or displacement cyclic loading.
  • The V-∆ curves for Type I and Type II could be simplified as a bilinear curve; the V-∆ curves for Type III and Type IV could be simplified as a combination of two bilinear curves corresponding to before and after cracking performance, respectively. The corresponding formulas, Equations (3) and (4), were proposed for engineering applications.
  • FEM results agreed well with EXP results. Values ranging from 120 MPa to 450 MPa for stiffness components and values ranging from 0.5 MPa to 0.6 MPa for peak stress components were recommended for interface materials with a unit thickness (1 mm) when using the traction–separation model.

Author Contributions

Conceptualization, X.N., Y.X. and R.X.; methodology, X.N., Y.X. and R.X.; investigation, X.N.; formal analysis, X.N. and R.X.; writing—original draft preparation, X.N., A.O.A. and G.W.; writing—review and editing, X.N., G.W. and R.X.; supervision, Y.X. and R.X. All authors have read and agreed to the published version of the manuscript.

Funding

This research was supported by the National Natural Science Foundation of China, grant number 51478422.

Institutional Review Board Statement

Not applicable.

Informed Consent Statement

Not applicable.

Data Availability Statement

Data are contained within the article.

Conflicts of Interest

The authors declare no conflict of interest.

References

  1. Lall, J.; Alampalli, S.; DiCocco, E.F. Performance of full-depth shear keys in adjacent prestressed box beam bridges. PCI J. 1998, 43, 72–79. [Google Scholar] [CrossRef]
  2. Russell, H.G. Adjacent Precast Concrete Box Beam Bridges: Connection Details; The National Academies Press: Washington, DC, USA, 2009. [Google Scholar]
  3. Naito, C.; Sause, R.; Hodgson, I.; Pessiki, S.; Macioce, T. Forensic Examination of a noncomposite adjacent precast prestressed concrete box beam bridge. J. Bridge Eng. 2010, 15, 408–418. [Google Scholar] [CrossRef]
  4. Huckelbridge, A.A.; El-Esnawi, H.; Moses, F. Shear key performance in multibeam box girder bridges. J. Perform. Constr. Facil. 1995, 9, 271–285. [Google Scholar] [CrossRef]
  5. Balakumaran, S.S.G.; Kassner, B.L.; Wyers, R.E. Forensic Investigation of Two Voided Slab Bridges in the Virginia Department of Transportation’s Richmond District; Virginia Transportation Research Council: Charlottesville, VA, USA, 2017. [Google Scholar]
  6. Frosch, R.J.; Williams, C.S.; Molley, R.T.; Whelchel, R.T. Concrete Box Beam Risk Assessment and Mitigation: Volume 2—Evaluation and Structural Behavior; Purdue University: West Lafayette, IN, USA, 2020. [Google Scholar]
  7. Wang, Q.; Wu, Q.X.; Chen, B.C. Experimental study on failure mode of hinged joint in assembly voided slab bridge. Eng. Mech. 2014, 31 (Suppl. 1), 115–120. [Google Scholar]
  8. Yuan, J.; Graybeal, B. Full-scale testing of shear key details for precast concrete box-beam bridges. J. Bridge Eng. 2016, 21, 04016043. [Google Scholar] [CrossRef]
  9. Yuan, J.; Graybeal, B.; Zmetra, K. Adjacent Box Beam Connections: Performance and Optimization; Federal Highway Administration Office of Infrastructure Research and Development: Washington, DC, USA, 2018. [Google Scholar]
  10. Miller, R.A.; Hlavacs, G.M.; Long, T.; Greuel, A. Full-scale testing of shear keys for adjacent box girder bridges. PCI J. 1999, 44, 80–90. [Google Scholar] [CrossRef] [Green Version]
  11. Leng, Y.; Zhang, J.; Jiang, R.; Cooper, S.; He, H.; Cheng, S. Experimental research on transverse load distribution of prefabricated hollow slab concrete bridges with hinge joint cracks. In Proceedings of the Transportation Research Board 94th Annual Meeting, Washington, DC, USA, 11–15 January 2015. [Google Scholar]
  12. Grace, N.F.; Jensen, E.; Bebawy, M. Transverse post-tensioning arrangement for side-by-side box-beam bridges. PCI J. 2012, 57, 48–63. [Google Scholar] [CrossRef]
  13. Hussein, H.H.; Walsh, K.K.; Sargand, S.M.; Al Rikabi, F.T.; Steinberg, E.P. Modeling the Shear Connection in adjacent box-beam bridges with ultrahigh-performance concrete joints. I: Model calibration and validation. J. Bridge Eng. 2017, 22, 04017043. [Google Scholar] [CrossRef]
  14. Mutashar, R.; Sargand, S.; Al Rikabi, F.T.; Khoury, I. Response of a composite-adjacent box beam bridge with skewed beams under static and quasi-static loads. J. Perform. Constr. Facil. 2019, 33, 04019022. [Google Scholar] [CrossRef]
  15. Huckelbridge, A.A.; El-Esnawi, H. Evaluation of Improved Shear Key Designs for Multi-Beam Box Girder Bridges; Department of Civil Engineering, Case Western Reserve University: Cleveland, OH, USA, 1997. [Google Scholar]
  16. Ulku, E.; Attanayake, U.; Aktan, H.M. Rationally designed staged posttensioning to abate reflective cracking on side-by-side box-beam bridge decks. Transp. Res. Rec. 2010, 2172, 87–95. [Google Scholar] [CrossRef]
  17. Lopez de Murphy, M.; Kim, J.; Sang, Z.; Xiao, C. Determining More Effective Approaches for Grouting Shear Keys of Adjacent Box Beams; Pennsylvania State University: State College, PA, USA, 2010. [Google Scholar]
  18. Grace, N.F.; Jensen, E.; Matsagar, V.; Bebawy, M.; Soliman, E.; Hanson, J. Use of Unbonded CFCC for Transverse Post-Tensioning of Side-by-Side Box-Beam Bridges; Michigan Department of Transportation: Lansing, MI, USA, 2008. [Google Scholar]
  19. Chen, L.F.; Graybeal, B.A. Modeling structural performance of second-generation ultrahigh-performance concrete pi-girders. J. Bridge Eng. 2012, 17, 634–643. [Google Scholar] [CrossRef]
  20. Hussein, H.H.; Sargand, S.M.; Steinberg, E.P. Shape optimization of UHPC shear keys for precast, prestressed, adjacent box-girder bridges. J. Bridge Eng. 2018, 23, 04018009. [Google Scholar] [CrossRef]
  21. Mutashar, R.N.; Sargand, S.; Khoury, I.; Al Rikabi, F.T. Influence of nonuniform box beam dimensions and bridge transverse slope on environmentally induced stresses in adjacent box beam bridges. J. Perform. Constr. Facil. 2018, 32, 04018081. [Google Scholar] [CrossRef]
  22. Porter, S.D.; Julander, J.L.; Halling, M.W.; Barr, P.J.; Boyle, H.; Xing, S. Flexural testing of precast bridge deck panel connections. J. Bridge Eng. 2011, 16, 422–430. [Google Scholar] [CrossRef]
  23. Habouh, M. Key Way Joint Strength of Precast Box-Beam Bridges. Ph.D. Thesis, University of Akron, Akron, OH, USA, 2015. [Google Scholar]
  24. Gulyas, R.J.; Wirthlin, G.J.; Champa, J.T. Evaluation of keyway grout test methods for precast concrete bridges. PCI J. 1995, 40, 44–57. [Google Scholar] [CrossRef]
  25. Gulyas, R.J.; Champa, J.T. Use of composite testing for evaluating of keyway grout for precast prestressed bridge beams. ACI Mater. J. 1997, 94, 244–250. [Google Scholar]
  26. Issa, M.A.; Valle, C.L.R.D.; Abdalla, H.A.; Islam, S.; Issa, M.A. Performance of transverse joint grout materials in full-depth precast concrete bridge deck systems. PCI J. 2003, 48, 92–103. [Google Scholar] [CrossRef]
  27. Porter, S.D.; Julander, J.L.; Halling, M.W.; Barr, P.J. Shear testing of precast bridge deck panel transverse connections. J. Perform. Constr. Facil. 2012, 26, 462–468. [Google Scholar] [CrossRef]
  28. Ye, J.S.; Liu, J.S.; Yu, B.; Fu, Y.X. Experiment on shear property of hinge joints of concrete hollow slab. J. Highw. Transp. Res. Dev. 2013, 30, 33–39. [Google Scholar]
  29. Hussein, H.H.; Sargand, S.M.; Al Rikabi, F.T.; Steinberg, E.P. Laboratory evaluation of ultrahigh-performance concrete shear key for prestressed adjacent precast concrete box girder bridges. J. Bridge Eng. 2017, 22, 04016113. [Google Scholar] [CrossRef]
  30. Yi, S.T.; Yang, E.I.; Choi, J.C. Effect of specimen sizes, specimen shapes, and placement directions on compressive strength of concrete. Nucl. Eng. Des. 2006, 236, 115–127. [Google Scholar] [CrossRef]
  31. Zhang, X.; Zhang, S.; Luo, Y.; Wang, L. Effects of Interface Orientations on Bond Strength between Old Conventional Concrete and New Self-Consolidating Concrete. ACI Struct. J. 2020, 117, 191–201. [Google Scholar]
  32. Hambly, E.C. Bridge Deck Behavior, 2nd ed.; Chapman & Hall: London, UK, 1991; pp. 71–74. [Google Scholar]
  33. Precast/Prestressed Concrete Institute (PCI). PCI Bridge Design Manual, 3rd ed.; PCI: Chicago, IL, USA, 2014. [Google Scholar]
  34. American Association of State Highway and Transportation Officials (AASHTO). AASHTO LRFD Bridge Design Specifications, 8th ed.; American Association of State Highway and Transportation Officials, Inc.: Washington, DC, USA, 2017. [Google Scholar]
  35. Canadian Standards Association (CSA). Canadian Highway Bridge Design Code; CSA Group: Toronto, ON, Canada, 2019. [Google Scholar]
  36. Walsh, K.K.; Kelly, B.T.; Steinberg, E.P. Damage identification for prestressed adjacent box-beam bridges. Adv. Civ. Eng. 2014, 2014, 540363. [Google Scholar] [CrossRef] [Green Version]
  37. Song, G.X. Research on Hinge Joint Damage Identification Method of Hollow Slab Bridge Based on Influence Line of Lateral Load Distribution. Master’s Thesis, Dalian University of Technology, Dalian, China, 2020. [Google Scholar]
  38. Zhan, J.; Zhang, F.; Siahkouhi, M.; Kong, X.; Xia, H. A damage identification method for connections of adjacent box-beam bridges using vehicle–bridge interaction analysis and model updating. Eng. Struct. 2021, 228, 111551. [Google Scholar] [CrossRef]
  39. Zhejiang Provincial Department of Transport. Manual for Prevention and Repairing of Typical Defects in Medium and Small Span Bridge; China Communications Press: Beijing, China, 2011; pp. 1–31.
  40. Ministry of Transport of the People’s Republic of China. JTG D60—2015; General Specifications for Design of Highway Bridges and Culverts. China Communication Press: Beijing, China, 2015.
  41. Ministry of Construction of the People’s Republic of China. GB/T 50081—2002; Standard for Test Method of Mechanical Properties on Ordinary Concrete. China Architecture & Building Press: Beijing, China, 2003.
  42. Ministry of Housing and Urban-Rural Development of the People’s Republic of China. GB/T 50107–2010; Standard for Evaluation of Concrete Compressive Strength. China Architecture & Building Press: Beijing, China, 2010.
  43. Ministry of Housing and Urban-Rural Development of the People’s Republic of China. GB 50107–2010; Code for Design of Concrete Structures. China Architecture & Building Press: Beijing, China, 2015.
  44. State General Administration of the People’s Republic of China. GB/T 1499.1—2017; Steel for the Reinforcement of Concrete—Part 1: Hot Rolled Plain Bars. China Standard Press: Beijing, China, 2017.
  45. State General Administration of the People’s Republic of China. GB/T 1499.2—2018; Steel for the Reinforcement of Concrete—Part 2: Hot Rolled Ribbed Bars. China Standard Press: Beijing, China, 2018.
  46. Chen, W.F.; Saleeb, A.F. Constitutive Equations for Engineering Materials: Elasticity and Modeling; Elsevier Science B.V.: Amsterdam, The Netherlands, 1994; pp. 257–259. [Google Scholar]
  47. Zhou, Z.; Yuan, G.; Tian, Q. Evaluation method for hinge joint damage in multi-slab girder bridge based on stiffness of hinge joint. China J. Highw. Transp. 2013, 26, 26–121. [Google Scholar]
  48. Rizkalla, S.H.; Serrette, R.L.; Heuval, J.S.; Attiogbe, E.K. Multiple shear key connections for precast shear wall panels. PCI J. 1989, 34, 104–120. [Google Scholar] [CrossRef]
  49. Liu, J. Study on the mechanics performance of adherence of young on old concrete. Ph.D. Thesis, Dalian University of Technology, Dalian, China, 2000. [Google Scholar]
  50. Harries, K.A.; Zeno, G.; Shahrooz, B. Toward an improved understanding of shear-friction behavior. ACI Struct. J. 2012, 109, 835–844. [Google Scholar]
  51. Liu, J.; Fang, J.X.; Chen, J.J.; Xu, G. Evaluation of design provisions for interface shear transfer between concretes cast at different times. J. Bridge Eng. 2019, 24, 06019002. [Google Scholar] [CrossRef]
  52. Dassault Systèmes. Abaqus Analysis User’s Guide; Dassault Systèmes: Waltham, MA, USA, 2016. [Google Scholar]
  53. Bažant, Z.P.; Becq-Giraudon, E. Statistical prediction of fracture parameters of concrete and implications for choice of testing standard. Cem. Concr. Res. 2002, 32, 529–556. [Google Scholar] [CrossRef]
Figure 1. Configuration of specimens (note: all dimensions in mm): (a) Type I; (b) Type II; (c) Type III; (d) Type IV; (e) detail drawing of N1 steel bar.
Materials 15 01459 g001
Figure 2. Specimen construction procedure.
Materials 15 01459 g002
Figure 3. Test setup for bi-shear method.
Materials 15 01459 g003
Figure 4. Layouts of instruments: (a) DIC instruments; (b) dial gauges.
Materials 15 01459 g004
Figure 5. Data extracted positions.
Materials 15 01459 g005
Figure 6. Loading procedure for CDS test.
Materials 15 01459 g006
Figure 7. V-∆ plots of SDS test for typical specimens: (a) Specimen SDS-I-1 and SDS-II-1; (b) Specimen SDS-III-3 and SDS-IV-1.
Materials 15 01459 g007
Figure 8. Failure modes of specimens: (a) Type I specimen; (b) Type II specimen.
Materials 15 01459 g008
Figure 9. Failure modes of specimens: (a) Type III specimen; (b) Type IV specimen.
Materials 15 01459 g009
Figure 10. V-t and w-t plots of the CFS test for typical specimens: (a) Specimen CFS-II-2 and (b) Specimen CFS-IV-3.
Materials 15 01459 g010
Figure 11. w-t and V-t plots of the CDS test for typical specimens: (a) Specimen CDS-II-1; (b) Specimen CDS-IV-2
Materials 15 01459 g011
Figure 12. τ-∆ plots (data from Ye et al. [28]).
Materials 15 01459 g012
Figure 13. Load–slip curve (data from Rizkalla et al. [48]).
Materials 15 01459 g013
Figure 14. Typical V-∆ plots for NRB and RB connection.
Materials 15 01459 g014
Figure 15. FEMs: (a) the SDS test for Type I specimen; (b) the SDS test for Type III specimen.
Materials 15 01459 g015
Figure 16. Results for Specimen SDS-I-1: (a) V-∆ curves; (b) damage status.
Materials 15 01459 g016
Figure 17. Results for Specimen SDS-III-3: (a) V-∆ curves; (b) damage status.
Materials 15 01459 g017
Table 1. Mix design for C30.
ConstituentC30 (kg/m3)C40 (kg/m3)
Aggregate 9731000
Sand845791
Cement type 42.5/52.5 1284300
Water9289
Fly ash 3520
Mineral powder 6394
Polycarboxylates high-performance water-reducing admixture88
1 Cement type 42.5 was used for C30, and cement type 52.5 was used for C40.
Table 2. Results of SDS test.
SpecimenVc (kN)Vp (kN)Vd (kN)Vu (kN)kc (kN/μm)kp (kN/μm)p (μm)u (μm)Co (μm)
SDS-I-138.538.5 38.51.61 5050
SDS-I-249.049.0 49.00.87 7272
SDS-I-343.843.8 43.80.98 7878
CFS-I-1 145.445.4 45.41.15 5555
Average44.244.2 44.2
SDS-II-139.343.0 43.01.52 7676
SDS-II-253.255.5 55.50.43 226226
SDS-II-356.456.4 56.41.31 5757
CFS-II-2 172.272.2 72.21.60 4545
Average54.856.0 56.0
SDS-III-1 262.462.428.7- -27--
SDS-III-262.762.718.8160.11.810.044040204378
SDS-III-371.771.746.9139.11.950.056821323524
CFS-III-1 173.073.053.2145.12.010.045528644205
Average67.567.5 148.1
SDS-IV-164.064.022.4126.11.930.046333374743
SDS-IV-258.060.532.0151.61.040.0420232874502
SDS-IV-355.355.327.3164.12.800.035552896389
CFS-IV-1 180.080.030.9172.52.400.043640927560
CFS-IV-2 178.778.729.2155.32.210.044540805020
Average66.270.0 160.9
1 The specimen was subjected to SDS test after CFS test. 2 The test was terminated when the load dropped for the first time.
Table 3. Results of CFS test.
SpecimenV (kN)V/Vc (%)Cracked?Failed?Number of Cycles (Count)
CFS-I-13068NoNo1400
CFS-I-23579YesYes10
CFS-I-33579YesYes121
CFS-II-13564NoNo1400
CFS-II-24073YesYes1314
CFS-II-34073NoNo1400
CFS-III-14059NoNo1400
CFS-III-24567YesNo28
CFS-III-34567YesNo20
CFS-IV-14060NoNo1400
CFS-IV-24568NoNo1400
CFS-IV-35076YesNo25
Table 4. Results of CDS test.
Specimen V c d   ( kN ) V u d   ( kN ) Failed?
CFS-I-138.4 Yes
CFS-I-248.5 Yes
CFS-I-344.9 Yes
Average43.9
CFS-II-155.3 Yes
CFS-II-244.2 Yes
CFS-II-355.8 Yes
Average51.8
CFS-III-161.7130.6Yes
CFS-III-266.4147.9Yes
CFS-III-3 1--
Average64.1139.3
CFS-IV-1 262.4>93.5No
CFS-IV-2 273.4>125.0No
CFS-IV-372.0127.1Yes
Average69.3-
1 The specimen was damaged due to improper operation. 2 The preset displacement was small and the specimen did not fail.
Publisher’s Note: MDPI stays neutral with regard to jurisdictional claims in published maps and institutional affiliations.

