
Modeling the Nonlinear Deformation of Highly Porous Cellular Plastics Filled with Clay Nanoplatelets


Abstract
:1. Introduction
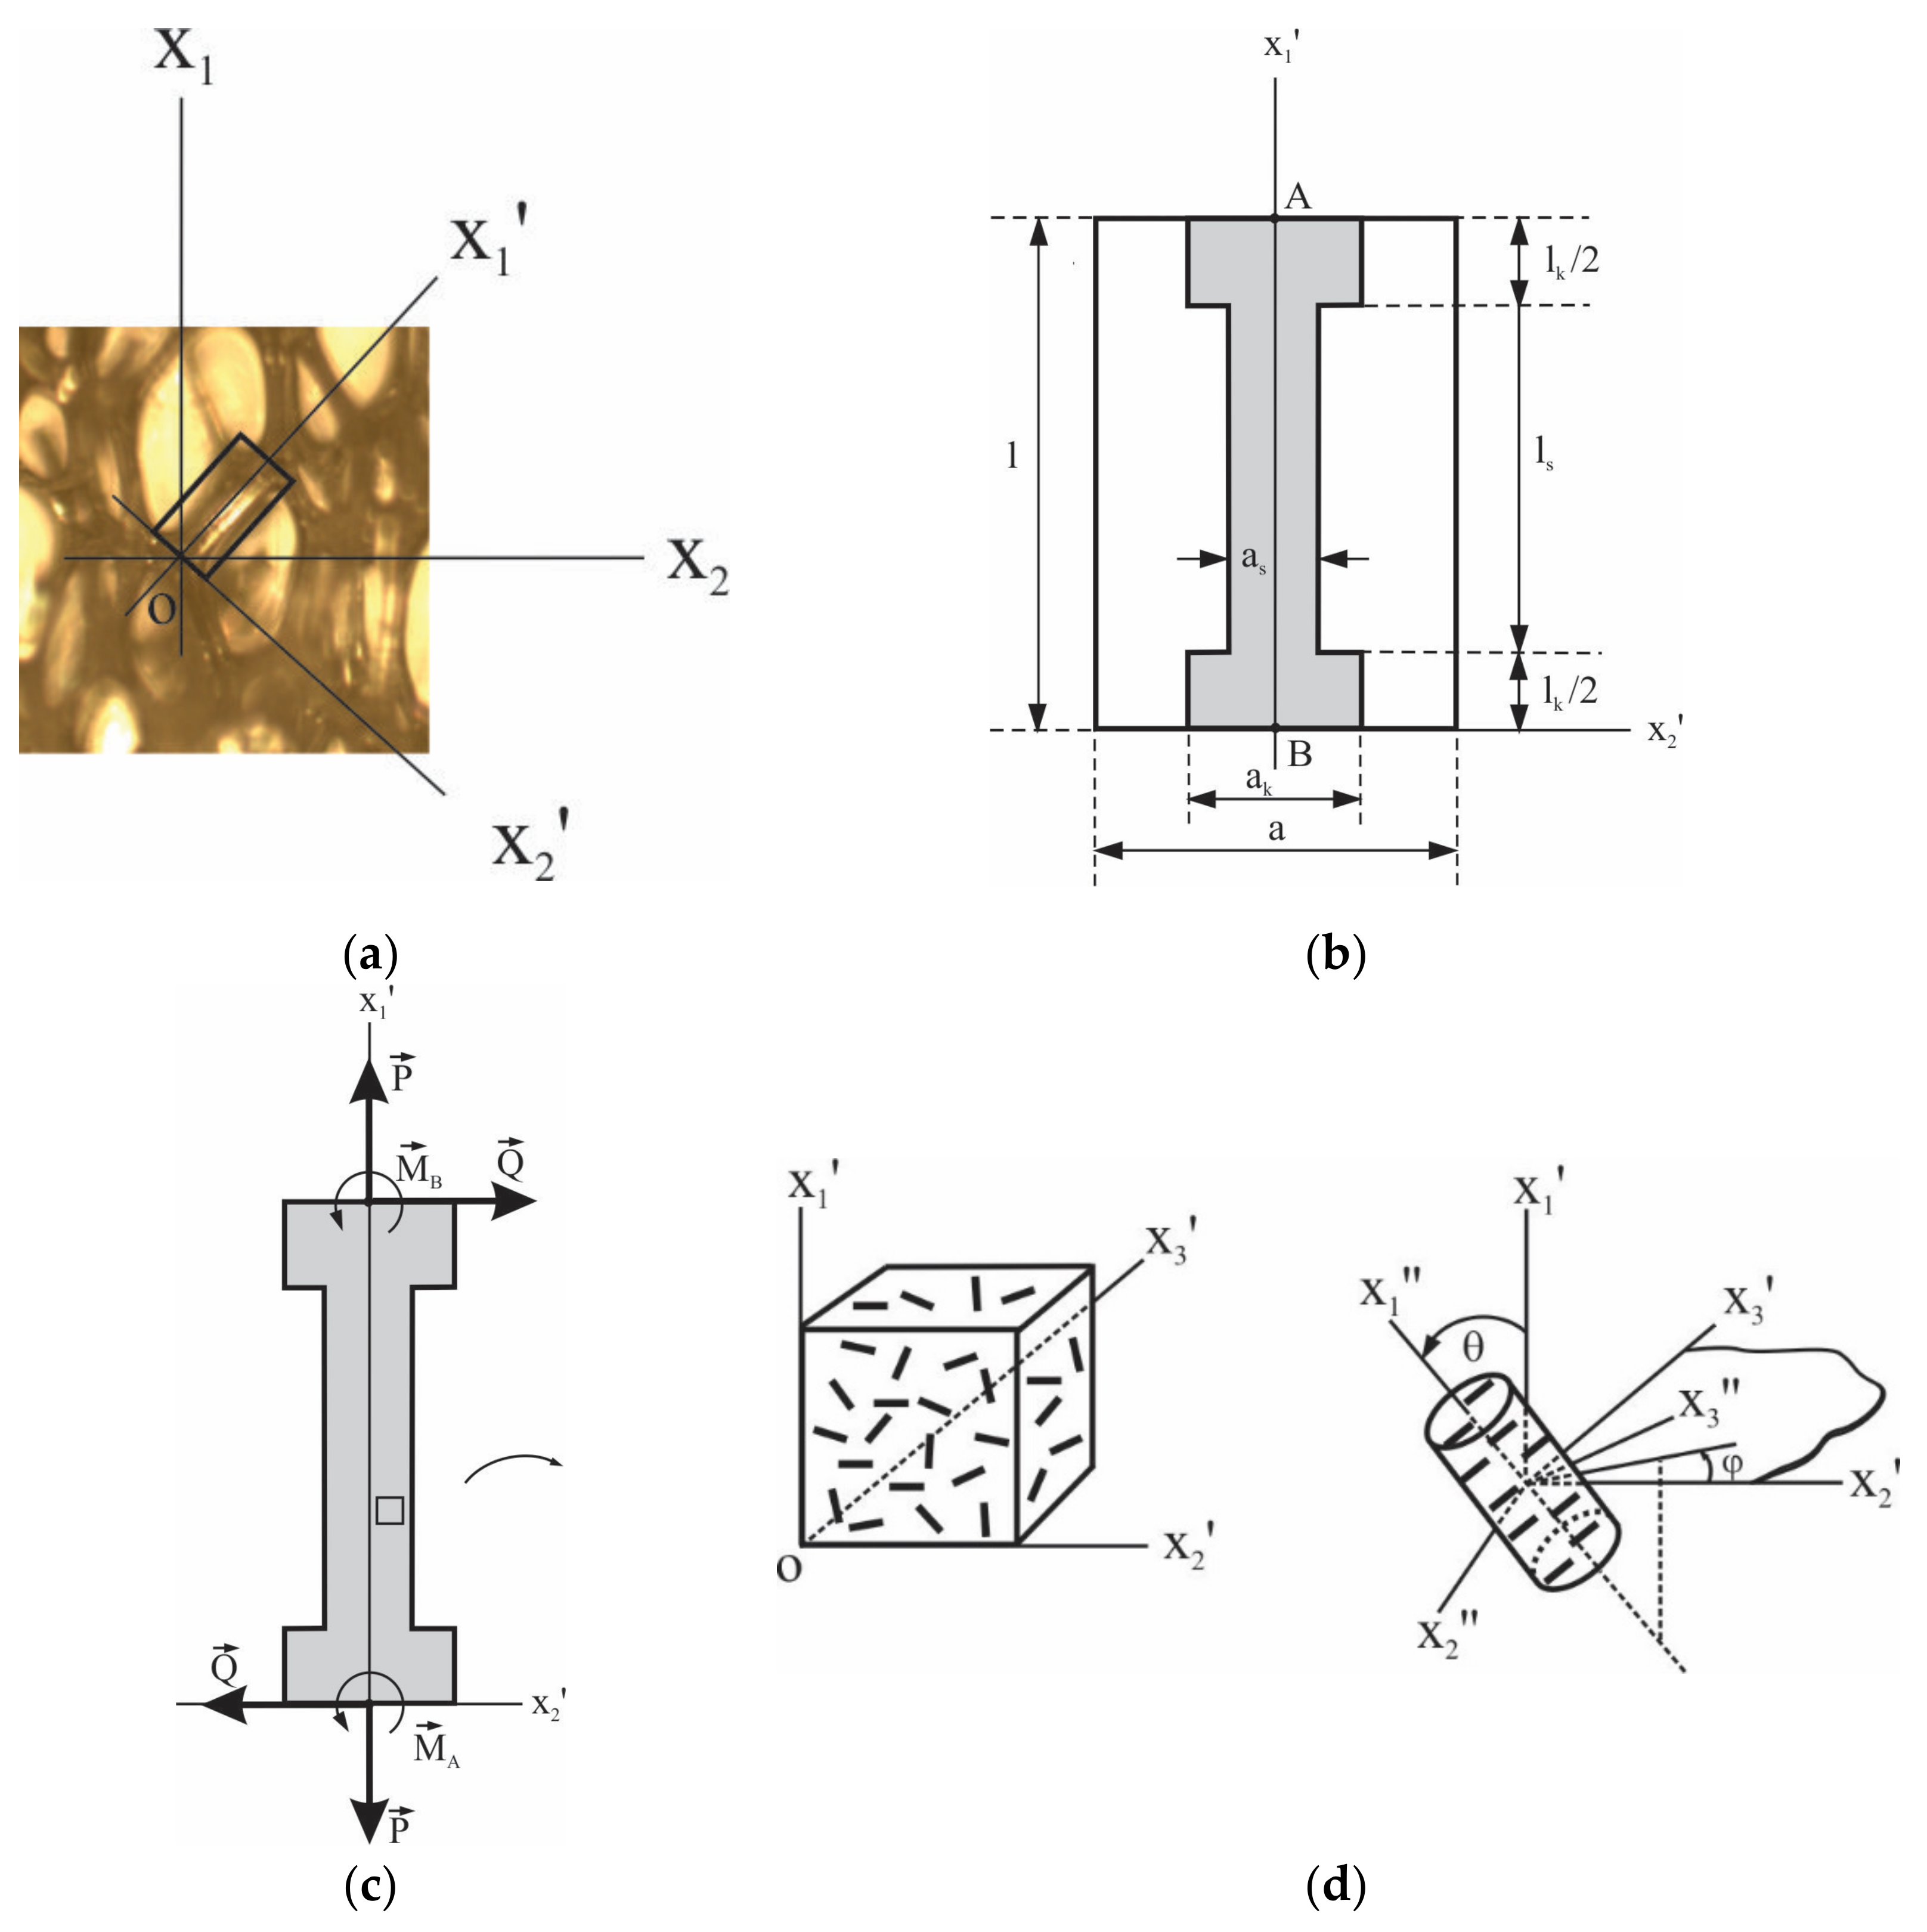
2. Structural Model
2.1. Stiffness of the Composite Material of the Load-Carrying Element
2.2. Stresses in the Structural Element
2.3. Evaluation of Foam Stresses and Foam Stiffness
3. Nonlinearity
3.1. Parabolic Functions
3.2. Elliptic Functions
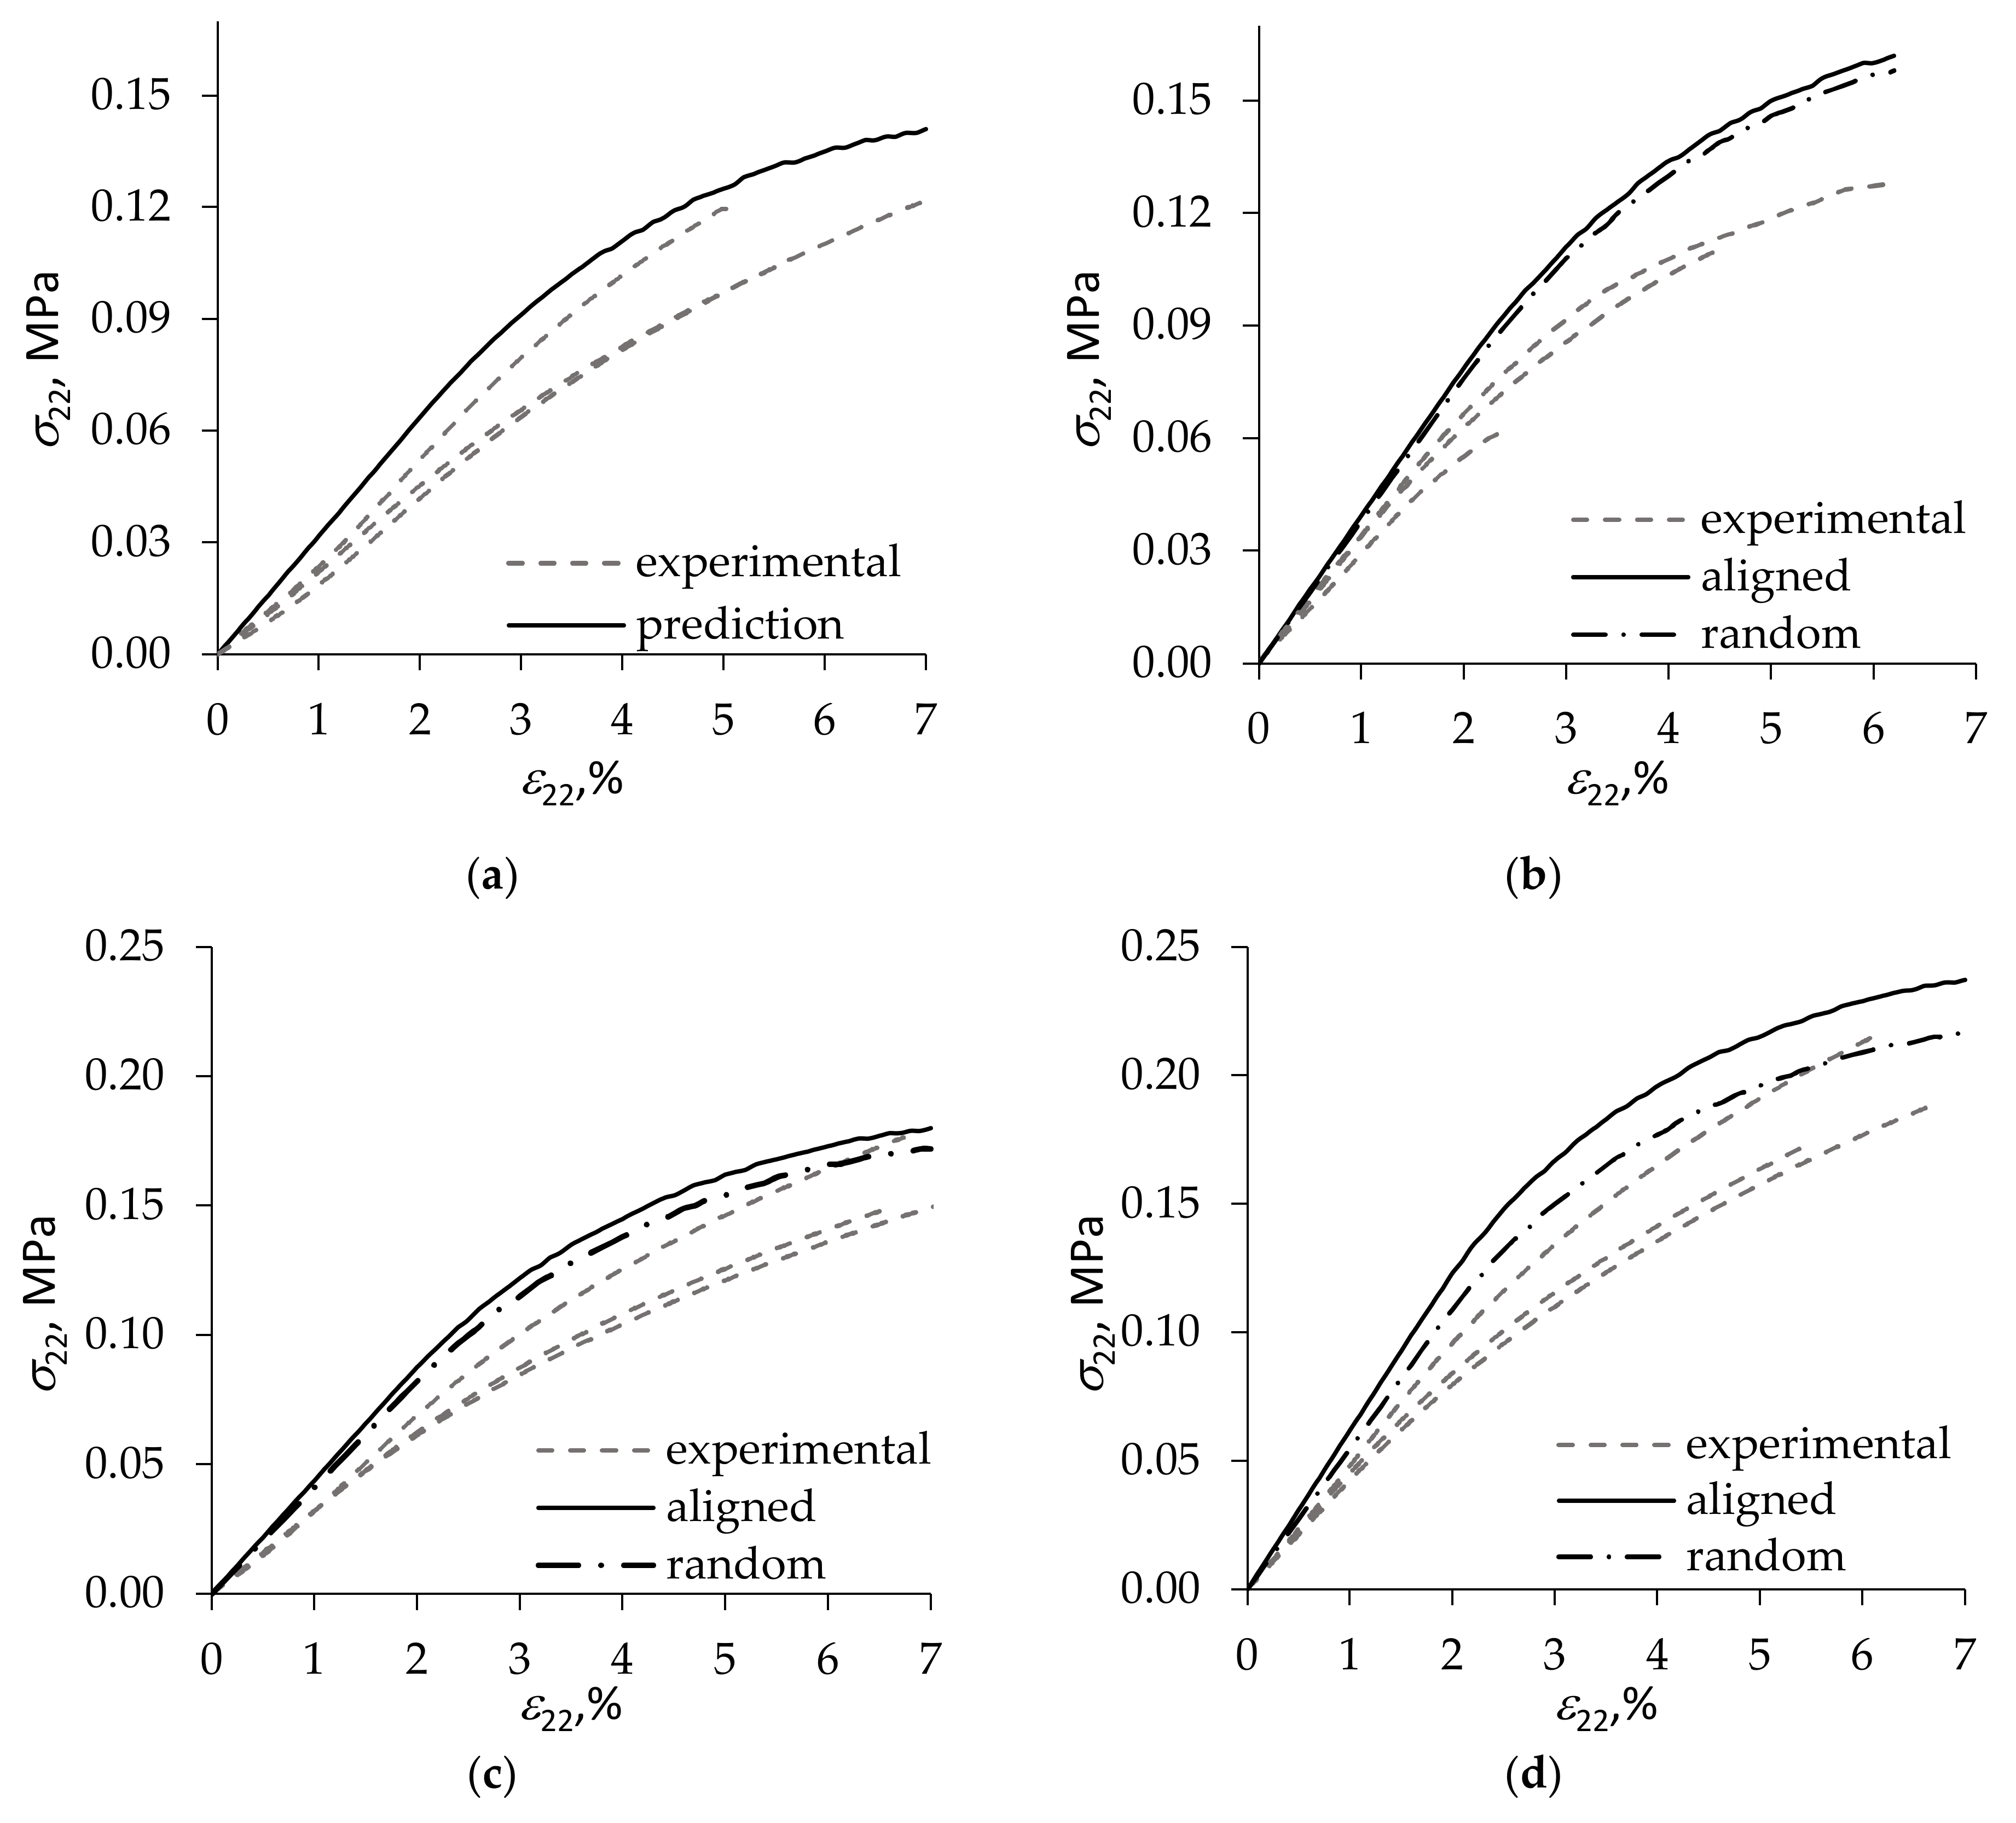
4. Comparison of Theoretical Calculations with Experimental Data
5. Conclusions
Author Contributions
Funding
Institutional Review Board Statement
Informed Consent Statement
Data Availability Statement
Conflicts of Interest
References
- Shen, J.; Han, X.; Lee, L.J. Nanoscaled reinforcement of polystyrene foams using carbon nanofibers. J. Cell. Plast. 2006, 42, 105–126. [Google Scholar] [CrossRef]
- Hussain, S.; Kortschot, M. Polyurethane foam mechanical reinforcement by low-aspect ratio microcrystalline cellulose and glass fibres. J. Cell. Plast. 2014, 51, 59–73. [Google Scholar] [CrossRef]
- Shaayegan, V.; Ameli, A.; Wang, S.; Park, C.B. Experimental observation and modeling of fiber rotation and translation during foam injection molding of polymer composites. Compos. Part A 2016, 88, 67–74. [Google Scholar] [CrossRef]
- Wang, S.; Ameli, A.; Shaayegan, V.; Kazemi, Y.; Huang, Y.; Naguib, H.E.; Park, C.B. Modelling of rod-like fillers’ rotation and translation near two growing cells in conductive polymer composite foam processing. Polymers 2018, 10, 261. [Google Scholar] [CrossRef] [PubMed] [Green Version]
- Andersons, J.; Kirpluks, M.; Cabulis, U. Reinforcement efficiency of cellulose microfibers for the tensile stiffness and strength of rigid low-density polyurethane foams. Materials 2020, 13, 2725. [Google Scholar] [CrossRef] [PubMed]
- Wang, L.; Yang, B.; Zhou, L.; Xue, B.; Yang, Z. Evolution of anisotropic bubbles and transition of the mechanical and electrical properties during a non-continuous two-step foaming of epoxy/carbon nanofiber composites. Compos. Sci. Technol. 2021, 213, 108918. [Google Scholar] [CrossRef]
- Okamoto, M.; Nam, P.H.; Maiti, P.; Kotaka, T.; Nakayama, T.; Takada, M.; Ohshima, M.; Usuki, A.; Hasegawa, N.; Okamoto, H. Biaxial flow-induced alignment of silicate layers in polypropylene/clay nanocomposite foam. Nano Lett. 2001, 1, 503–505. [Google Scholar] [CrossRef]
- Nam, P.H.; Maiti, P.; Okamoto, M.; Kotaka, T.; Nakayama, T.; Takada, M.; Ohshima, M.; Usuki, A.; Hasegawa, N.; Okamoto, H. Foam processing and cellular structure of polypropylene/clay nanocomposites. Polym. Eng. Sci. 2002, 42, 1907–1918. [Google Scholar] [CrossRef]
- Shishkina, O.; Lomov, S.V.; Verpoest, I.; Gorbatikh, L. Modeling of elastic properties of cell-wall material in nanoclay-reinforced foams. J. Cell. Plast. 2015, 52, 107–130. [Google Scholar] [CrossRef]
- Walter, T.R.; Richards, A.W.; Subhash, G. A unified phenomenological model for tensile and compressive response of polymeric foams. J. Eng. Mater. Technol. 2009, 131, 011009. [Google Scholar] [CrossRef]
- Ahern, A.; Verbist, G.; Weaire, D.; Phelan, R.; Fleurent, H. The conductivity of foams: A generalisation of the electrical to the thermal case. Colloids Surf. A Physicochem. Eng. Asp. 2005, 263, 275–279. [Google Scholar] [CrossRef]
- Huber, A.T.; Gibson, L.J. Anisotropy of foams. J. Mater. Sci. 1988, 23, 3031–3040. [Google Scholar] [CrossRef]
- Gibson, L.J.; Ashby, M.F. Cellular Solids: Structure and Properties, 2nd ed.; Cambridge University Press: Cambridge, UK, 1997. [Google Scholar]
- Dement’ev, A.G.; Tarakanov, O.G. Model analysis of the cellular structure of plastic foams of the polyurethane type. Polym. Mech. 1970, 6, 744–749. [Google Scholar] [CrossRef]
- Gong, L.; Kyriakides, S.; Jang, W.-Y. Compressive response of open-cell foams. Part I: Morphology and elastic properties. Int. J. Solids Struct. 2005, 42, 1355–1379. [Google Scholar] [CrossRef]
- Sullivan, R.M.; Ghosn, L.J.; Lerch, B.A. A general tetrakaidecahedron model for open-celled foams. Int. J. Solids Struct. 2008, 45, 1754–1765. [Google Scholar] [CrossRef] [Green Version]
- Sullivan, R.M.; Ghosn, L.J. Shear moduli for non-isotropic, open cell foams using a general elongated Kelvin foam model. Int. J. Eng. Sci. 2009, 47, 990–1001. [Google Scholar] [CrossRef]
- Sullivan, R.M.; Ghosn, L.J.; Lerch, B.A. Application of an elongated Kelvin model to space shuttle foams. J. Spacecr. Rocket. 2009, 46, 411–418. [Google Scholar] [CrossRef] [Green Version]
- Kontou, E.; Spathis, G.; Kefalas, V. Statistical model for the compressive response of anisotropic polymeric and metallic foams. J. Mater. Sci. 2012, 47, 5326–5332. [Google Scholar] [CrossRef]
- Lagzdins, A.; Zilaucs, A.; Beverte, I.; Andersons, J. Calculating the elastic constants of a highly porous cellular plastic with an oriented structure. Mech. Compos. Mater. 2013, 49, 121–128. [Google Scholar] [CrossRef]
- Gong, L.; Kyriakides, S. Compressive response of open-cell foams. Part II: Initiation and evolution of crushing. Int. J. Solids Struct. 2005, 42, 1381–1399. [Google Scholar] [CrossRef]
- Gaitanaros, S.; Kyriakides, S.; Kraynik, A.M. On the crushing response of random open-cell foams. Int. J. Solids Struct. 2012, 49, 2733–2743. [Google Scholar] [CrossRef] [Green Version]
- Iizuka, M.; Goto, R.; Siegkas, P.; Simpson, B.; Mansfield, N. Large deformation finite element analyses for 3D X-ray CT scanned microscopic structures of polyurethane foams. Materials 2021, 14, 949. [Google Scholar] [CrossRef] [PubMed]
- Spathis, G.; Kontou, E. Modeling the compressive stress–strain response of polymeric foams. J. Appl. Polym. Sci. 2011, 121, 3262–3268. [Google Scholar] [CrossRef]
- Lagzdins, A.; Zilaucs, A.; Beverte, I.; Andersons, J. A refined strut model for calculating the elastic constants of highly porous cellular plastics by the method of orientational averaging. Mech. Compos. Mater. 2012, 47, 589–596. [Google Scholar] [CrossRef]
- Lagzdins, A.; Zilaucs, A.; Beverte, I.; Andersons, J. Estimation of the elastic constants of highly porous cellular plastics reinforced with fibres embedded in foam struts. J. Compos. Mater. 2016, 50, 1169–1180. [Google Scholar] [CrossRef]
- Lagzdins, A.; Maksimov, R.D.; Plume, E. Elasticity of composites with irregularly oriented shape-anisotropic filler particles. Mech. Compos. Mater. 2006, 42, 197–208. [Google Scholar] [CrossRef]
- Maksimov, R.D.; Gaidukovs, S.; Kalnins, M.; Zicans, J.; Plume, E. A nanocomposite based on a styrene-acrylate co-polymer and native montmorillonite clay. 2. Modeling the elastic properties. Mech. Compos. Mater. 2006, 42, 163–172. [Google Scholar] [CrossRef]
- Cabulis, U.; Sevastyanova, I.; Andersons, J.; Beverte, I. Rapeseed oil-based rigid polyisocyanurate foams modified with nanoparticles of various type. Polimery 2014, 59, 207–212. [Google Scholar] [CrossRef]
- Andersons, J.; Kirpluks, M.; Stiebra, L.; Cabulis, U. Anisotropy of the stiffness and strength of rigid low-density closed-cell polyisocyanurate foams. Mater. Des. 2016, 92, 836–845. [Google Scholar] [CrossRef]
- Maksimov, R.D.; Plume, E. Elastic properties of a polyurethane/montmorillonite nanocomposite. Mech. Compos. Mater. 2012, 48, 487–498. [Google Scholar] [CrossRef]
- Osipov, V.I. Density of clay minerals. Soil Mech. Found. Eng. 2012, 48, 231–240. [Google Scholar] [CrossRef]
- Andersons, J.; Cābulis, U.; Stiebra, L.; Kirpļuks, M.; Spārniņš, E. Modeling the mode I fracture toughness of anisotropic low-density rigid PUR and PIR foams. Int. J. Fract. 2017, 205, 111–118. [Google Scholar] [CrossRef]
- Cābulis, U.; Kirpļuks, M.; Andersons, J. The effect of montmorillonite type nanoparticles on stiffness and flammability of rapeseed oil based polyisocyanurate foams. Key Eng. Mater. 2013, 559, 19–24. [Google Scholar] [CrossRef]
- Klempner, D.; Frisch, K.C. (Eds.) Handbook of Polymeric Foams and Foam Technology; Hanser Publishers: Munich, Germany, 1991; p. 413. [Google Scholar]
- Berlin, A.A.; Shutov, F.A. Chemistry and Technology of Gas-Filled High-Polymers; Nauka Press: Moscow, Russia, 1980; p. 503. [Google Scholar]
- Zicāns, J.; Maksimov, R.D.; Plūme, E.; Merijs Meri, R.; Jansons, J. The effect of partial exfoliation of multilayer silicate filler particles on the elastic properties of a polymer composite. Compos. Struct. 2018, 183, 483–488. [Google Scholar] [CrossRef]


Publisher’s Note: MDPI stays neutral with regard to jurisdictional claims in published maps and institutional affiliations. |
© 2022 by the authors. Licensee MDPI, Basel, Switzerland. This article is an open access article distributed under the terms and conditions of the Creative Commons Attribution (CC BY) license (https://creativecommons.org/licenses/by/4.0/).
Share and Cite
Lagzdiņš, A.; Zilaucs, A.; Beverte, I.; Andersons, J. Modeling the Nonlinear Deformation of Highly Porous Cellular Plastics Filled with Clay Nanoplatelets. Materials 2022, 15, 1033. https://doi.org/10.3390/ma15031033
Lagzdiņš A, Zilaucs A, Beverte I, Andersons J. Modeling the Nonlinear Deformation of Highly Porous Cellular Plastics Filled with Clay Nanoplatelets. Materials. 2022; 15(3):1033. https://doi.org/10.3390/ma15031033
Chicago/Turabian StyleLagzdiņš, Aivars, Alberts Zilaucs, Ilze Beverte, and Jānis Andersons. 2022. "Modeling the Nonlinear Deformation of Highly Porous Cellular Plastics Filled with Clay Nanoplatelets" Materials 15, no. 3: 1033. https://doi.org/10.3390/ma15031033