
Determination of Grain Growth Kinetics of S960MC Steel


Abstract
:
1. Introduction
2. Materials and Methods
2.1. Experimental Material
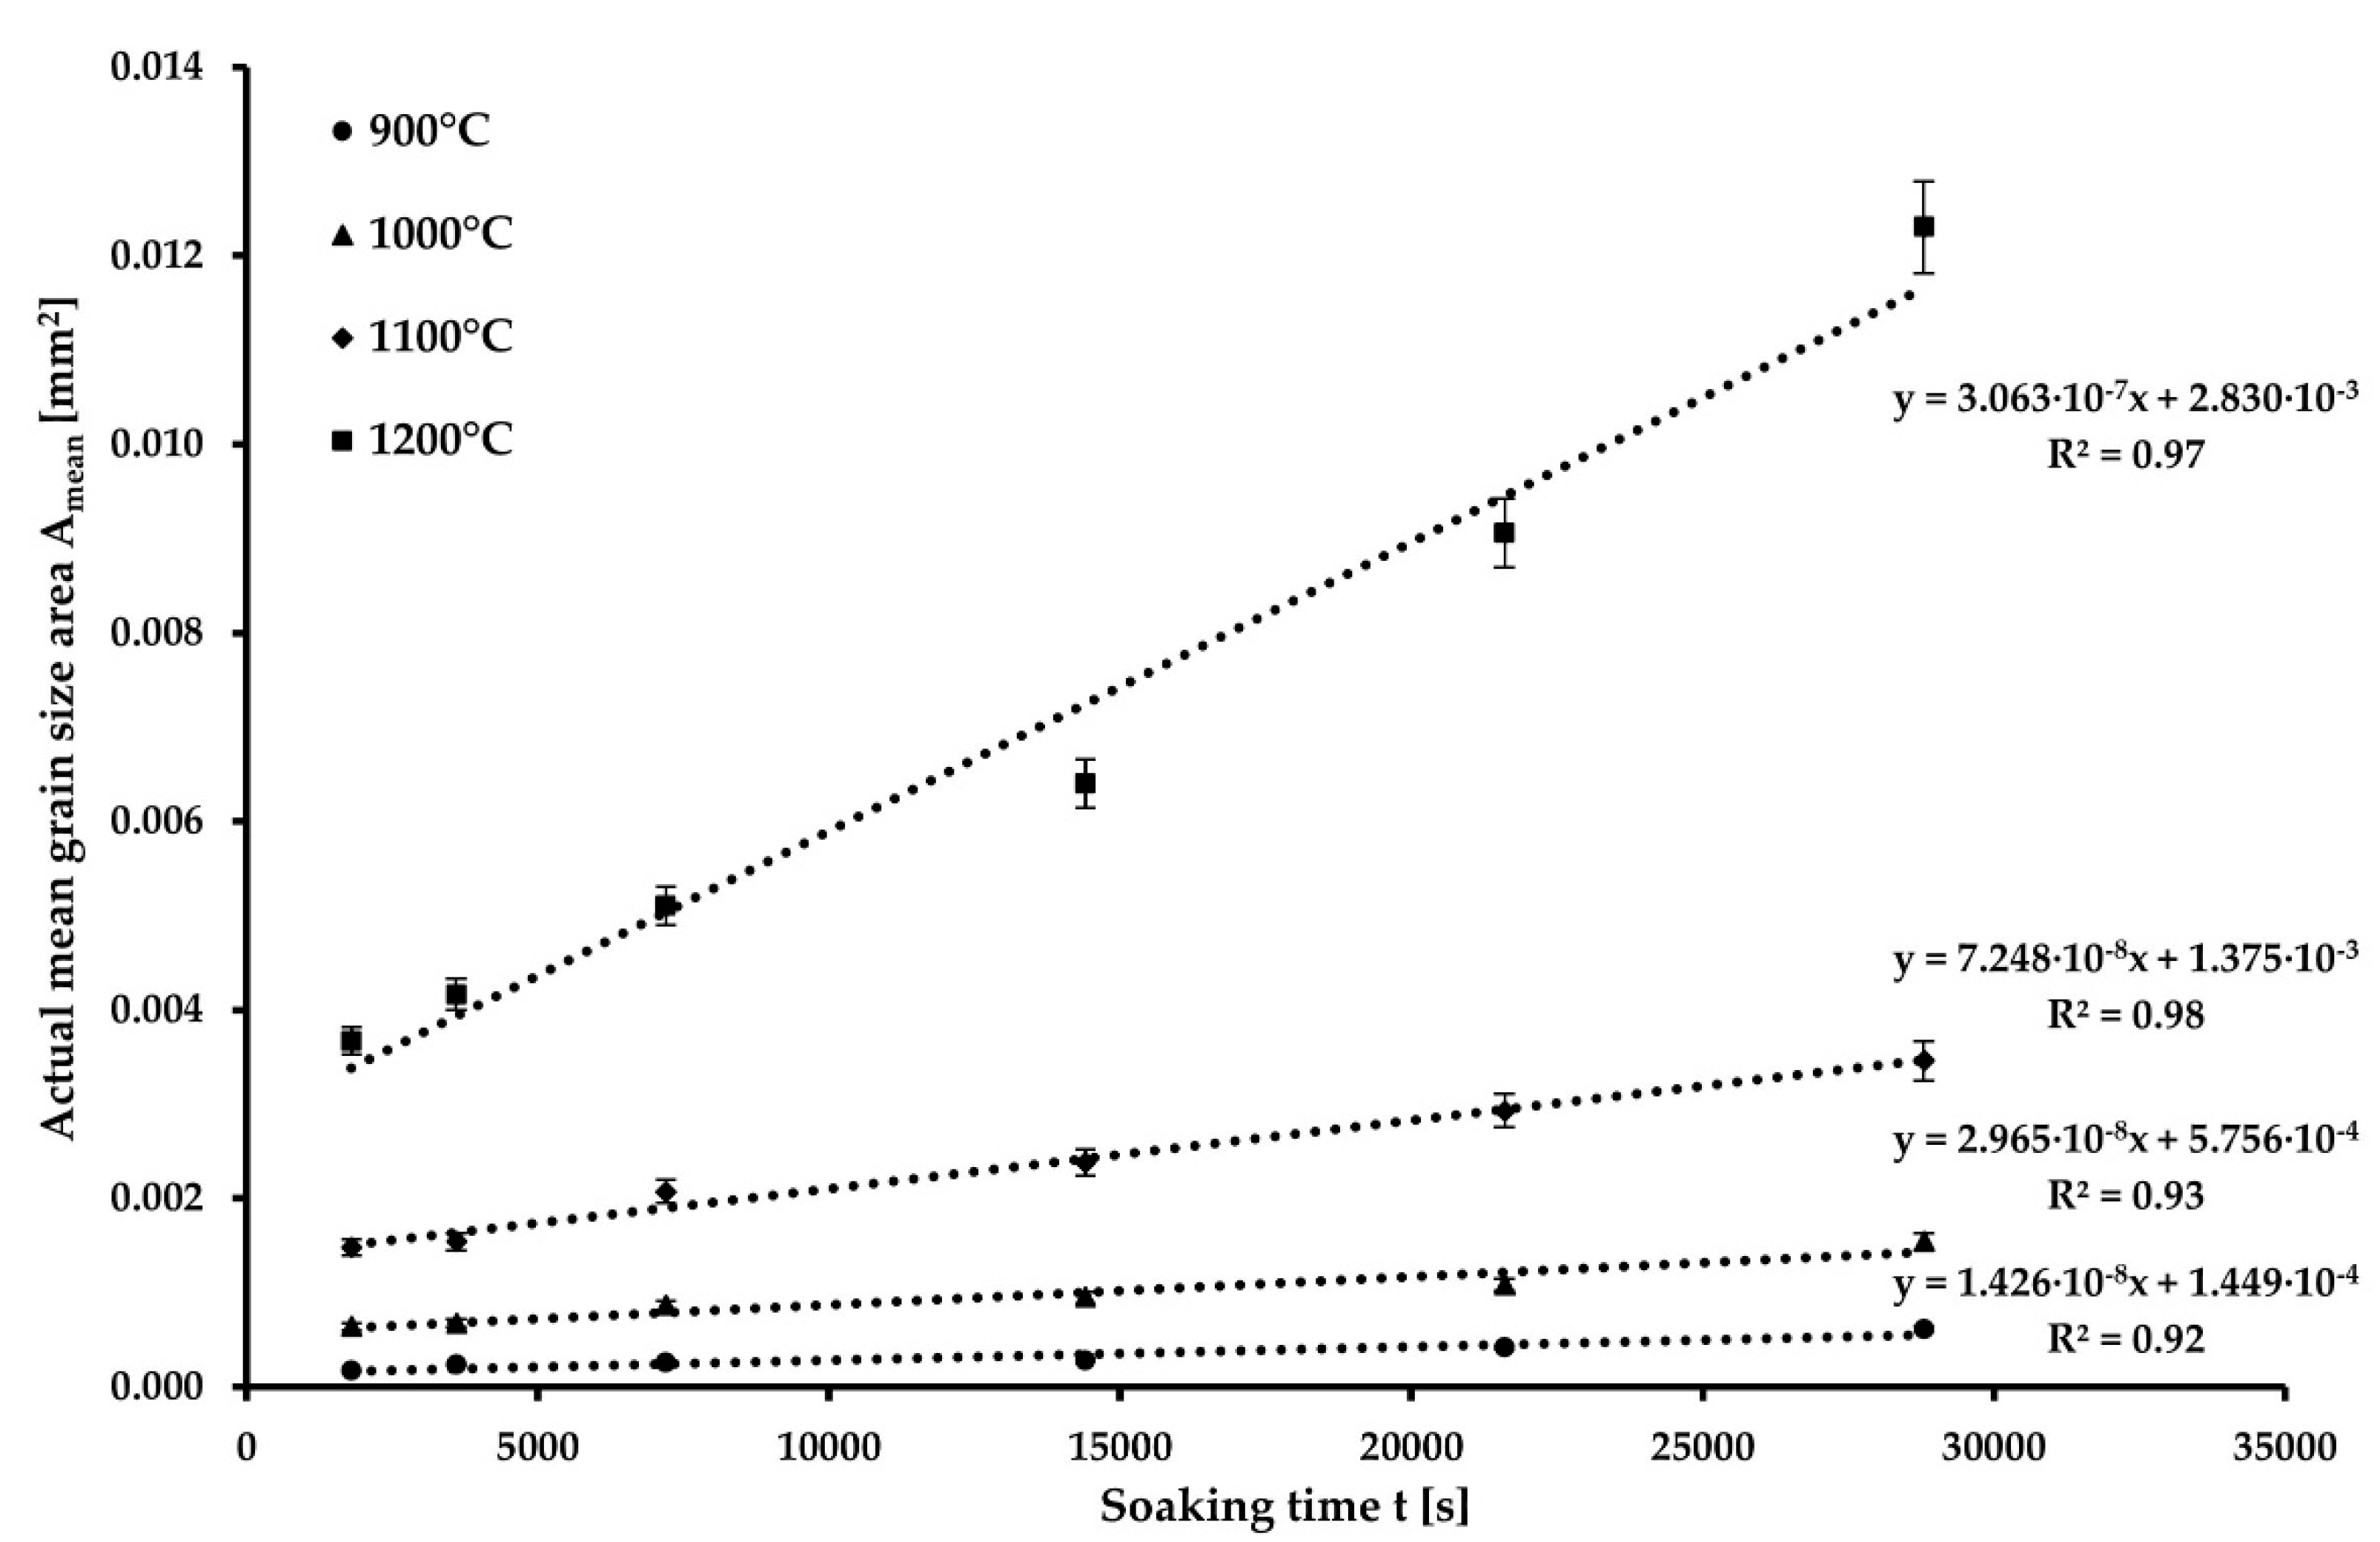
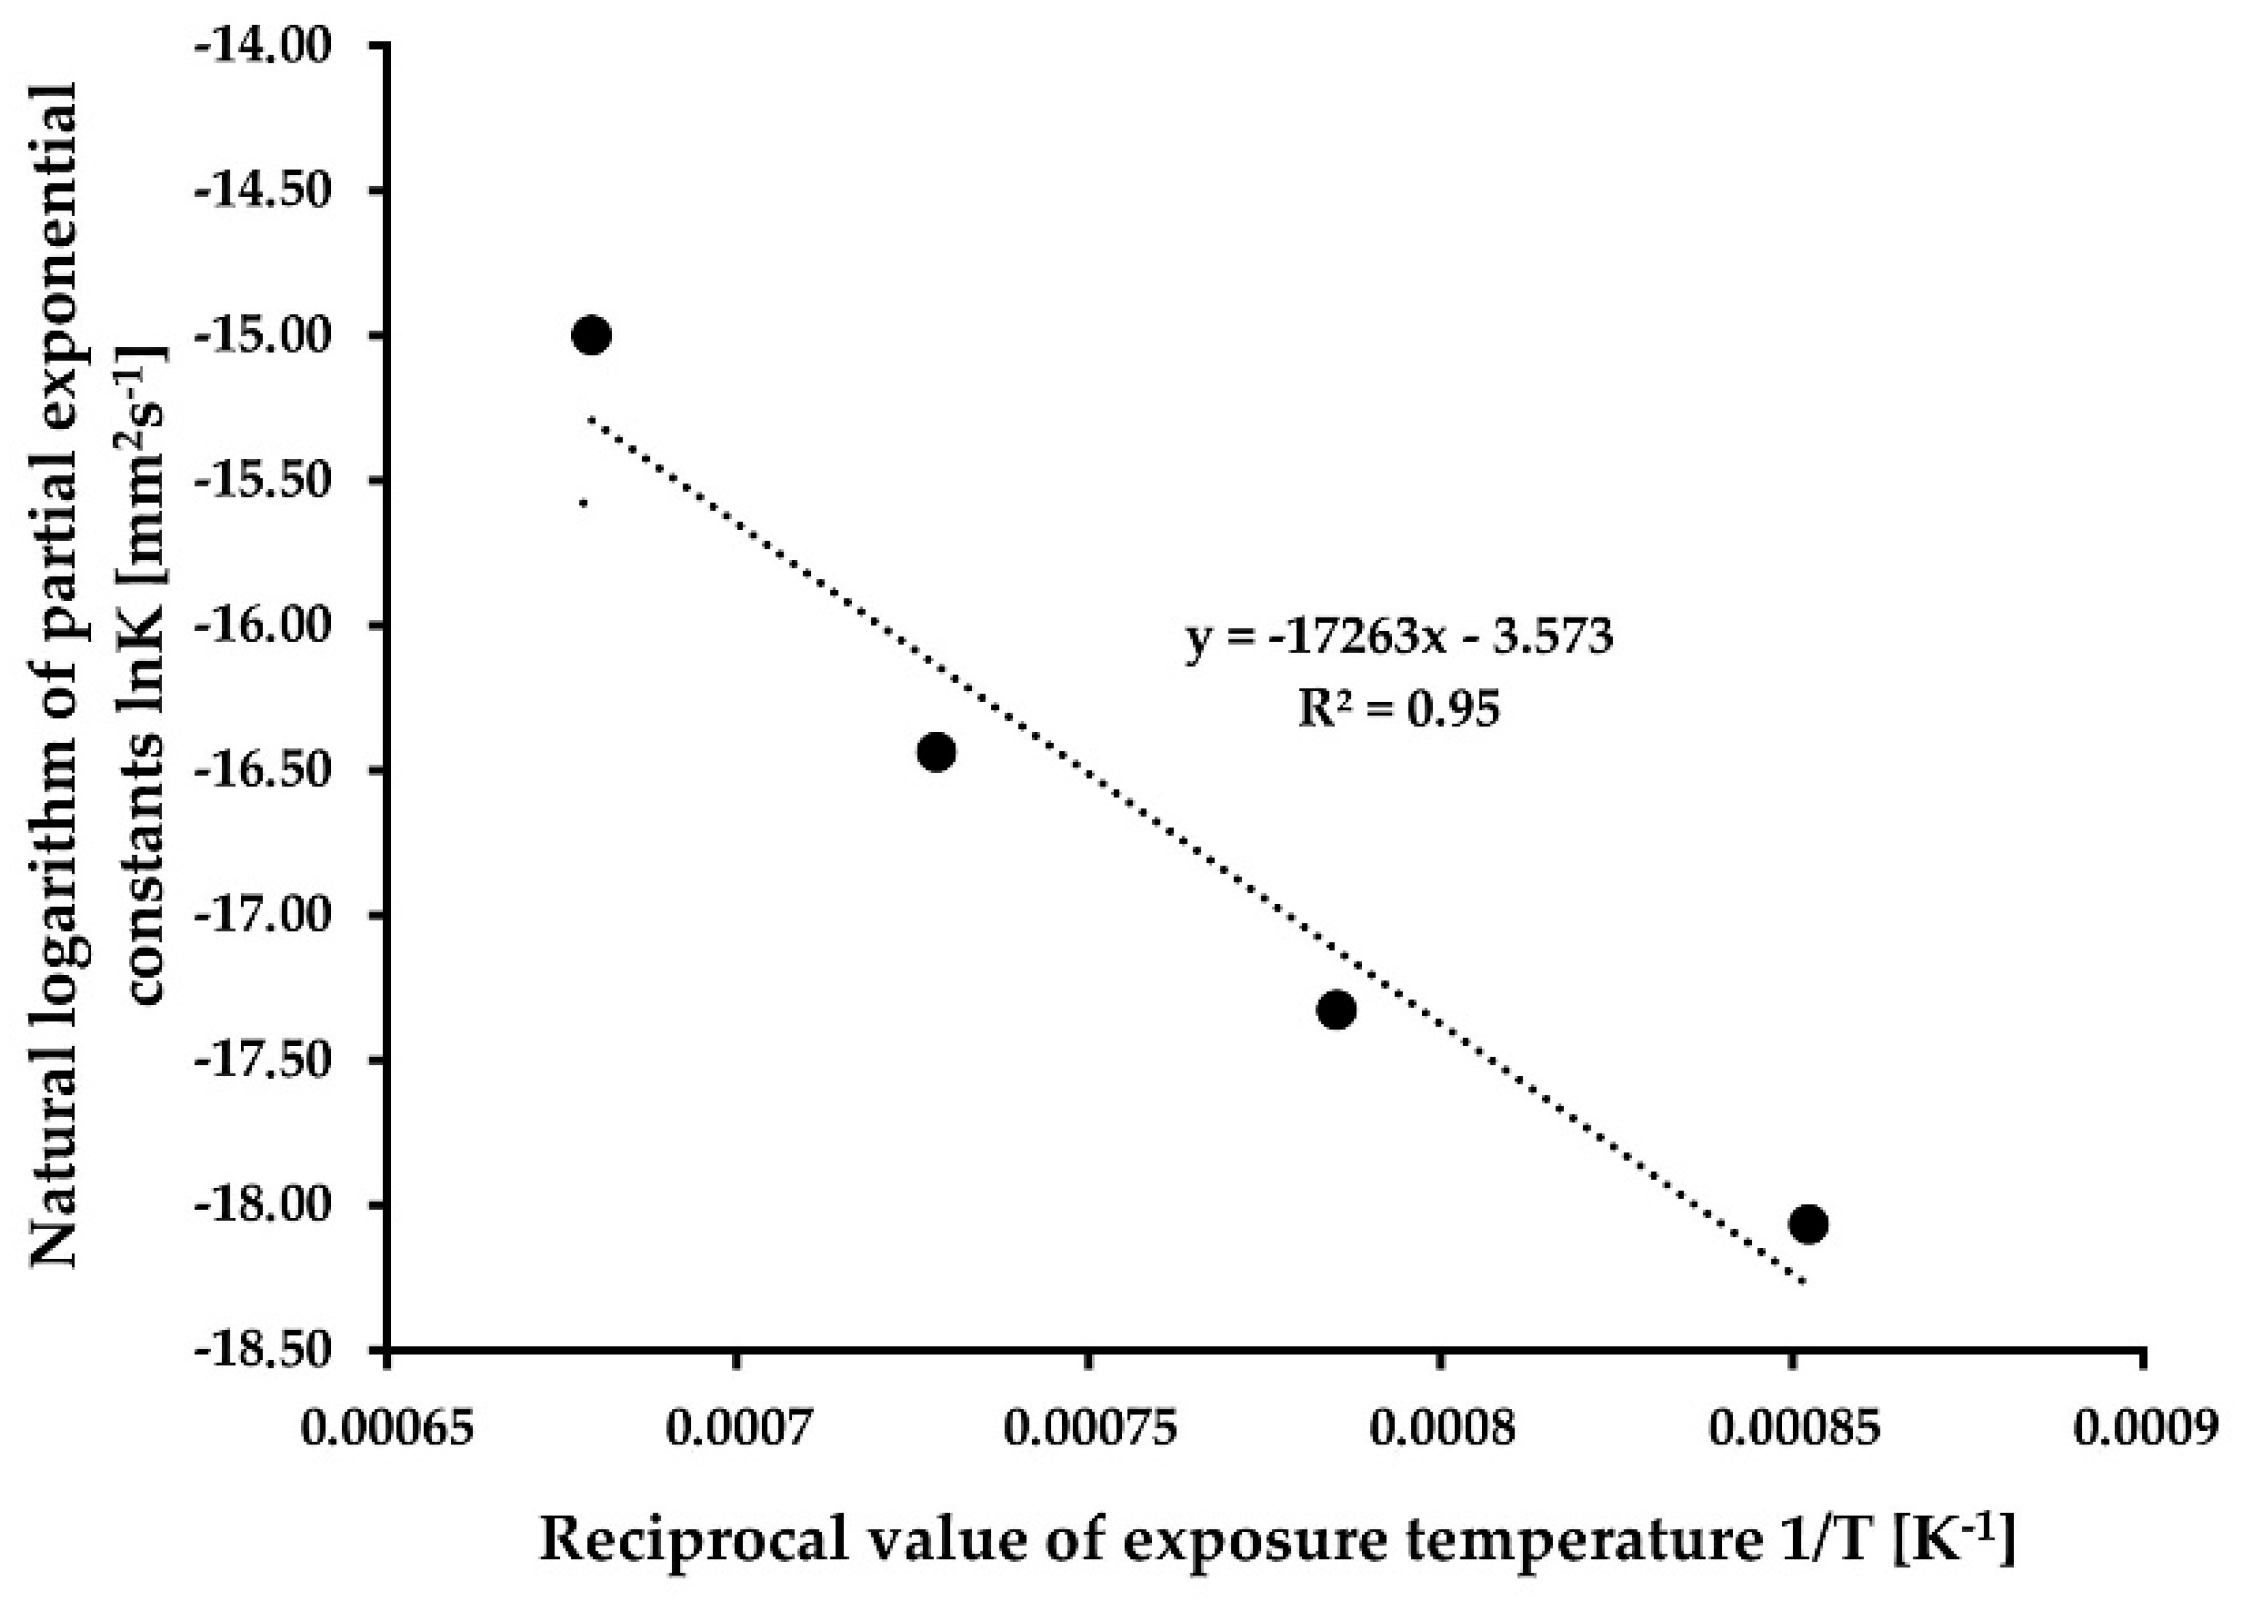
2.2. Determination of Activation Energy Q and Kinetic Constant of Grain Growth K
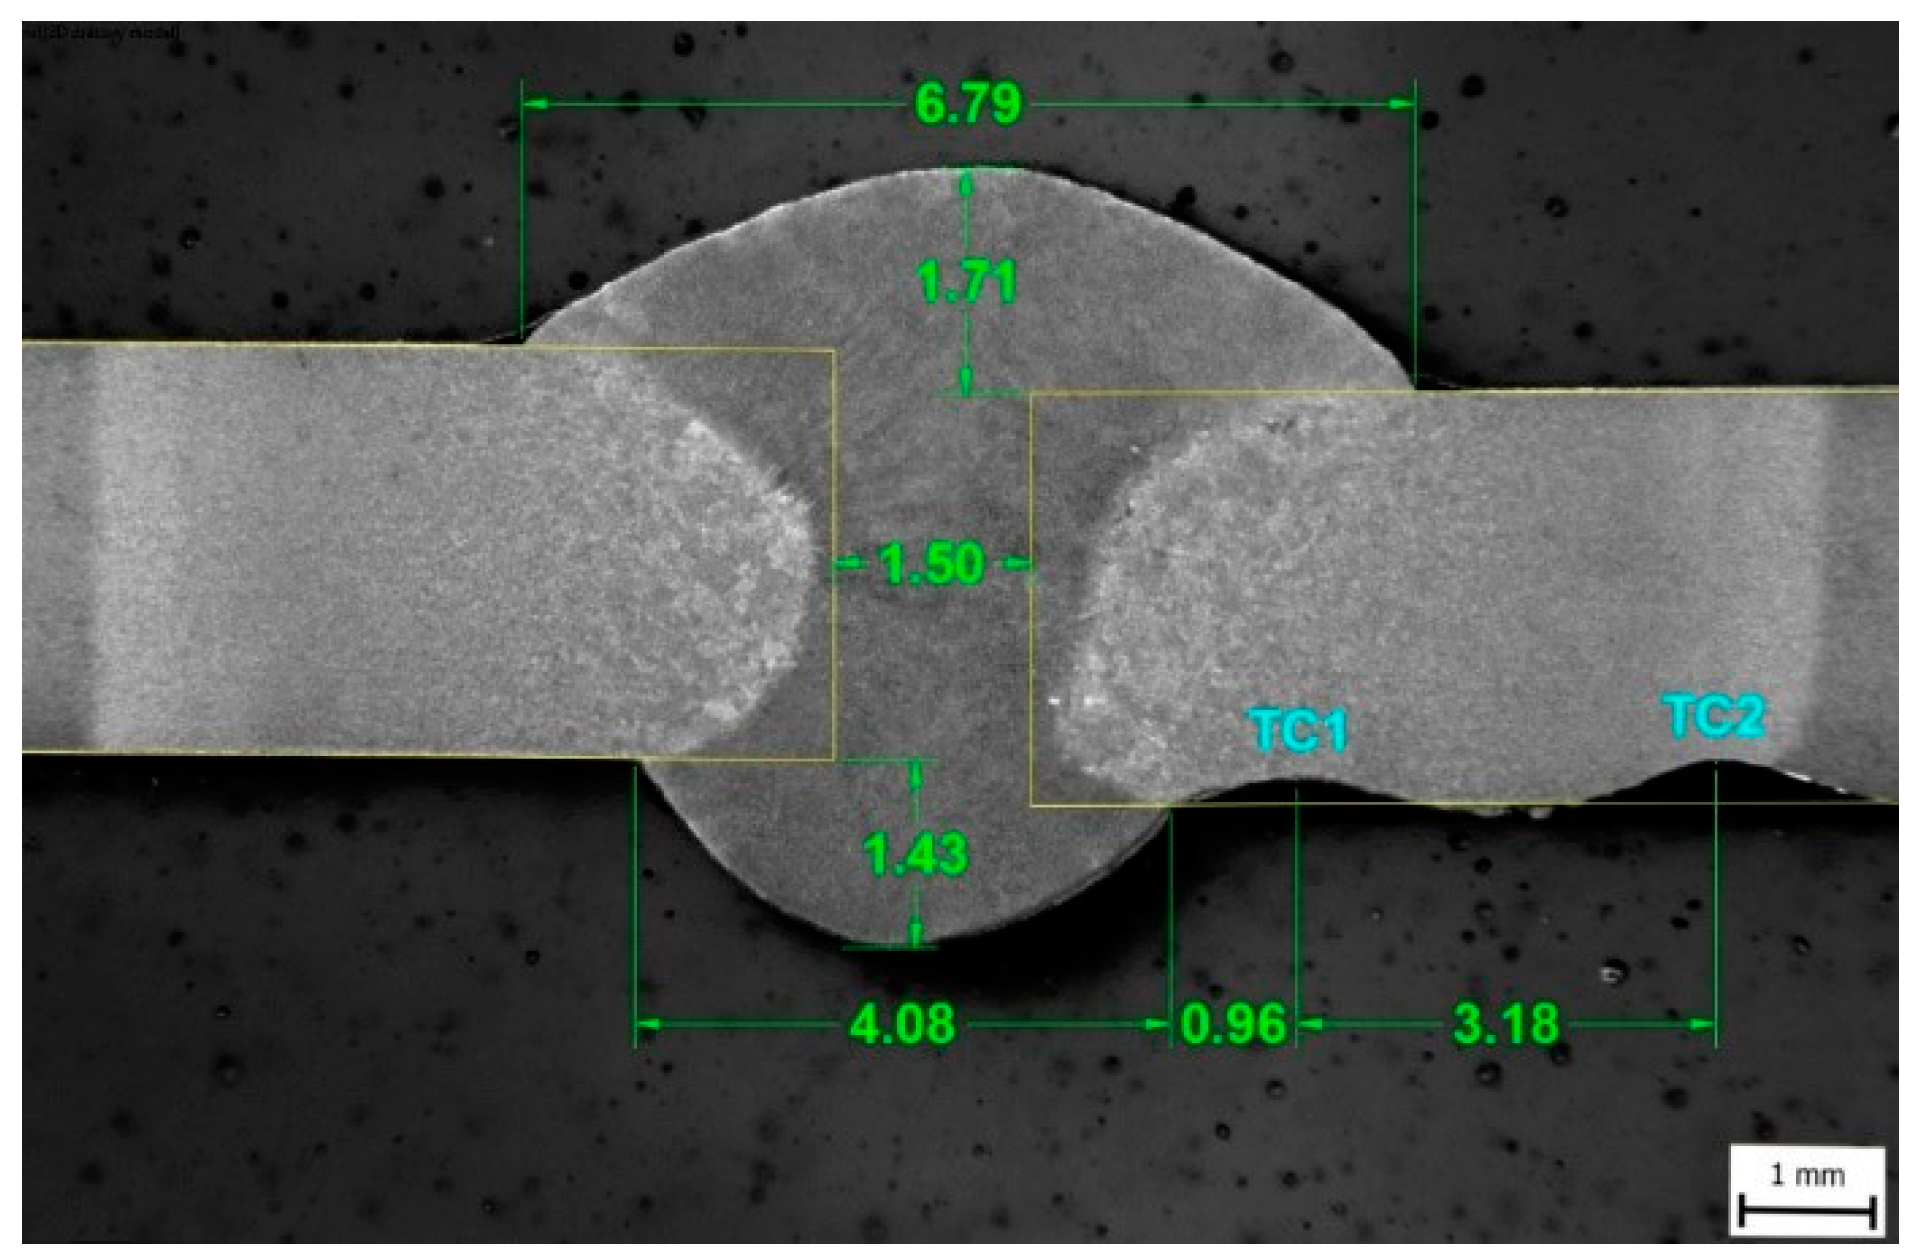
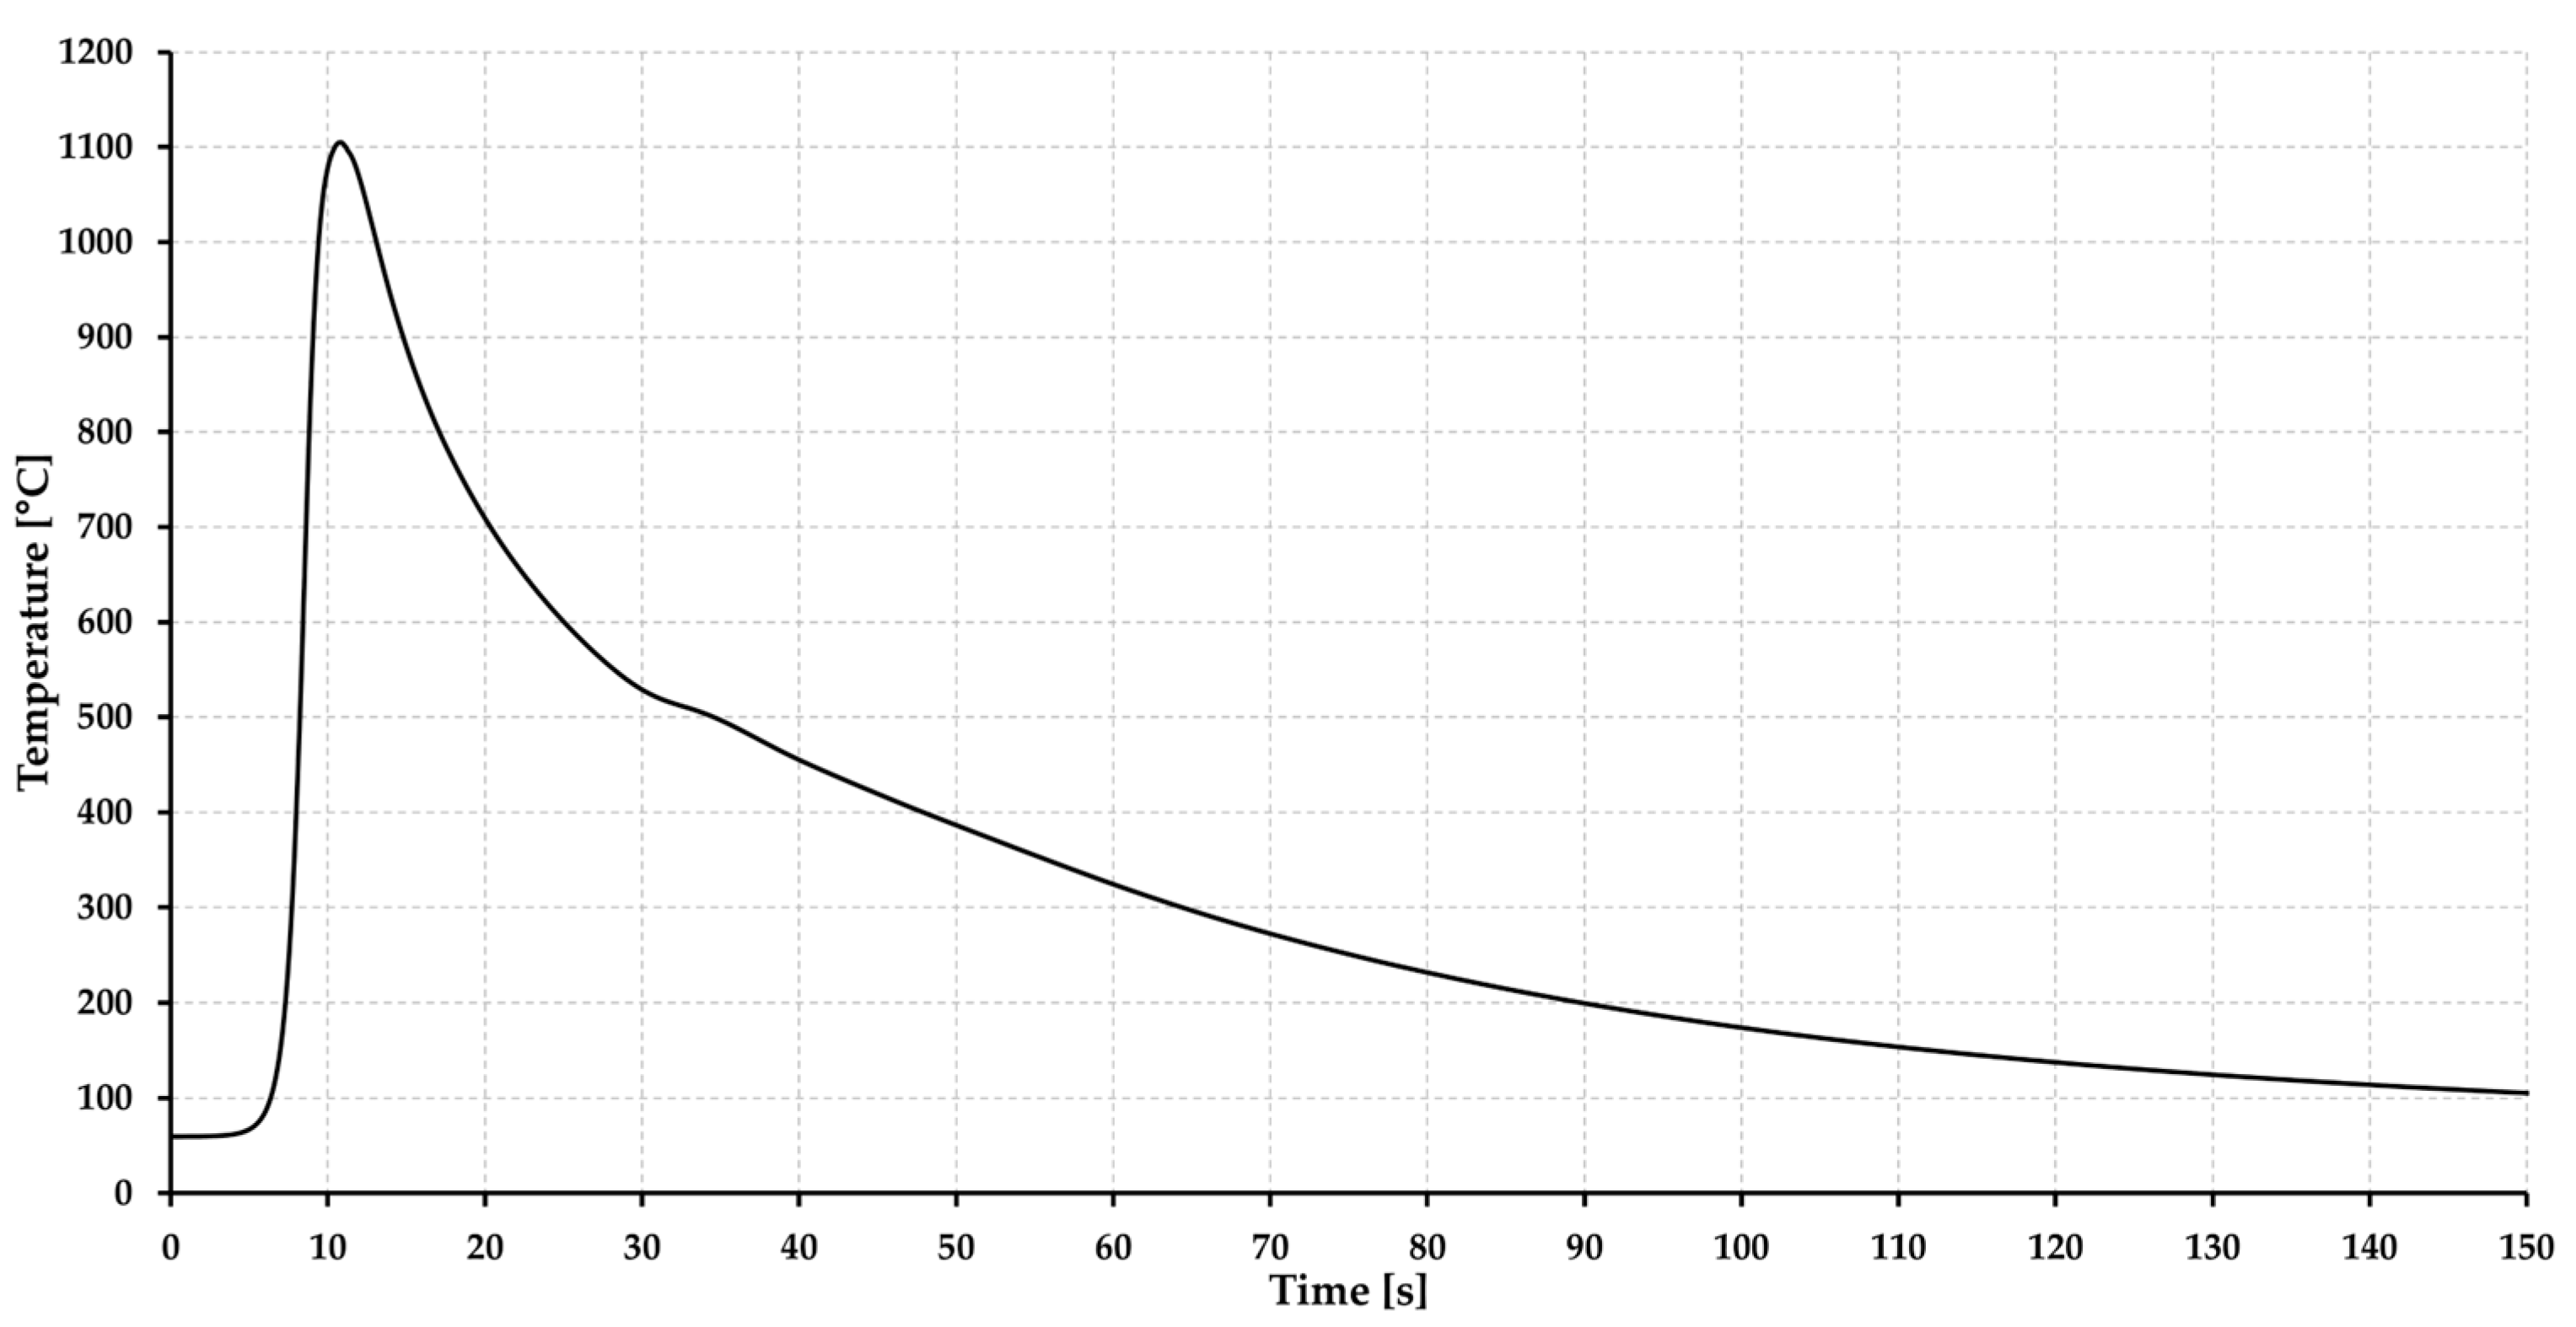
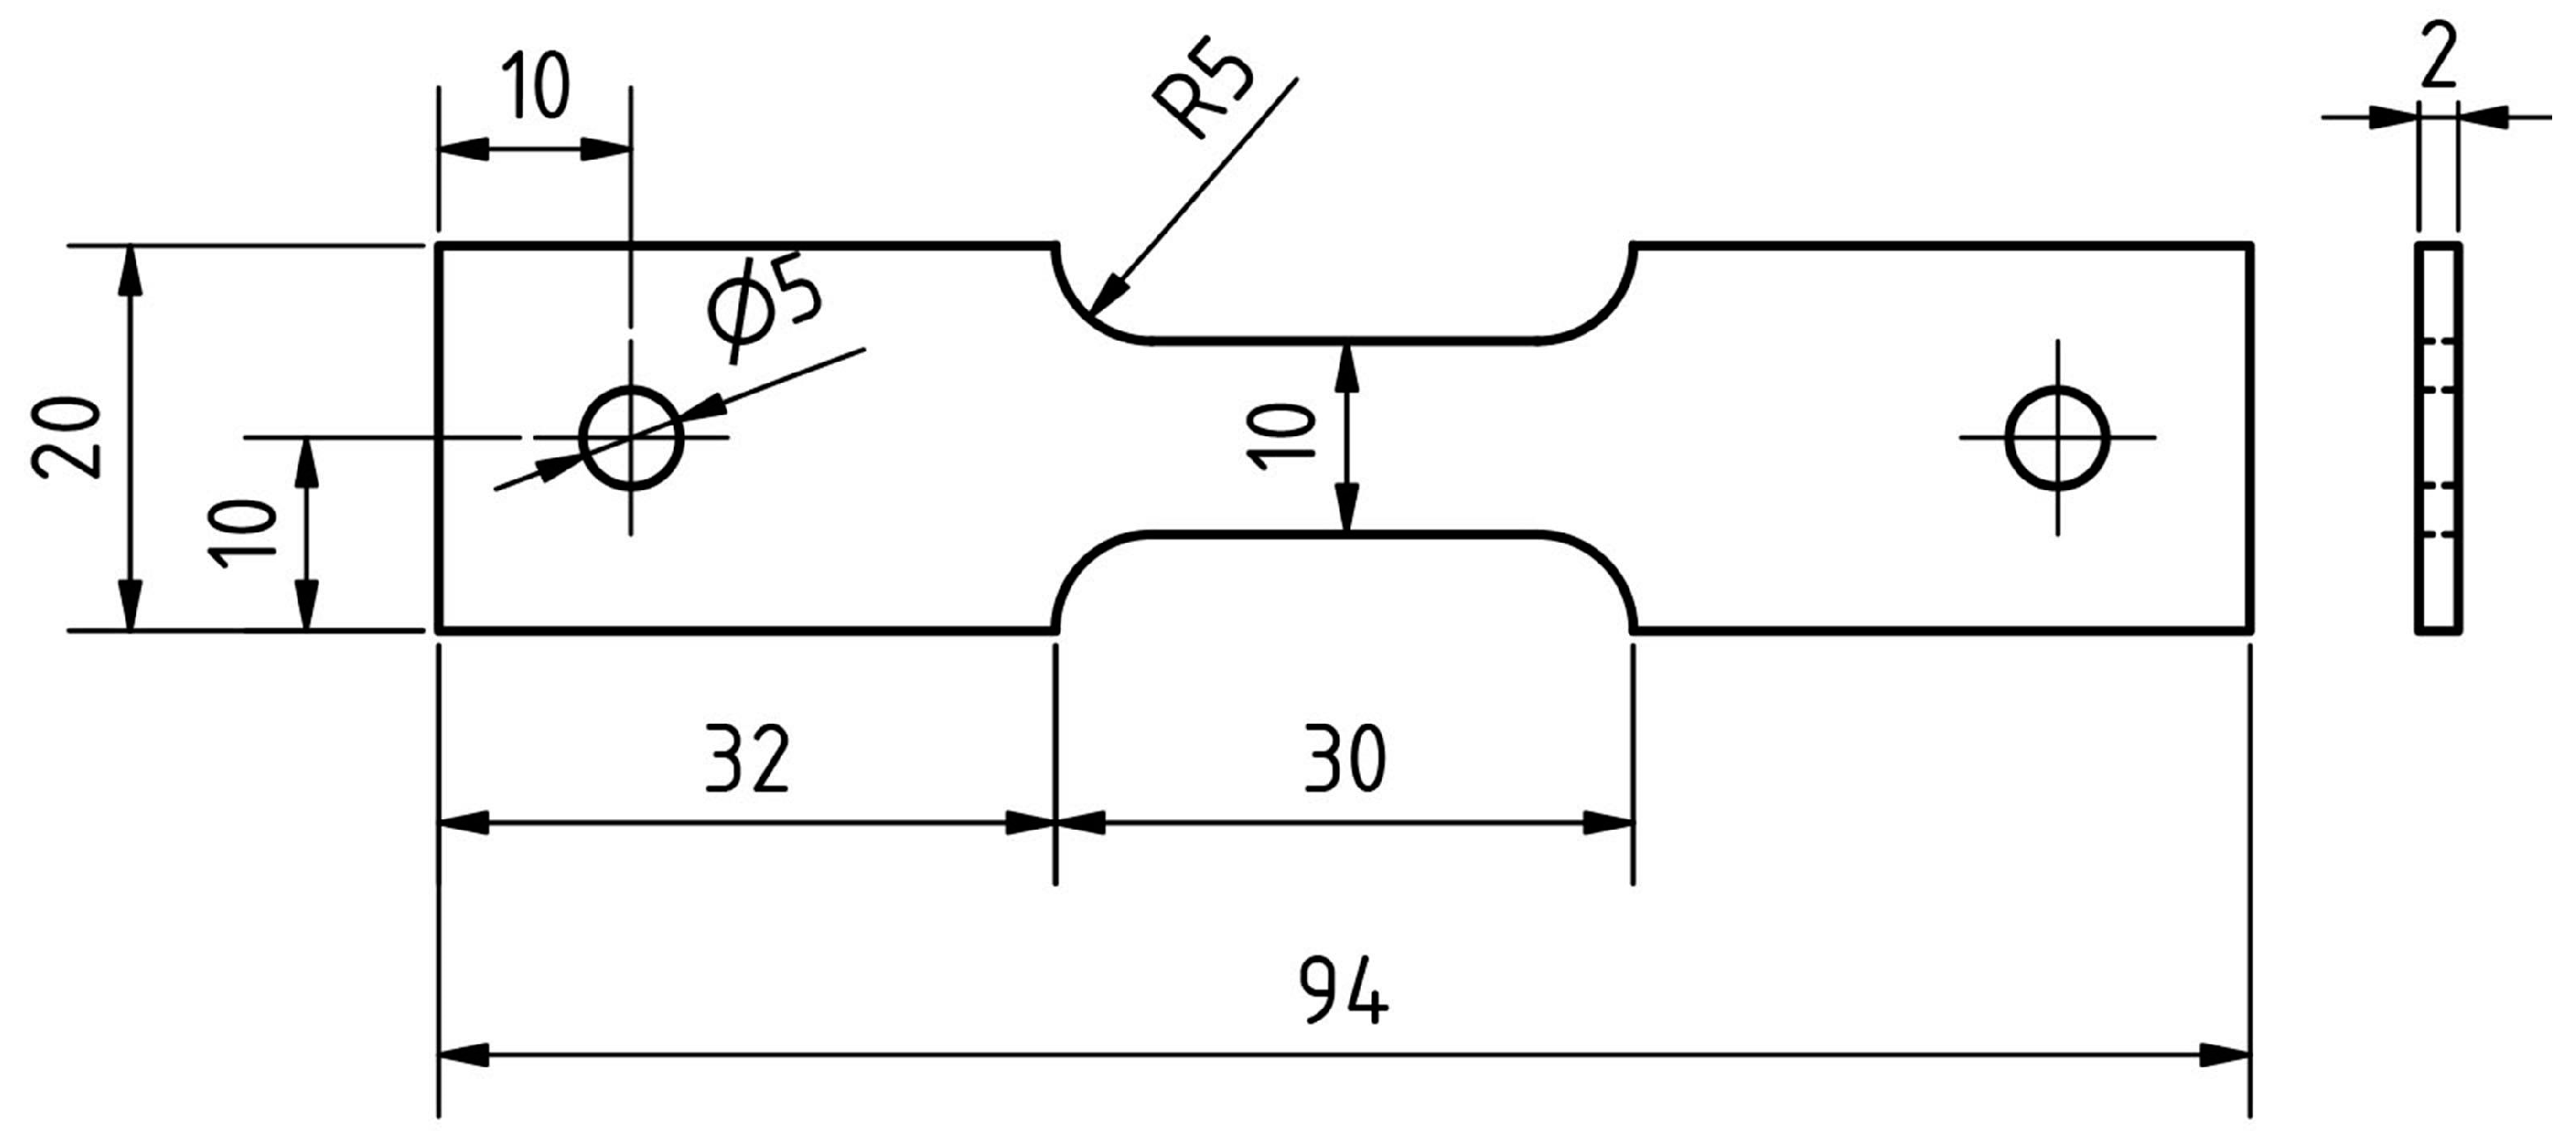
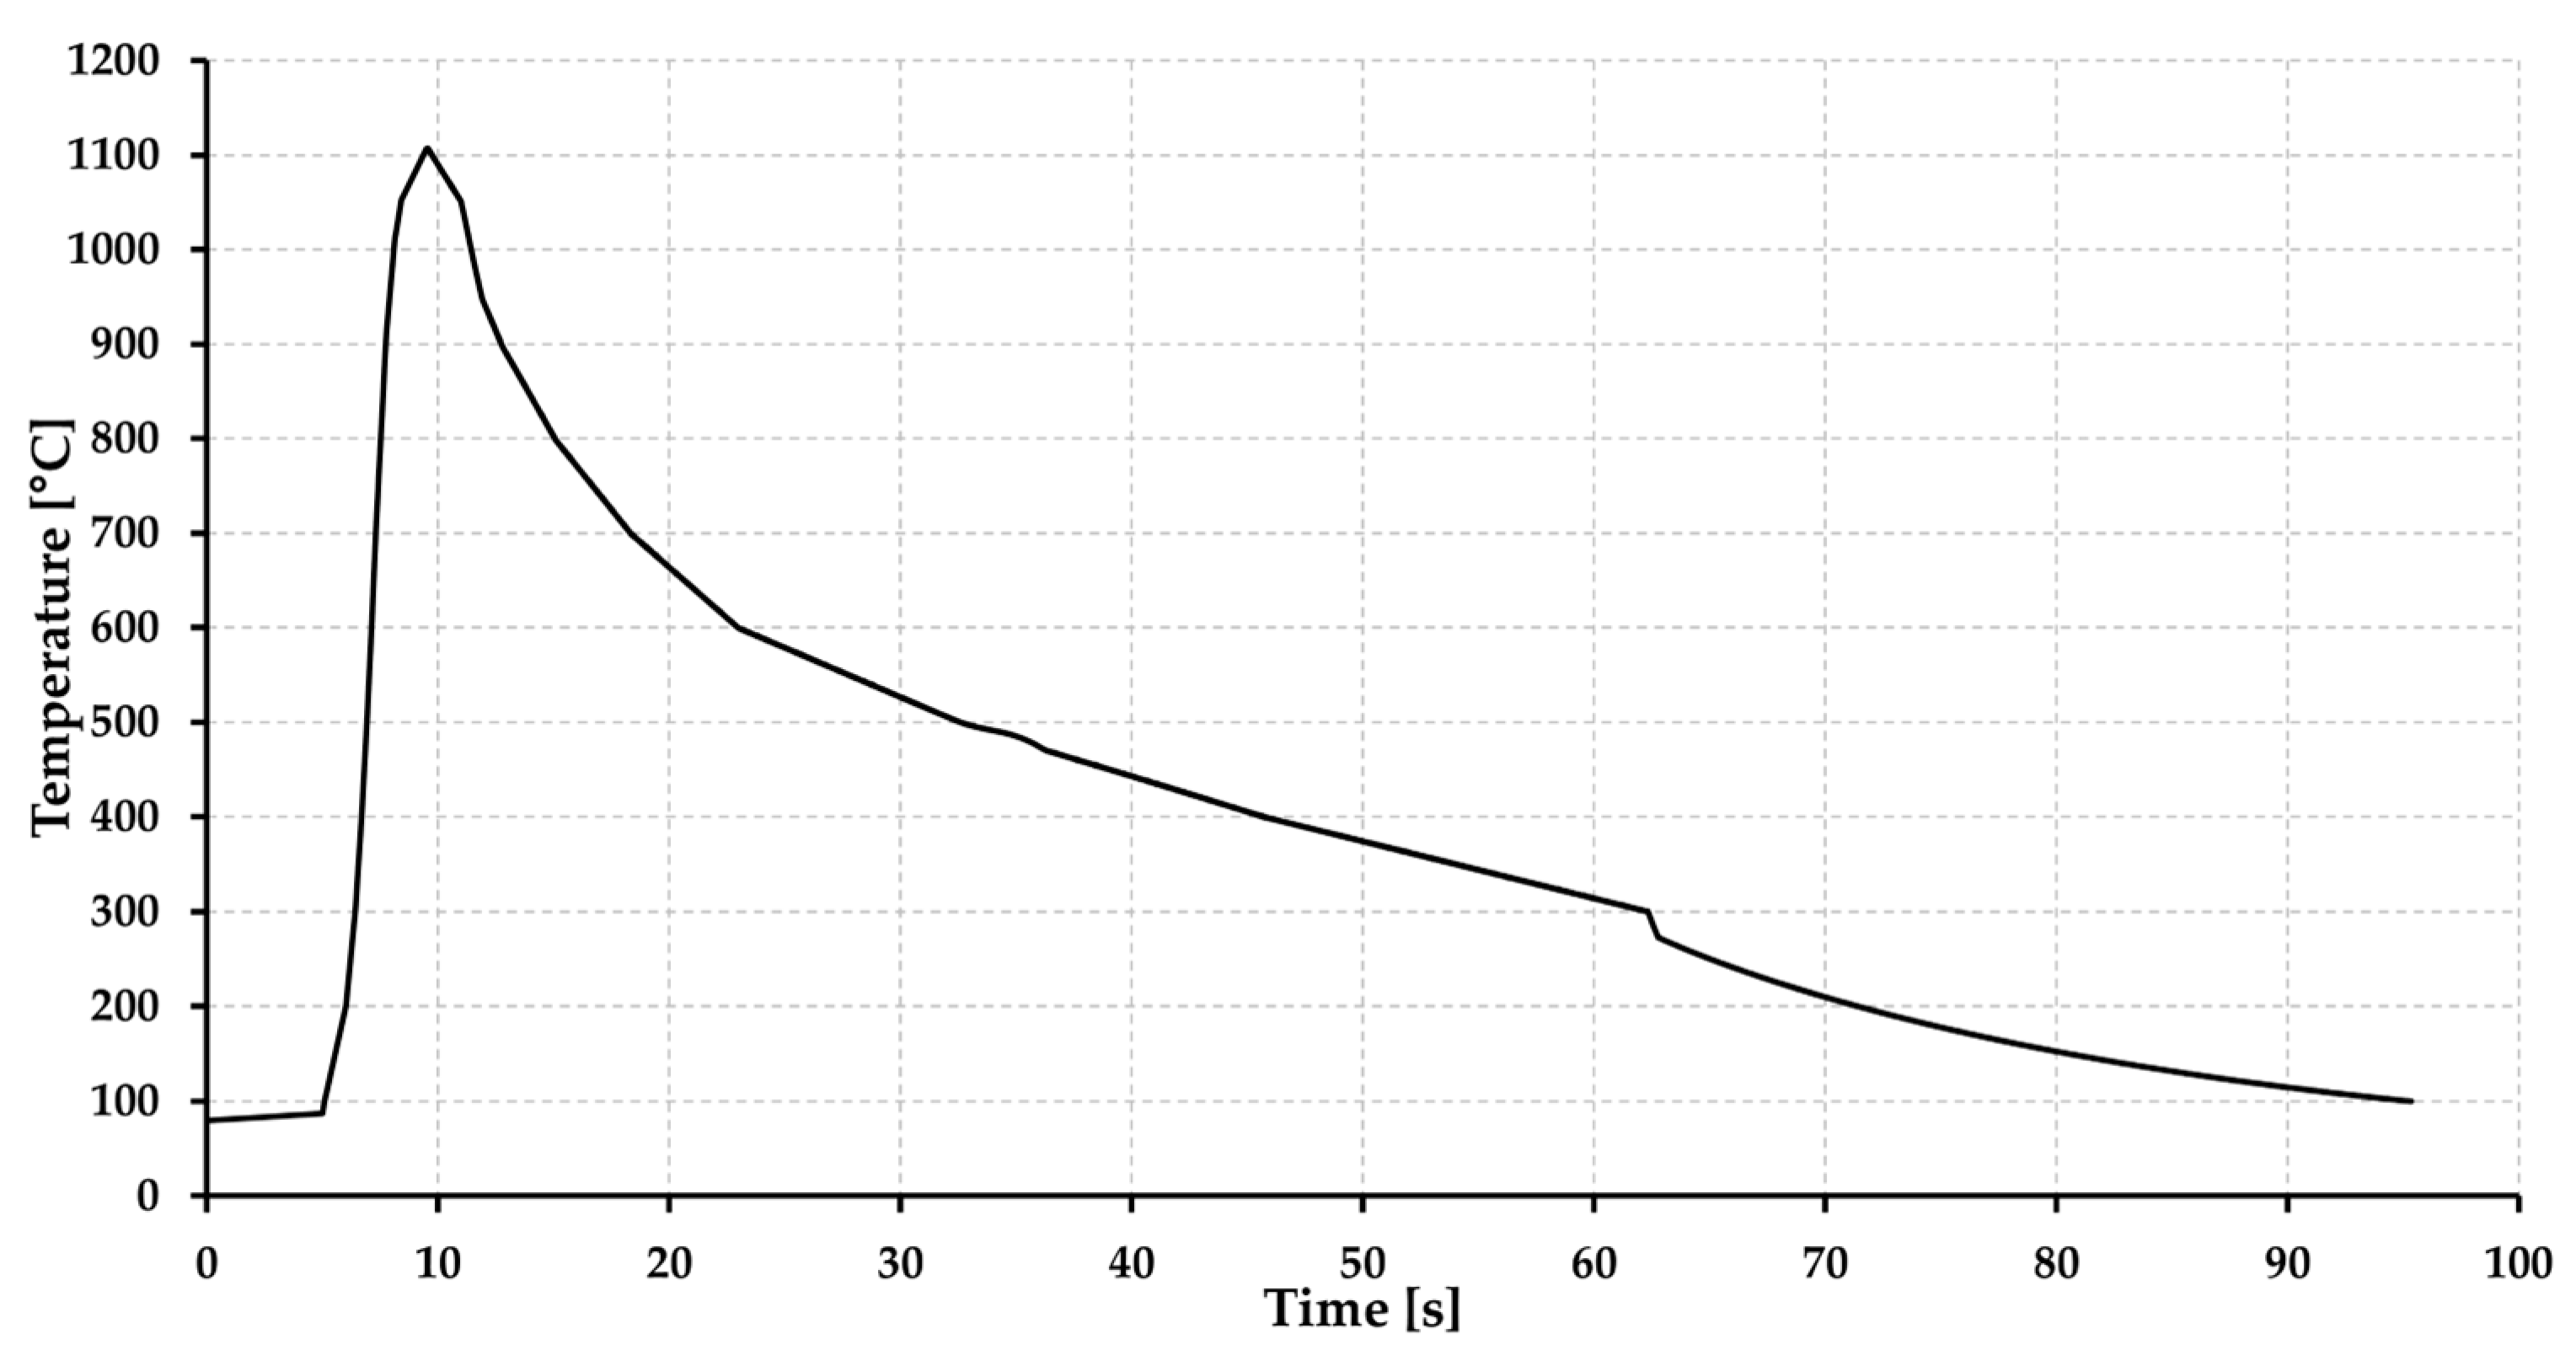
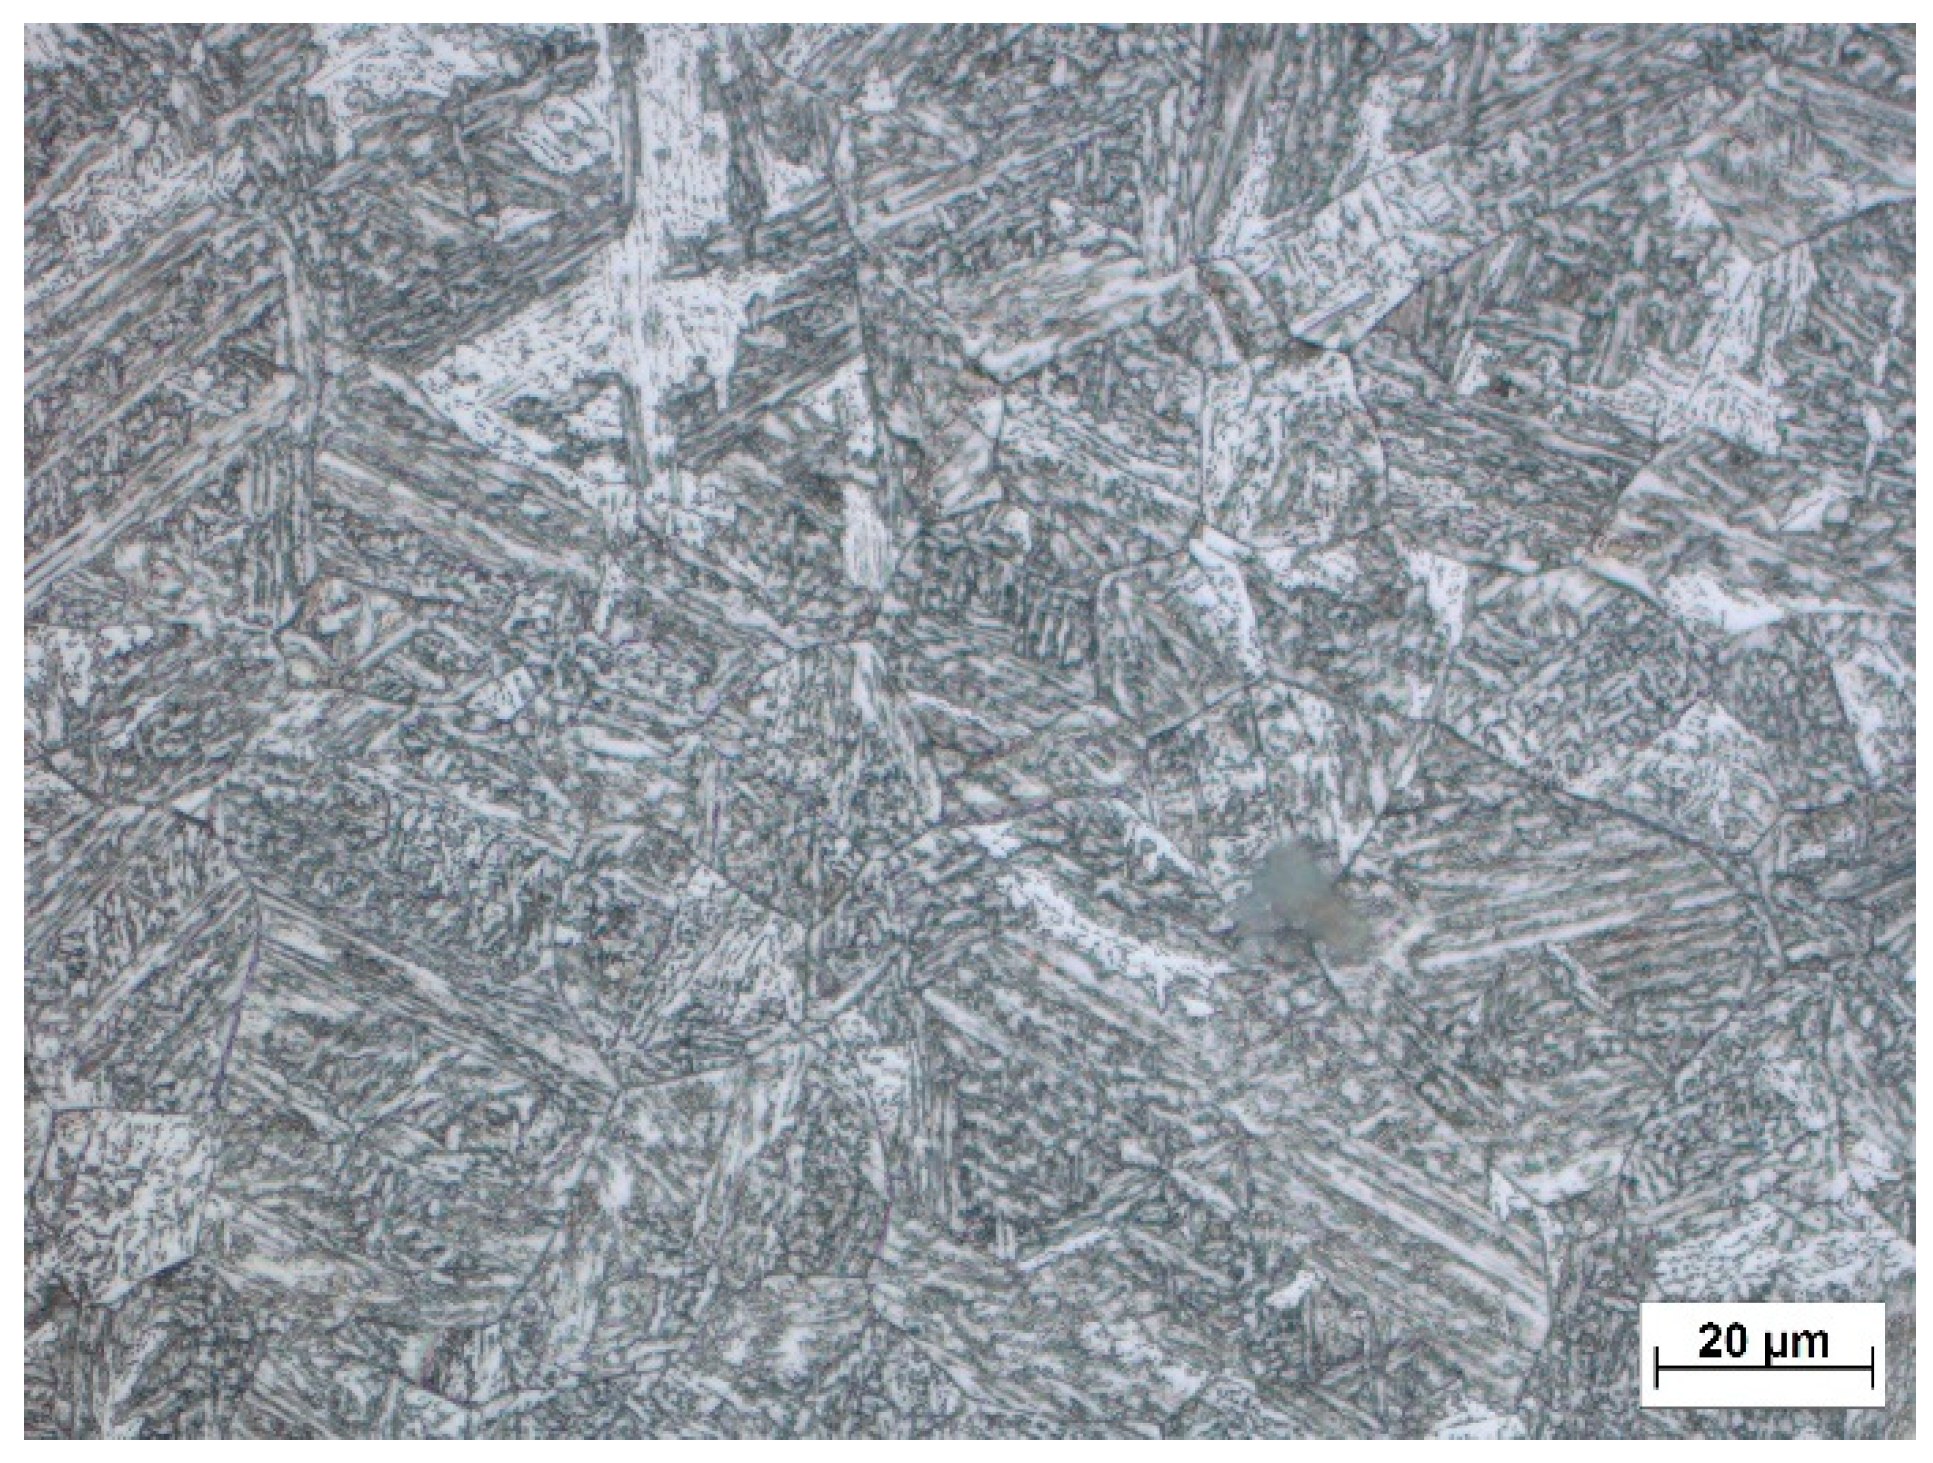
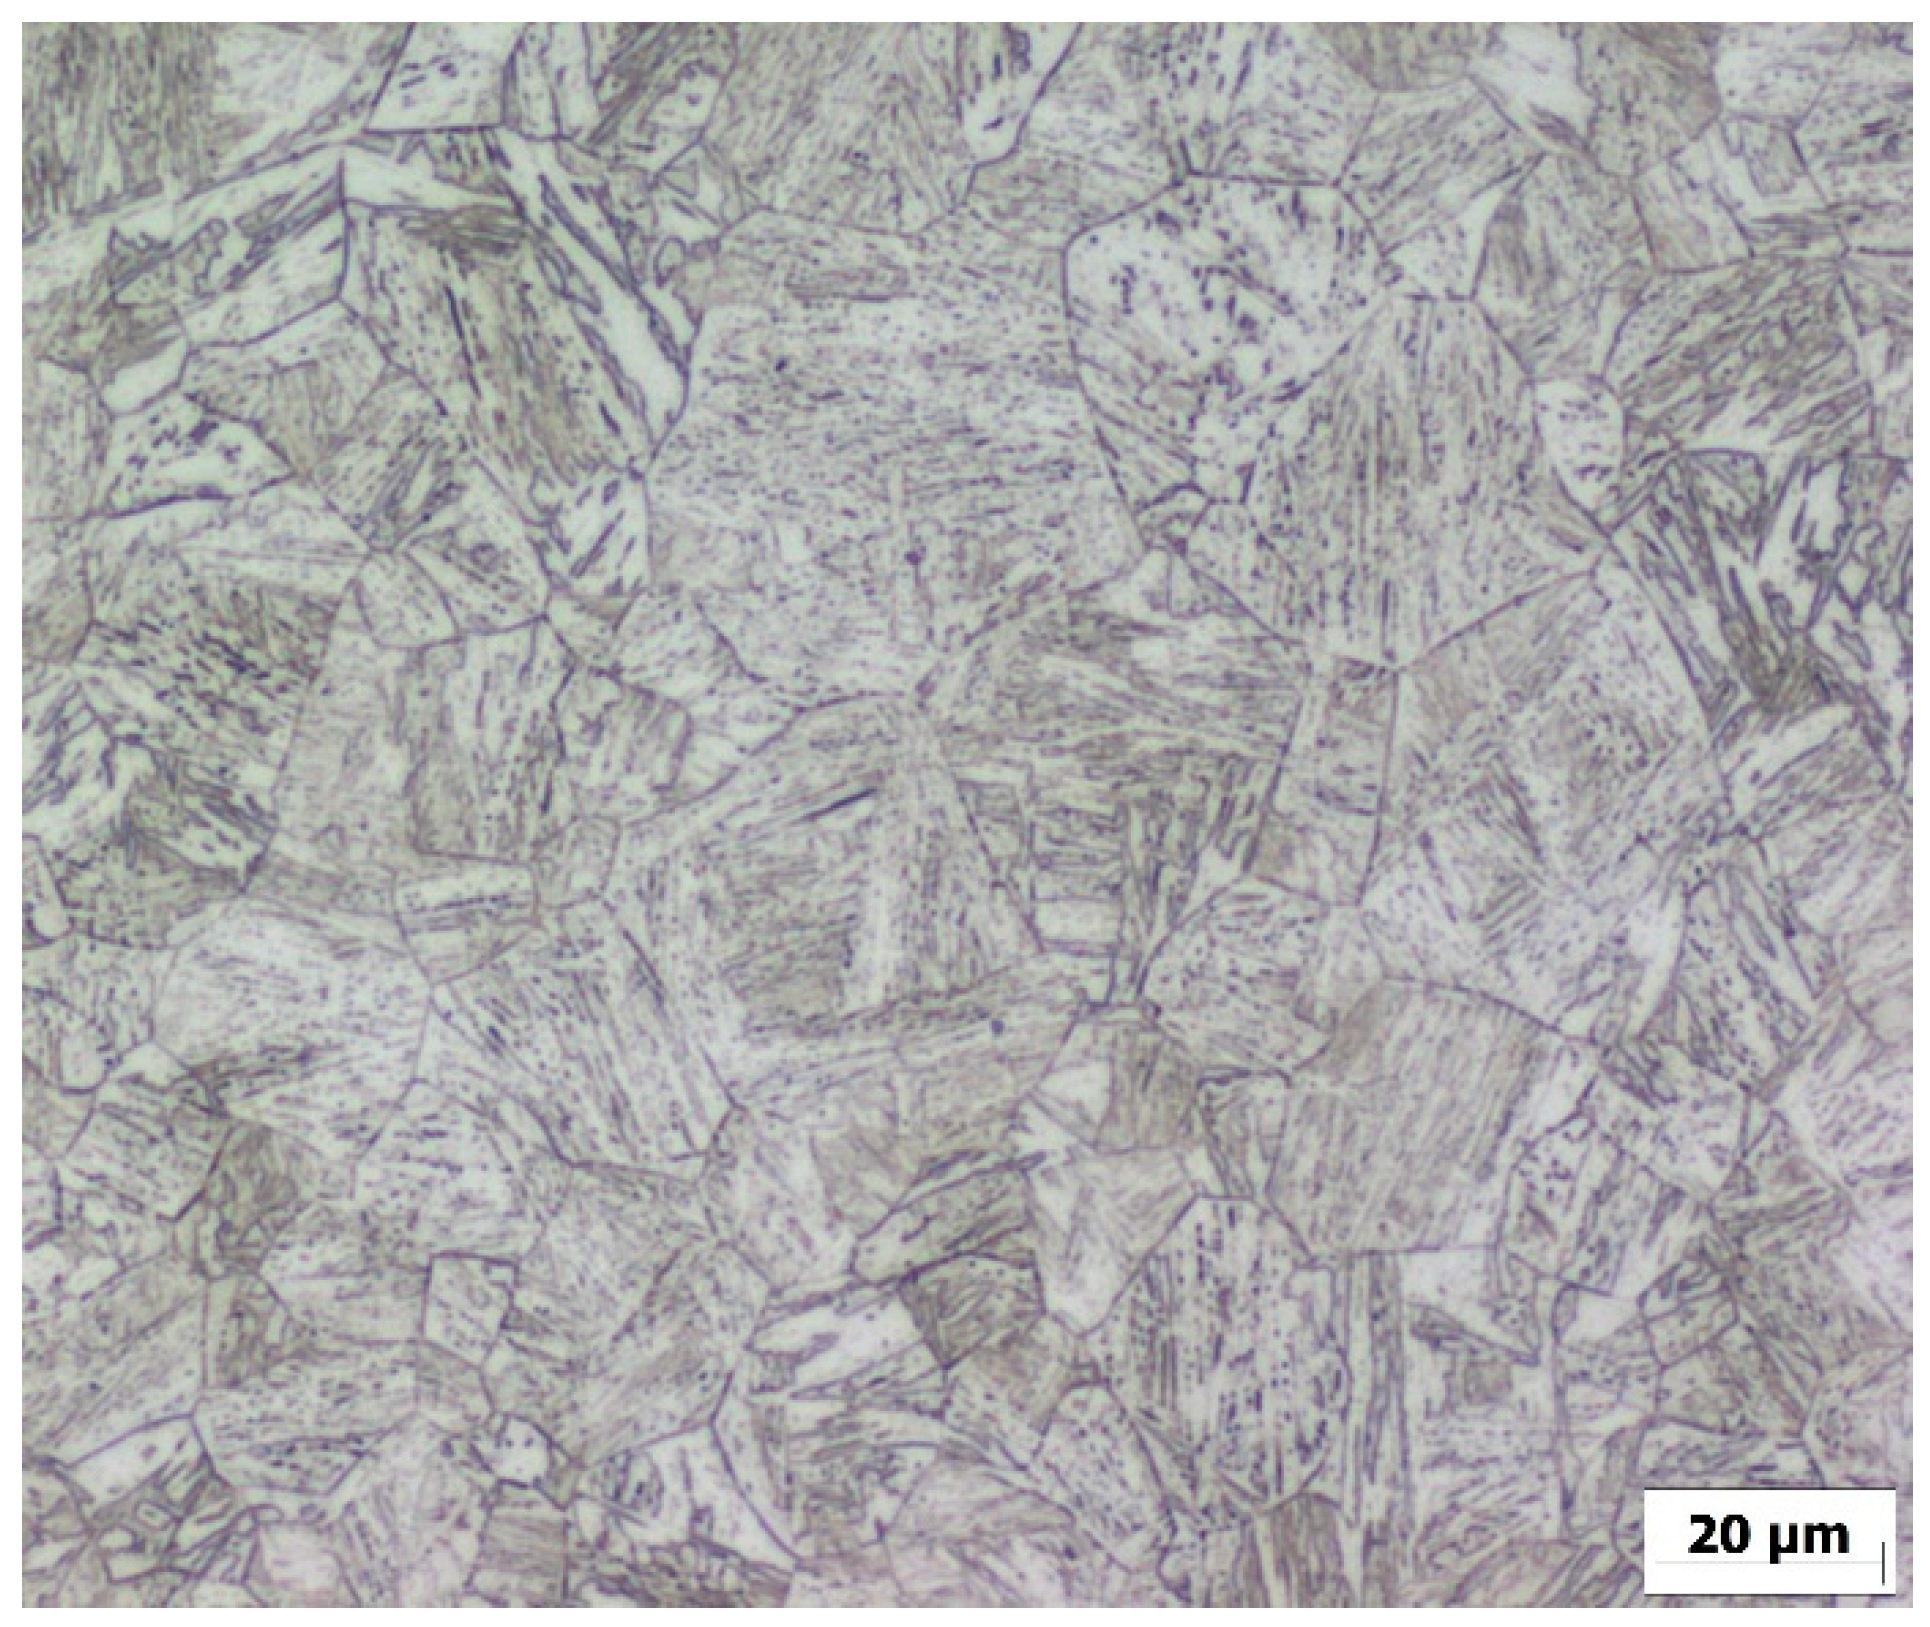
2.3. Preparation of Welded and Simulated Samples for Comparision Purposes
3. Results and Discussion
4. Summary
Author Contributions
Funding
Institutional Review Board Statement
Informed Consent Statement
Data Availability Statement
Conflicts of Interest
References
- Burke, J.E.; Turnbull, D. Recrystallization and grain growth. Prog. Met. Phys. 1952, 3, 220–244. [Google Scholar] [CrossRef]
- Webel, J.; Herges, A.; Britz, D.; Detemple, E.; Flaxa, V.; Mohrbacher, H.; Mücklich, F. Tracing Microalloy Precipitation in Nb-Ti HSLA Steel during Austenite Conditioning. Metals 2020, 10, 243. [Google Scholar] [CrossRef] [Green Version]
- Endo, S.; Nakata, N. Development of Thermo-Mechanical Control Process (TMCP) and High Performance Steel in JFE Steel. JFE Tech. Rep. 2015, 20, 1–7. [Google Scholar]
- Funakawa, Y.; Shiozaki, T.; Tomita, K.; Yamamoto, T.; Maeda, E. Development of High Strength Hot-rolled Sheet Steel Consisting of Ferrite and Nanometer-sized Carbides. ISIJ Int. 2004, 44, 1945–1951. [Google Scholar] [CrossRef]
- Mičian, M.; Frátrik, M.; Kajánek, D. Influence of Welding Parameters and Filler Material on the Mechanical Properties of HSLA Steel S960MC Welded Joints. Metals 2021, 11, 305. [Google Scholar] [CrossRef]
- Hochhauser, F.; Ernst, W.; Rauch, R.; Vallant, R.; Enzinger, N. Influence of the Soft Zone on the Strength of Welded modern HSLA Steels. Weld. World 2012, 56, 77–85. [Google Scholar] [CrossRef]
- Schneider, C.; Ernst, W.; Schnitzer, R.; Staufer, H.; Vallant, R.; Enzinger, N. Welding of S960MC with undermatching filler material. Weld. World 2018, 62, 801–809. [Google Scholar] [CrossRef] [Green Version]
- Amraei, M.; Ahola, A.; Afkhami, S.; Björk, T.; Heidarpour, A. Effects of heat input on the mechanical properties of butt-welded high and ultra-high strength steels. Eng. Struct. 2019, 198, 109460. [Google Scholar] [CrossRef]
- Rahman, M.; Albu, M.; Enzinger, N. On the modelling of austenite grain growth in micro-alloyed HS steel S700MC. Math. Model. Weld Phenom. 2012, 10, 623–636. [Google Scholar]
- Lee, S.-J.; Lee, Y.-K. Effect of Austenite Grain Size on Martensitic Transformation of a Low Alloy Steel. Mater. Sci. Forum 2005, 475–479, 3169–3172. [Google Scholar] [CrossRef]
- Banerjee, K.; Militzer, M.; Perez, M.; Wang, X. Nonisothermal Austenite Grain Growth Kinetics in a Microalloyed X80 Linepipe Steel. Metall. Mater. Trans. A 2010, 41A, 3161–3172. [Google Scholar] [CrossRef]
- Chen, R.C.; Hong, C.; Li, J.J.; Zheng, Z.Z.; Li, P.C. Austenite grain growth and grain size distribution in isothermal heat.treatment of 300M steel. Procedia Eng. 2017, 207, 663–668. [Google Scholar] [CrossRef]
- Yu, H.; Wu, K.; Dong, B.; Liu, J.; Liu, Z.; Xiao, D.; Jin, X.; Liu, H.; Tai, M. Effect of Heat-Input on Microstructure and Toughness of CGHAZ in a High-Nb-Content Microalloyed HSLA Steel. Materials 2022, 15, 3588. [Google Scholar] [CrossRef] [PubMed]
- Shi, M.; Zhang, P.; Wang, C.; Zhu, F. Effect of High Heat Input on Toughness and Microstructure of Coarse Grain Heat Affected Zone in Zr Bearing Low Carbon Steel. ISIJ Int. 2014, 54, 932–937. [Google Scholar] [CrossRef] [Green Version]
- Taillard, R.; Verrier, P.; Maurickx, T.; Foct, J. Effect of Silicon on CGHAZ Toughness and Microstructure of Microalloyed Steels. Metall. Mater. Trans. A 1995, 26A, 447–457. [Google Scholar] [CrossRef]
- Mičian, M.; Harmaniak, D.; Nový, F.; Winczek, J.; Moravec, J.; Trško, L. Effect of the t8/5 Cooling Time on the Properties of S960MC Steel in the HAZ of Welded Joints Evaluated by Thermal Physical Simulation. Metals 2020, 10, 229. [Google Scholar] [CrossRef] [Green Version]
- Giumelli, A. Austenite Grain Growth Kinetics and the Grain Size Distribution. Ph.D. Thesis, The University of British Columbia, Vancouver, BC, Canada, 6 April 1995. [Google Scholar]
- Abbaschian, R.; Abbaschian, L.; Reed-Hill, R.E. Physical Metallurgy Principles, 4th ed.; Cengage Learning: Stamford, CT, USA, 2009; pp. 244–249. [Google Scholar]
- Moravec, J.; Nováková, I.; Sobotka, J.; Neuman, H. Determination of Grain Growth Kinetics and Assessment of Welding Effect on Properties of S700 MC Steel in the HAZ of Welded Joints. Metals 2019, 9, 707. [Google Scholar] [CrossRef] [Green Version]
- Manohar, P.A.; Dunne, D.P.; Chandra, T.; Killmore, C.R. Grain Growth Predictions in Microalloyed Steels. ISIJ Int. 1996, 36, 194–200. [Google Scholar] [CrossRef] [Green Version]
- Cahn, R.W.; Haasen, P. Physical Metallurgy, Volume 3, 4th ed.; Elsevier Science Ltd.: Amsterdam, The Netherlands, 1996; p. 2475. [Google Scholar]
- Najafkhani, F.; Kheiri, S.; Pourbahari, B.; Mirzadeh, H. Recent advances in the kinetics of normal/abnormal grain growth: A review. Arch. Civ. Mech. Eng. 2021, 21, 29. [Google Scholar] [CrossRef]
- Bhattacharyya, J.J.; Agnew, S.R.; Muralidharan, G. Texture enhancement during grain growth of magnesium alloy AZ31B. Acta Mater. 2015, 86, 80–94. [Google Scholar] [CrossRef] [Green Version]
- Sellars, C.M.; Whiteman, J.A. Recrystallization and grain growth in hot rolling. Metal. Sci. 1979, 13, 187–194. [Google Scholar] [CrossRef]
- Maalekian, M.; Radis, R.; Militzer, M.; Moreau, A.; Poole, W.J. In situ measurement and modelling of austenite grain growth in a Ti/Nb microalloyed steel. Acta Mater. 2012, 60, 1015–1026. [Google Scholar] [CrossRef]
- Strenx. Welding of Strenx; SSAB AB: Stockholm, Sweden, 2017. [Google Scholar]
- Nowotnik, A.; Siwecki, T. The effect of TMCP parameters on the microstructure and mechanical properties of Ti-Nb microalloyed steel. J. Microsc. 2009, 237, 258–262. [Google Scholar] [CrossRef]
- Moravec, J. Determination of the Grain Growth Kinetics as a Base Parameter for Numerical Simulations demand. MM Sci. J. 2015, 10, 649–653. [Google Scholar] [CrossRef]
- Seikh, A.H.; Soliman, M.S.; AlMajid, A.; Alhajeri, K.; Alshalfan, W. Austenite Grain Growth Kinetics in API X65 and X70 Steel During Isothermal Heating. Adv. Mater. Sci. Eng. 2014, 5, 1–8. [Google Scholar] [CrossRef] [Green Version]
- Pous-Romero, H.; Lonardelli, I.; Cogswell, D.; Bhadeshia, H.K.D.H. Austenite grain growth in a nuclear pressure vessel steel. Mater. Sci. Eng. A 2013, 567, 72–79. [Google Scholar] [CrossRef]


| Rp0.2 (MPa) | Rm (MPa) | A50mm (%) | CET (CEV) | KV −20 °C (J) |
|---|---|---|---|---|
| 1018 | 1108 | 10 | 0.26 (0.50) | 32 |
| C | Si | Mn | P | S | Al | Nb | V |
| 0.085 | 0.18 | 1.06 | 0.01 | 0.003 | 0.036 | 0.002 | 0.007 |
| Ti | Cu | Cr | Ni | Mo | N | B | Fe |
| 0.026 | 0.01 | 1.08 | 0.07 | 0.109 | 0.005 | 0.0015 | bal. |
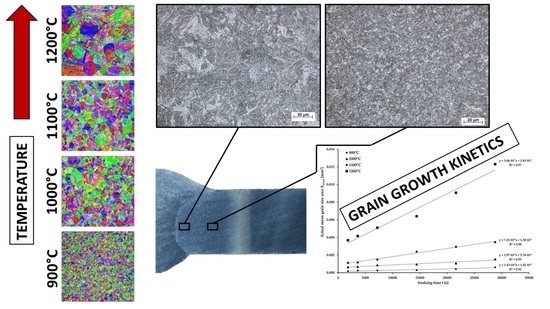
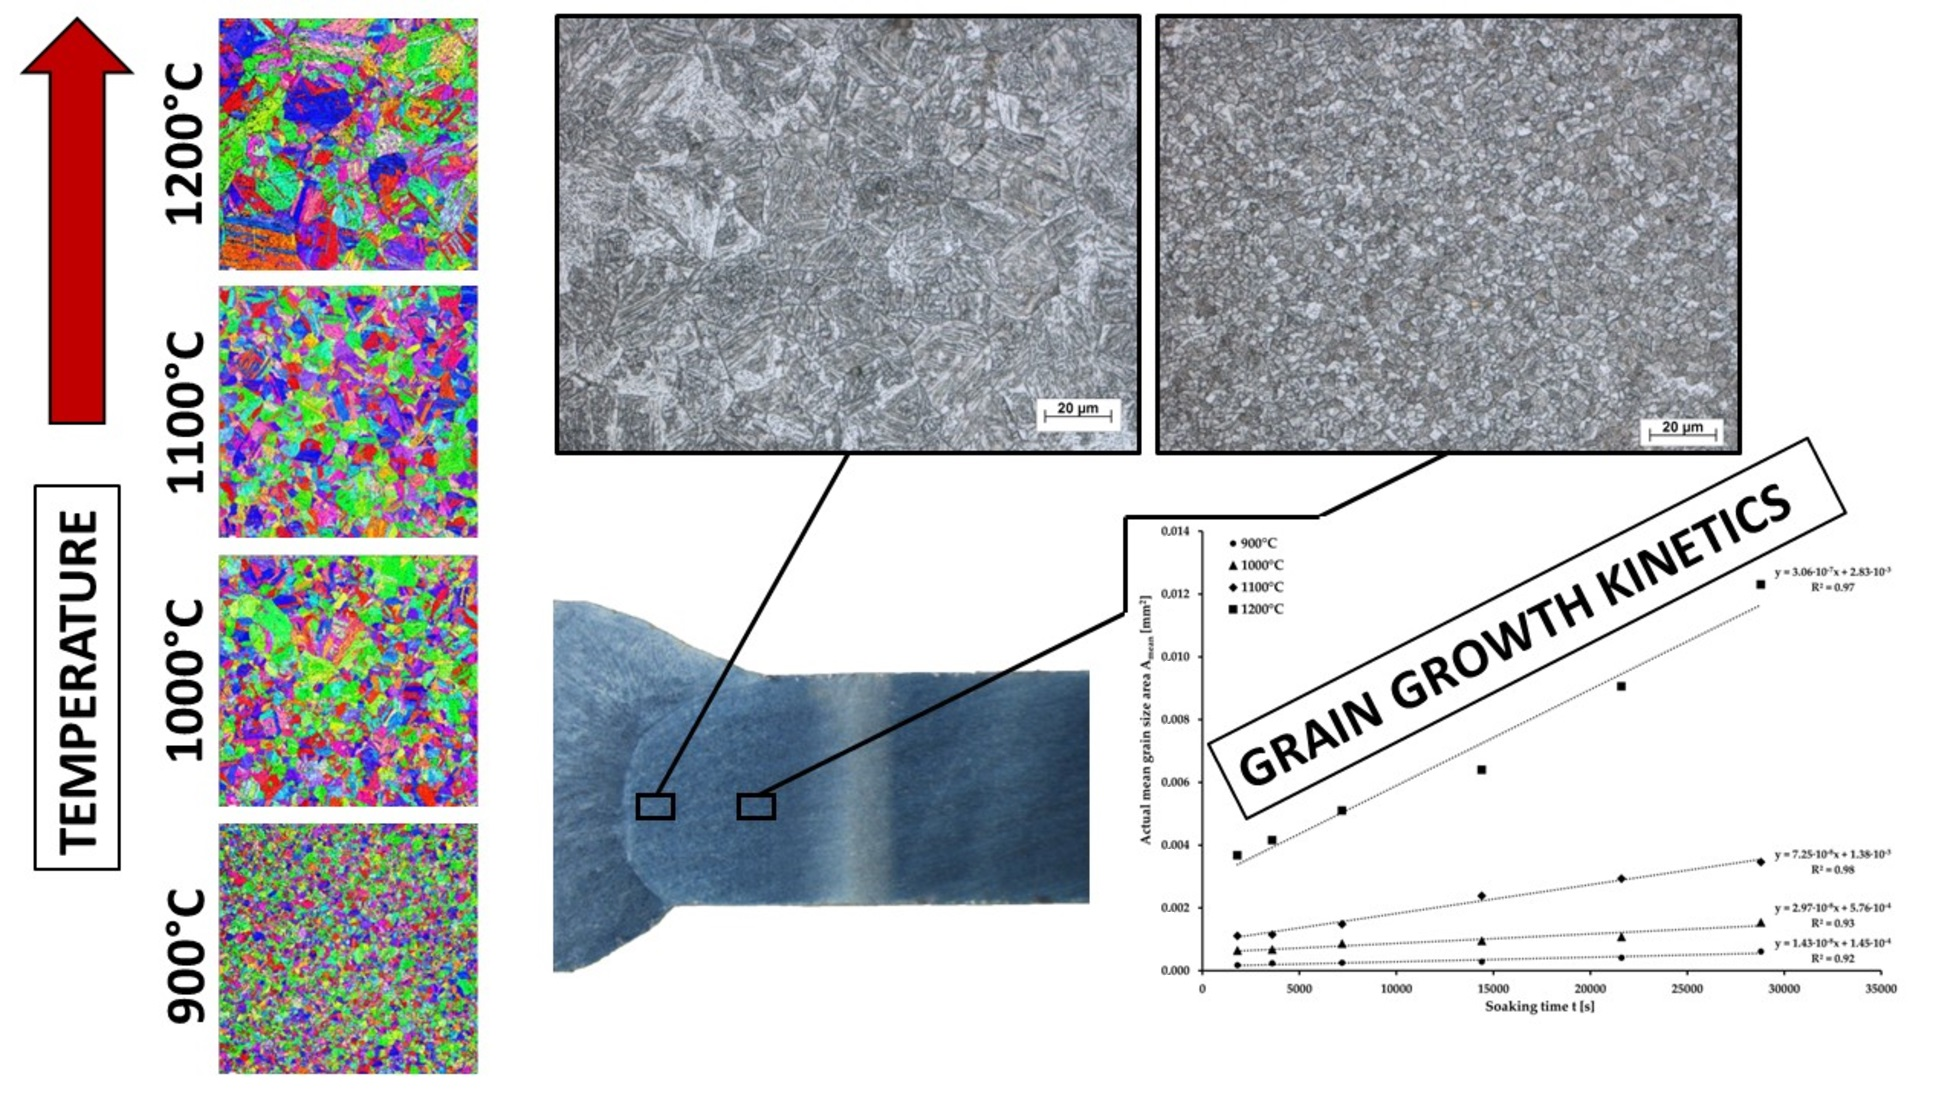
| S960MC | Soaking Time (h) | |||||
|---|---|---|---|---|---|---|
| 0.5 | 1 | 2 | 4 | 6 | 8 | |
| 900 °C | 13.1 | 15.4 | 16.0 | 16.8 | 20.4 | 24.7 |
| 1000 °C | 25.3 | 26.0 | 29.4 | 30.8 | 32.8 | 39.2 |
| 1100 °C | 38.5 | 39.2 | 45.5 | 48.8 | 54.1 | 58.8 |
| 1200 °C | 60.1 | 64.5 | 71.4 | 80.0 | 95.2 | 111.1 |
| S960MC | KT (mm2s−1) | D0 (mm) |
|---|---|---|
| 900 °C | 1.426 × 10⁻⁸ | 0.0120 |
| 1000 °C | 2.965 × 10⁻⁸ | 0.0240 |
| 1100 °C | 7.248 × 10⁻⁸ | 0.0371 |
| 1200 °C | 3.063 × 10⁻⁷ | 0.0532 |
| Method | U (V) | I (A) | Welding Speed (cm·min−1) | Wire Feed Speed vd (m·min−1) | Heat Input Qp (kJ·cm−1) | Weld Gap b (mm) |
|---|---|---|---|---|---|---|
| GMAW-S | 16.6 | 102 | 22.2 | 3.8 | 3.69 | 1.5 |
Publisher’s Note: MDPI stays neutral with regard to jurisdictional claims in published maps and institutional affiliations. |
© 2022 by the authors. Licensee MDPI, Basel, Switzerland. This article is an open access article distributed under the terms and conditions of the Creative Commons Attribution (CC BY) license (https://creativecommons.org/licenses/by/4.0/).
Share and Cite
Mičian, M.; Frátrik, M.; Moravec, J.; Švec, M. Determination of Grain Growth Kinetics of S960MC Steel. Materials 2022, 15, 8539. https://doi.org/10.3390/ma15238539
Mičian M, Frátrik M, Moravec J, Švec M. Determination of Grain Growth Kinetics of S960MC Steel. Materials. 2022; 15(23):8539. https://doi.org/10.3390/ma15238539
Chicago/Turabian StyleMičian, Miloš, Martin Frátrik, Jaromír Moravec, and Martin Švec. 2022. "Determination of Grain Growth Kinetics of S960MC Steel" Materials 15, no. 23: 8539. https://doi.org/10.3390/ma15238539