
Evaluating the Feasibility of Using Brick Powder and Clay Powder in Cement Replacement

Abstract
:1. Introduction
2. Materials and Methods
2.1. Materials
2.2. Methods
- X-ray diffraction (XRD),
- X-ray fluorescence (XRF),
- particle size distribution (PSD) by the laser diffraction (LD) method,
- specific surface area (SSA) according to Blaine’s method.
- tensile strength (fcf) in the bending test,
- compressive strength (fc),
- tensile strength after exposure to the elevated temperature (fcfT),
- compressive strength after exposure to the elevated temperature (fcT).
- shrinkage (S),
- specific density (Ds),
- bulk density (D),
- water absorption (WA).
- Support vector machines (SVM).
3. Results and Discussion
3.1. Cement, Brick Powder, Clay Powder—Basic Characteristics
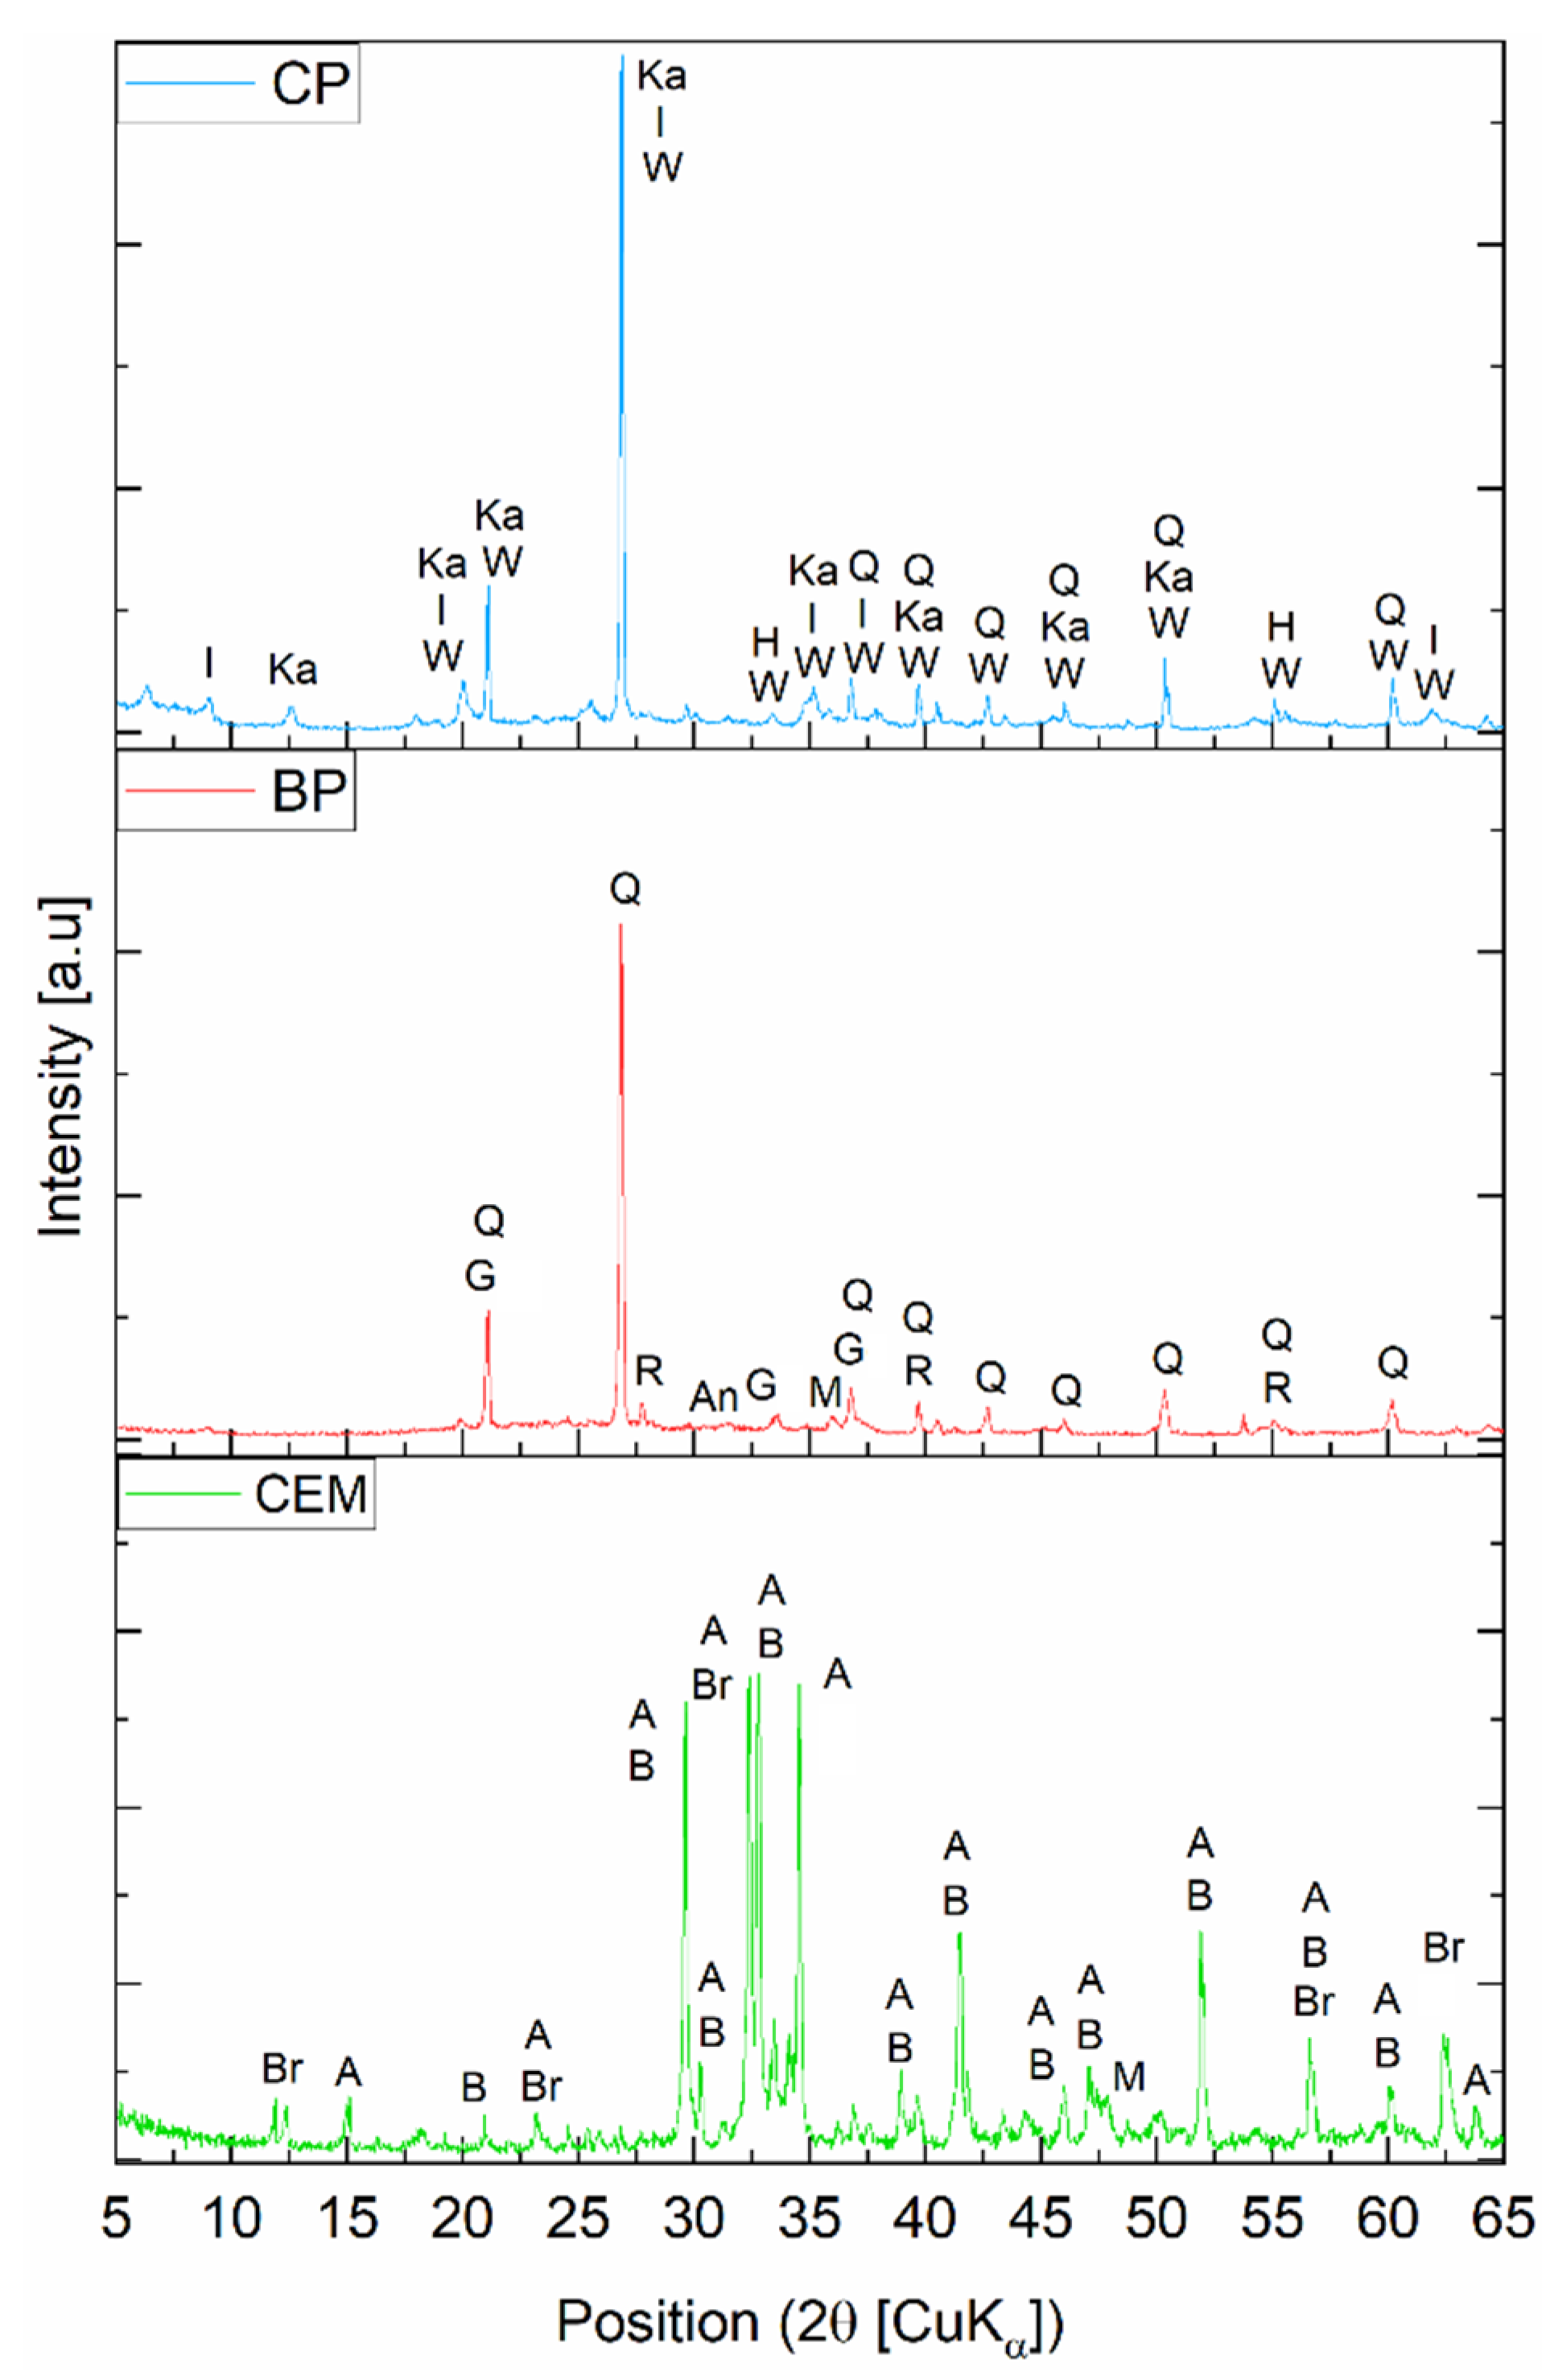
3.1.1. Physical, Chemical, and Phase Properties
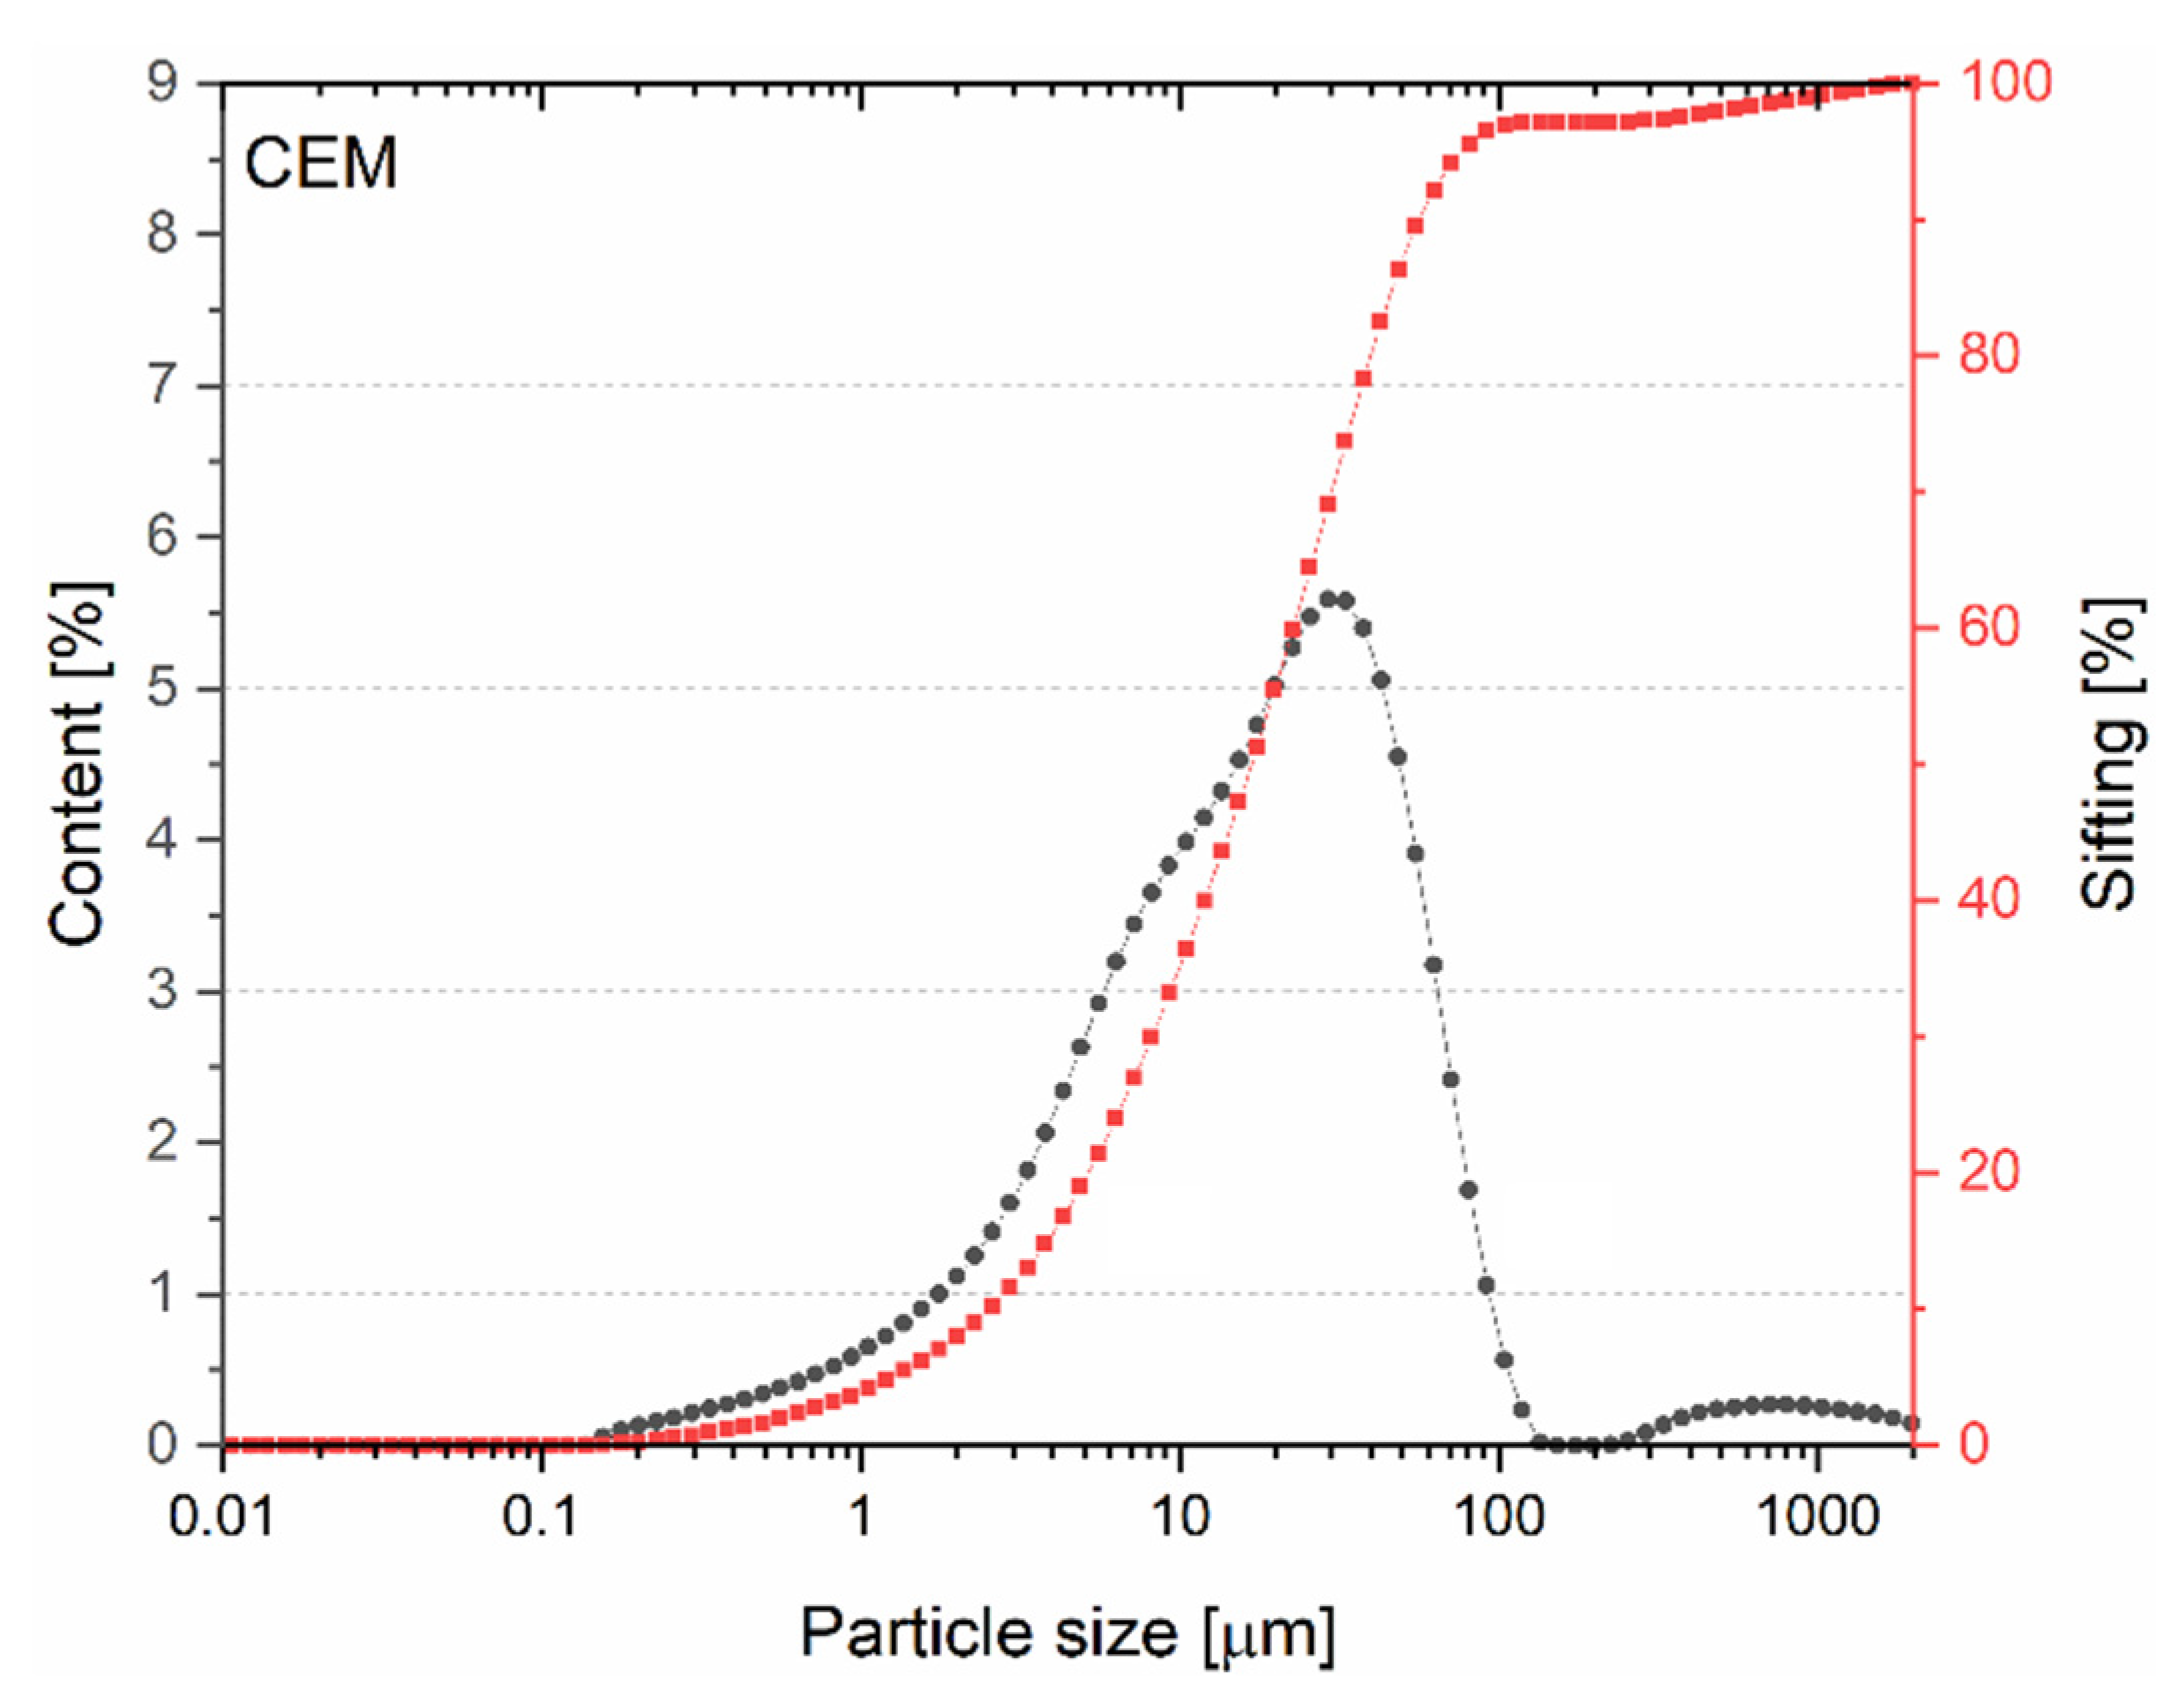
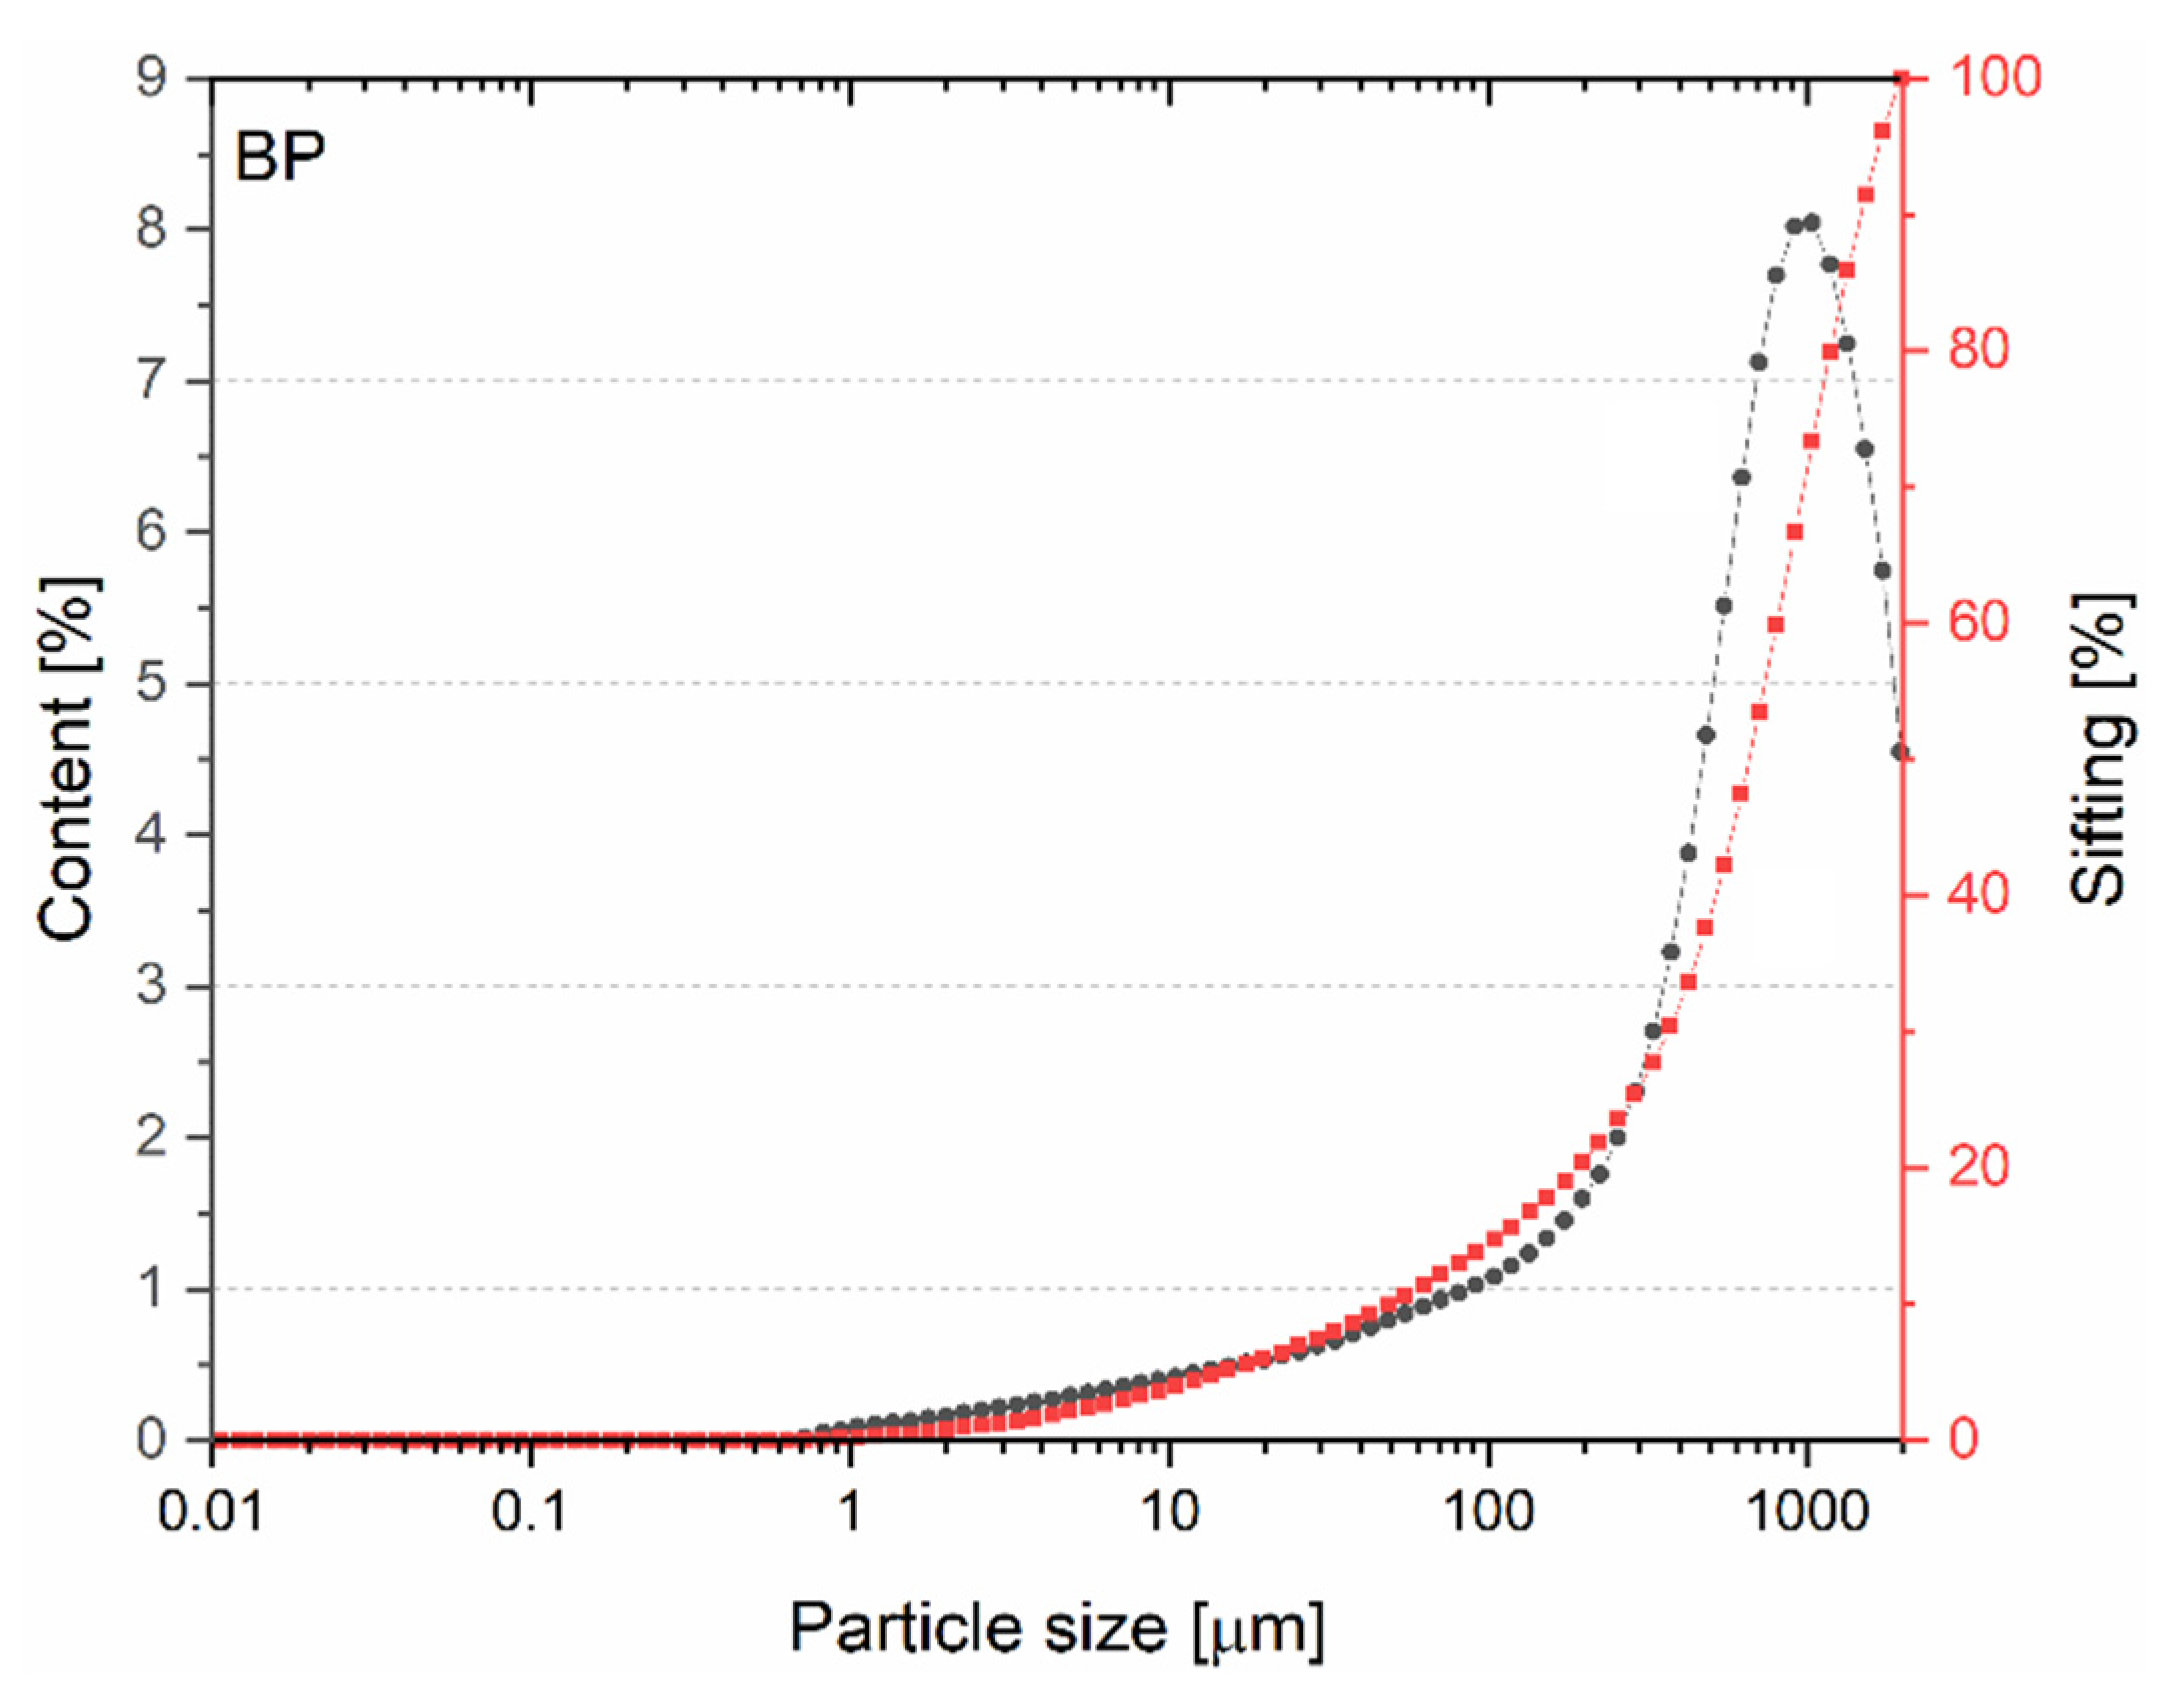
3.1.2. Particle Size Distribution
3.2. Physico-Mechanical Properties of Hardened Cement Paste
3.2.1. Physical Properties
3.2.2. Mechanical Properties
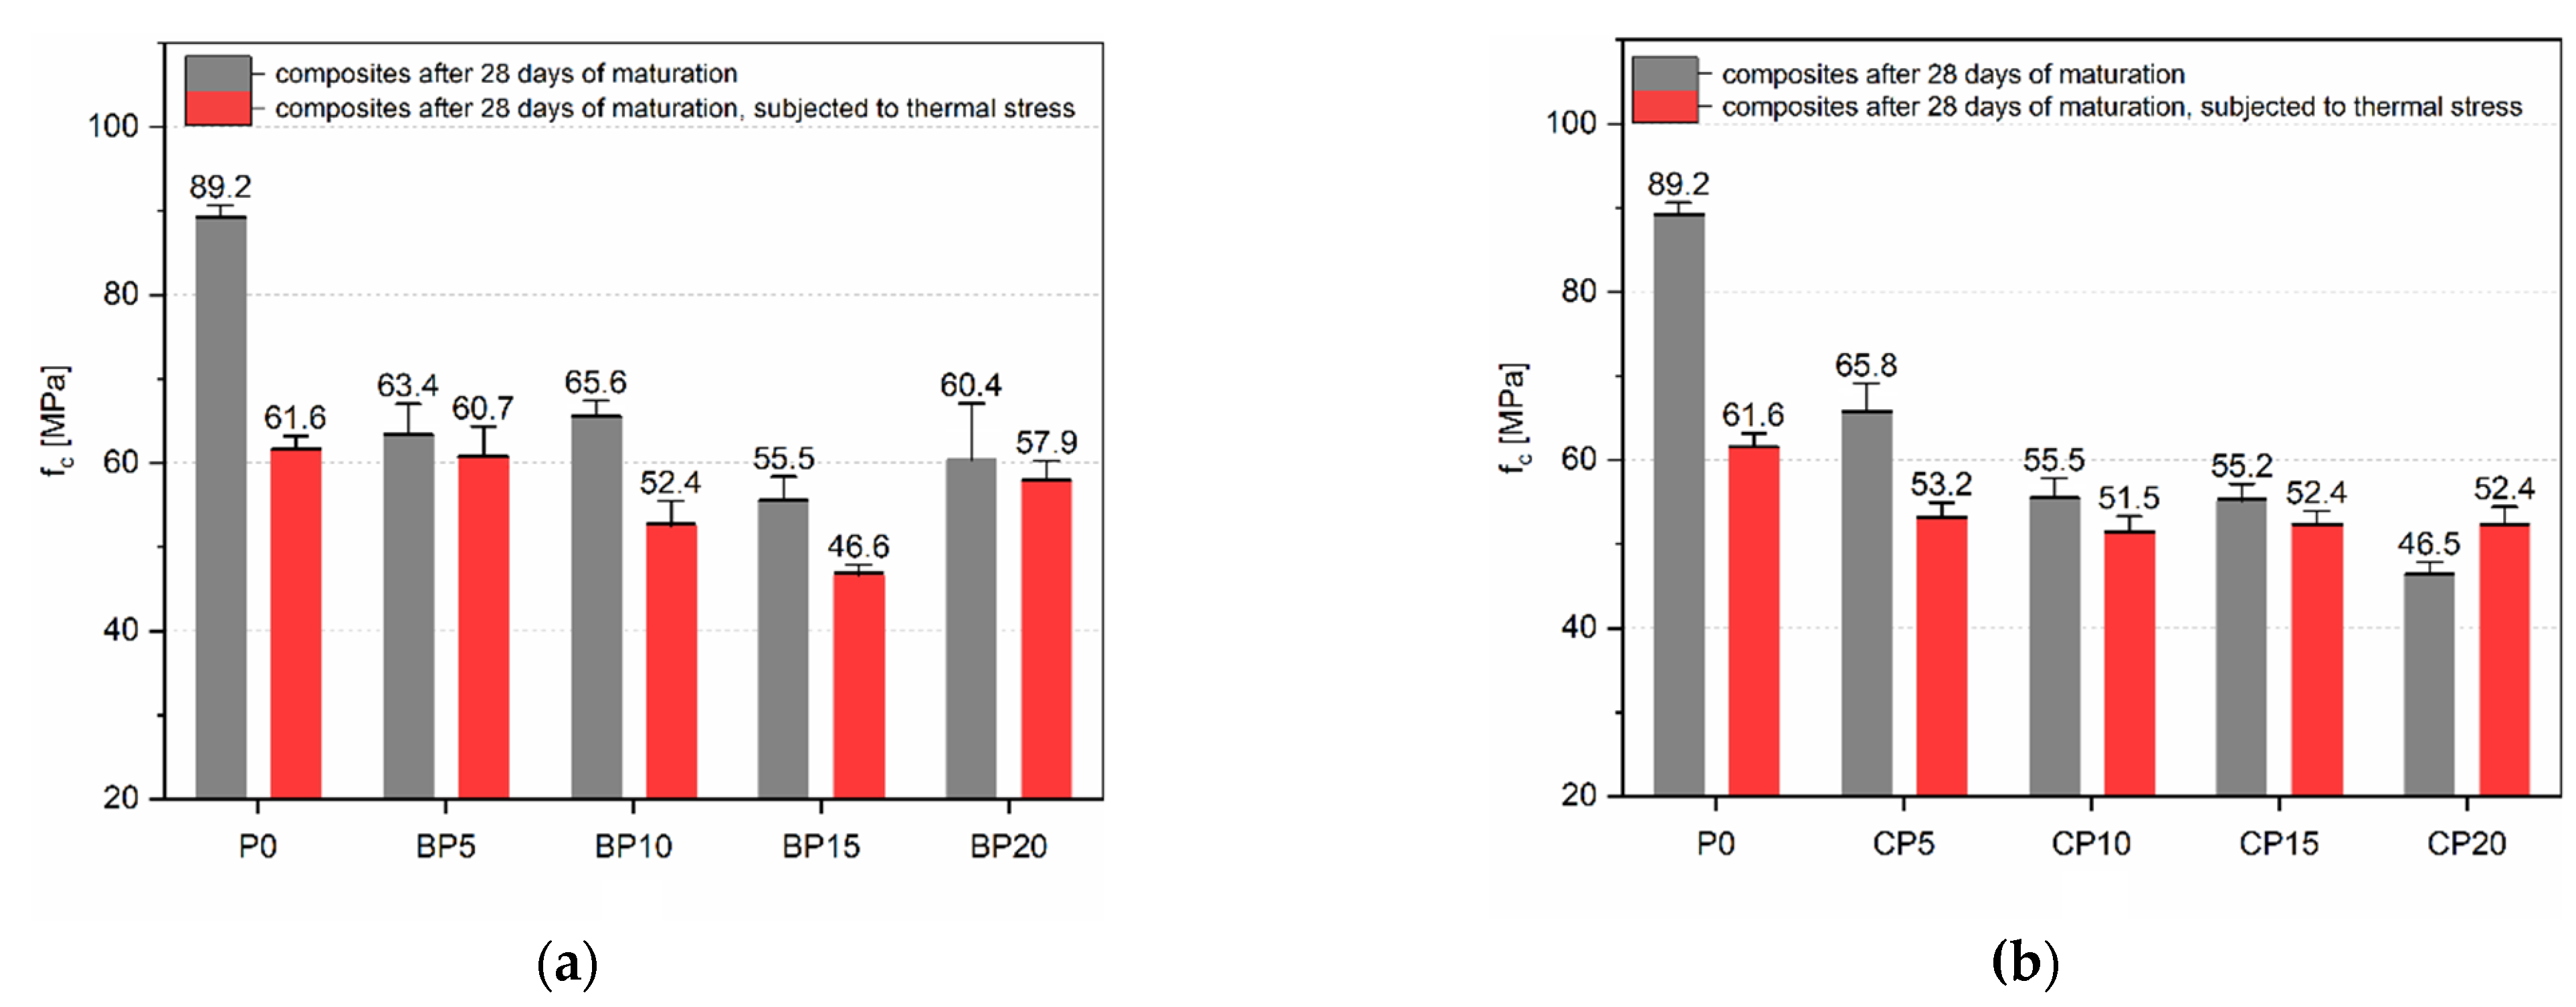
Compressive Strength
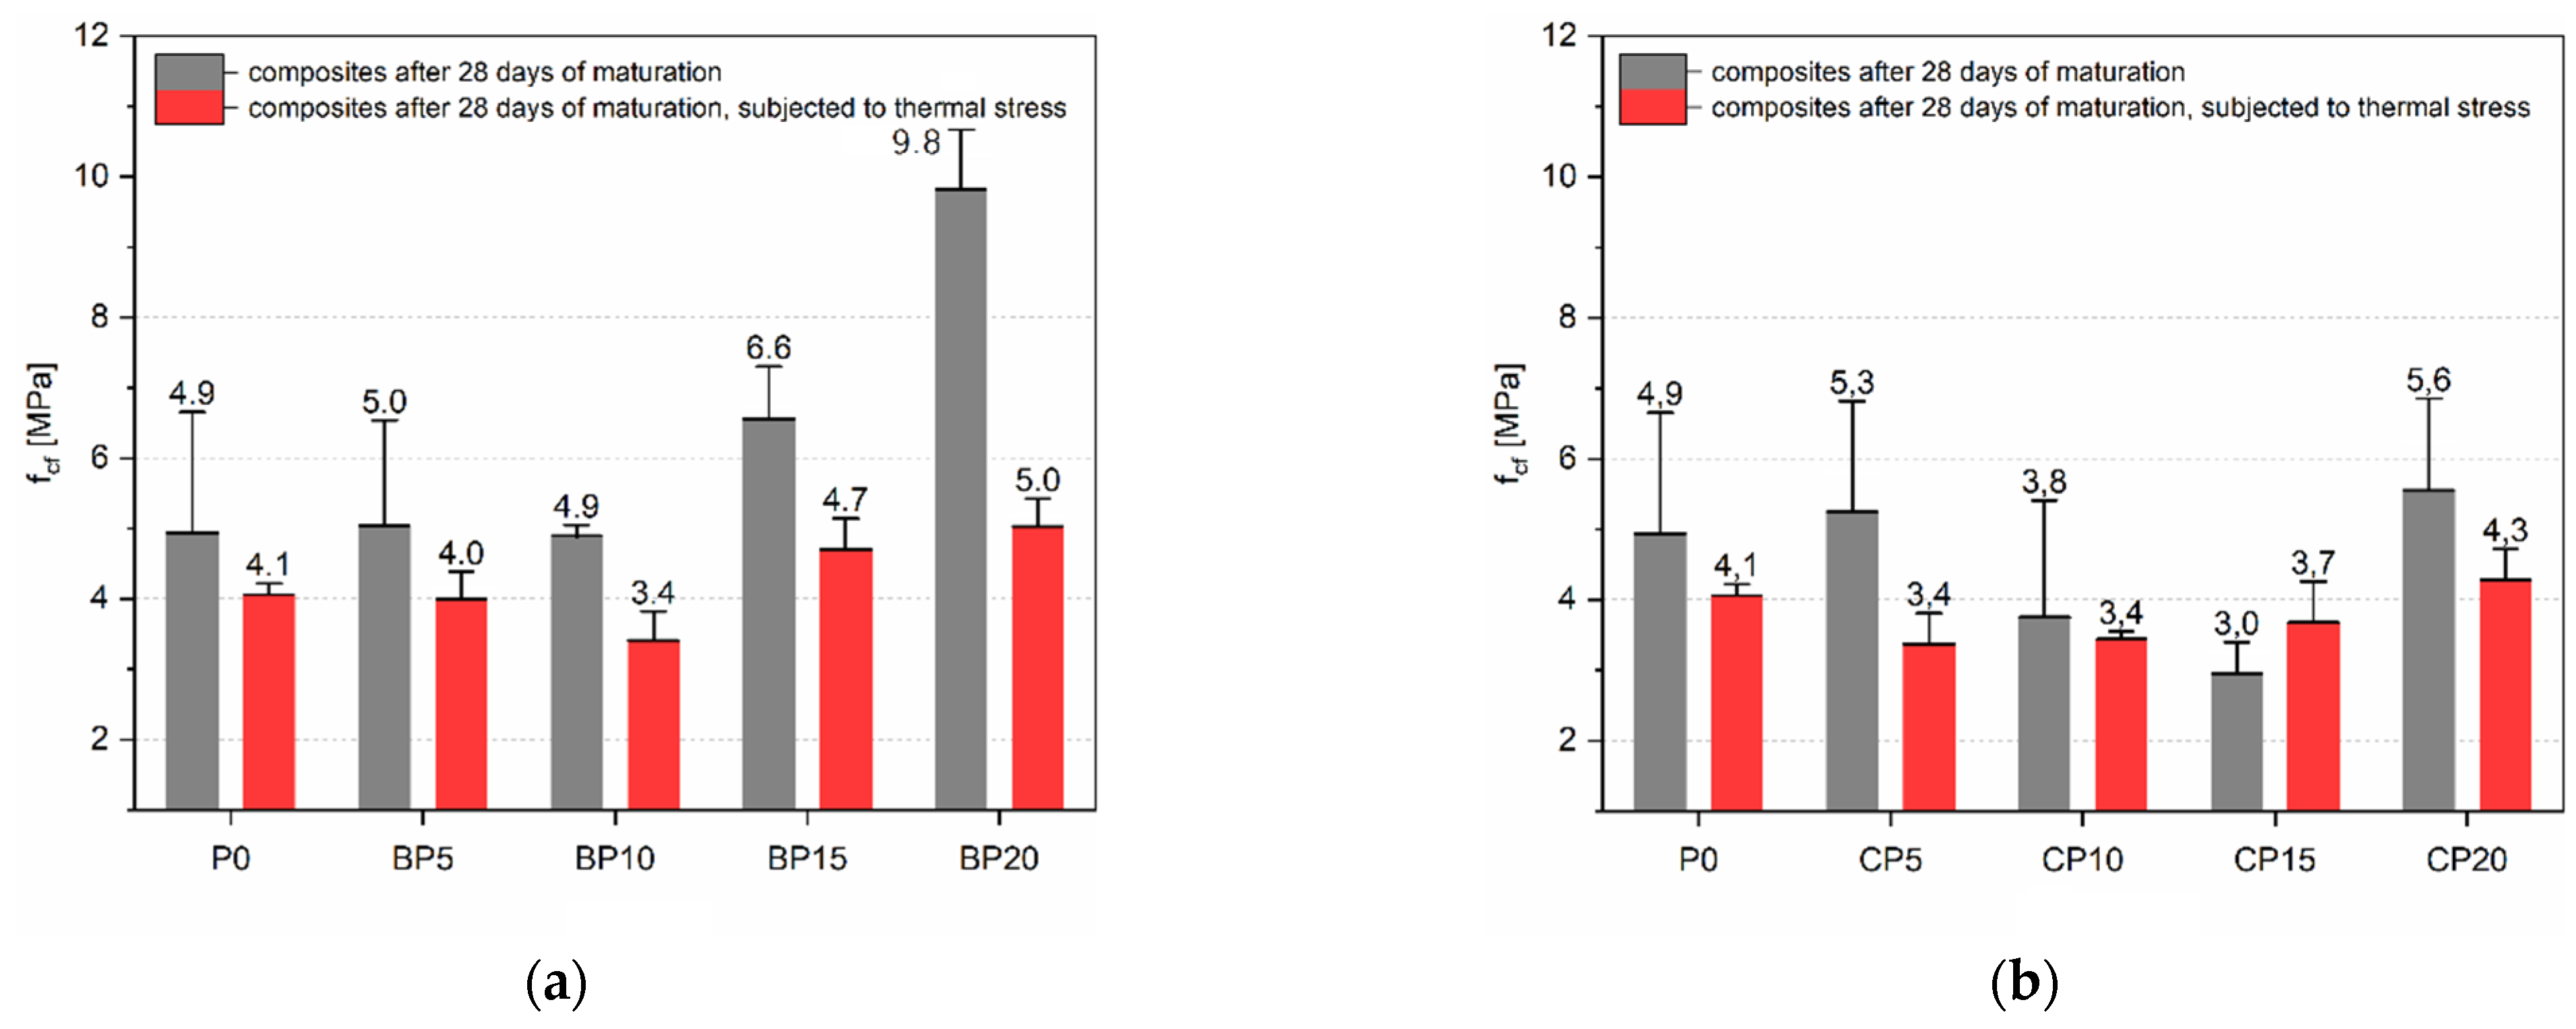
Flexural Strength
Brittleness
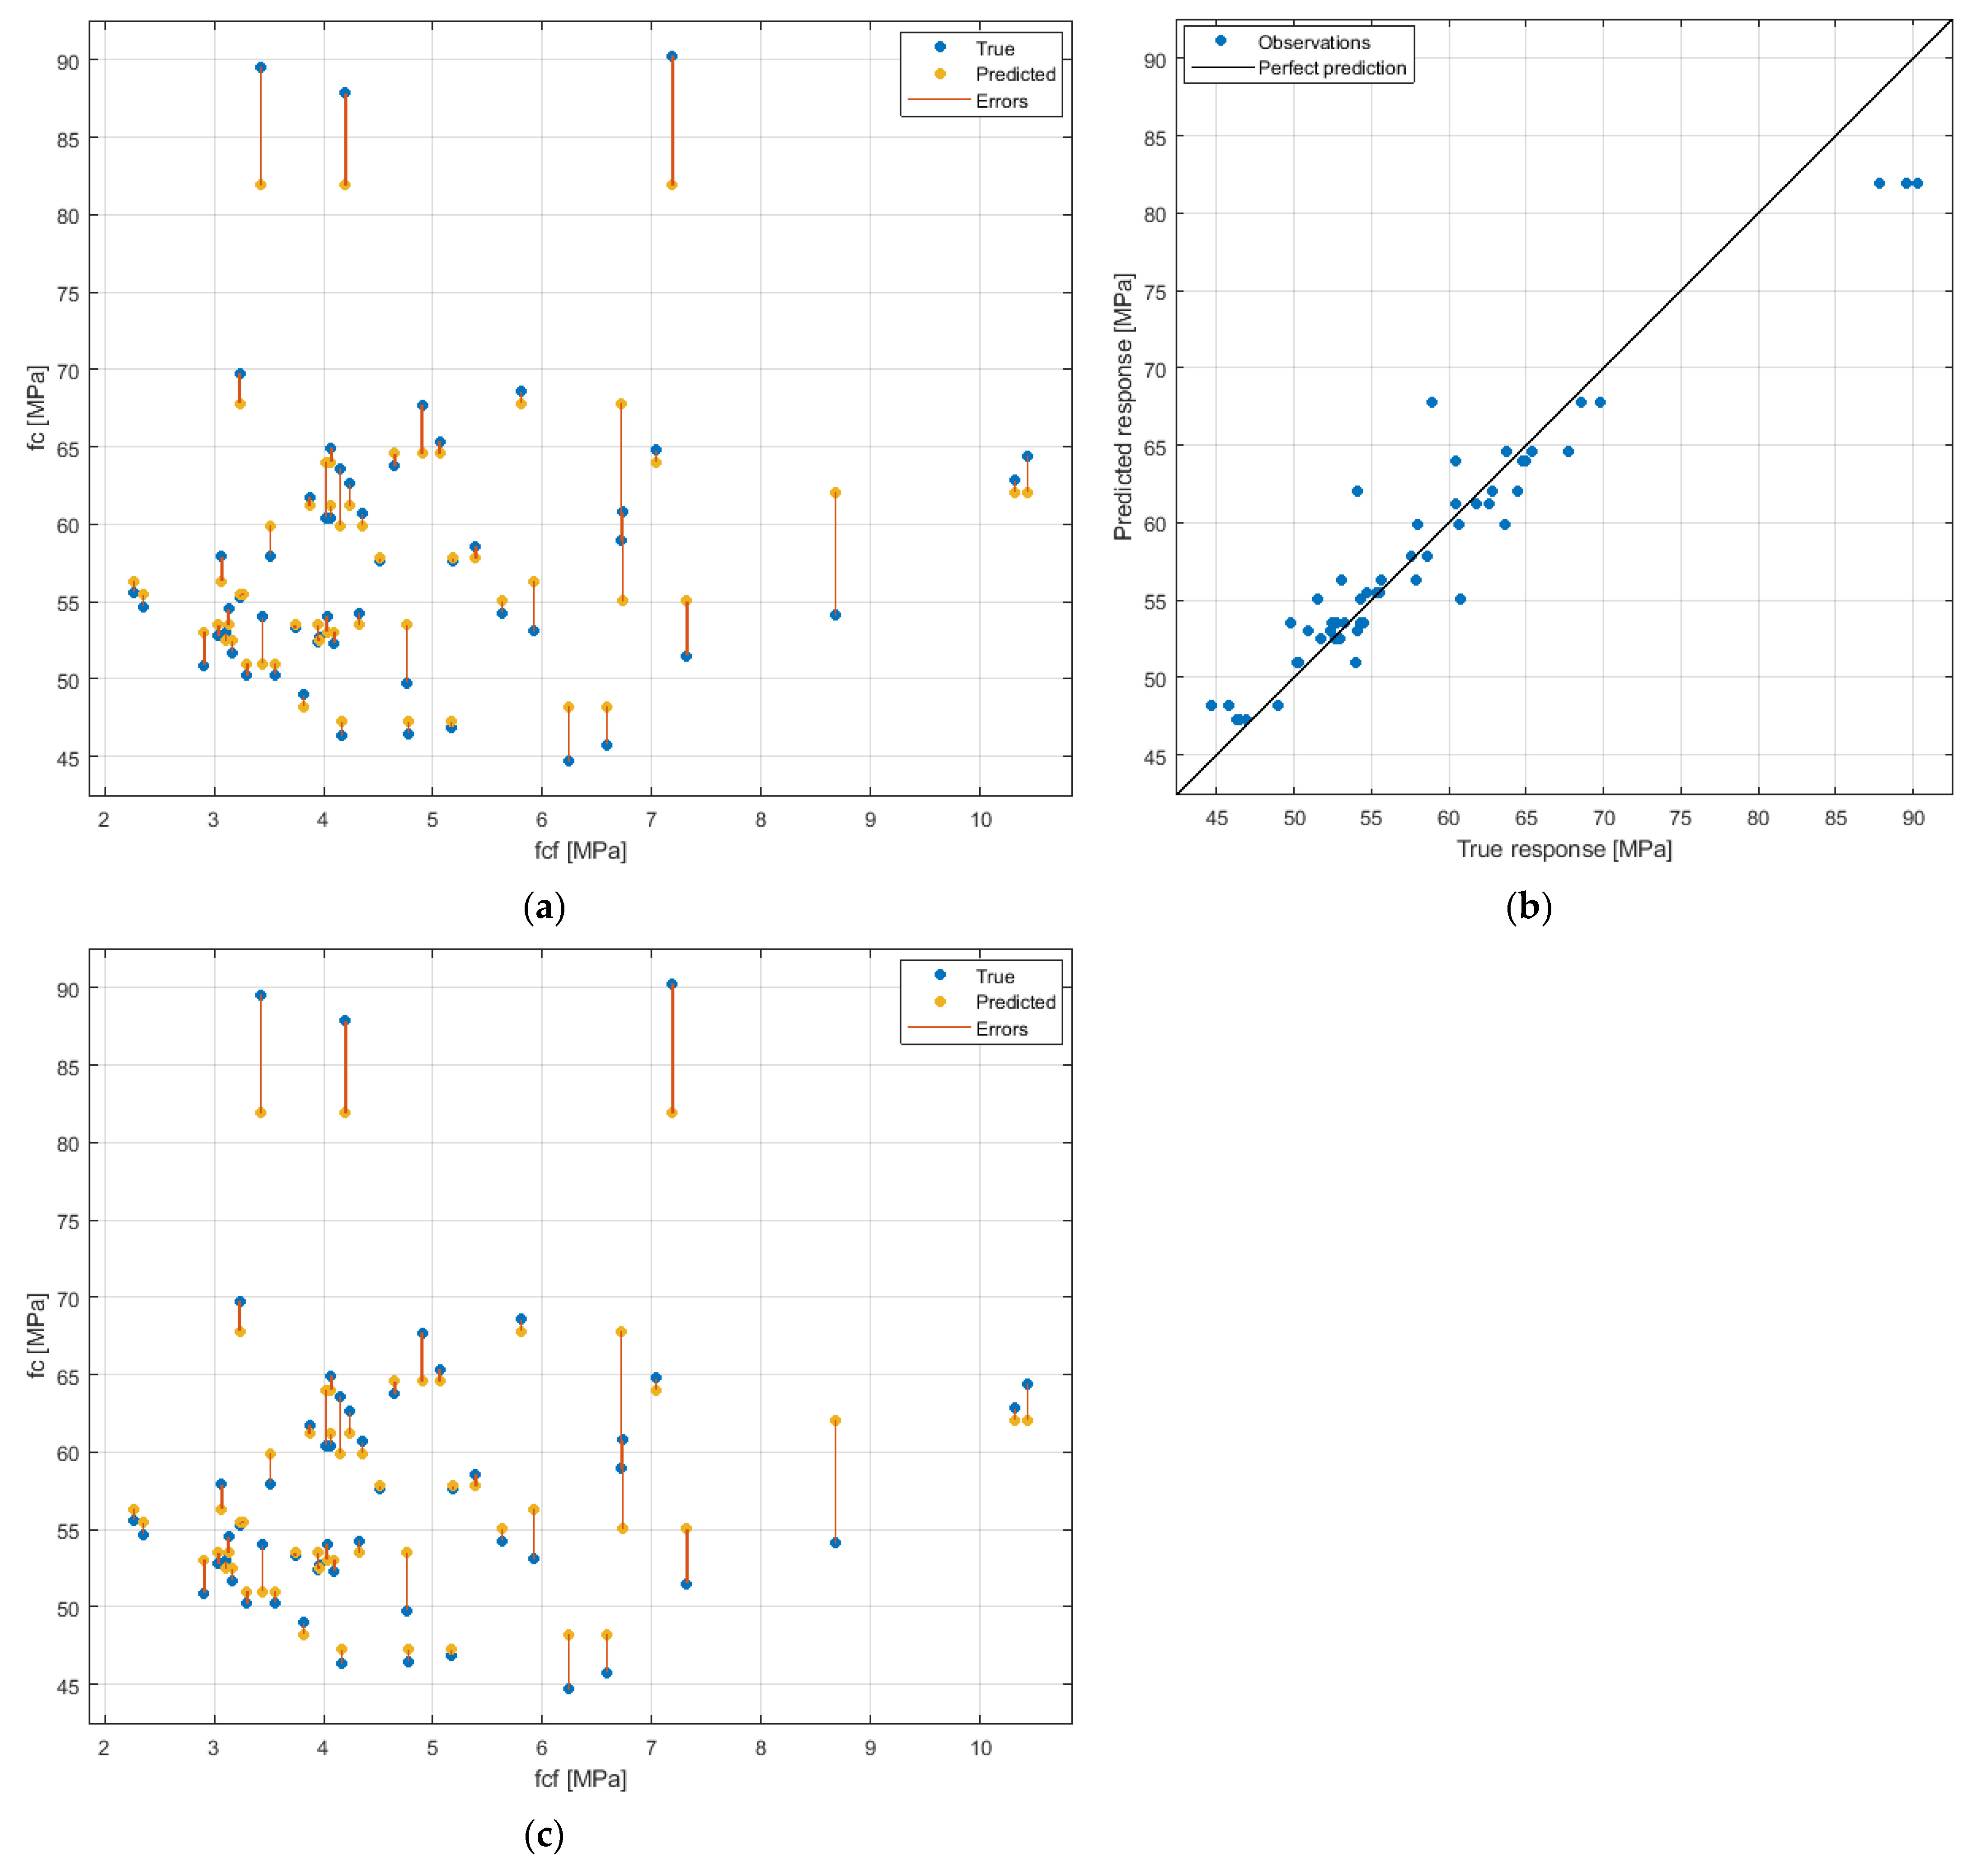
3.3. Intelligent fc Prediction Using SVM
4. Summary and Conclusions
- The CP and BP reduced the compressive strength of the cement matrix. In the case of the thermal shock effect, a positive effect of BP and CP was observed, as fcT was 11% and 6% lower than fc, respectively. For the P0 series, the difference was as much as 31%.
- As BP content increased, an increase in fcf and fcfT was observed. For the BP20 series, the value of fcf was as much as twice that of P0. For CP-modified cement matrix, the effect on fcf and fcfT varied depending on the CP content.
- With an increase in BP and CP content, a decrease in the tightness and an increase in the overall porosity of the cement matrix were observed. This is the same as an increase in the water absorption of the modified samples. The highest water absorption was obtained for CP20 and was as much as 19% higher compared to P0.
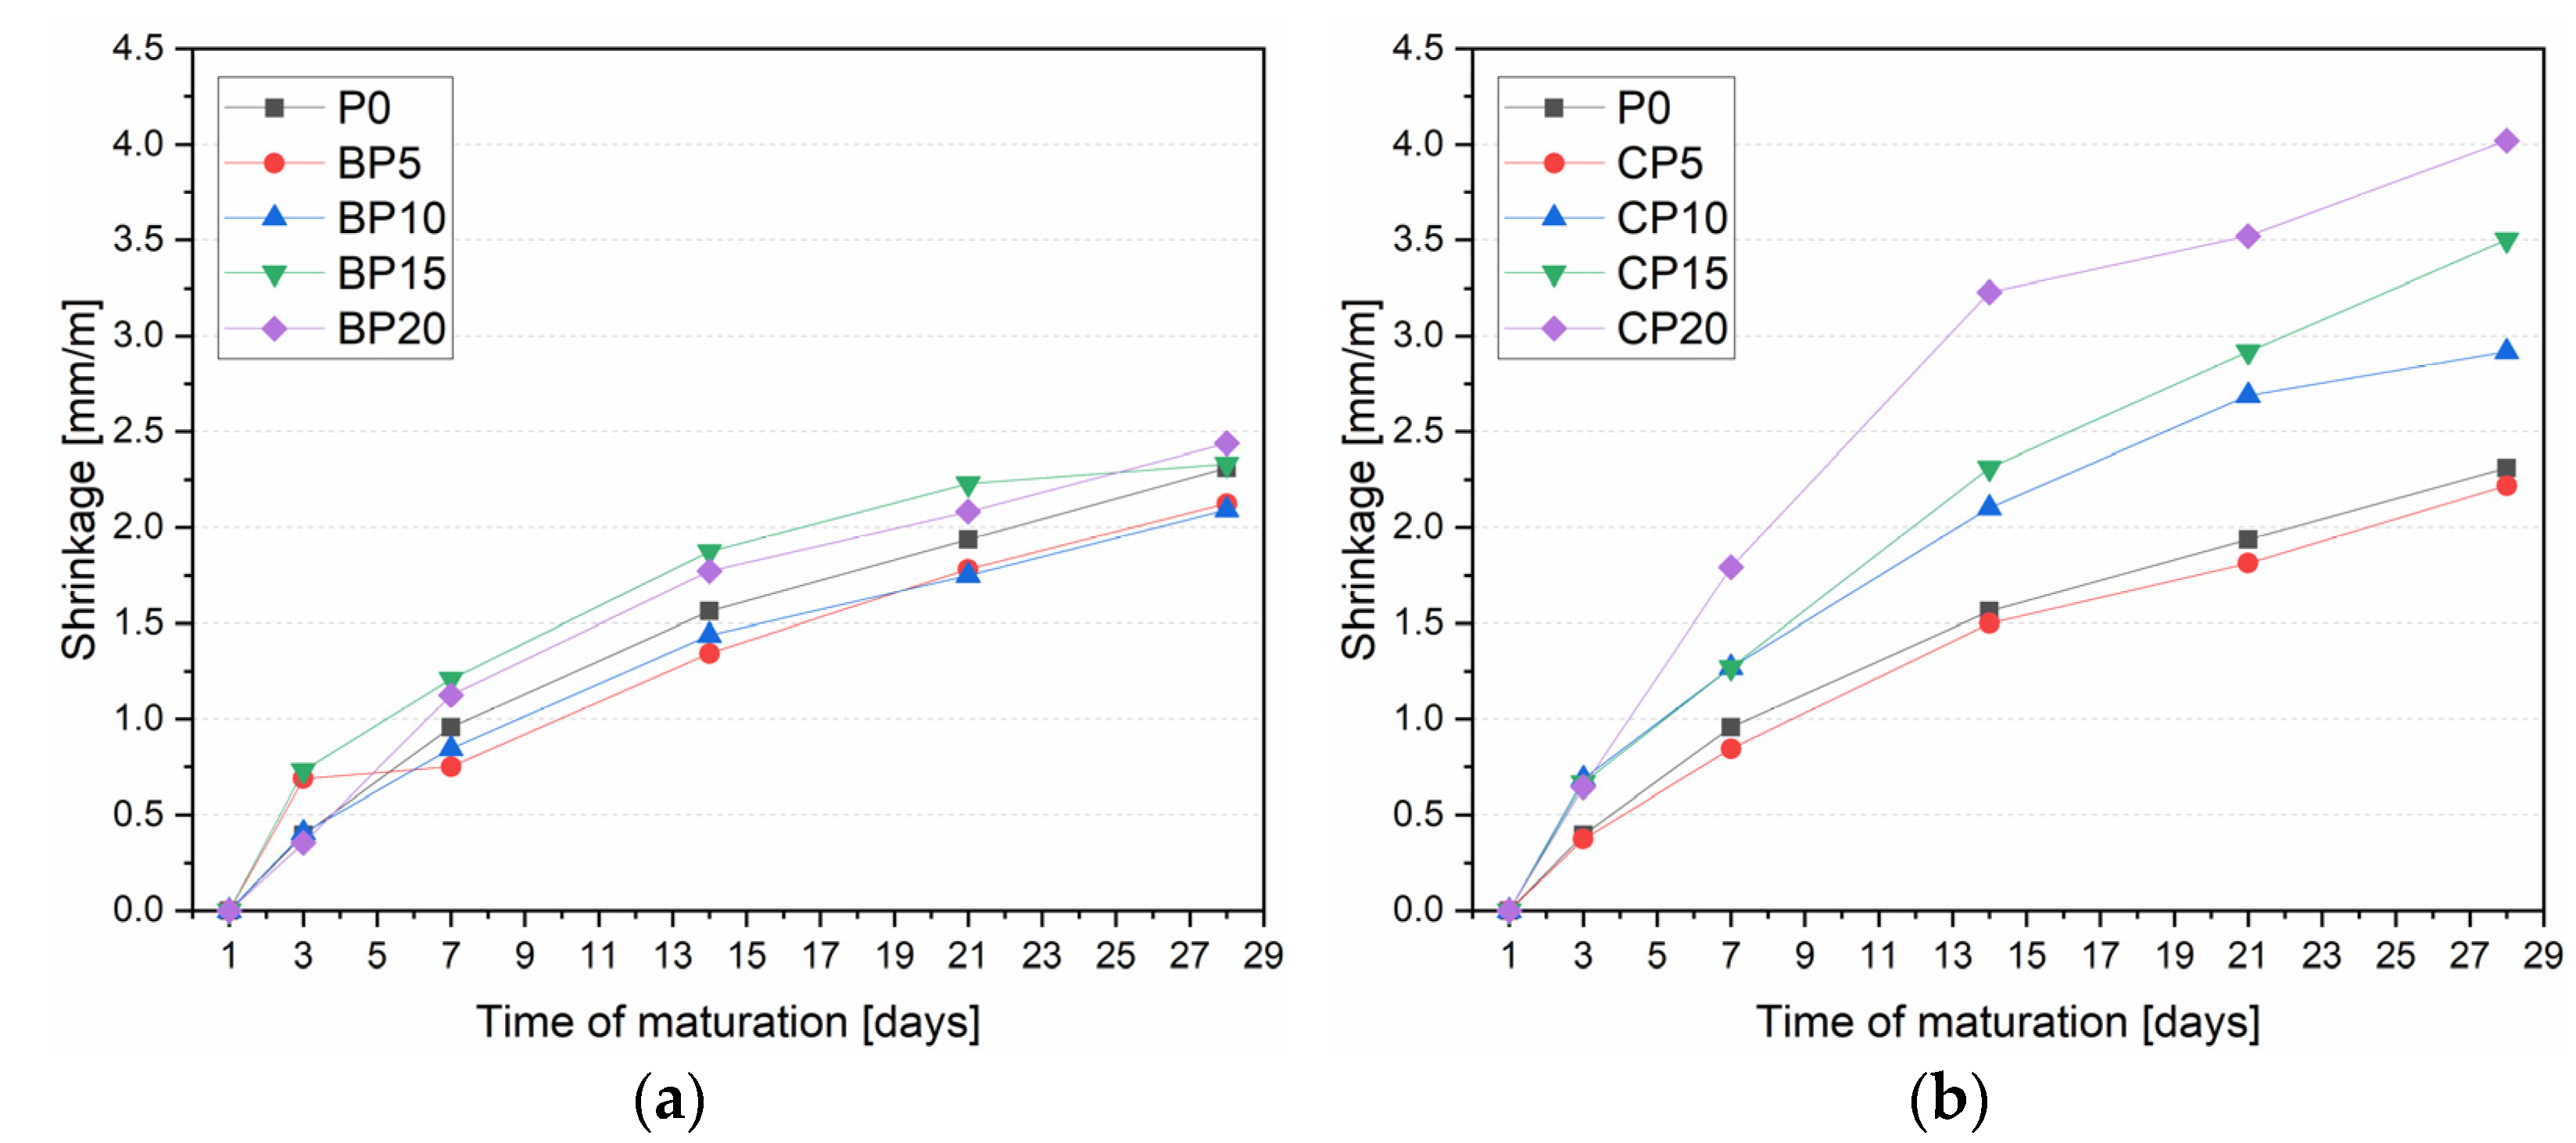
- The CP series was characterized by higher shrinkage strain growth kinetics compared to the BP series. The BP10 series had the lowest shrinkage strain, reaching a shrinkage of 2.094 mm/m after 28 days. On the other hand, the content of BP and CP at 15% and 20% significantly increased the shrinkage strain compared to P0.
- An intelligent modelling approach was applied to predict fc using SVM regression approach. The results show high accuracy of the model (R2 = 0.90), which can be used in practice to predict fc of cement matrix with BP and CP.
Author Contributions
Funding
Institutional Review Board Statement
Informed Consent Statement
Data Availability Statement
Conflicts of Interest
References
- Andrew, R.M. Global CO2 emissions from cement production. Earth Syst. Sci. Data 2018, 10, 195–217. [Google Scholar] [CrossRef] [Green Version]
- Barcelo, L.; Kline, J.; Walenta, G.; Gartner, E. Cement and carbon emissions. Mater. Struct. 2013, 47, 1055–1065. [Google Scholar] [CrossRef]
- Mehta, P. Sustainable cements and concrete for the climate change era—A review. In Proceedings of the Second International Conference on Sustainable Construction Materials and Technologies, Aneona, Italy, 28–30 June 2010. [Google Scholar]
- Medina, C.; Banfill, P.F.G.; De Rojas, M.S.; Frías, M. Rheological and calorimetric behaviour of cements blended with containing ceramic sanitary ware and construction/demolition waste. Constr. Build. Mater. 2013, 2013, 822–831. [Google Scholar] [CrossRef]
- Celik, K.; Meral, C.; Gursel, A.P.; Mehta, P.K.; Horvath, A.; Monteiro, P.J. Mechanical properties, durability, and life-cycle assessment of self-consolidating concrete mixtures made with blended portland cements containing fly ash and limestone powder. Cem. Concr. Compos. 2015, 56, 59–72. [Google Scholar] [CrossRef] [Green Version]
- Miller, S.A.; Moore, F.C. Climate and health damages from global concrete production. Nat. Clim. Change 2020, 10, 439–443. [Google Scholar] [CrossRef]
- Taylor, M.; Tam, C.; Gielen, D. Energy Efficiency and CO2 Emissions from the Global Cement Industry. Korea 2006, 50, 61–67. [Google Scholar]
- Xiao, J.; Li, W.; Fan, Y.; Huang, X. An overview of study on recycled aggregate concrete in China (1996–2011). Constr. Build. Mater. 2012, 31, 364–383. [Google Scholar] [CrossRef]
- Hasanbeigi, A.; Price, L.; Lin, E. Emerging energy-efficiency and CO2 emission-reduction technologies for cement and concrete production: A technical review. Renew. Sustain. Energy Rev. 2012, 16, 6220–6238. [Google Scholar] [CrossRef] [Green Version]
- Medeiros, R.A. Impact of climate change on the service life of concrete structures. In Eco-Efficient Repair and Rehabilitation of Concrete Infrastructures; Elsevier: Amsterdam, The Netherlands, 2018; pp. 43–68. [Google Scholar]
- Stewart, M.G.; Wang, X.; Nguyen, M.N. Climate change impact and risks of concrete infrastructure deterioration. Eng. Struct. 2011, 33, 1326–1337. [Google Scholar] [CrossRef]
- Miller, S.A.; Horvath, A.; Monteiro, P.J. Readily implementable techniques can cut annual CO2 emissions from the production of concrete by over 20%. Environ. Res. Lett. 2016, 11, 074029. [Google Scholar] [CrossRef] [Green Version]
- Habert, G.; Roussel, N. Study of two concrete mix-design strategies to reach carbon mitigation objectives. Cem. Concr. Compos. 2009, 31, 397–402. [Google Scholar] [CrossRef]
- Robayo-Salazar, R.A.; Rivera, J.F.; de Gutiérrez, R.M. Alkali-activated building materials made with recycled construction and demolition wastes. Constr. Build. Mater. 2017, 149, 130–138. [Google Scholar] [CrossRef]
- Wu, Z.; Ann, T.W.; Shen, L.; Liu, G. Quantifying construction and demolition waste: An analytical review. Waste Manag. 2014, 34, 1683–1692. [Google Scholar] [CrossRef]
- Malešev, M.; Radonjanin, V.; Marinković, S. Recycled Concrete as Aggregate for Structural Concrete Production. Sustainability 2010, 2, 1204–1225. [Google Scholar] [CrossRef] [Green Version]
- Rasheeduzzafar, K.A. Recycled Concrete-A Source for New Aggregate. Cem. Concr. Aggreg. 1984, 6, 17–27. [Google Scholar]
- Liu, Q.; Li, B.; Xiao, J.; Singh, A. Utilization potential of aerated concrete block powder and clay brick powder from C&D waste. Constr. Build. Mater. 2020, 238, 117721. [Google Scholar]
- Letelier, V.; Ortega, J.M.; Muñoz, P.; Tarela, E.; Moriconi, G. Influence of Waste Brick Powder in the Mechanical Properties of Recycled Aggregate Concrete. Sustainability 2018, 10, 1037. [Google Scholar] [CrossRef] [Green Version]
- Ge, Z.; Gao, Z.; Sun, R.; Zheng, L. Mix design of concrete with recycled clay-brick-powder using the orthogonal design method. Constr. Build. Mater. 2012, 31, 289–293. [Google Scholar] [CrossRef]
- Arif, R.; Khitab, A.; Kırgız, M.S.; Khan, R.B.N.; Tayyab, S.; Khan, R.A.; Anwar, W.; Arshad, M.T. Experimental analysis on partial replacement of cement with brick powder in concrete. Case Stud. Constr. Mater. 2021, 15, e00749. [Google Scholar] [CrossRef]
- Naceri, A.; Hamina, M.C. Use of waste brick as a partial replacement of cement in mortar. Waste Manag. 2009, 29, 2378–2384. [Google Scholar] [CrossRef]
- Lin, K.L.; Wu, H.H.; Shie, J.L.; Hwang, C.L.; Cheng, A. Recycling waste brick from construction and demolition of buildings as pozzolanic materials. Waste Manag. Res. 2010, 28, 653–659. [Google Scholar] [CrossRef] [PubMed]
- Ma, Z.; Tang, Q.; Wu, H.; Xu, J.; Liang, C. Mechanical properties and water absorption of cement composites with various fineness and contents of waste brick powder from C&D waste. Cem. Concr. Compos. 2020, 114, 103758. [Google Scholar]
- Xue, C.; Qiao, H.; Cao, H.; Feng, Q.; Li, Q. Analysis on the Strength of Cement Mortar Mixed with Construction Waste Brick Powder. Adv. Civ. Eng. 2021, 2021, 8871280. [Google Scholar] [CrossRef]
- Mansoor, S.S.; Hama, S.M.; Hamdullah, D.N. Effectiveness of replacing cement partially with waste brick powder in mortar. J. King Saud Univ. 2022, in press. [Google Scholar] [CrossRef]
- Darshita, T.; Anoop, P. Study of Strength and Workability of Different Grades of Concrete by Partial Replacement of Fine Aggregate by Crushed Brick and Recycled Glass Powder. Int. J. Sci. Res. 2014, 3, 1–5. [Google Scholar]
- Aliabdo, A.A.; Abd-Elmoaty, A.E.M.; Hassan, H.H. Utilization of crushed clay brick in concrete industry. Alex. Eng. J. 2014, 53, 151–168. [Google Scholar] [CrossRef] [Green Version]
- Abdullah, D.J.; Abbas, Z.K.; Abed, S.K. Some Properties of Concrete Containing Waste Brick As Partial Replacement Of Coarse Aggregate And Addition Of Nano Brick Powder. IOP Conf. Ser. Earth Environ. Sci. 2022, 961, 012093. [Google Scholar] [CrossRef]
- Liu, X.; Zhang, N. Utilization of red mud in cement production: A review. Waste Manag. Res. 2011, 29, 1053–1063. [Google Scholar] [CrossRef]
- Akinwekomi, A.D.; Omotoyinbo, J.A.; Folorunso, D. Effect of High Alumina Cement on Selected Foundry Properties of Ant-Hill Clay. Leonardo Electron. J. Pract. Technol. 2012, 1, 37–46. [Google Scholar]
- PN, M.L.; Peter, C.; Mohan, K.; Greens, S.; George, S. Energy efficient production of clay bricks using industrial waste. Heliyon 2018, 4, e00891. [Google Scholar]
- Zieliński, K.; Kierzek, D. The Impact of Alumina Cement on Properties of Portland Cement Slurries and Mortars. Int. J. Struct. Constr. Eng. 2021, 15, 323–326. [Google Scholar]
- Shao, J.; Gao, J.; Zhao, Y.; Chen, X. Study on the pozzolanic reaction of clay brick powder in blended cement pastes. Constr. Build. Mater. 2019, 213, 209–215. [Google Scholar] [CrossRef]
- Liu, S.; Dai, R.; Cao, K.; Gao, Z. The Role of Sintered Clay Brick Powder During the Hydration Process of Cement Pastes. Iran. J. Sci. Technol. Trans. Civ. Eng. 2017, 41, 159–165. [Google Scholar] [CrossRef]
- Aye, T.; Oguchi, C.T.; Takaya, Y. Evaluation of sulfate resistance of Portland and high alumina cement mortars using hardness test. Constr. Build. Mater. 2010, 24, 1020–1026. [Google Scholar] [CrossRef]
- Vejmelková, E.; Koňáková, D.; Scheinherrová, L.; Doleželová, M.; Keppert, M.; Černý, R. High temperature durability of fiber reinforced high alumina cement composites. Constr. Build. Mater. 2018, 162, 881–891. [Google Scholar] [CrossRef]
- Castillo, M.; Hernández, K.; Rodriguez, J.; Eyzaguirre, C. Low Permeability Concrete for Buildings Located in Marine Atmosphere Zone using Clay Brick Powder. IOP Conf. Ser. Mater. Sci. Eng. 2019, 758, 012093. [Google Scholar] [CrossRef]
- Rani, M.U.; Jenifer, J.M. Mechanical Properties of Concrete with Partial replacement of Portland Cement by Clay brick powder. Int. J. Eng. Res. Technol. 2016, 5, 2278–0181. [Google Scholar]
- Zhu, P.; Mao, X.; Qu, W.; Li, Z.; Ma, Z.J. Investigation of using recycled powder from waste of clay bricks and cement solids in reactive powder concrete. Constr. Build. Mater. 2016, 113, 246–254. [Google Scholar] [CrossRef]
- Chaabene, W.B.; Flah, M.; Nehdi, M.L. Machine learning prediction of mechanical properties of concrete: Critical review. Constr. Build. Mater. 2020, 260, 119889. [Google Scholar] [CrossRef]
- Czarnecki, S.; Shariq, M.; Nikoo, M.; Sadowski, Ł. An intelligent model for the prediction of the compressive strength of cementitious composites with ground granulated blast furnace slag based on ultrasonic pulse velocity measurements. Measurement 2021, 172, 108951. [Google Scholar] [CrossRef]
- Czarnecki, S.; Sadowski, Ł.; Hoła, J. Artificial neural networks for non-destructive identification of the interlayer bonding between repair overlay and concrete substrate. Adv. Eng. Softw. 2020, 141, 102769. [Google Scholar] [CrossRef]
- Szeląg, M. Intelligent prediction modeling of the post-heating mechanical performance of the brick powder modified cement paste based on the cracking patterns properties. Case Stud. Constr. Mater. 2021, 15, e00668. [Google Scholar] [CrossRef]
- Chen, B.T.; Chang, T.P.; Shih, J.Y.; Wang, J.J. Estimation of exposed temperature for fire-damaged concrete using support vector machine. Comput. Mater. Sci. 2009, 44, 913–920. [Google Scholar] [CrossRef]
- EN 19601:2016; Methods of Testing Cement-Part 1: Determination of Strength. BSI: London, UK, 2016.
- PN-EN 196-6:2011; Metody badania cementu-Część 6: Oznaczanie stopnia zmielenia. BSI: London, UK, 2011.
- EN 12390-5; Testing Hardened Concrete-Part 5: Flexural Strength of Test Specimens. BSI: London, UK, 2009.
- EN 12390-3; Testing Hardened Concrete-Part 3: Compressive Strength of Test Specimens. BSI: London, UK, 2002.
- PN-EN 1015:10; Metody Badań Zapraw do Murów-Część 10: Określenie Gęstości Wysuszonej Stwardniałej Zaprawy. BSI: London, UK, 2001.
- Brereton, R.G.; Lloyd, G.R. Support Vector Machines for classification and regression. Analyst 2010, 135, 230–267. [Google Scholar] [CrossRef] [PubMed]
- He, Z.H.; Zhu, H.N.; Zhang, M.Y.; Shi, J.Y.; Du, S.G.; Liu, B. Autogenous shrinkage and nano-mechanical properties of UHPC containing waste brick powder derived from construction and demolition waste. Constr. Build. Mater. 2021, 306, 124869. [Google Scholar] [CrossRef]
- Hay, R.; Li, L.; Celik, K. Shrinkage, hydration, and strength development of limestone calcined clay cement (LC3) with different sulfation levels. Cem. Concr. Compos. 2022, 127, 104403. [Google Scholar] [CrossRef]
- Zegardło, B.; Szeląg, M.; Ogrodnik, P. Concrete resistant to spalling made with recycled aggregate from sanitary ceramic wastes–The effect of moisture and porosity on destructive processes occurring in fire conditions. Constr. Build. Mater. 2018, 173, 58–68. [Google Scholar] [CrossRef]
- Ortega, J.M.; Letelier, V.; Solas, C.; Moriconi, G.; Climent, M.Á.; Sánchez, I. Long-term effects of waste brick powder addition in the microstructure and service properties of mortars. Constr. Build. Mater. 2018, 182, 691–702. [Google Scholar] [CrossRef] [Green Version]
- Szeląg, M.; Styczeń, J.; Fediuk, R.; Polak, R. Properties and Strength Prediction Modeling of Green Mortar with Brick Powder Subjected to a Short-Term Thermal Shock at Elevated Temperatures. Materials 2021, 14, 6331. [Google Scholar] [CrossRef]
- Fediuk, R.; Yushin, A. Modern Technologies of Nondestructive Testing of Construction Materials. IOP Conf. Ser. Mater. Sci. Eng. 2016, 132, 012001. [Google Scholar] [CrossRef]


| Content (%) | |||
|---|---|---|---|
| Compound | CEM | BP | CP |
| SiO2 | 17.3 | 59.3 | 56.1 |
| CaO | 67.3 | 2.0 | 1.8 |
| Al2O3 | 3.1 | 14.1 | 14.7 |
| Fe2O3 | 3.5 | 7.6 | 8.6 |
| K2O | - | 3.4 | 3.9 |
| MgO | - | 2.3 | 2.9 |
| SO3 | 4.0 | - | - |
| Others | 1.7 | 1.2 | 1.2 |
| LOI * | 3.1 | 10.1 | 10.8 |
| Series | P0 | CP5 | CP10 | CP15 | CP20 | BP5 | BP10 | BP15 | BP20 |
|---|---|---|---|---|---|---|---|---|---|
| Specific density Ds [kg/m3] | 2.44 | 2.38 | 2.39 | 2.32 | 2.44 | 2.41 | 2.32 | 2.39 | 2.48 |
| Bulk density D [kg/m3] | 1.66 | 1.60 | 1.56 | 1.59 | 1.55 | 1.62 | 1.59 | 1.58 | 1.60 |
| General porosity Po [%] | 32.0 | 32.8 | 34.7 | 31.5 | 36.5 | 32.8 | 31.5 | 33.9 | 35.5 |
| Tightness T [%] | 68.0 | 67.2 | 65.3 | 68.5 | 63.5 | 67.2 | 68.5 | 66.1 | 64.5 |
| Water absorption WA [%] | 23.2 | 25.0 | 25.0 | 25.5 | 27.7 | 24.5 | 25.0 | 25.1 | 24.7 |
| Standard Deviation | |||||||||
|---|---|---|---|---|---|---|---|---|---|
| Series | P0 | BP5 | BP10 | BP15 | BP20 | CP5 | CP10 | CP15 | CP20 |
| [%] | 0.127 | 0.179 | 0.124 | 0.126 | 0.082 | 0.051 | 0.197 | 0.152 | 0.133 |
| Brittleness of BP | ||||
|---|---|---|---|---|
| Series | Reference Sample (R) | Samples Subjected to Thermal Stress (T) | Difference in Relation to P0 | |
| fcf/fc | fcf/fc | (R) | (T) | |
| P0 | 0.055 | 0.066 | - | - |
| BP5 | 0.080 | 0.066 | 44% | 19% |
| BP10 | 0.074 | 0.065 | 34% | 17% |
| BP15 | 0.118 | 0.101 | 114% | 83% |
| BP20 | 0.162 | 0.087 | 193% | 57% |
| Brittleness of CP | ||||
|---|---|---|---|---|
| Series | Reference Sample (R) | Samples Subjected to Thermal Stress (T) | Difference in Relations to P0 | |
| fcf/fc | fcf/fc | (R) | (T) | |
| P0 | 0.055 | 0.066 | - | - |
| P5 | 0.080 | 0.063 | 44% | 15% |
| P10 | 0.068 | 0.067 | 22% | 21% |
| P15 | 0.053 | 0.070 | −3% | 27% |
| P20 | 0.119 | 0.082 | 116% | 47% |
Publisher’s Note: MDPI stays neutral with regard to jurisdictional claims in published maps and institutional affiliations. |
© 2022 by the authors. Licensee MDPI, Basel, Switzerland. This article is an open access article distributed under the terms and conditions of the Creative Commons Attribution (CC BY) license (https://creativecommons.org/licenses/by/4.0/).
Share and Cite
Rumiński, P.; Szeląg, M.; Matos, P.d. Evaluating the Feasibility of Using Brick Powder and Clay Powder in Cement Replacement. Materials 2022, 15, 8127. https://doi.org/10.3390/ma15228127
Rumiński P, Szeląg M, Matos Pd. Evaluating the Feasibility of Using Brick Powder and Clay Powder in Cement Replacement. Materials. 2022; 15(22):8127. https://doi.org/10.3390/ma15228127
Chicago/Turabian StyleRumiński, Patryk, Maciej Szeląg, and Paulo de Matos. 2022. "Evaluating the Feasibility of Using Brick Powder and Clay Powder in Cement Replacement" Materials 15, no. 22: 8127. https://doi.org/10.3390/ma15228127