
Predicting the Mechanical Properties of RCA-Based Concrete Using Supervised Machine Learning Algorithms

 , , , , and
Abstract
:1. Introduction
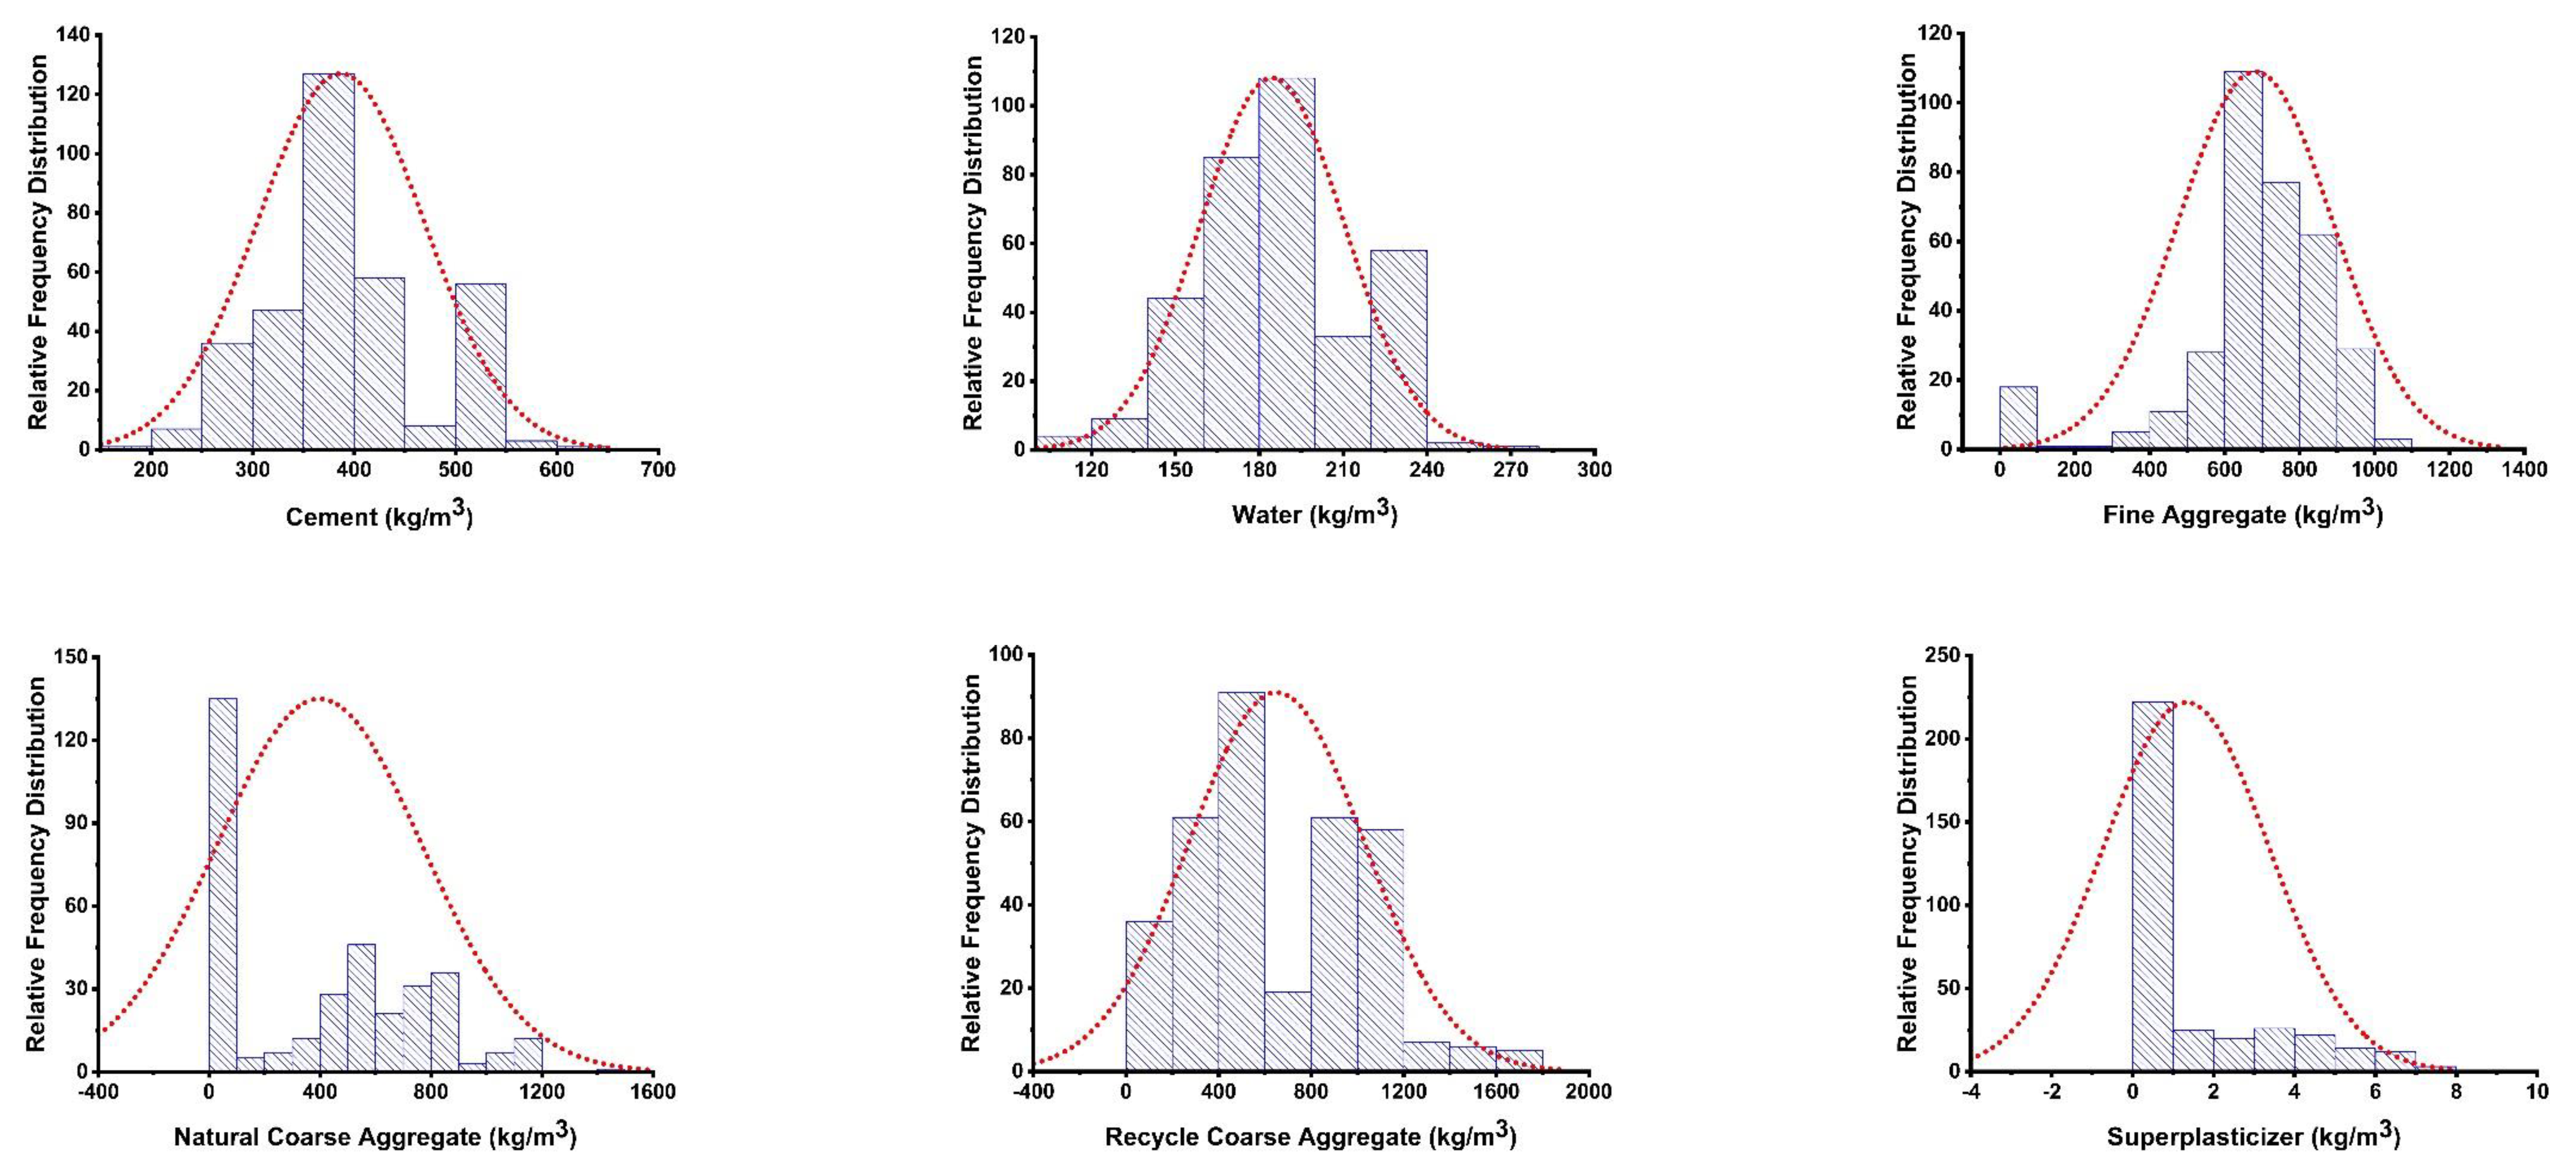
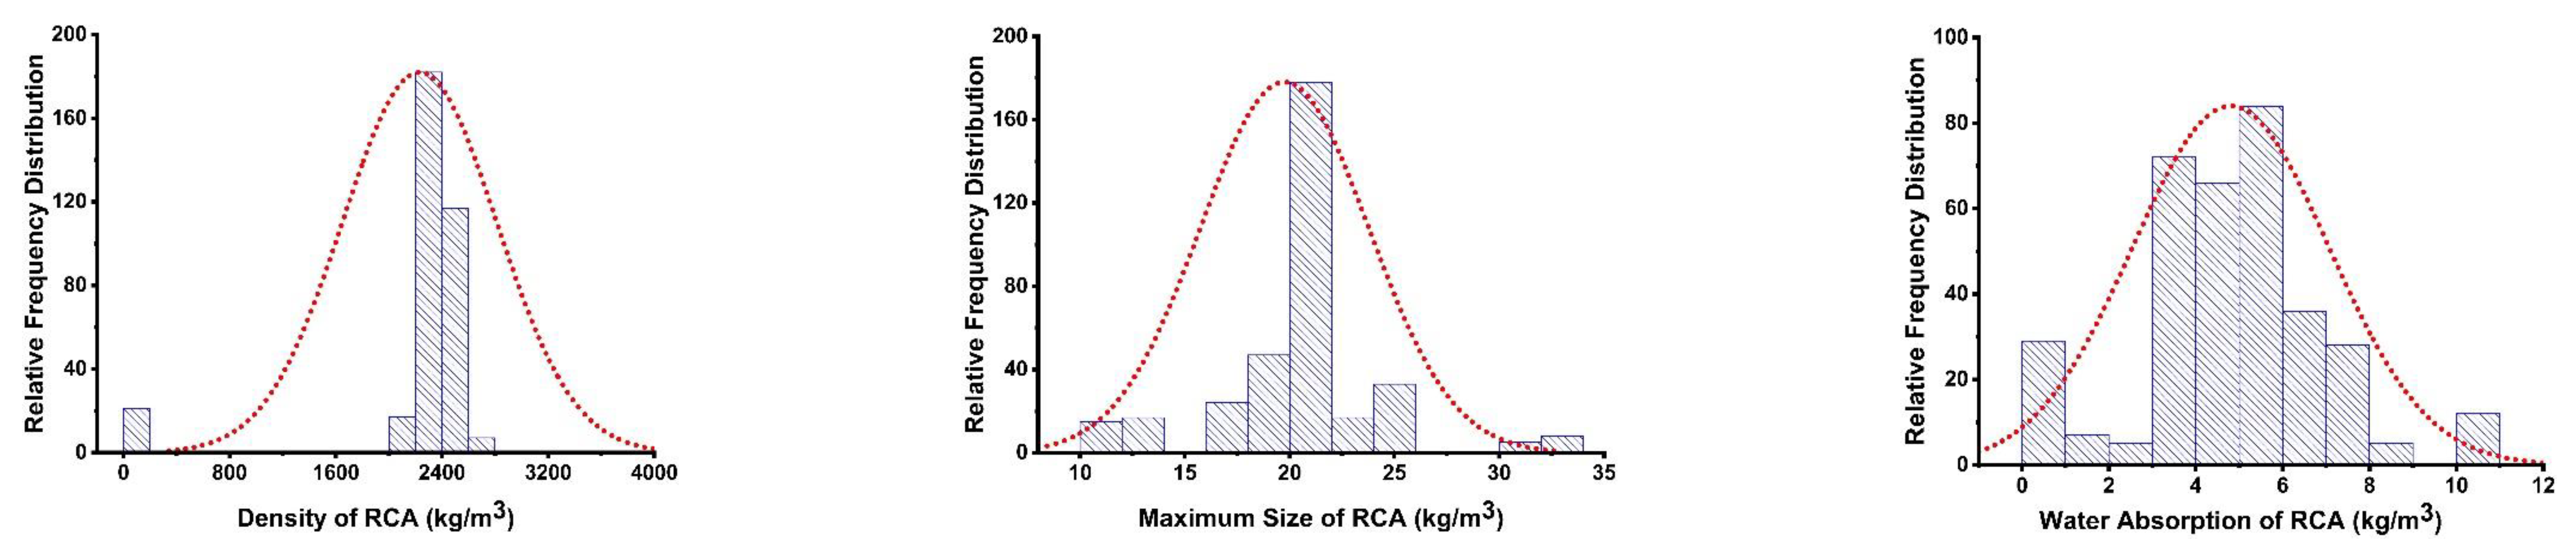
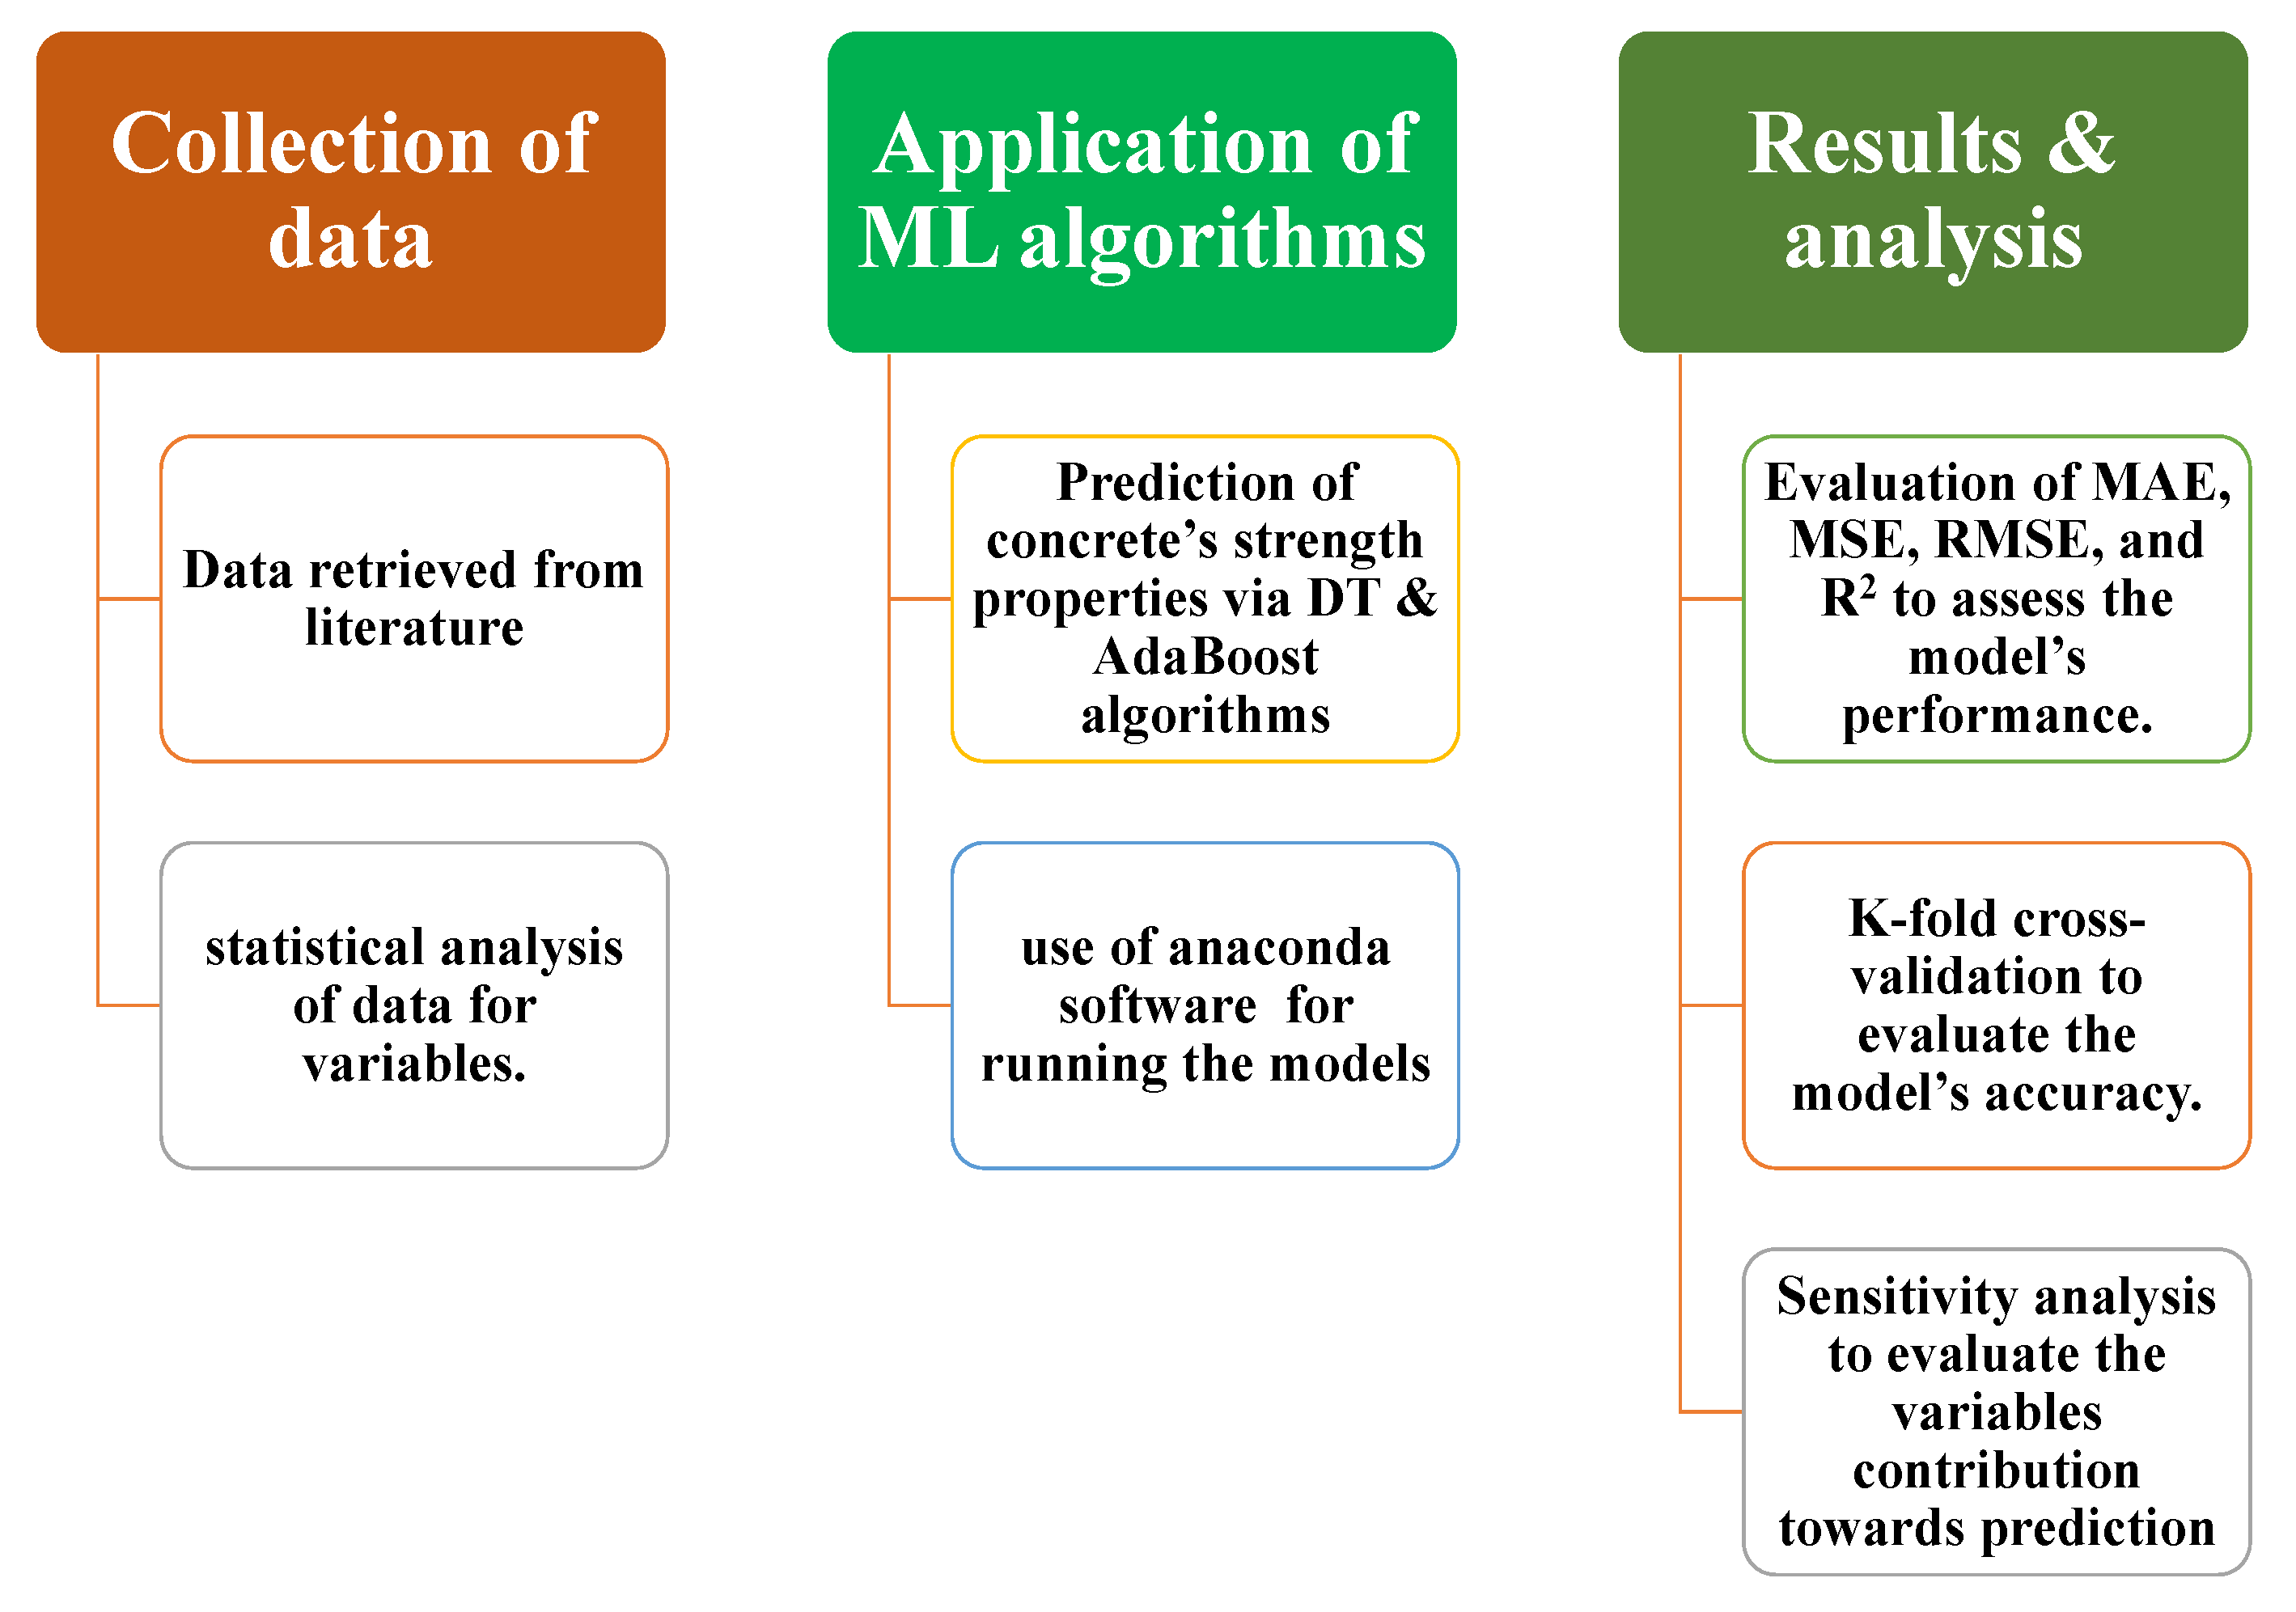
2. Methodology and Description of Data
3. Supervised Machine Learning Algorithms
3.1. Decision Tree Algorithm
3.2. AdaBoost Algorithm
4. Result and Their Analyses
4.1. Statistical Analysis
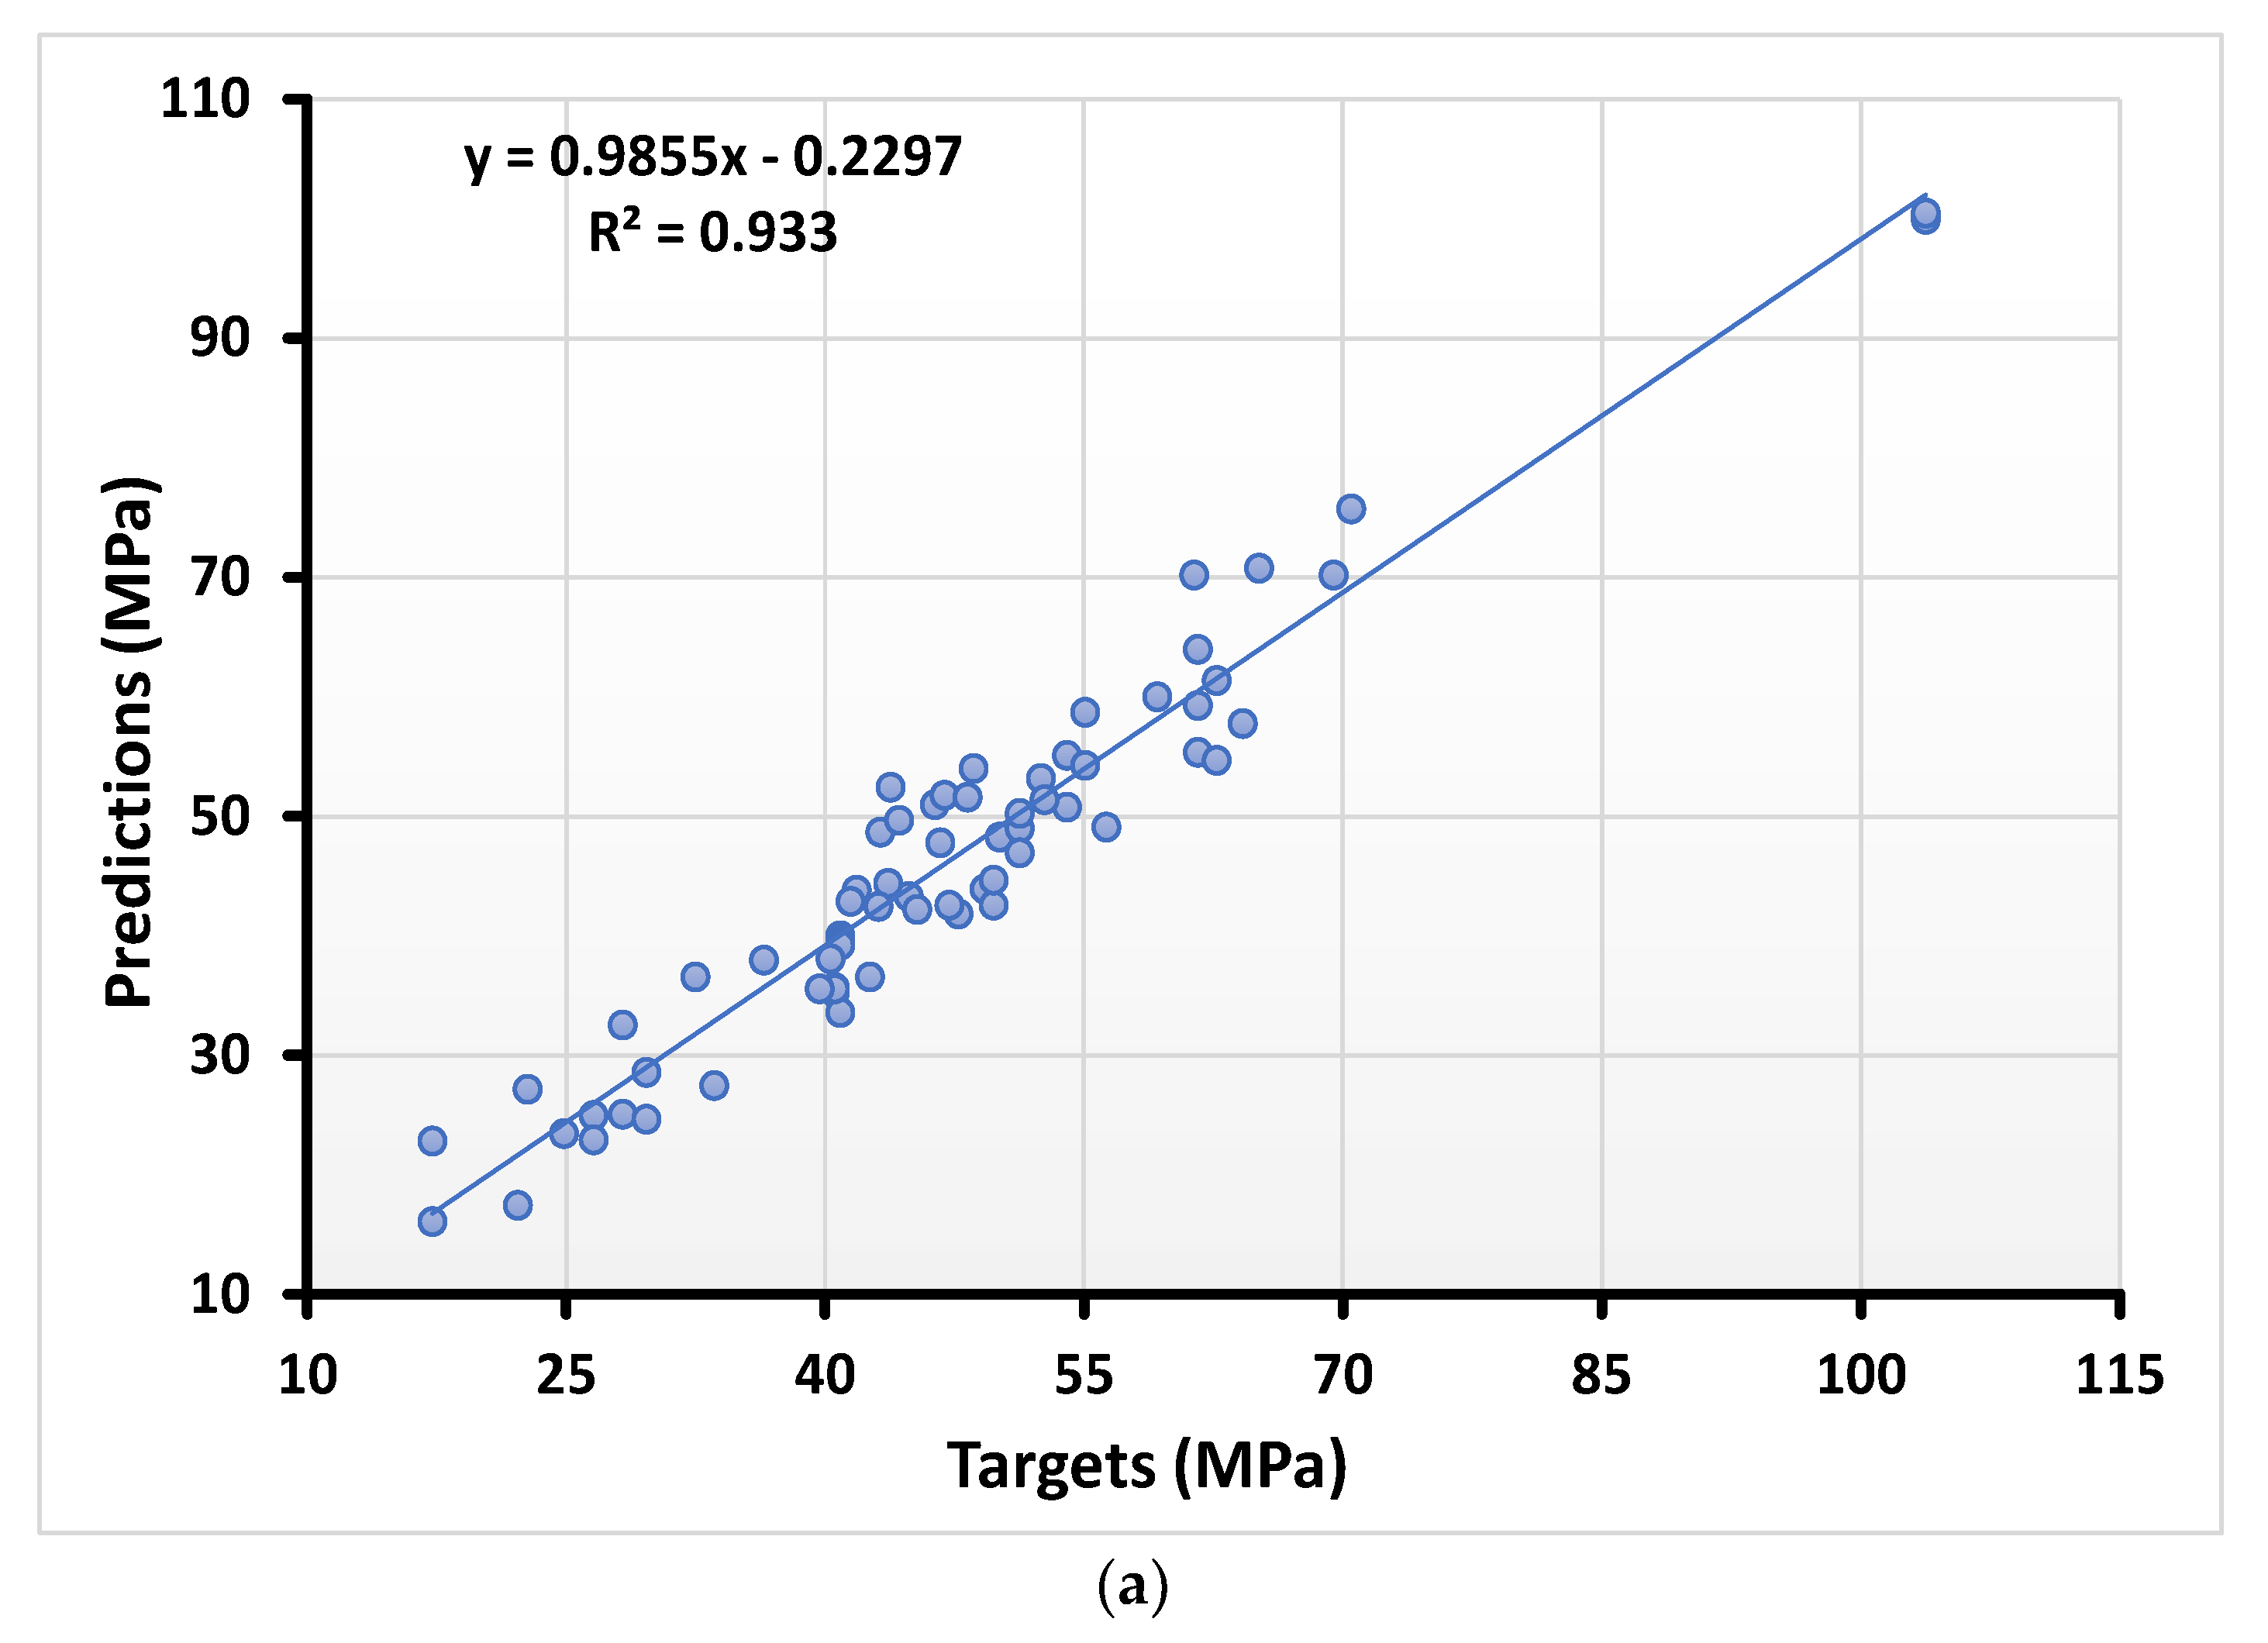
4.1.1. Compressive Strength Result Using Decision Tree
4.1.2. Splitting Tensile Strength Result Using Decision Tree
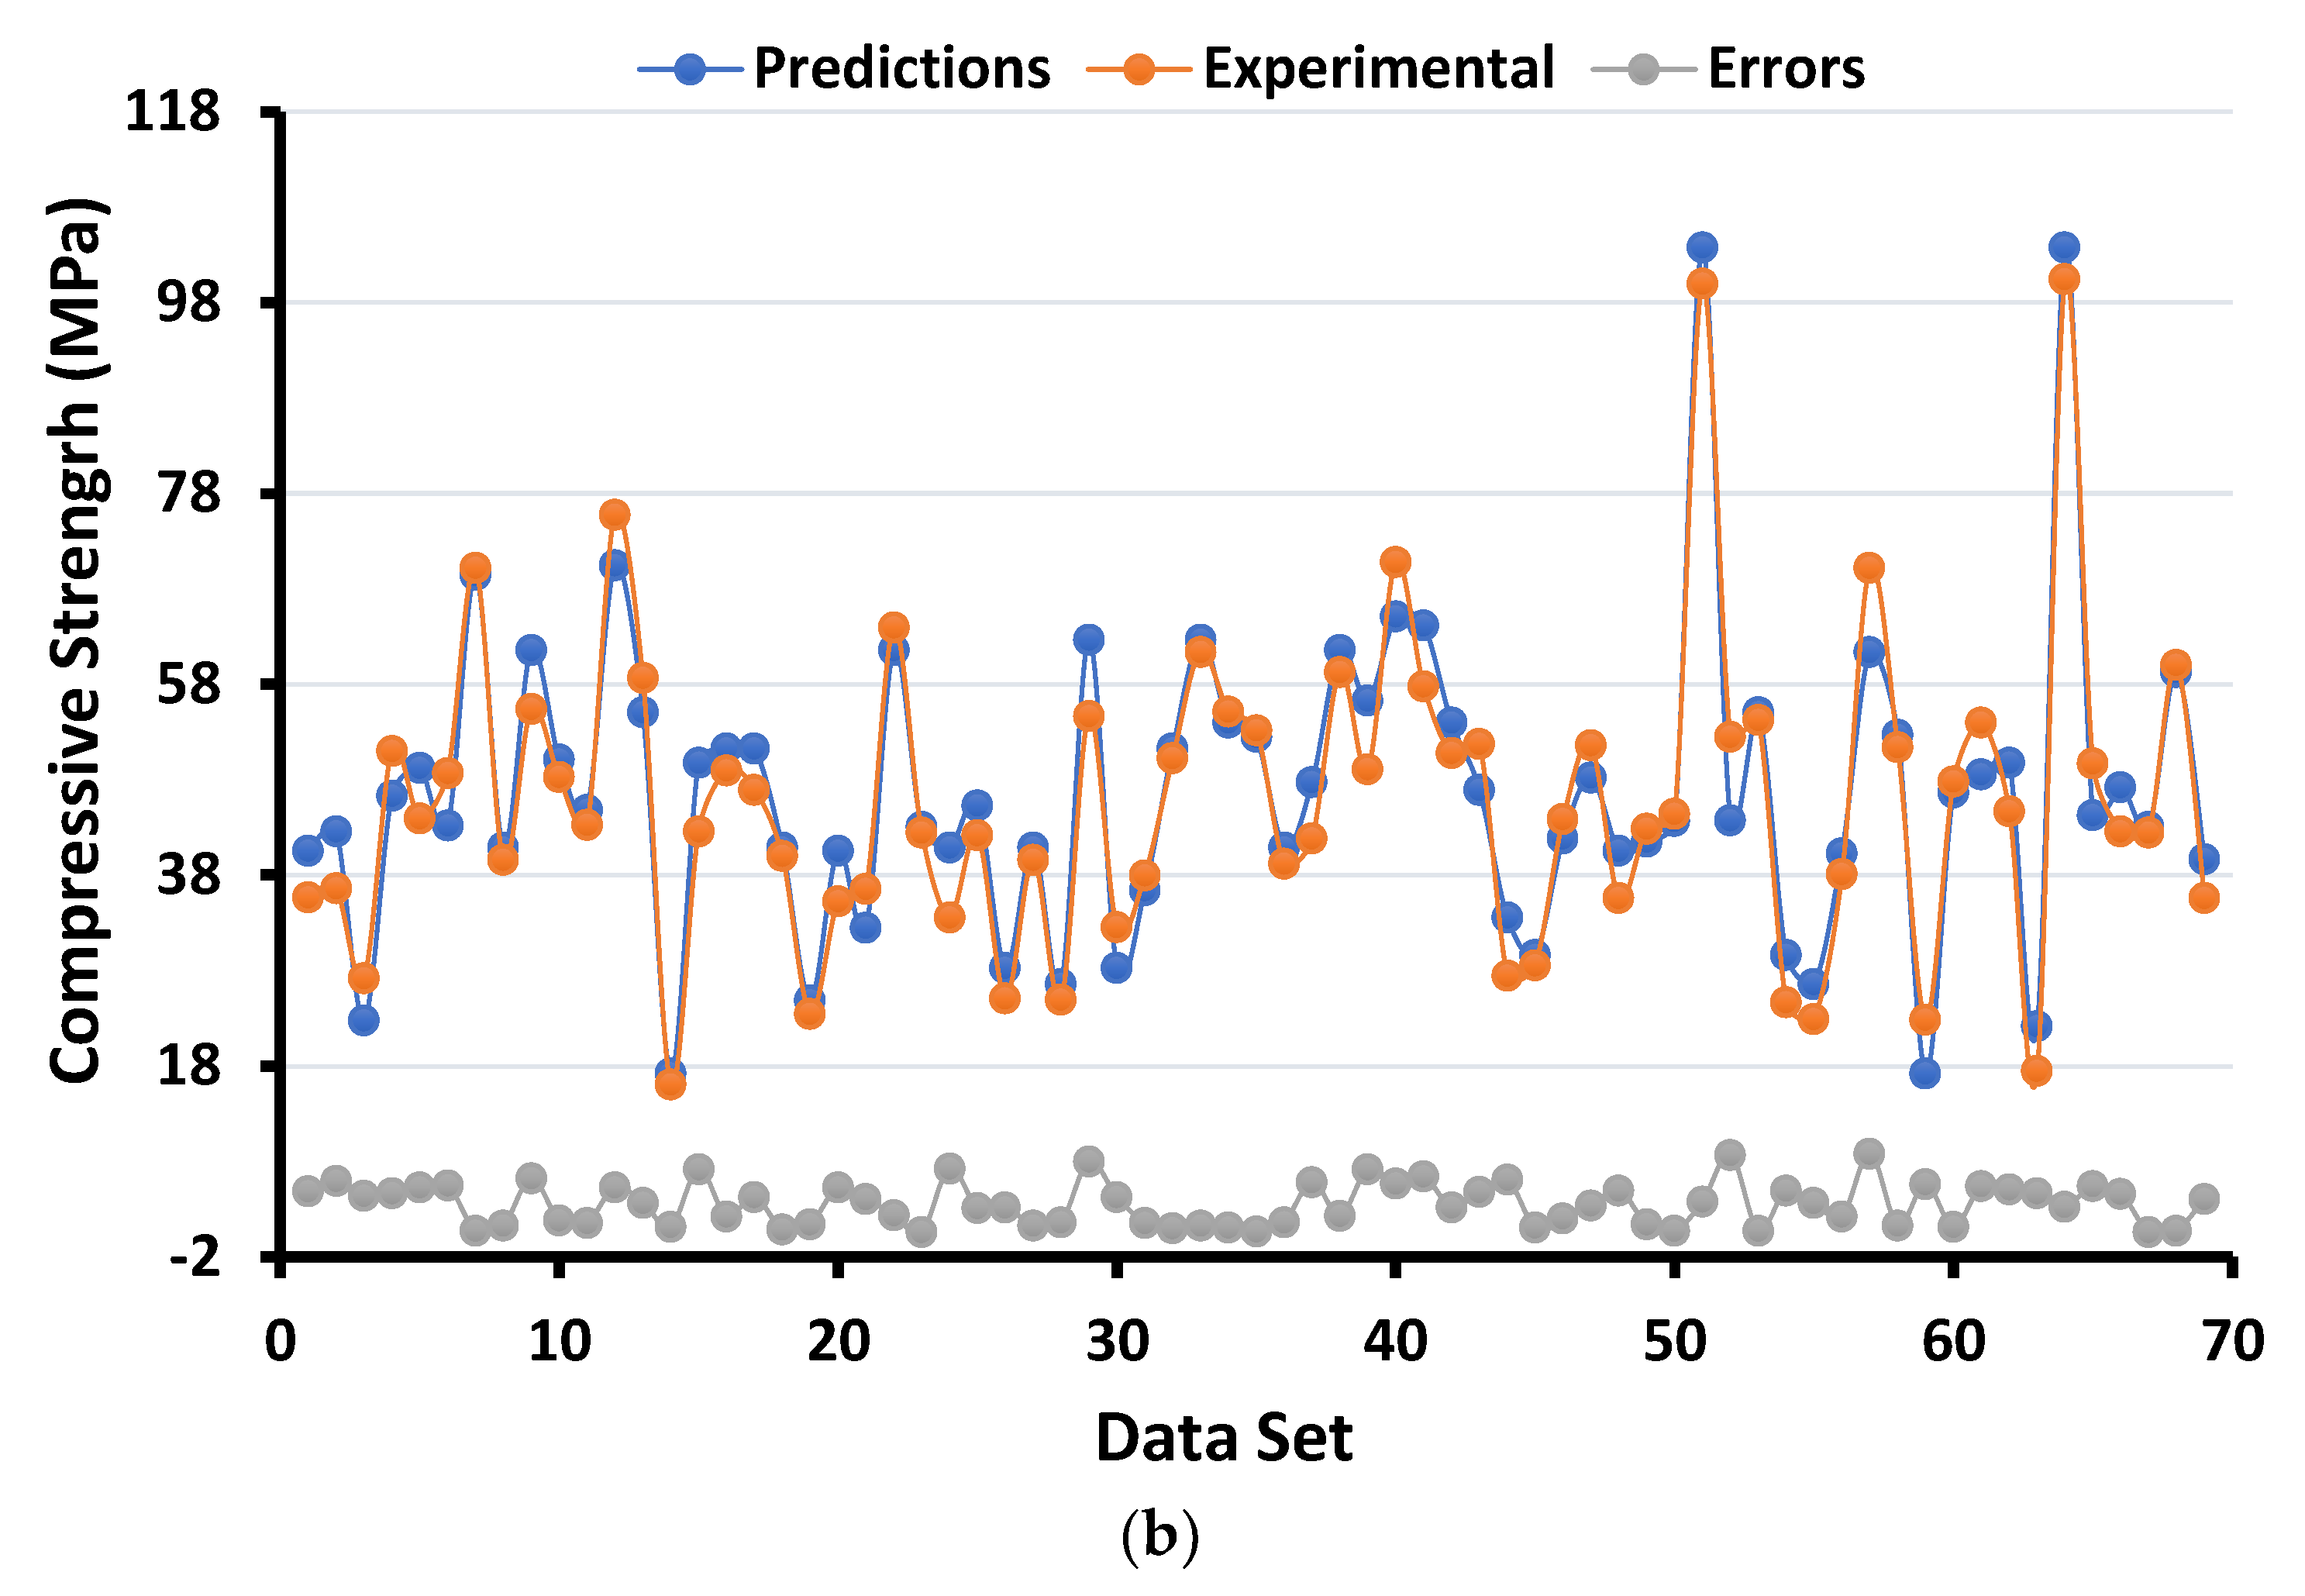
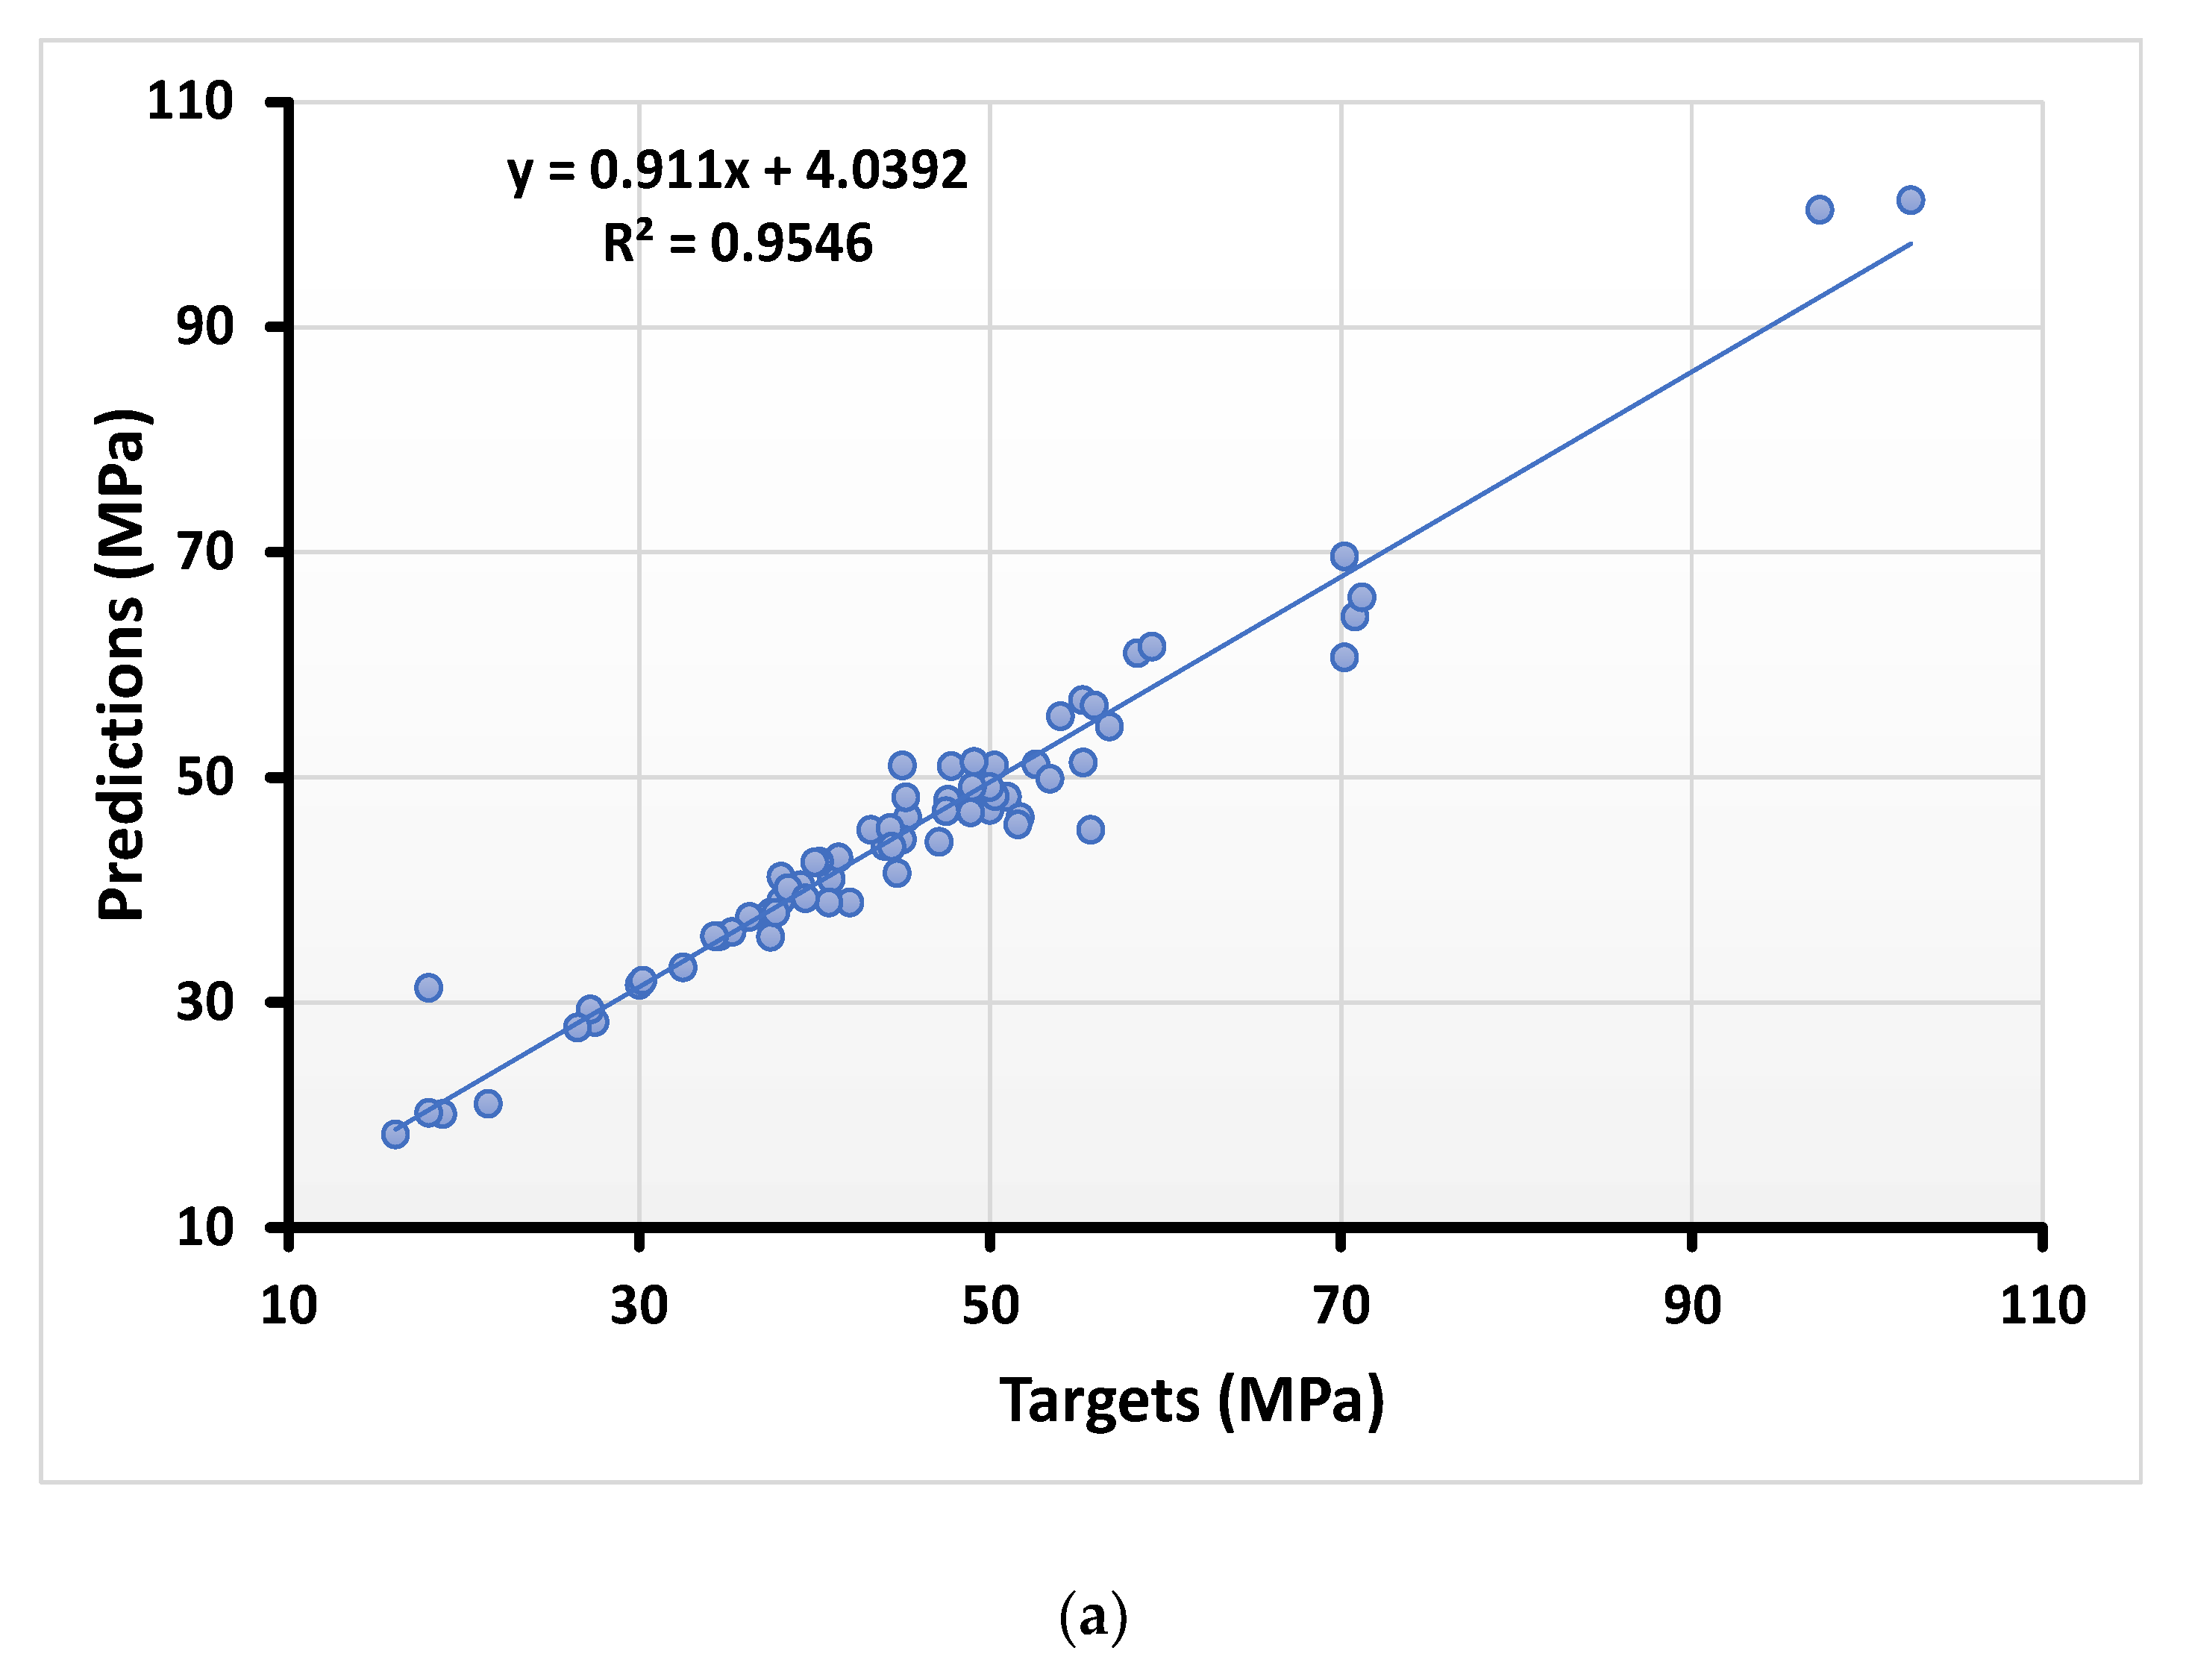
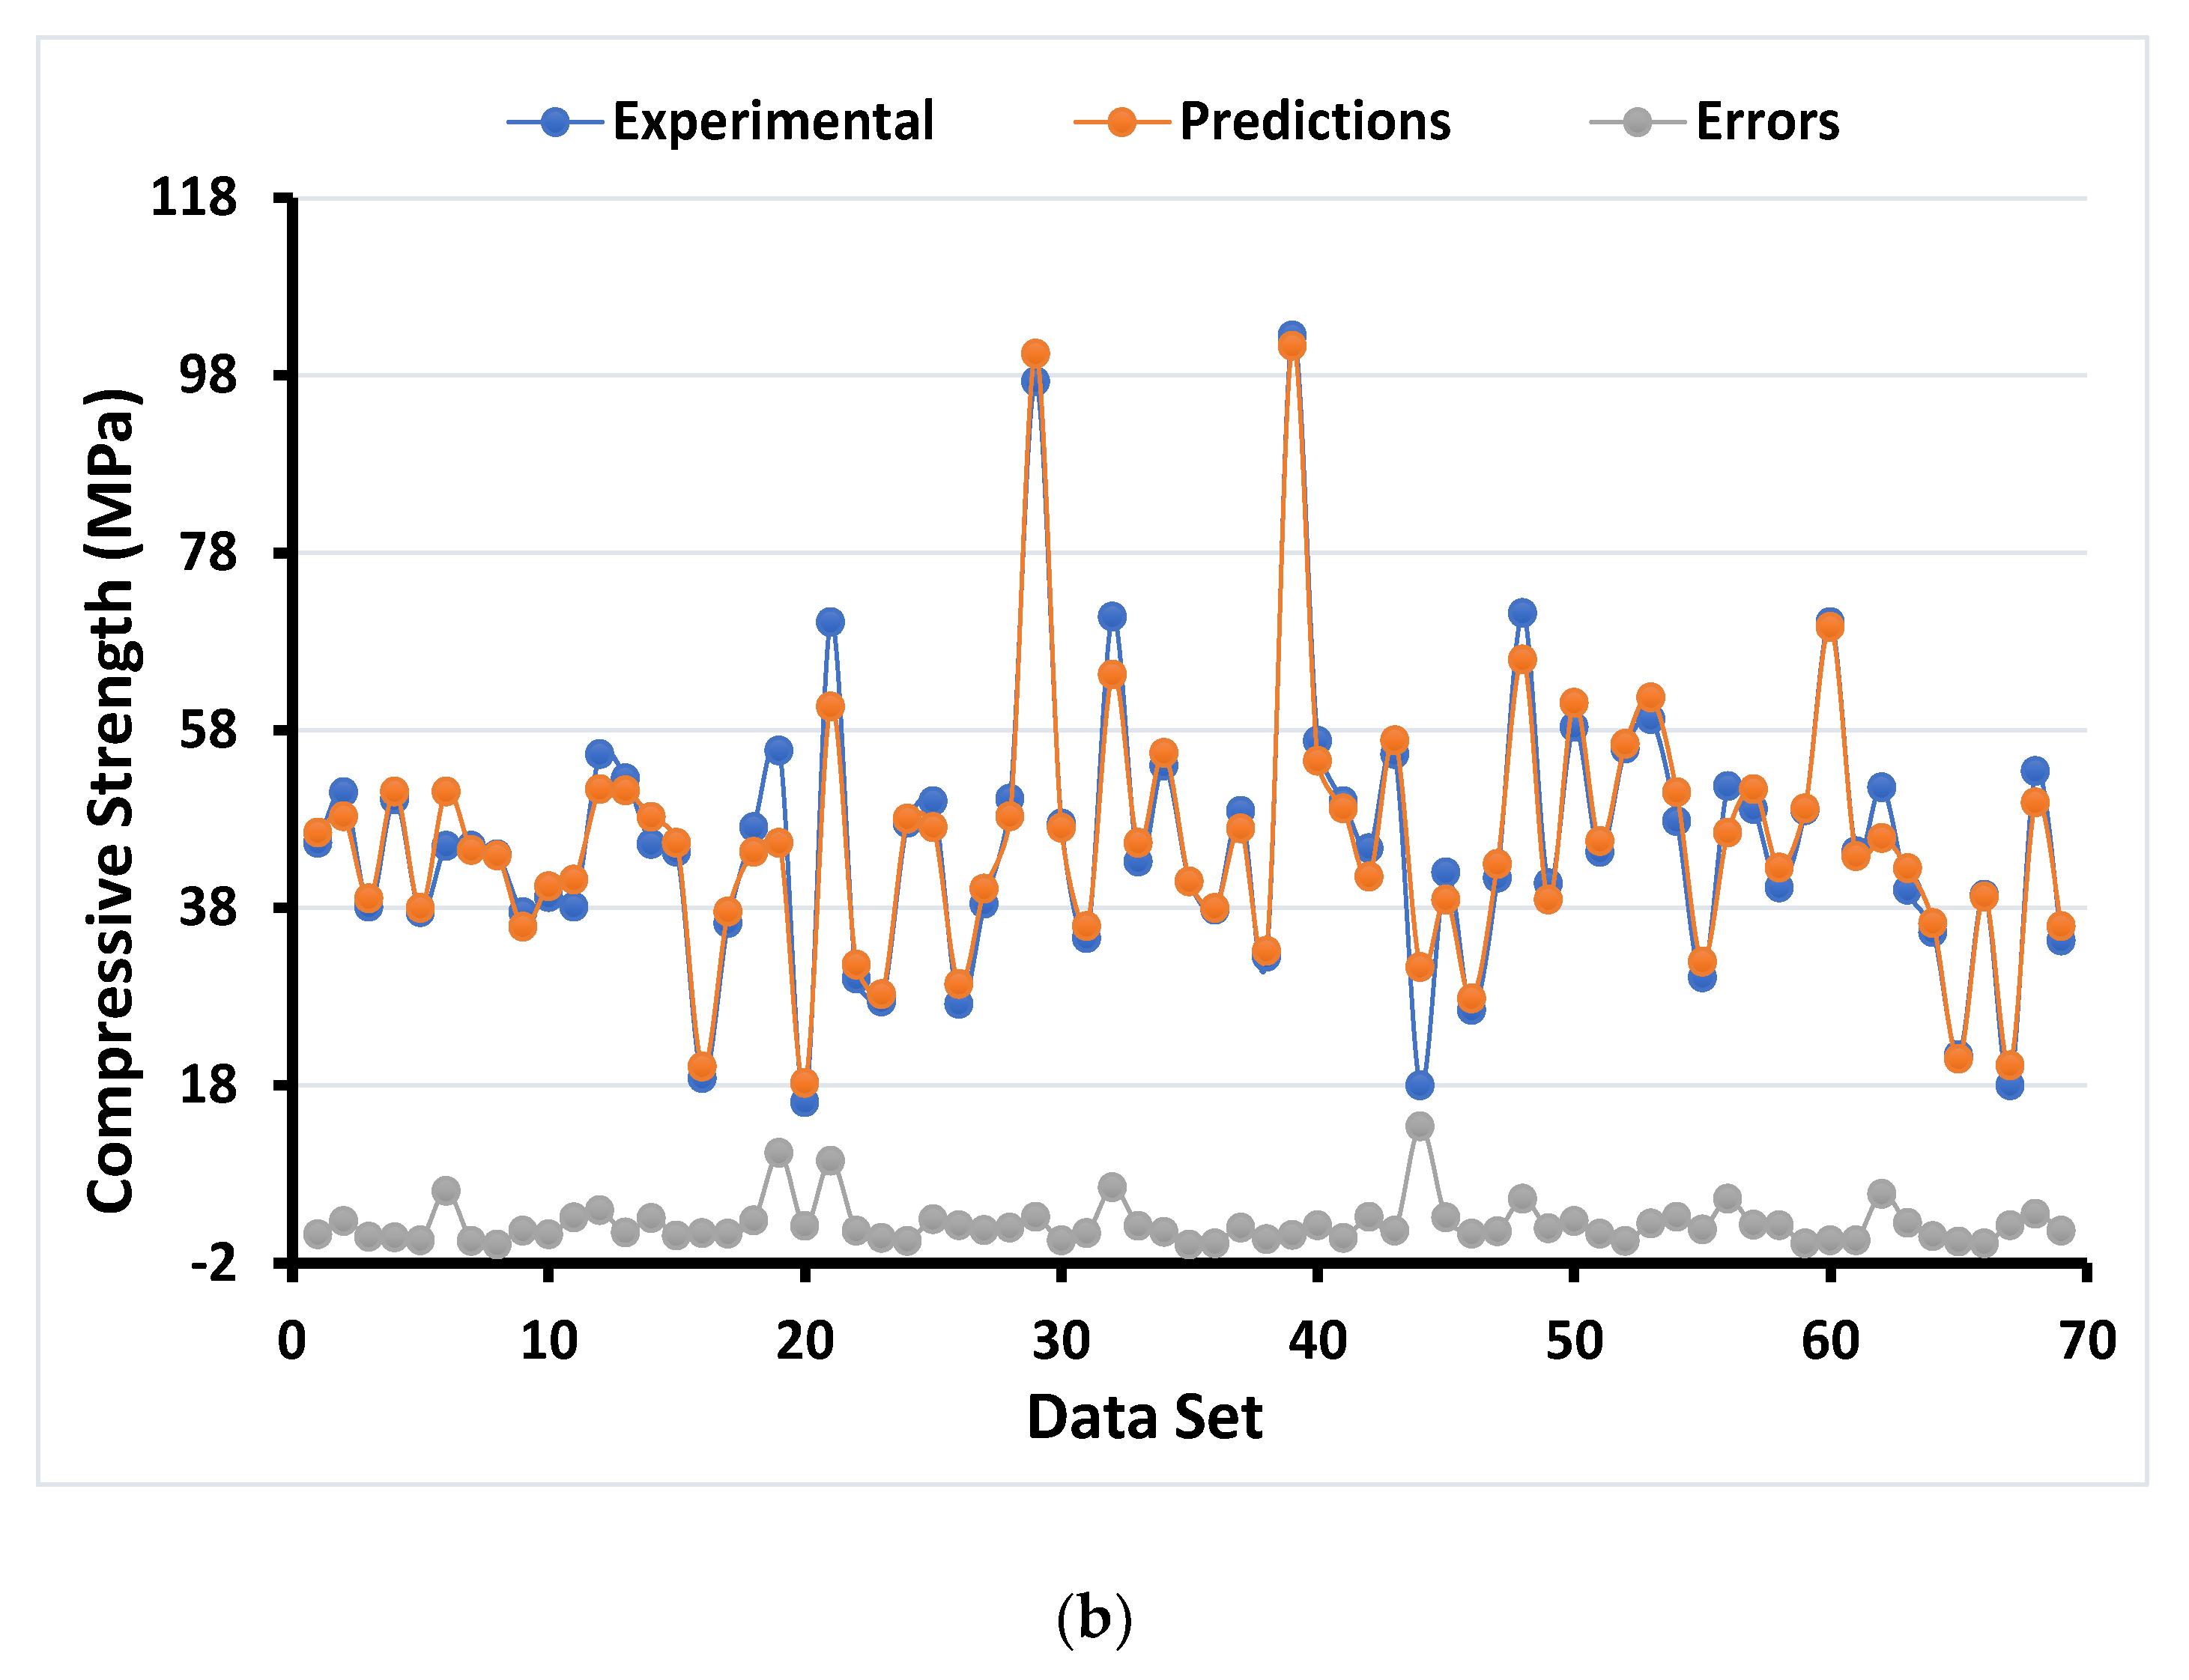
4.1.3. Compressive Strength Result with AdaBoost Regressor
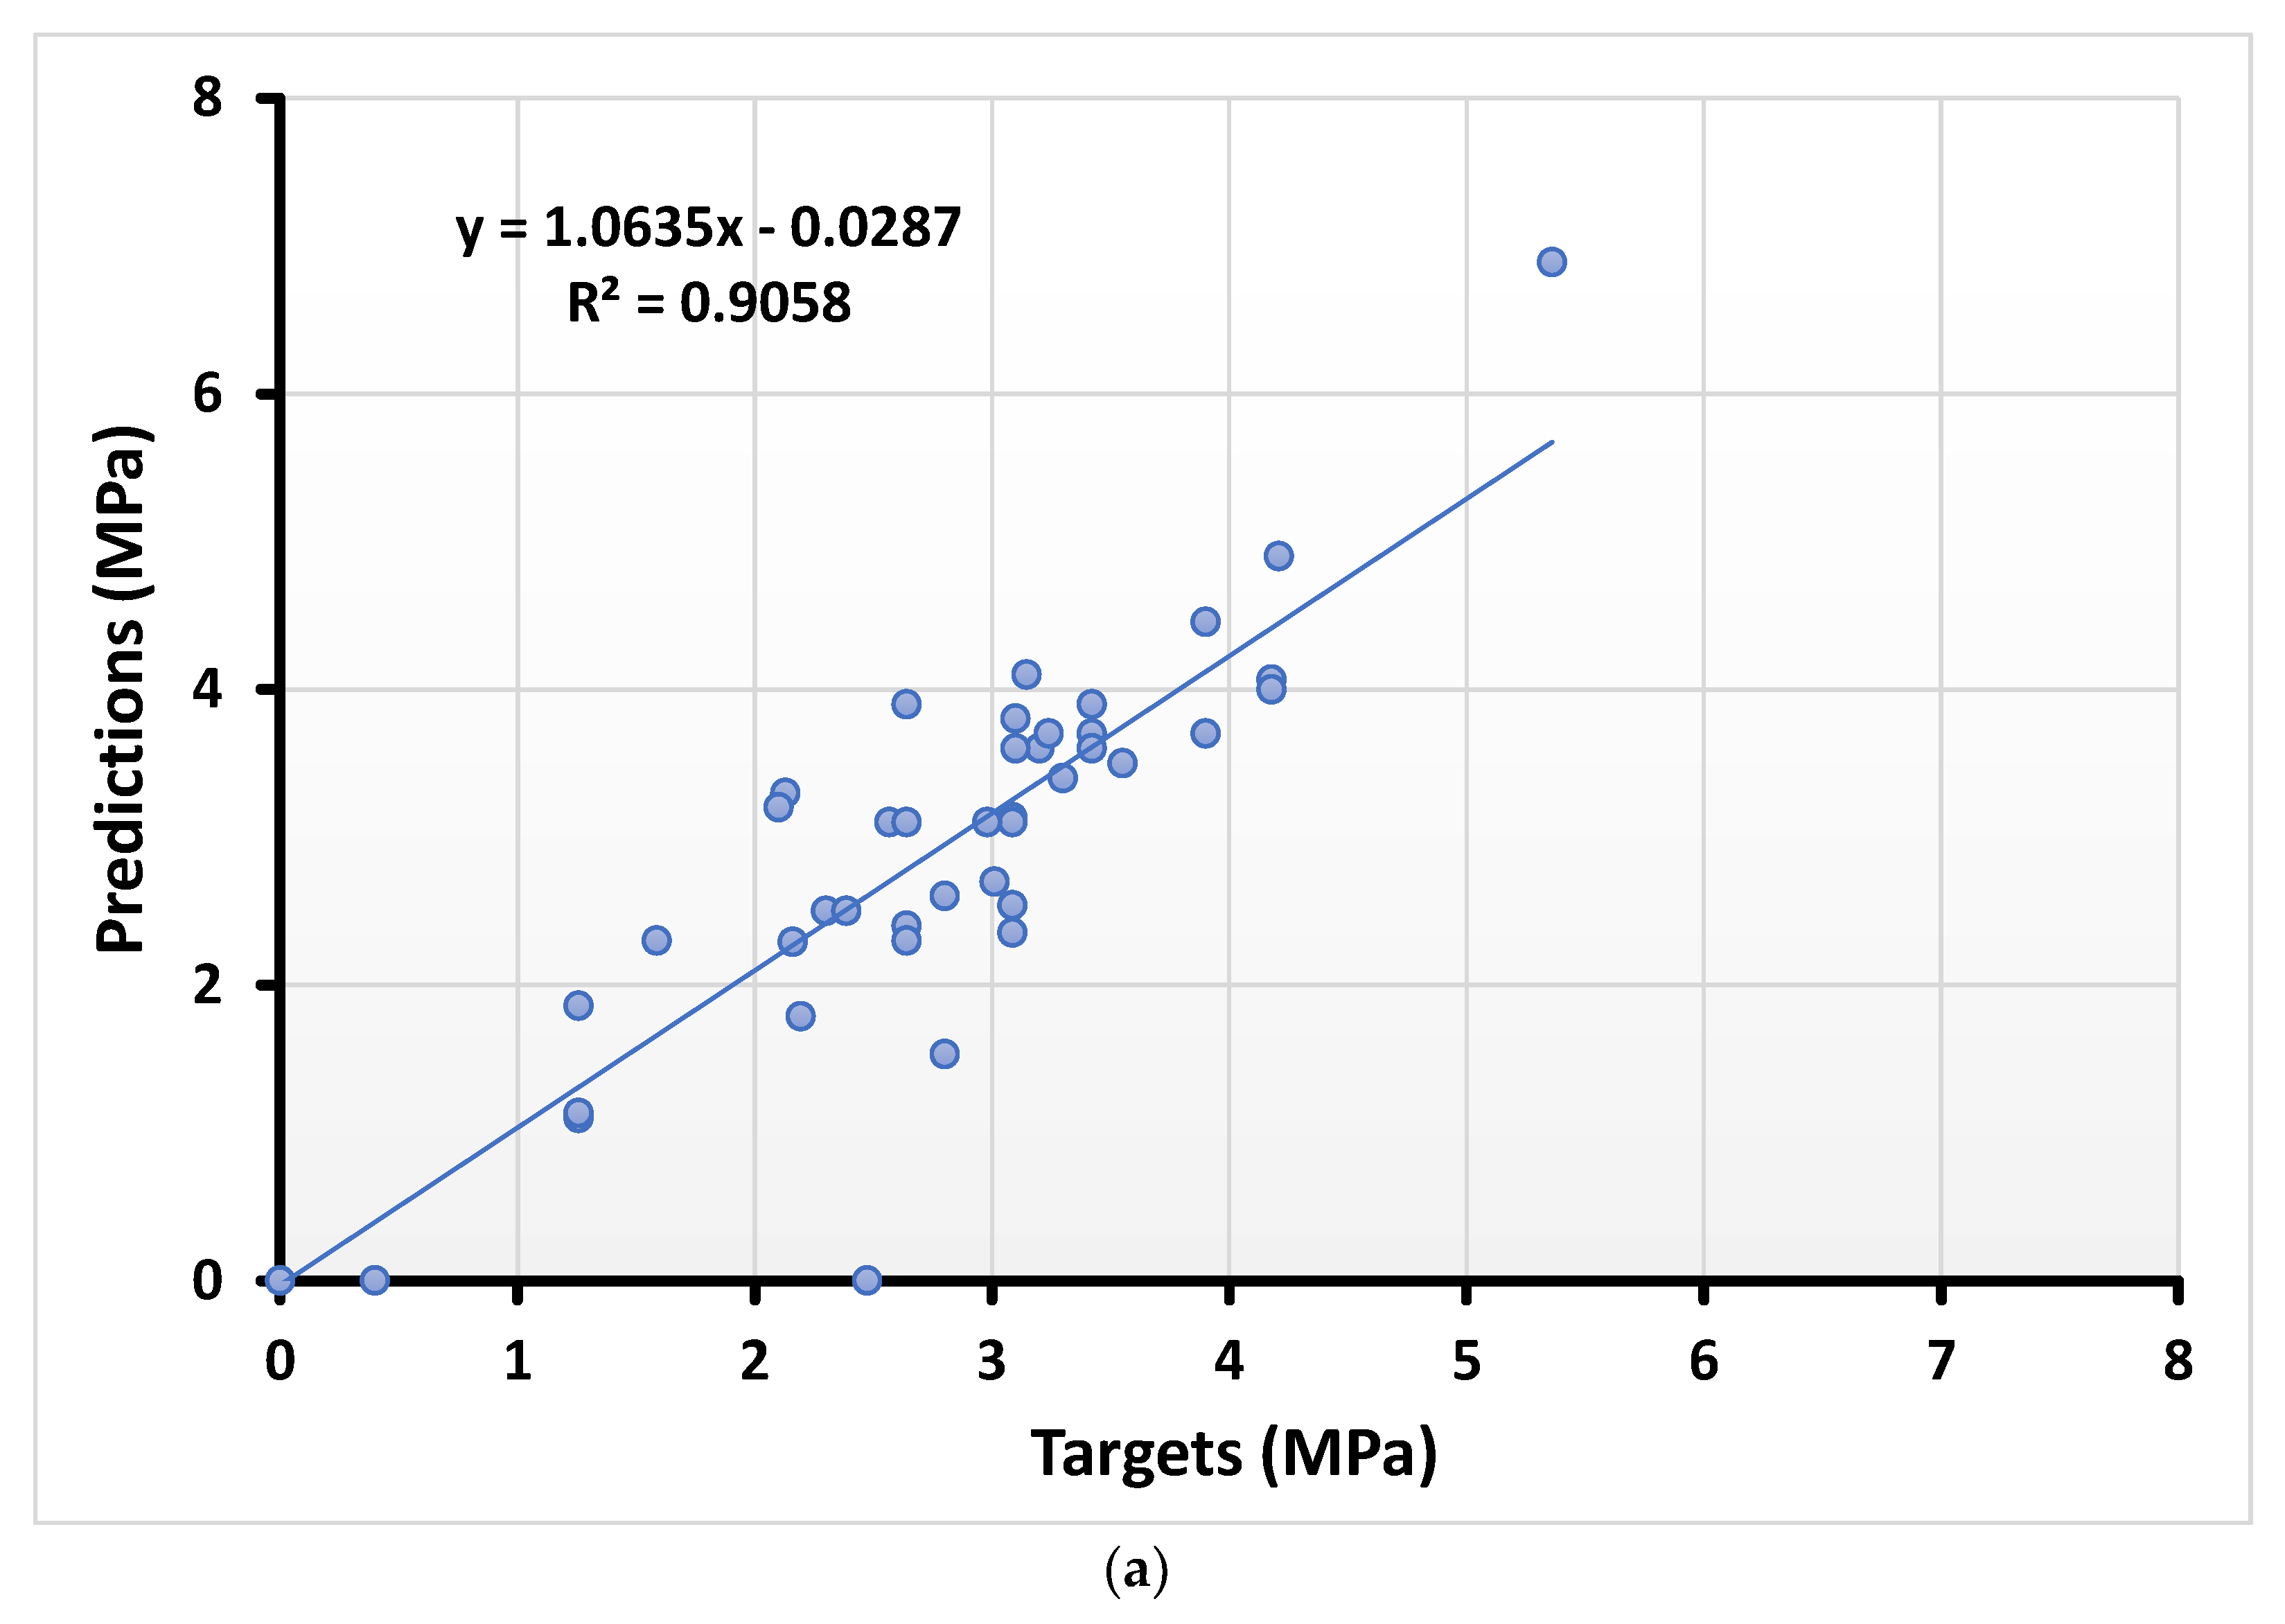
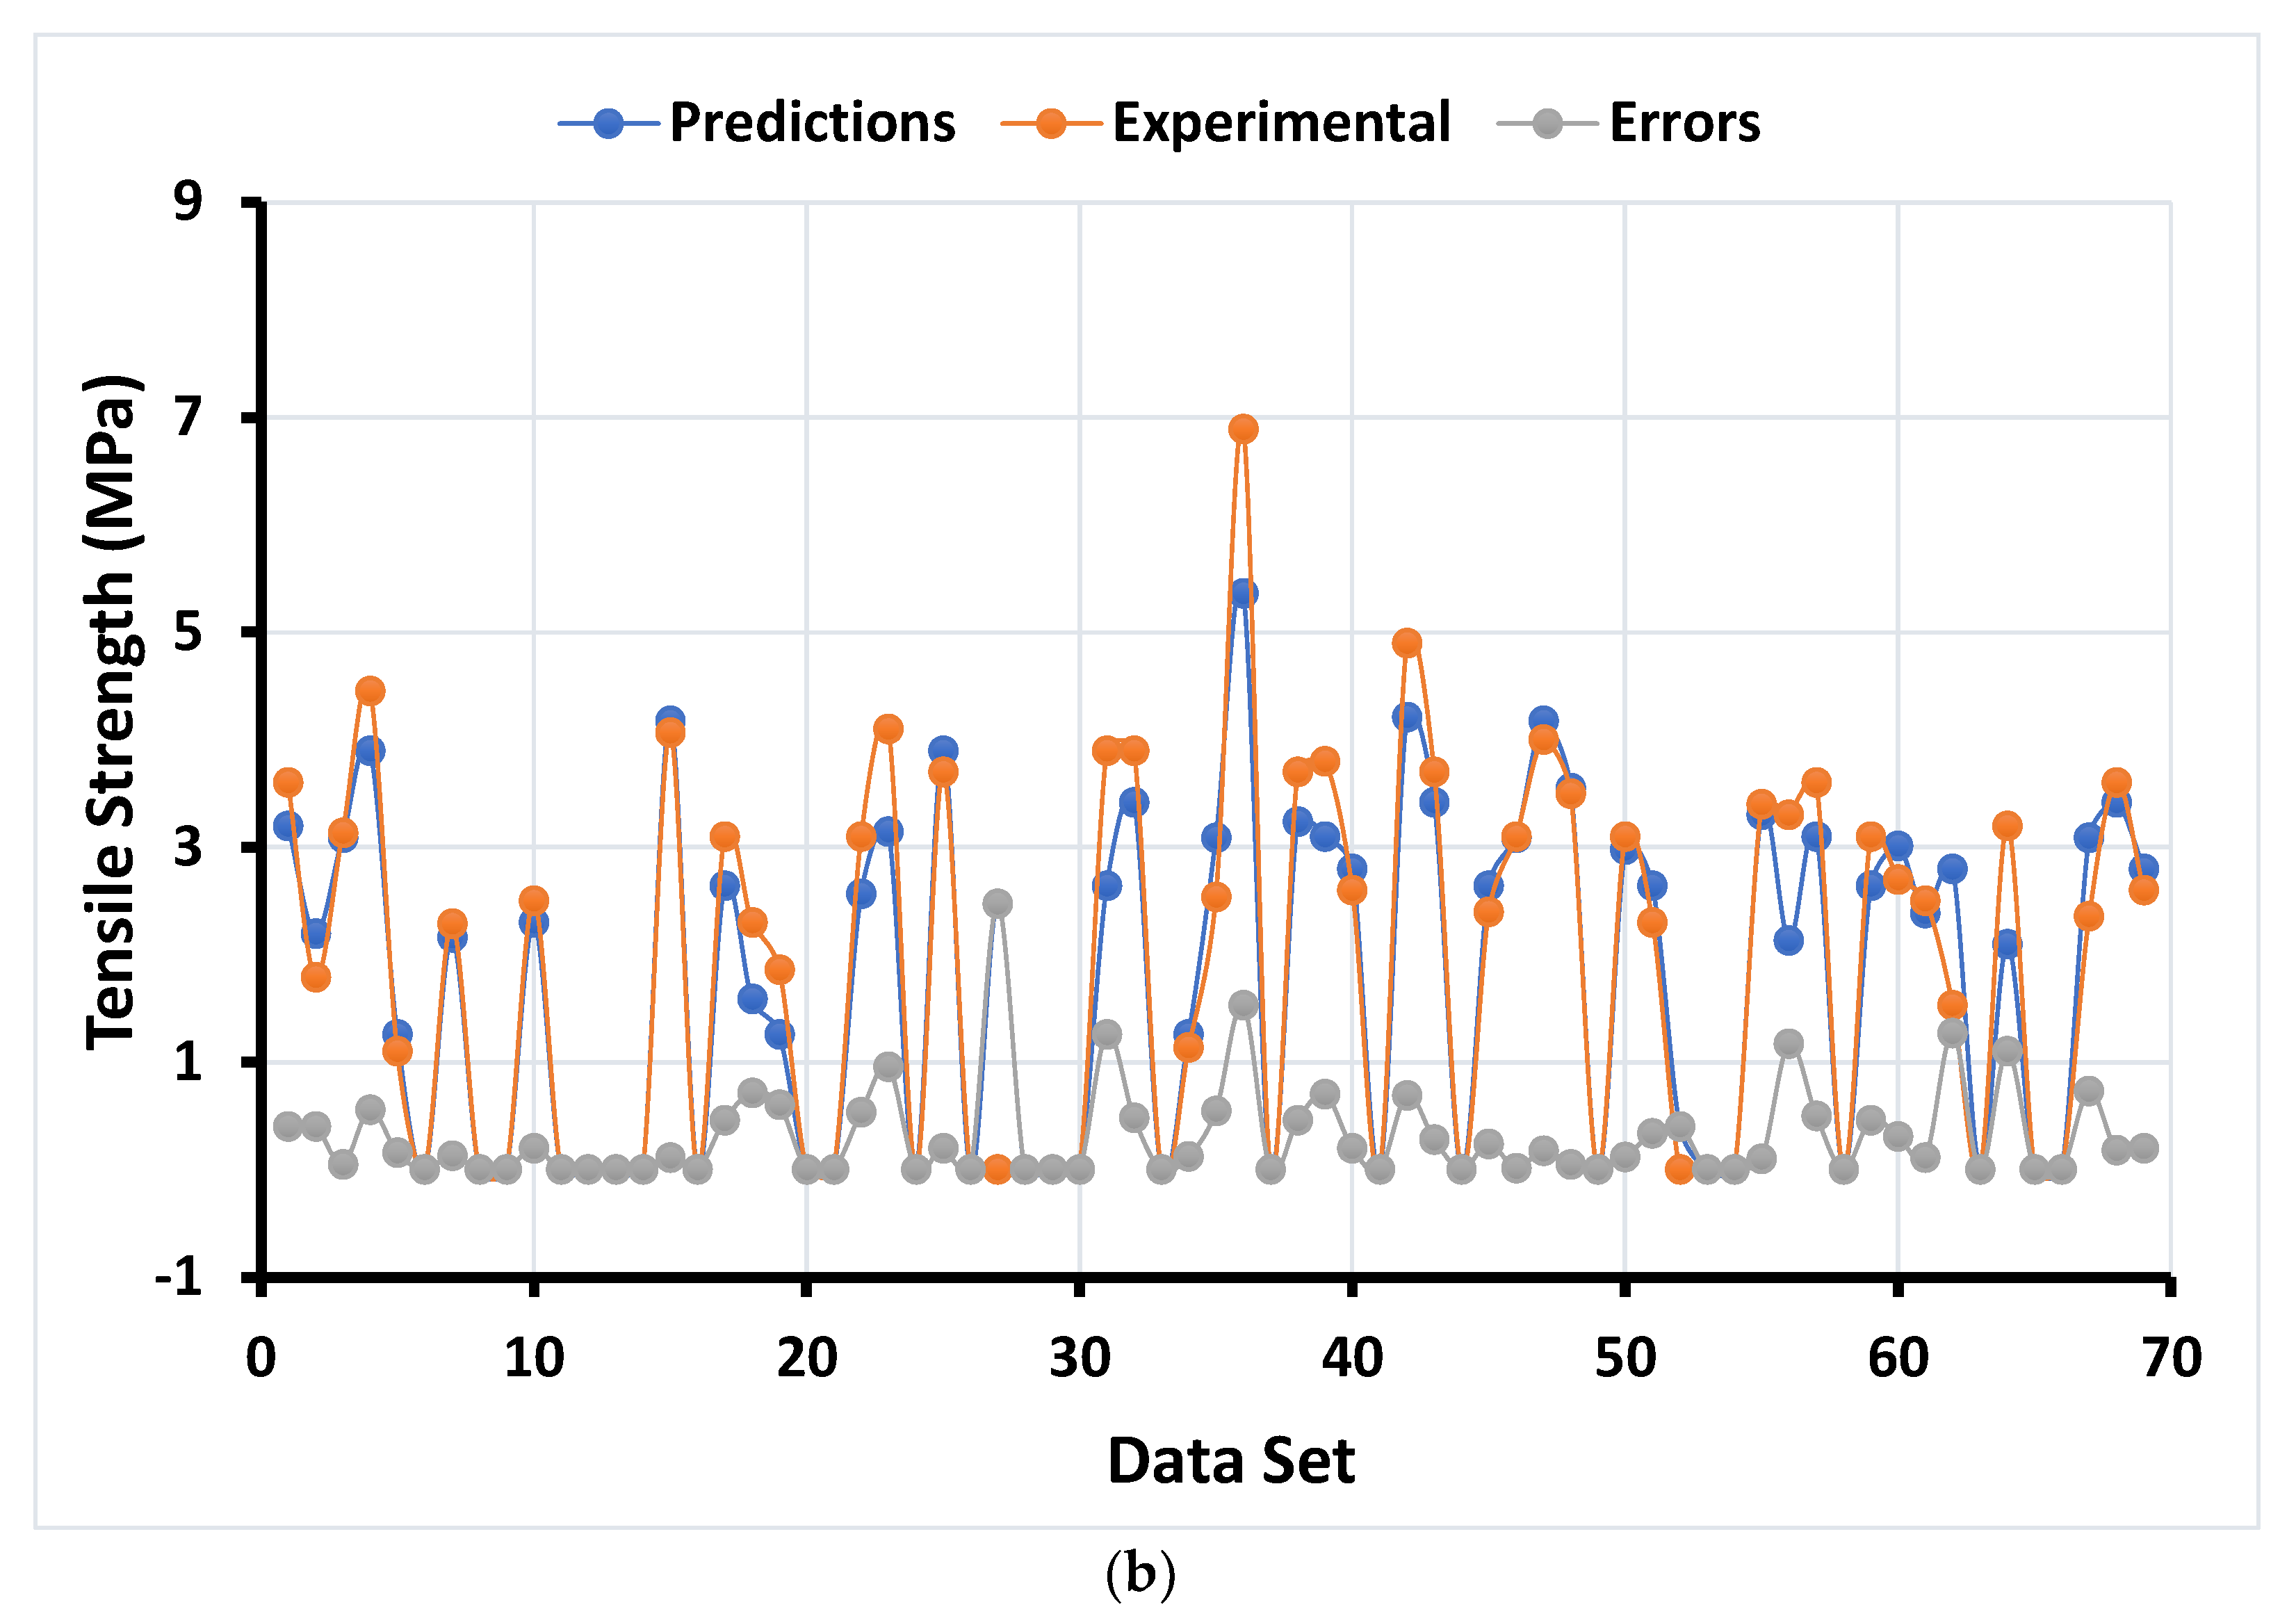
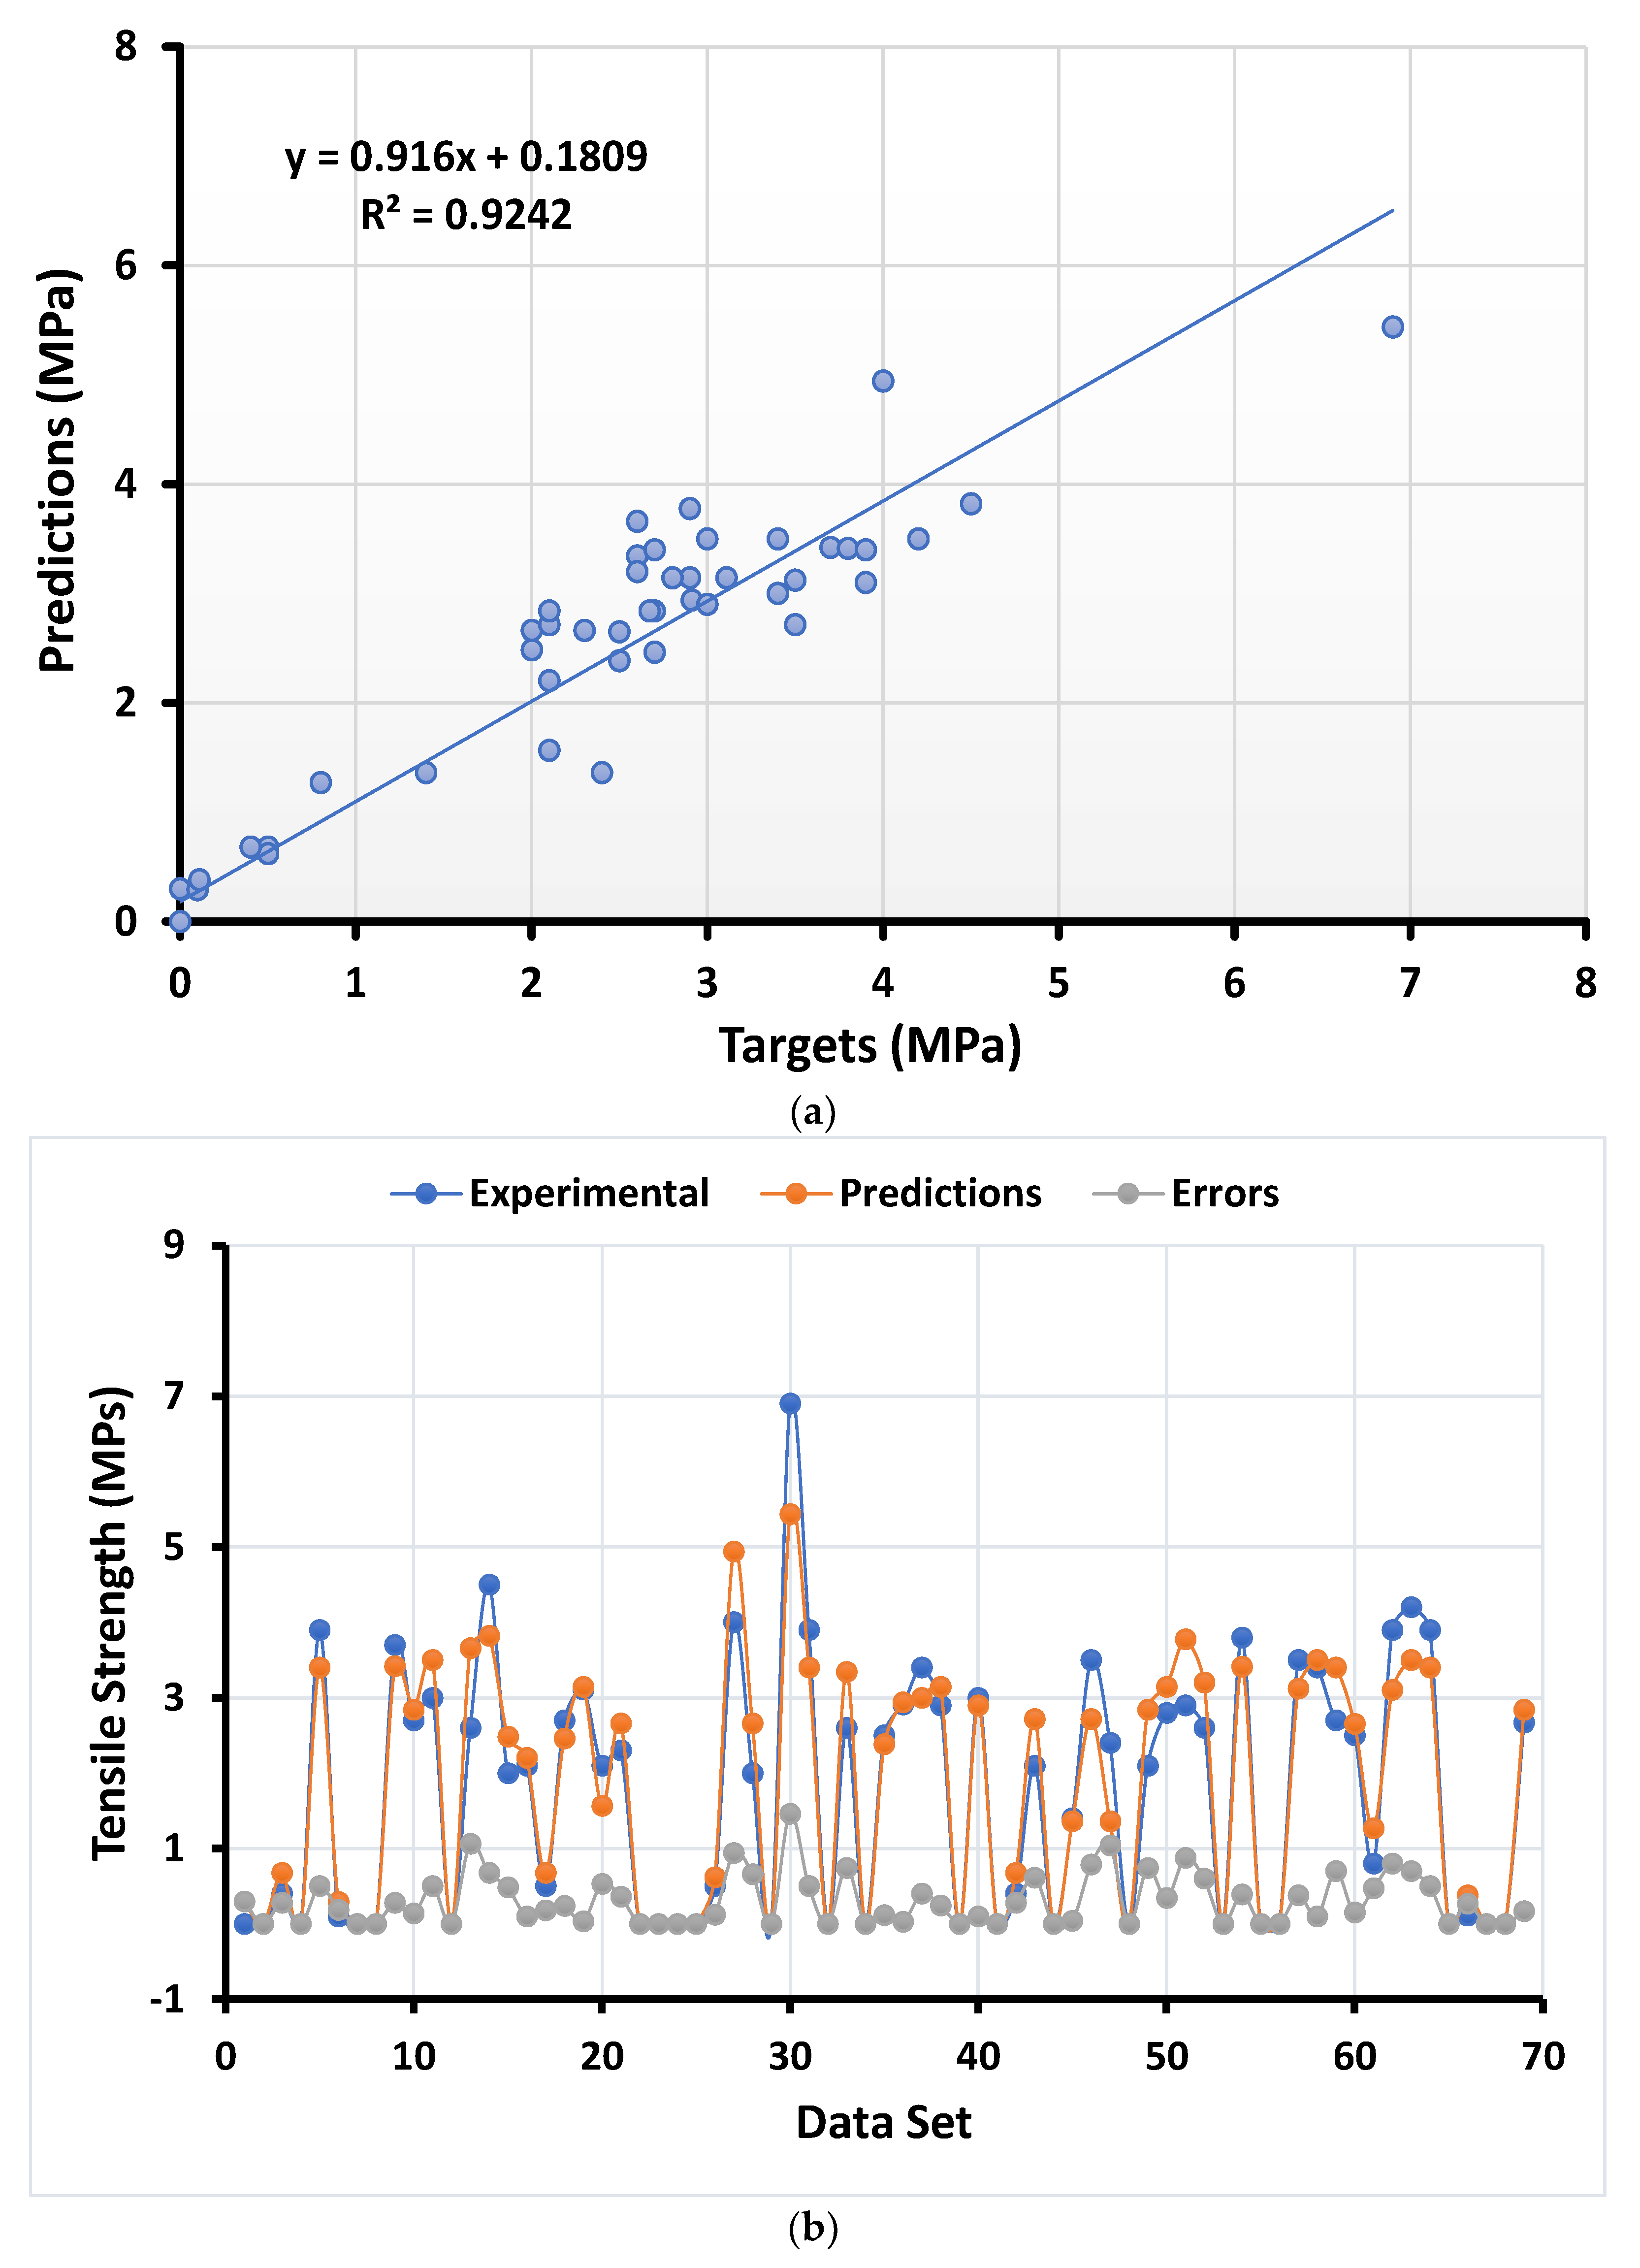
4.1.4. Splitting Tensile Strength with AdaBoost Regressor
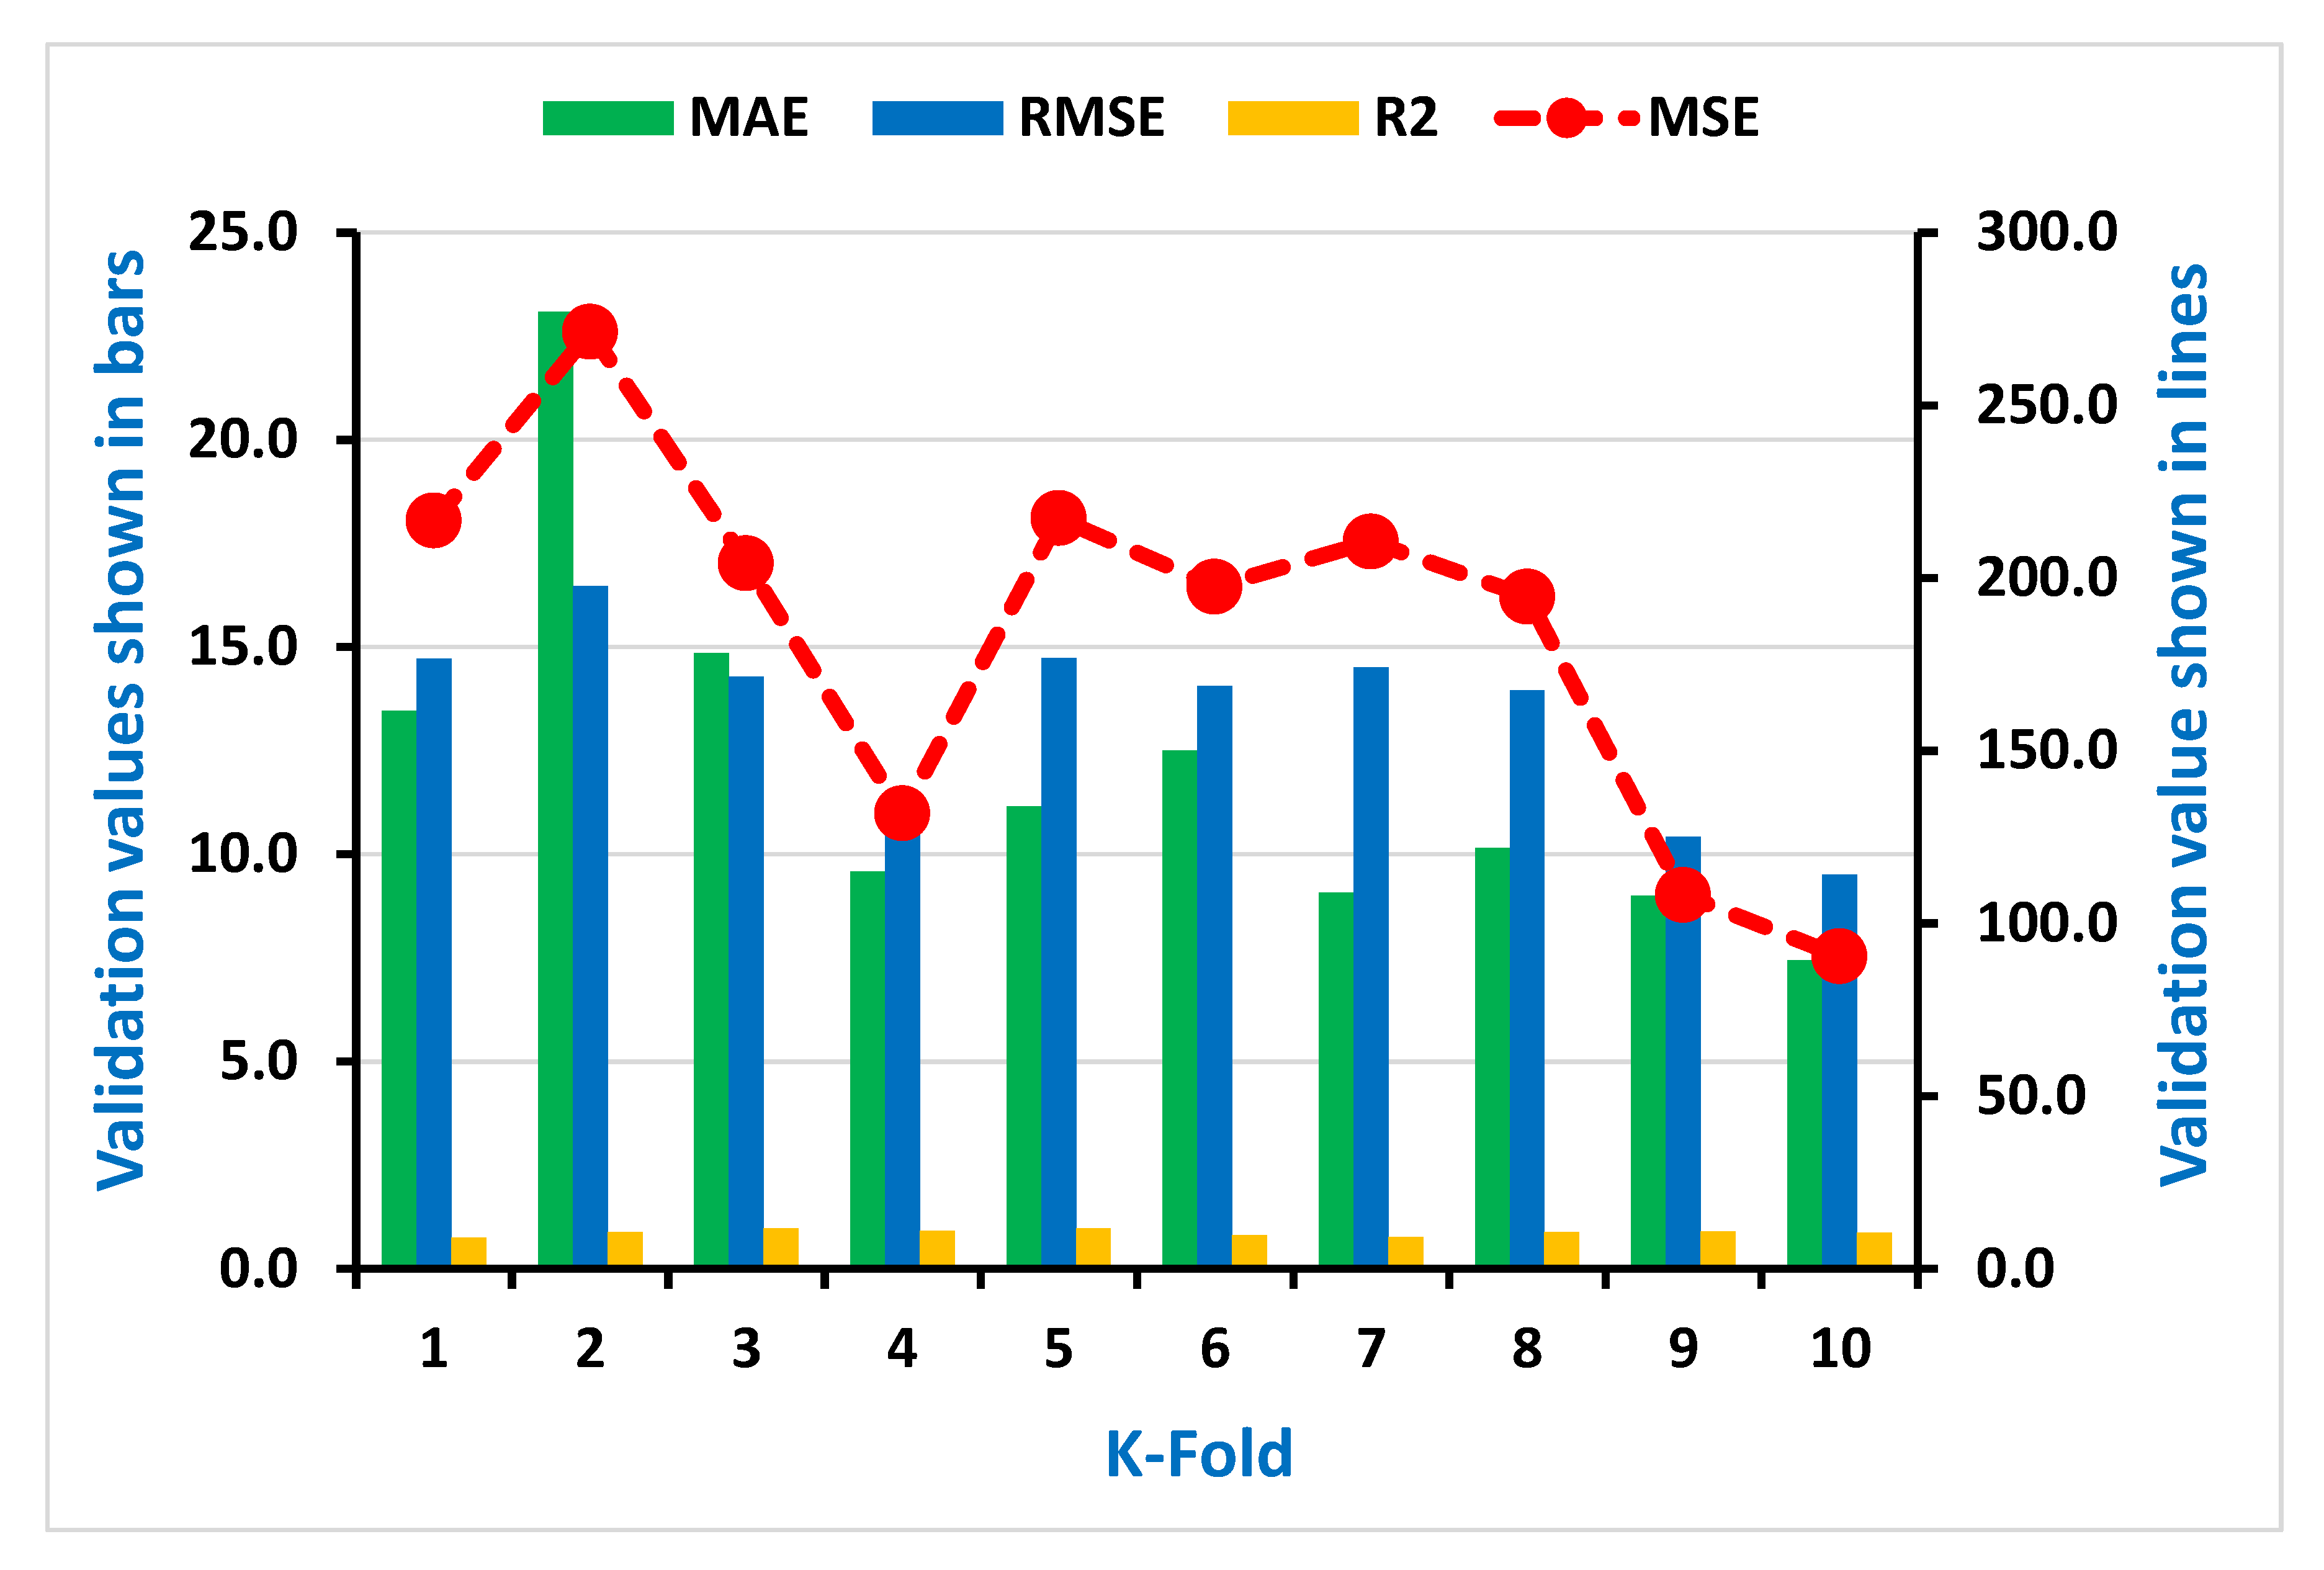
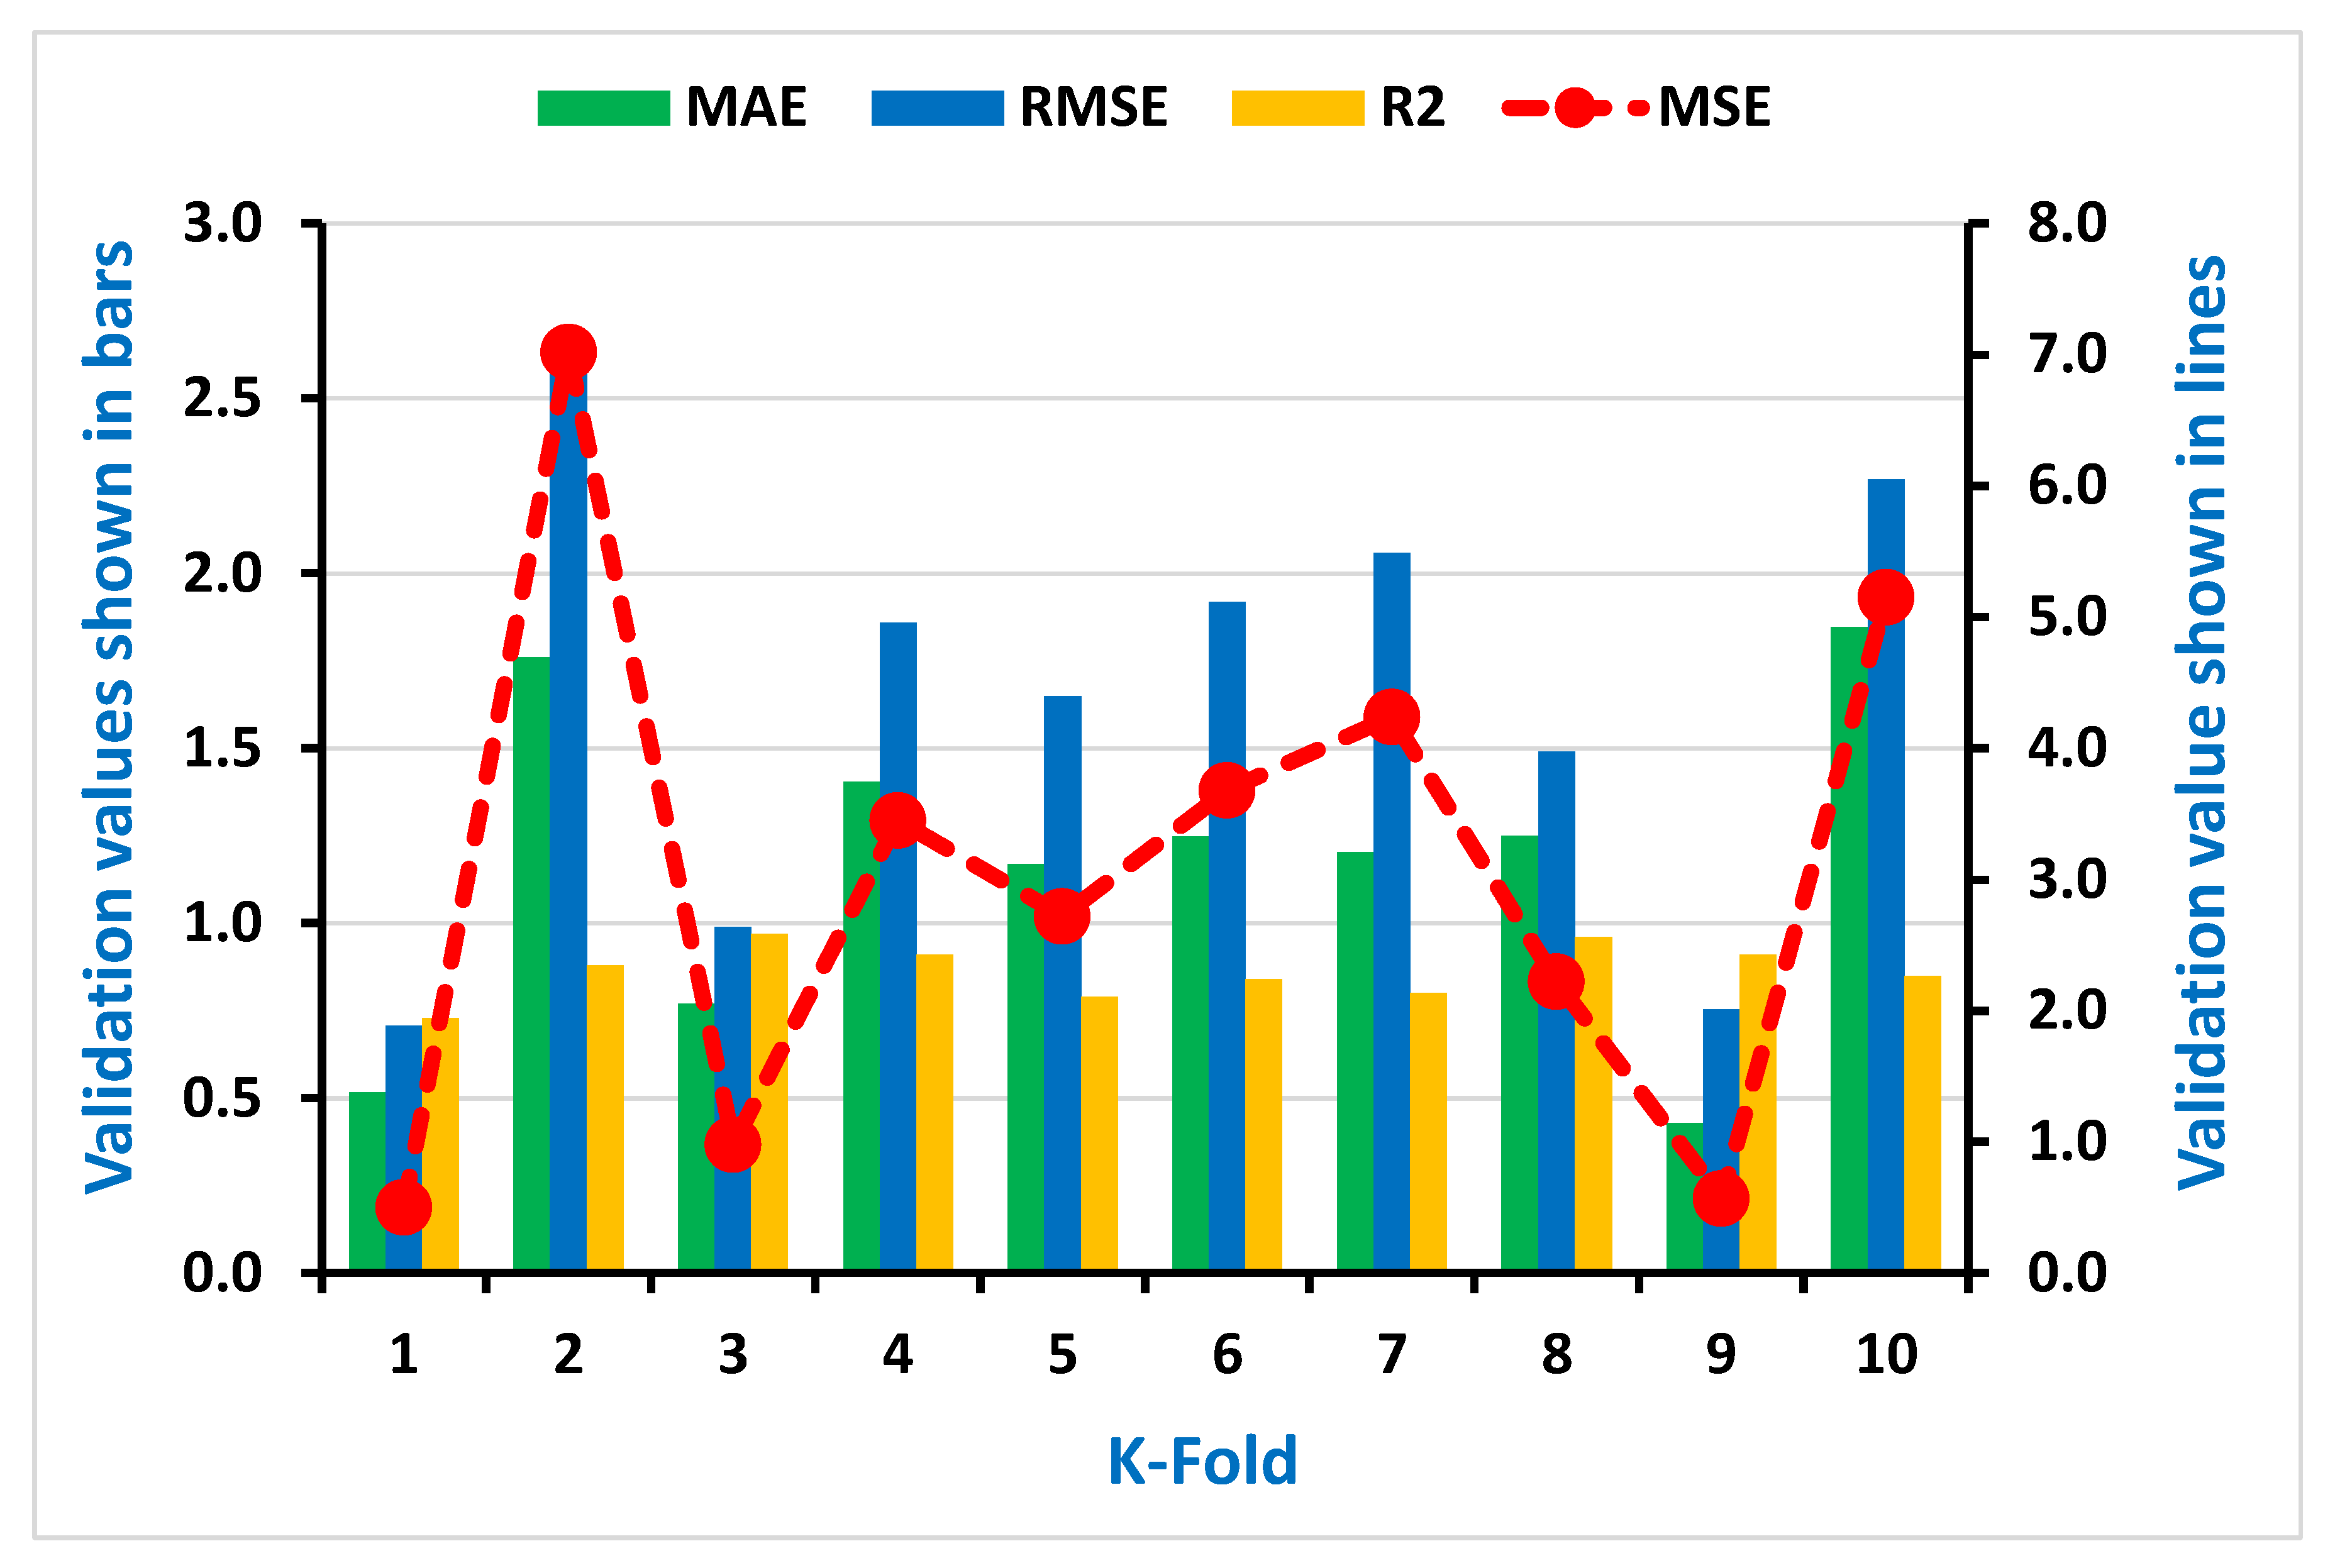
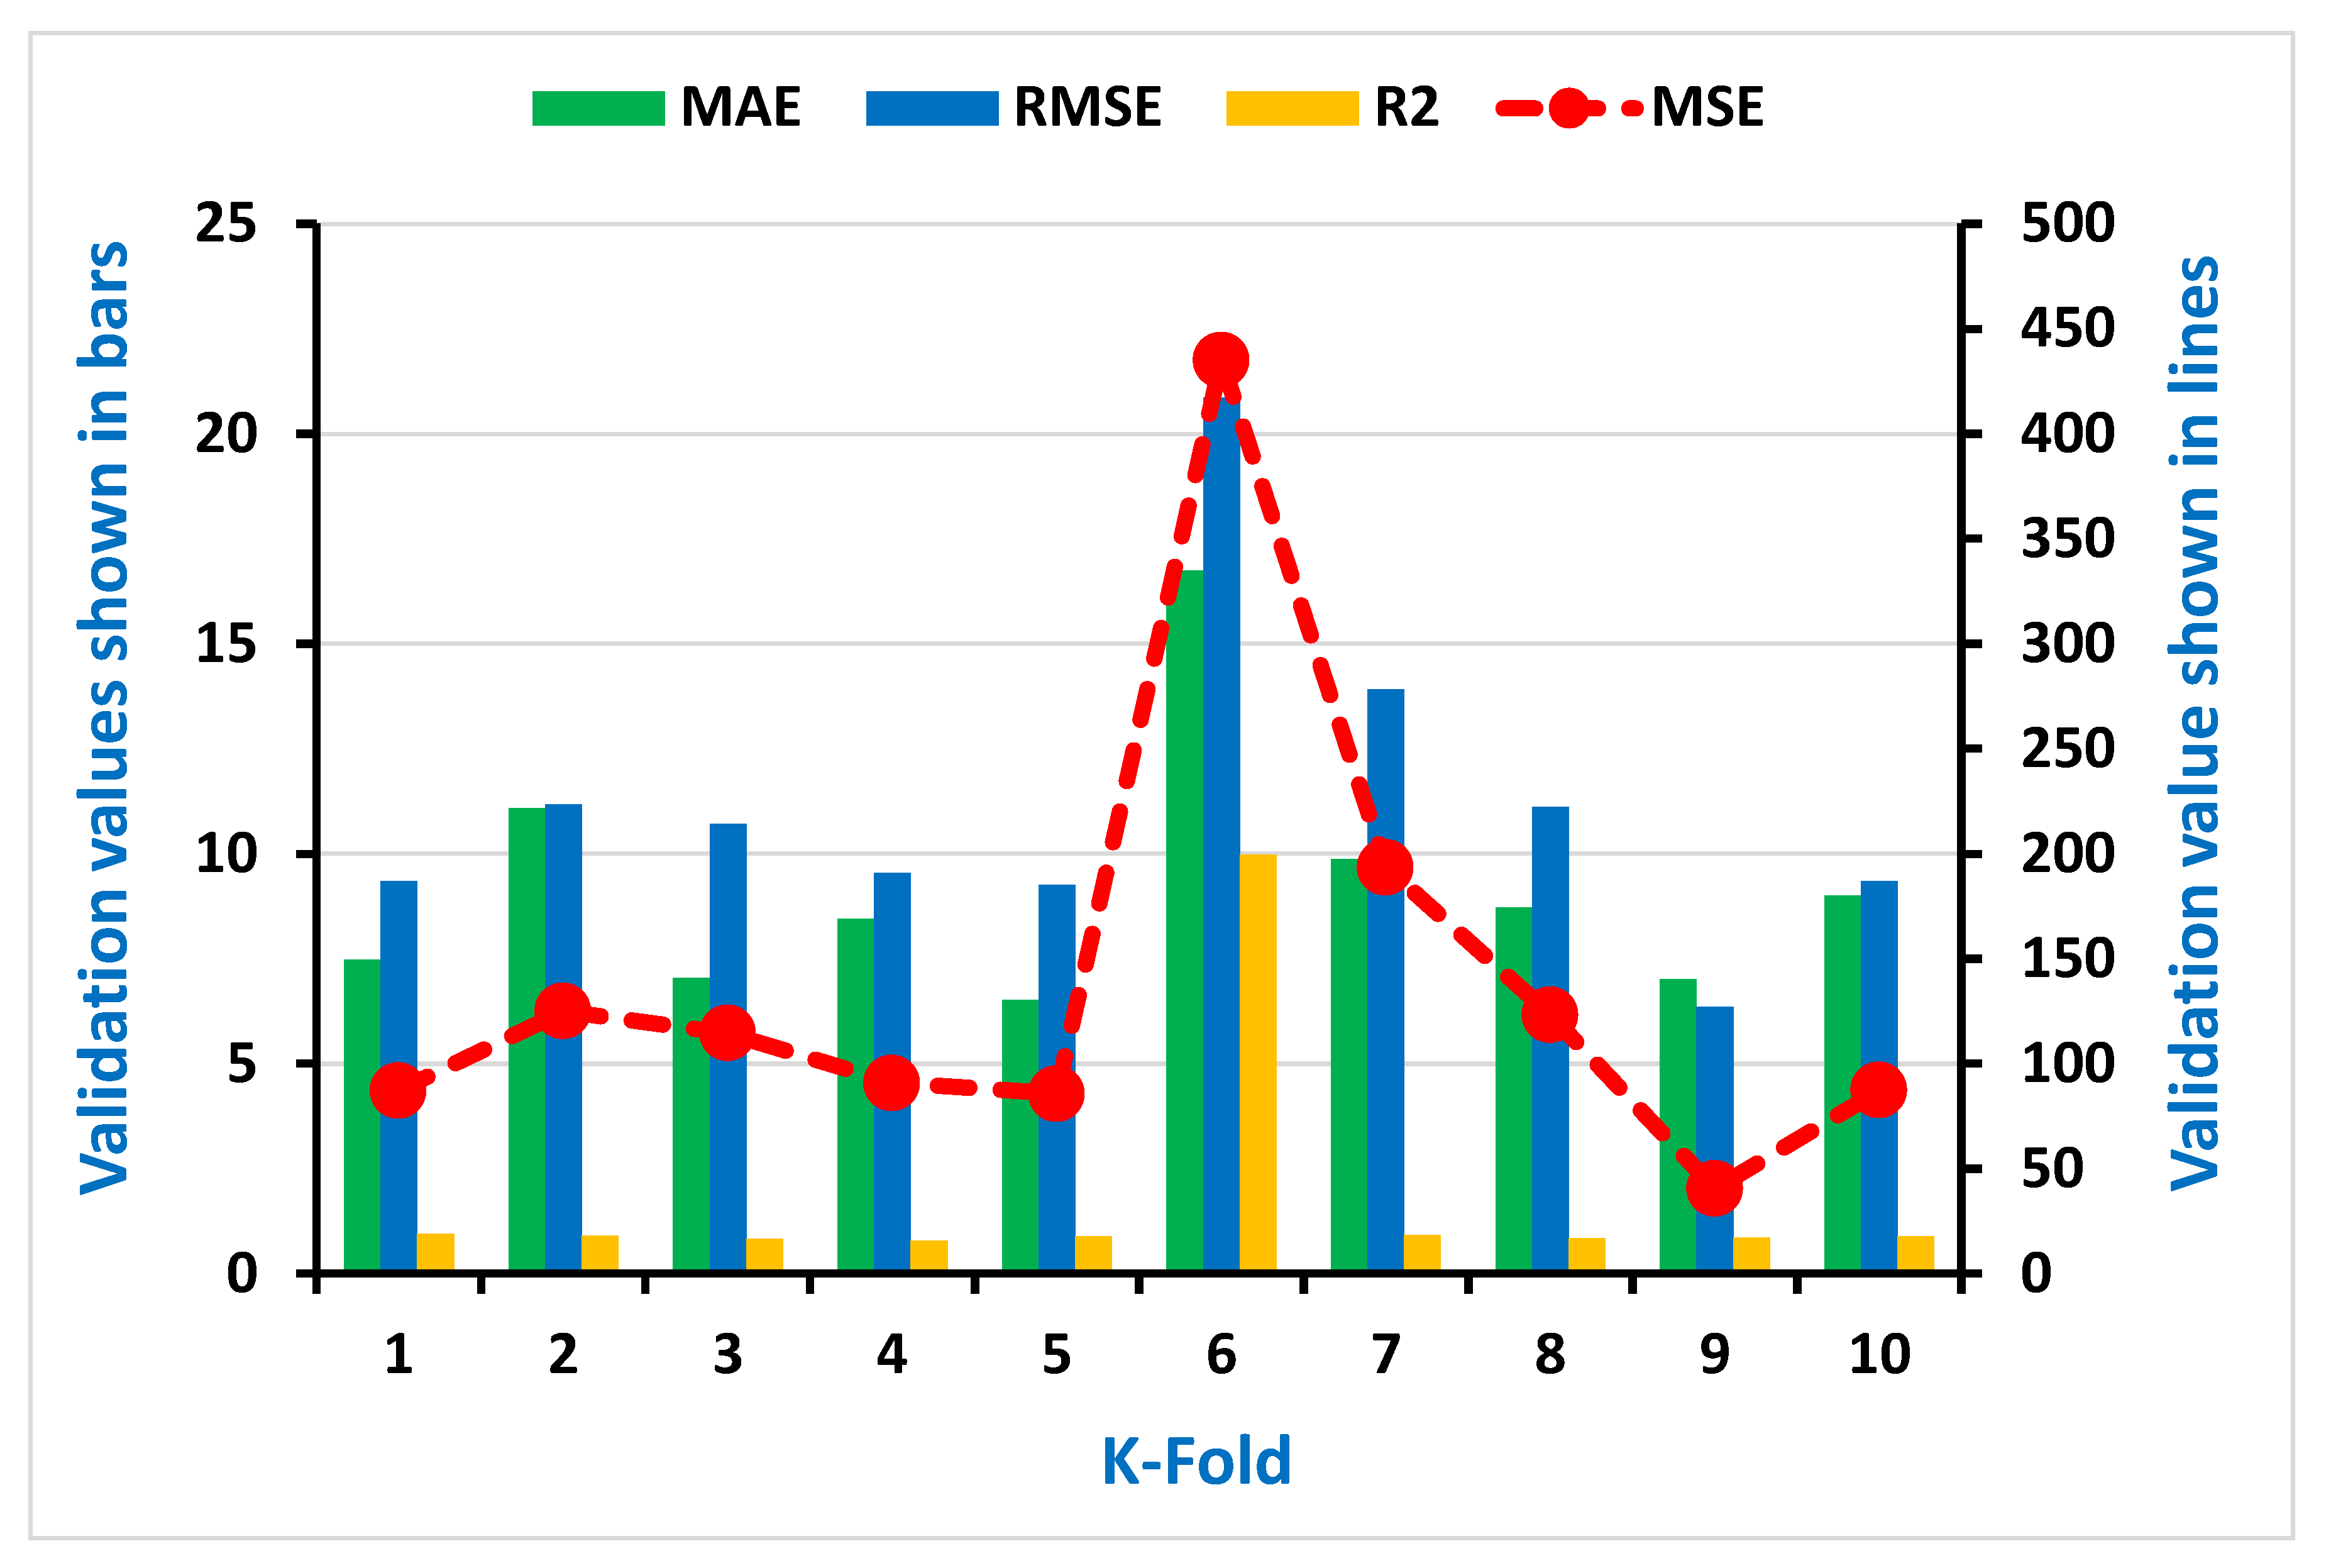
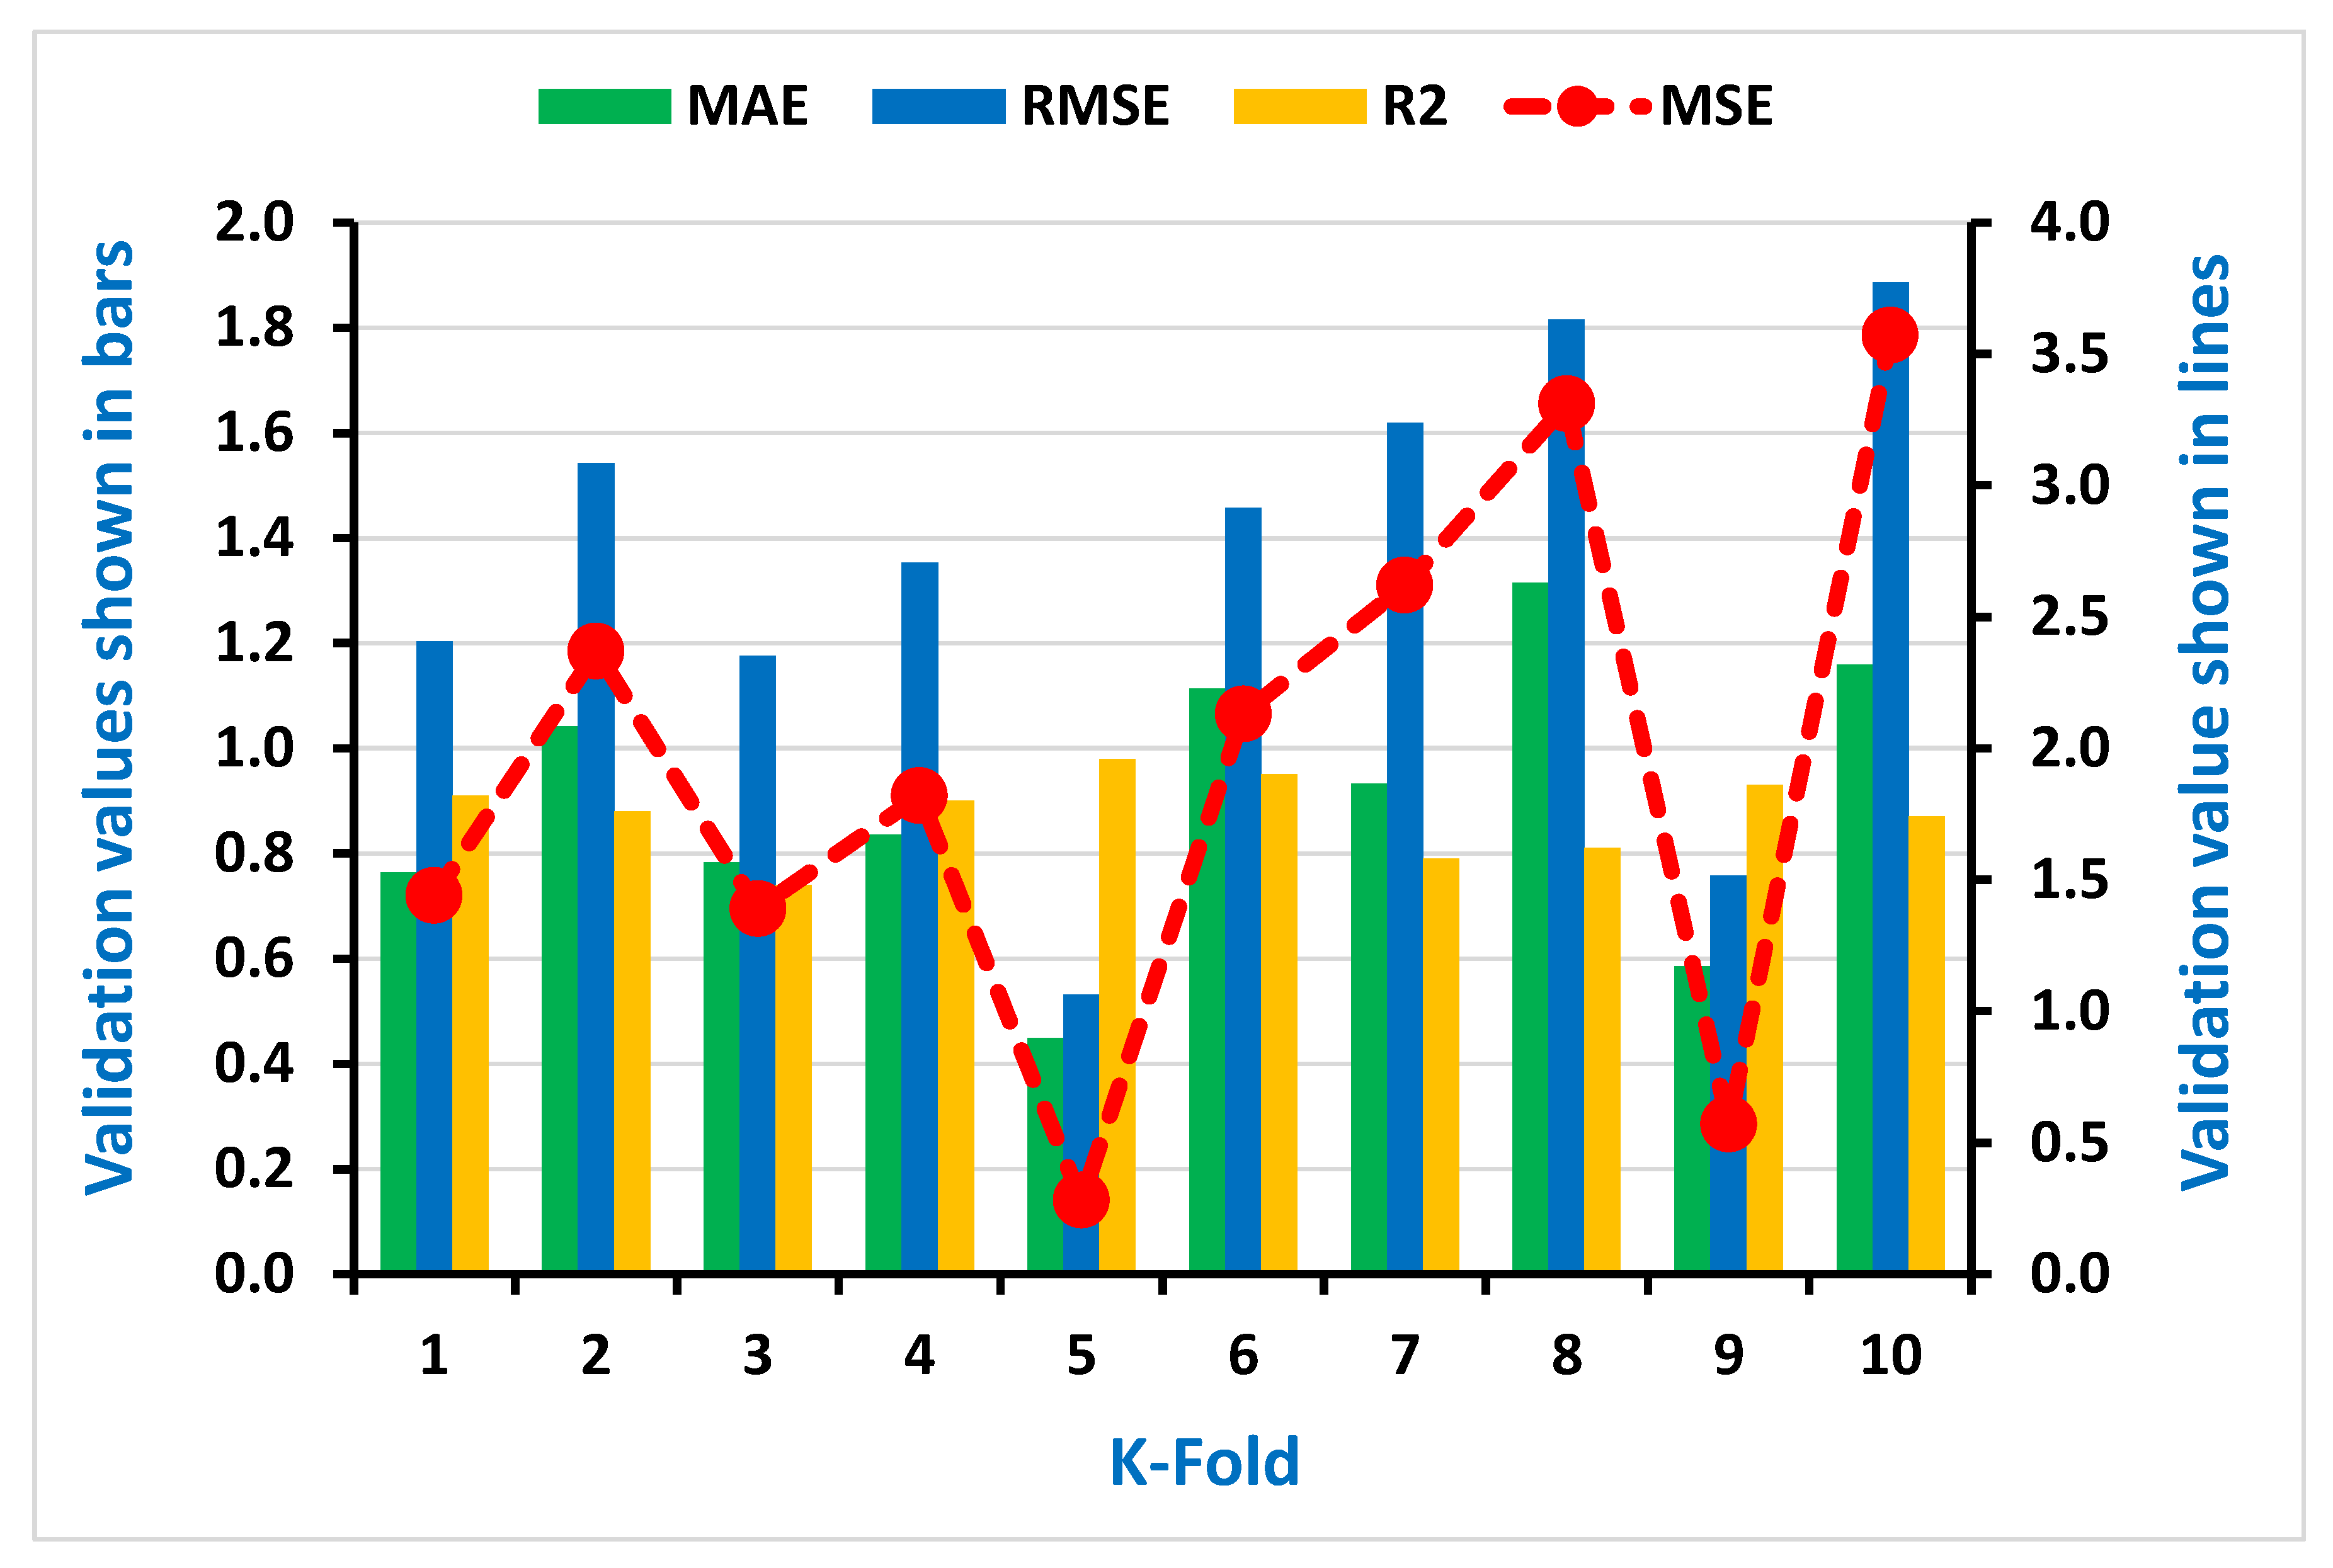
4.2. K-Fold Cross-Validation and Statistical Checks
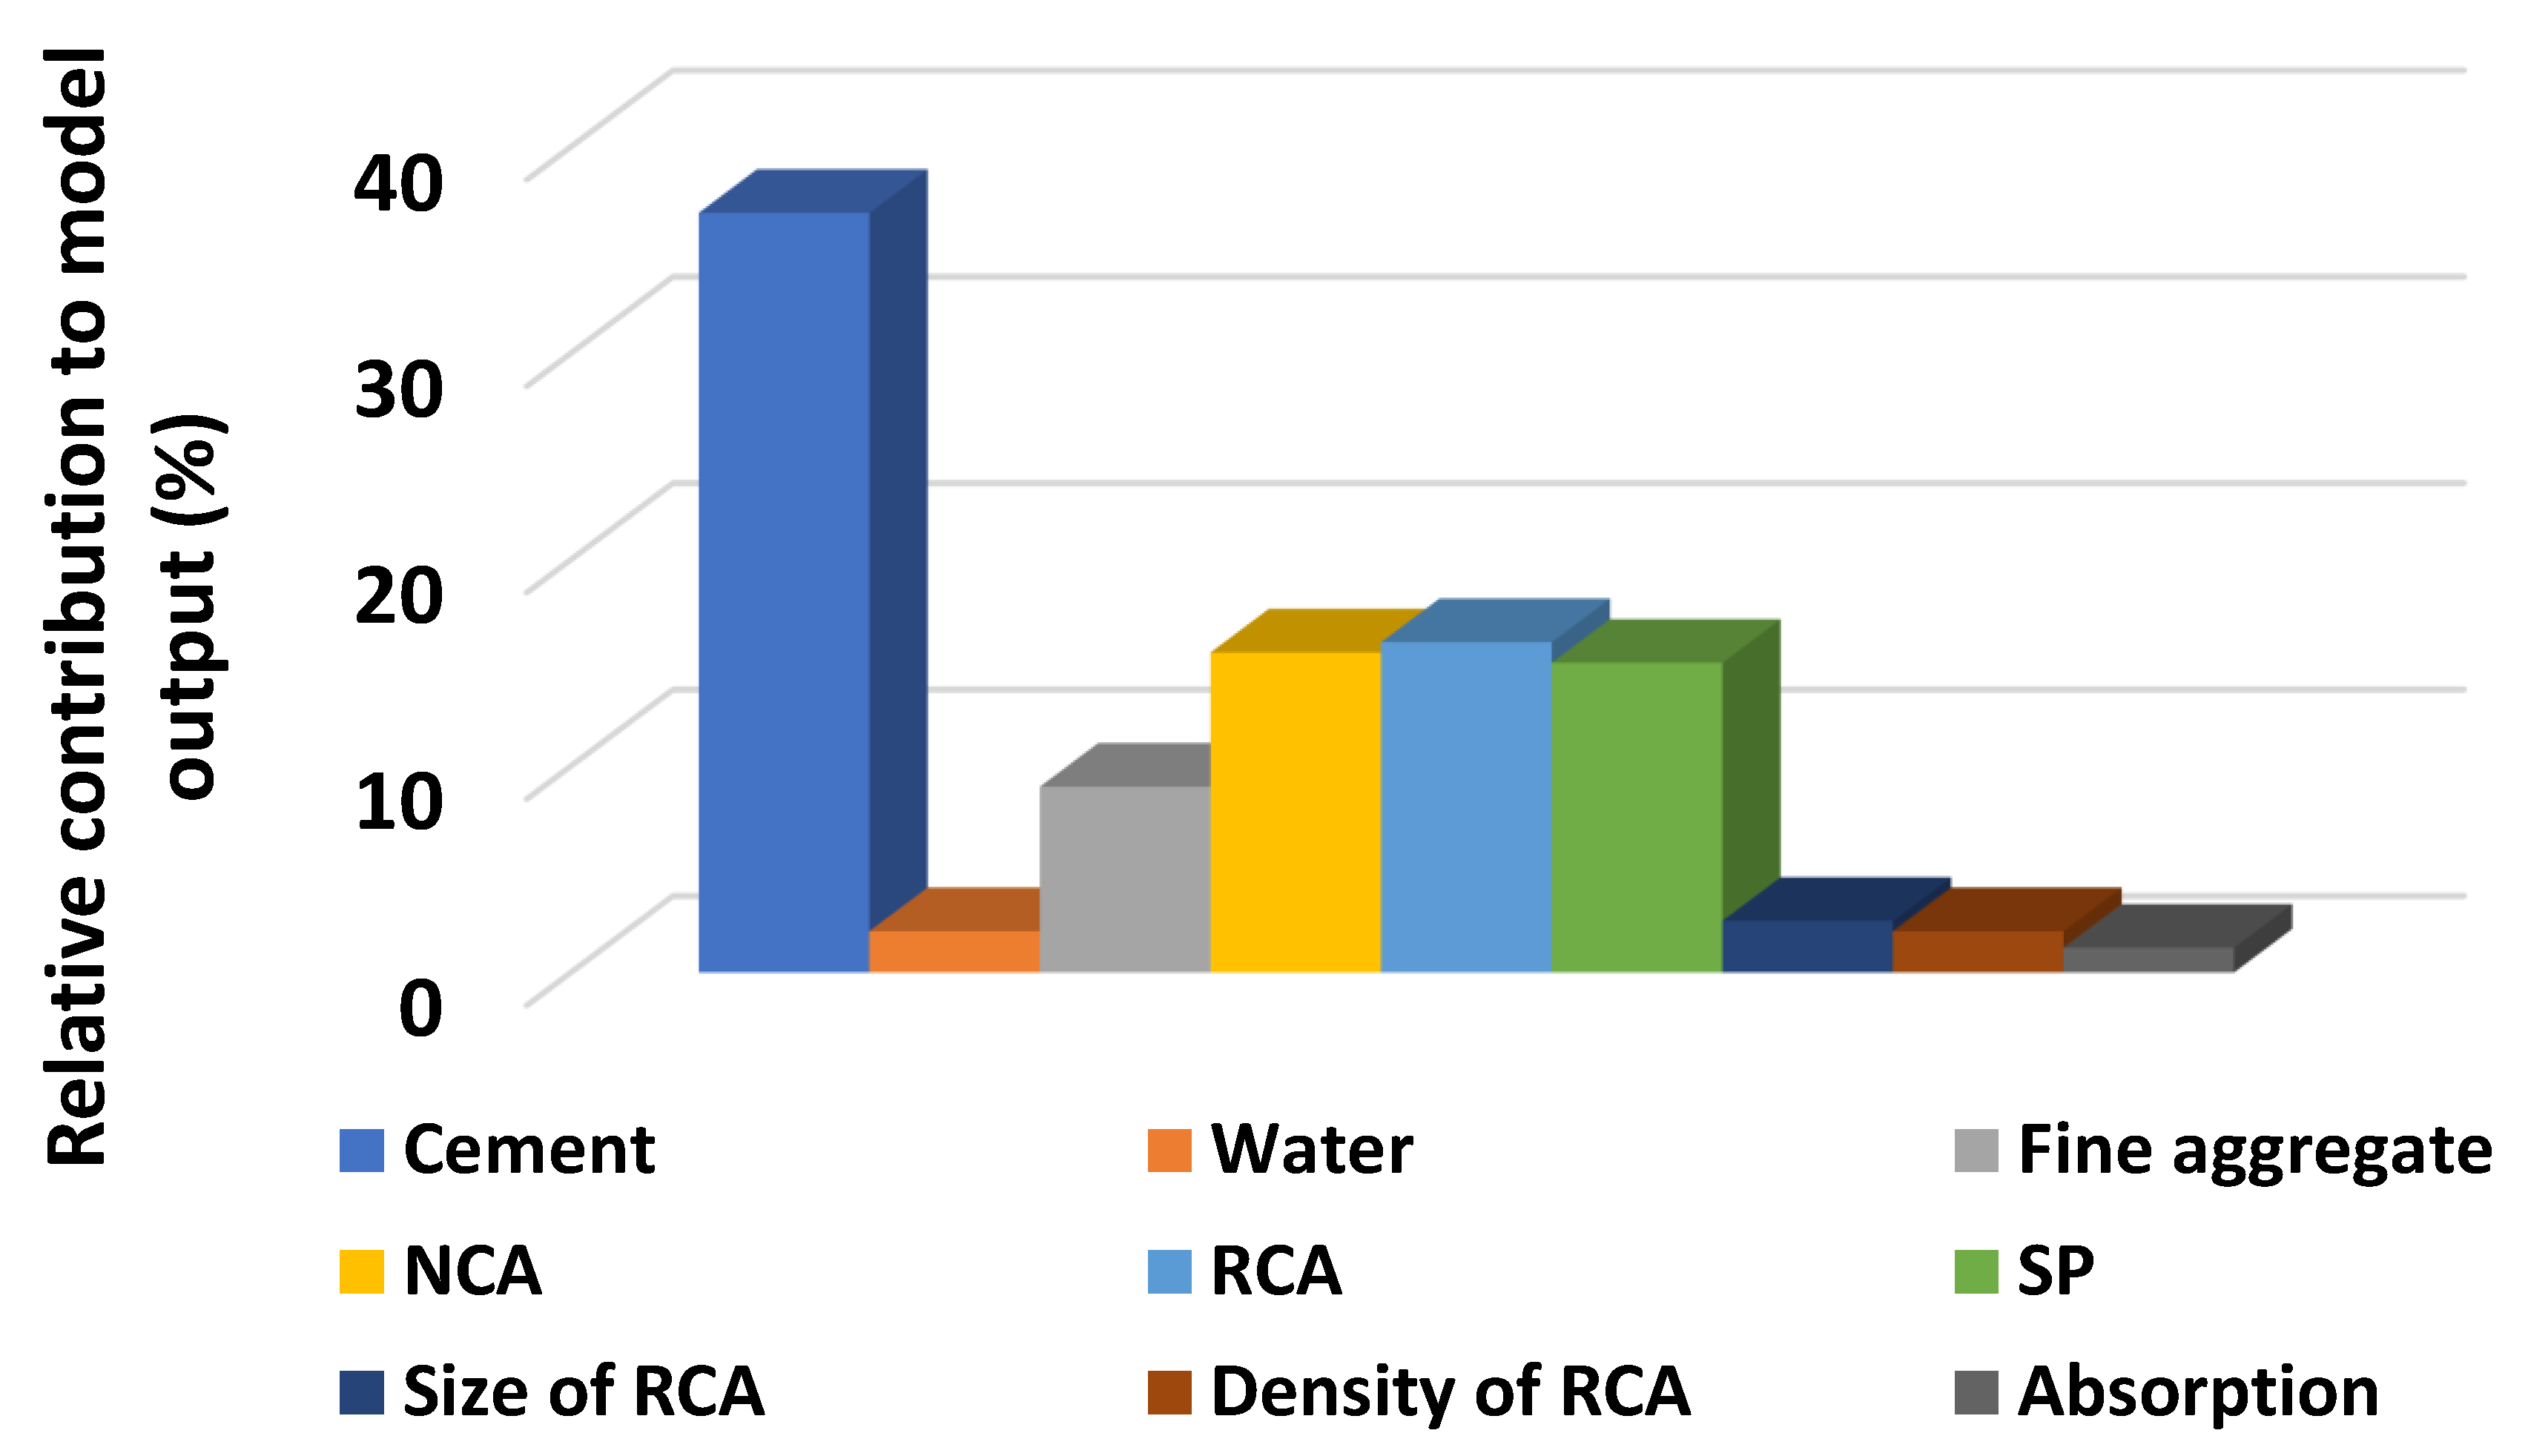
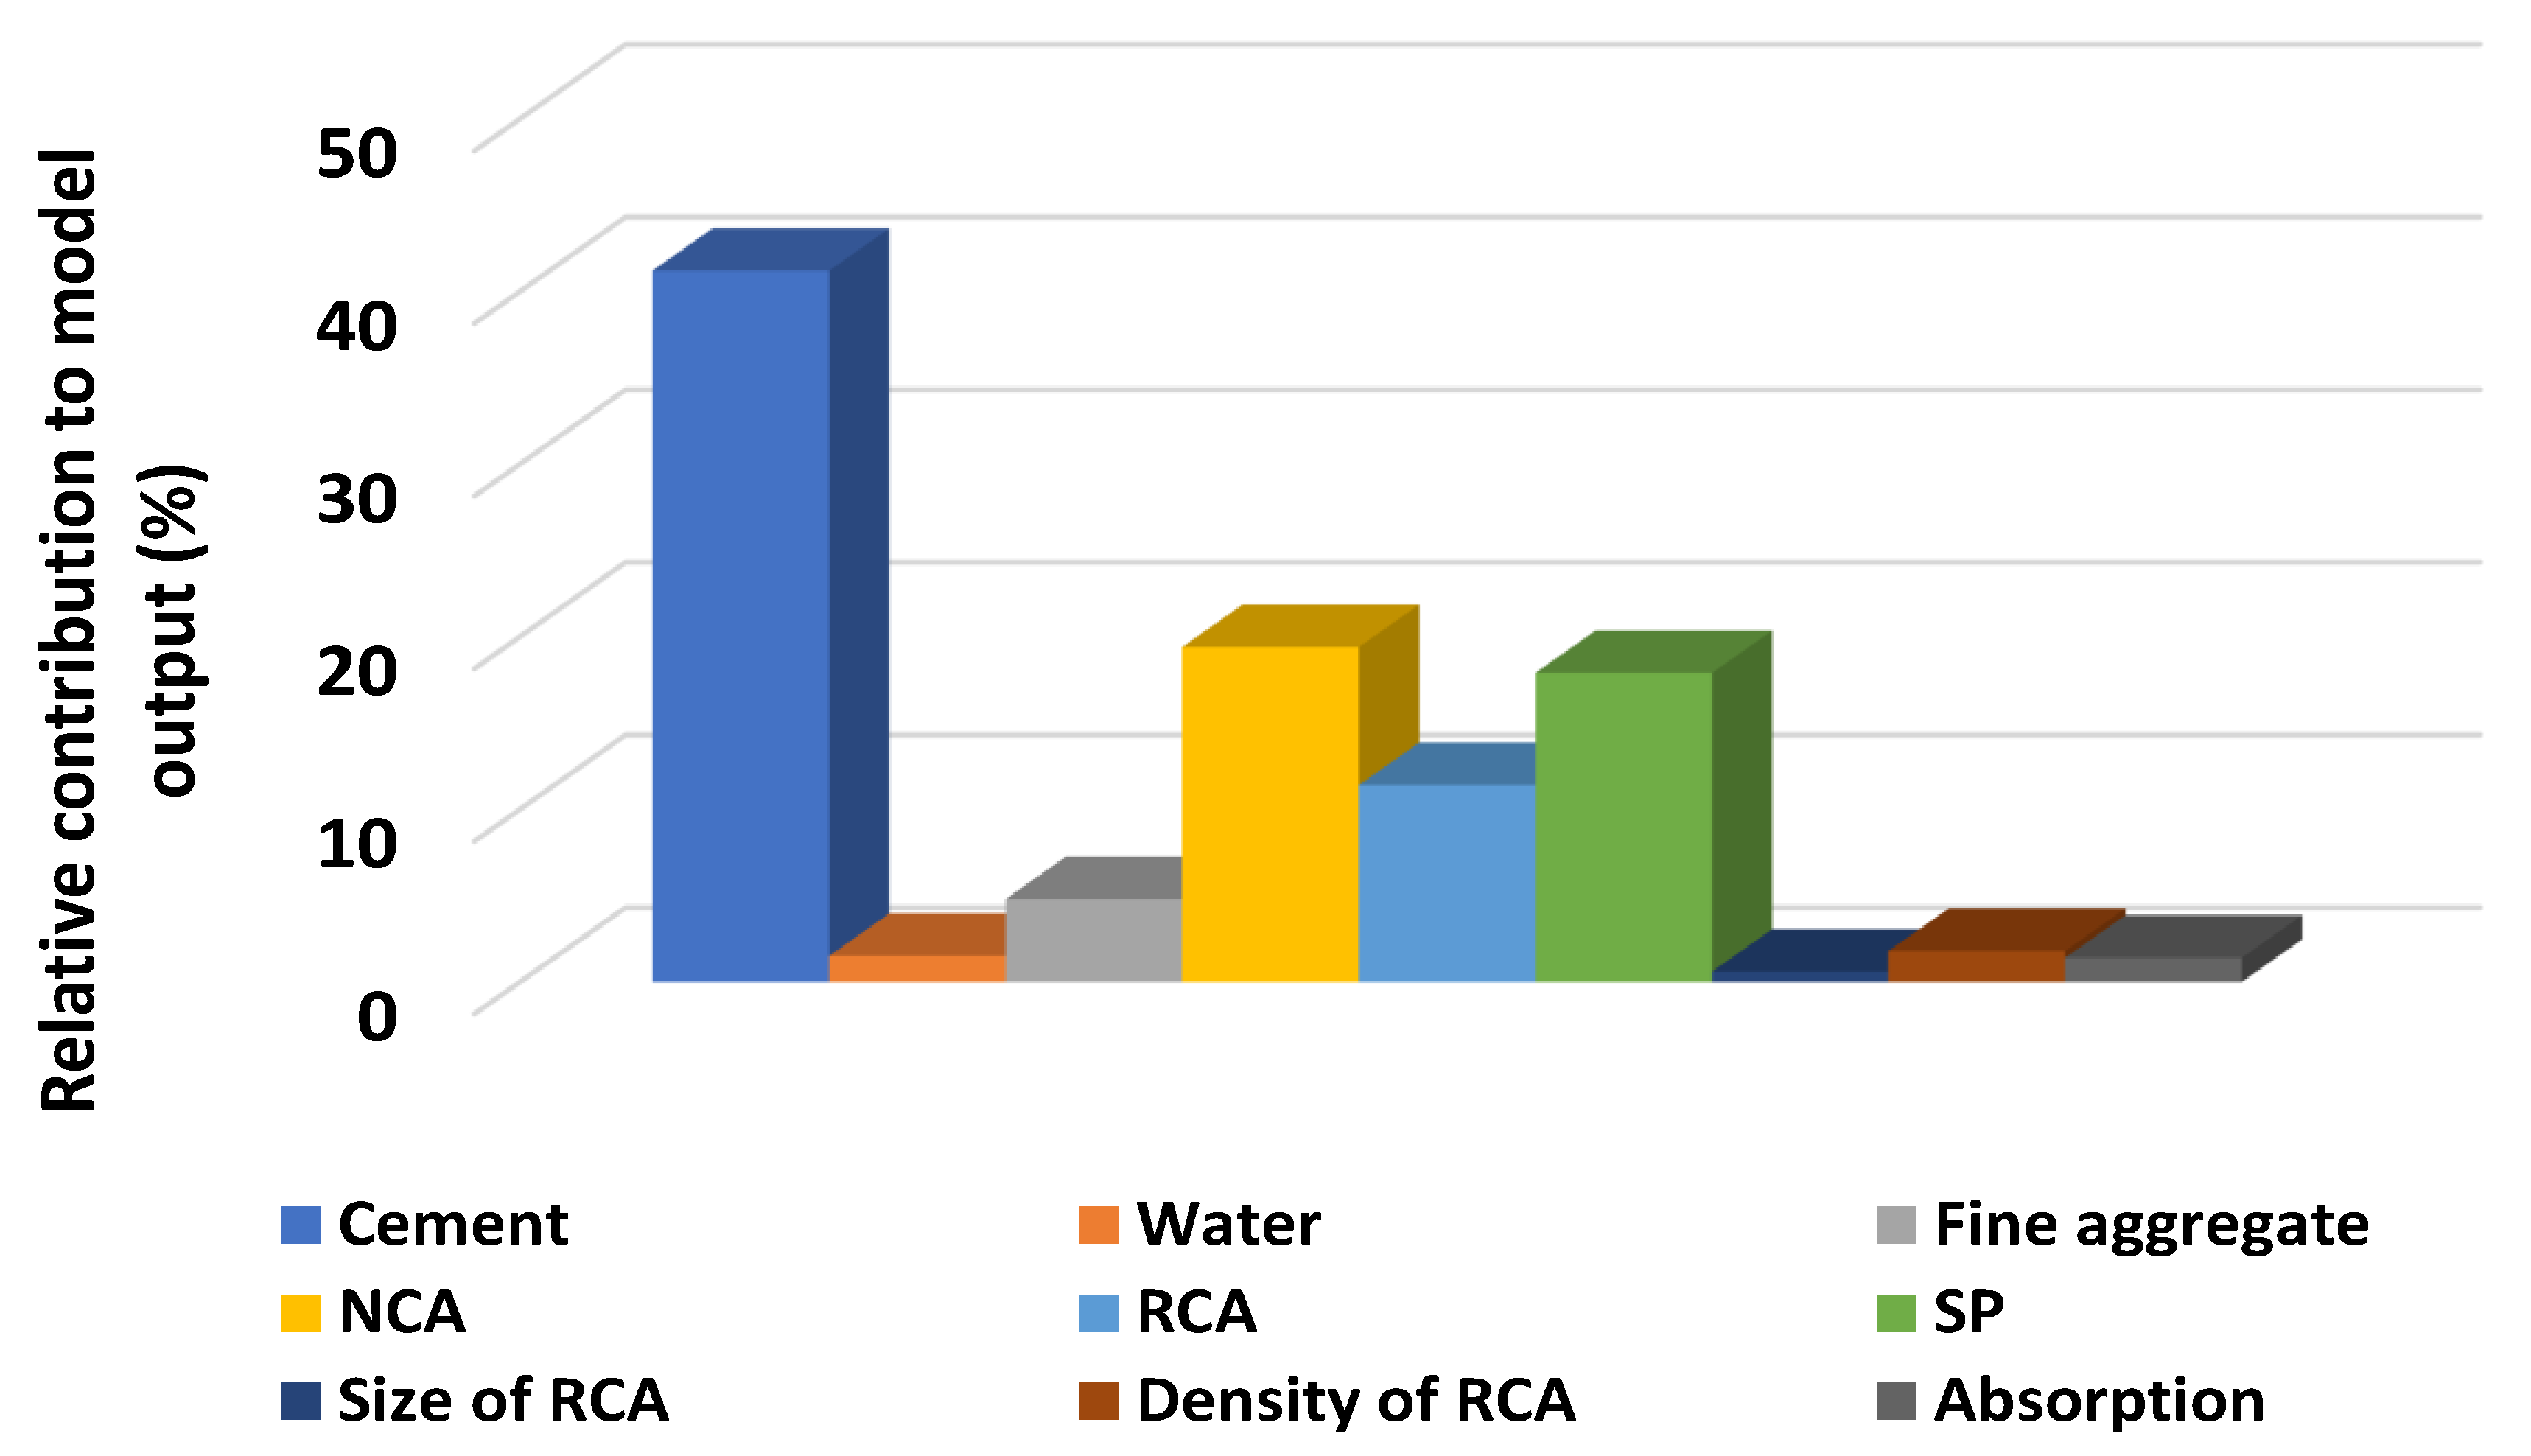
5. Sensitivity Analyses
6. Discussion
7. Conclusions and Future Recommendations
- The ensemble machine learning algorithm (AdaBoost) shows a better response with less variance towards the prediction of both the CS and splitting tensile strength of RCA-based concrete.
- The AdaBoost regressor gives the values of coefficient correlation (R2) for CS and STS of concrete equal to 0.95 and 0.92, respectively, as opposed to the values of R2 for DT equal to 0.93 (CS) and 0.90 (STS).
- The higher values of R2 for the AdaBoost regressor towards the prediction of both CS and STS indicate the high accuracy of the model.
- From the statistical checks, the lesser value of the errors (MAE, MSE, RMSE) also indicates high performance for the AdaBoost approach compared to the DT algorithm.
- The K-fold cross-validation method also confirms the high accuracy level of the AdaBoost algorithm.
- Sensitivity analysis reveals that the cement contributed effectively (32%) as compared to other parameters towards the forecasting of the CS of RCA-based concrete, while the superplasticizers were the higher contributor towards the prediction of the STS of concrete containing RCA.
Author Contributions
Funding
Institutional Review Board Statement
Informed Consent Statement
Data Availability Statement
Conflicts of Interest
Appendix A

| Water (kg/m3). | Cement (kg/m3) | Sand (kg/m3) | NCA (kg/m3) | RCA (kg/m3) | SP (kg/m3) | RCA Size (kg/m3) | Density (kg/m3) | Absorption (%) | CS (MPa) | STS (MPa) |
|---|---|---|---|---|---|---|---|---|---|---|
| 165 | 370 | 650 | 850.5 | 364.5 | 2.22 | 20 | 2400 | 4.9 | 50.6 | - |
| 165 | 370 | 650 | 607.5 | 607.5 | 2.22 | 20 | 2400 | 4.9 | 50.8 | - |
| 165 | 370 | 650 | - | 1215 | 2.22 | 20 | 2400 | 4.9 | 50.2 | - |
| 165 | 460 | 575 | 850.5 | 364.5 | 2.22 | 20 | 2400 | 4.9 | 60.8 | - |
| 165 | 460 | 575 | 607.5 | 607.5 | 2.22 | 20 | 2400 | 4.9 | 61.2 | - |
| 165 | 460 | 575 | - | 1215 | 2.22 | 20 | 2400 | 4.9 | 60.2 | - |
| 165 | 560 | 495 | 850.5 | 364.5 | 2.59 | 20 | 2400 | 4.9 | 70.2 | - |
| 165 | 560 | 495 | 607.5 | 607.5 | 2.59 | 20 | 2400 | 4.9 | 70.8 | - |
| 165 | 560 | 495 | - | 1215 | 2.59 | 20 | 2400 | 4.9 | 70 | - |
| 180 | 500 | 486.6 | - | 1135.4 | - | 16 | - | - | 44.5 | 4 |
| 180 | 500 | - | - | 1574.3 | - | 16 | - | - | 38.7 | 3.5 |
| 180 | 500 | 486.6 | - | 1135.4 | - | 16 | - | - | 46.1 | 3.4 |
| 180 | 500 | - | - | 1574.3 | - | 16 | - | - | 42.4 | 3.2 |
| 180 | 500 | 486.6 | - | 1135.4 | - | 16 | - | - | 52.5 | 4 |
| 180 | 500 | - | - | 1574.3 | - | 16 | - | - | 50.7 | 3.6 |
| 180 | 500 | 486.6 | - | 1135.4 | - | 16 | - | - | 45.2 | 3.5 |
| 180 | 500 | - | - | 1574.3 | - | 16 | - | - | 42 | 3.2 |
| 180 | 500 | 486.6 | - | 1135.4 | - | 16 | - | - | 49.6 | 3.8 |
| 180 | 500 | - | - | 1574.3 | - | 16 | - | - | 45.1 | 3.5 |
| 180 | 500 | 509.6 | - | 1135.4 | - | 16 | - | - | 54.4 | 4 |
| 180 | 500 | - | - | 1574.3 | - | 16 | - | - | 48.2 | 3.8 |
| 207.6 | 400 | 662 | 863 | 153 | - | 20 | 2410 | 5.8 | 38.1 | 3.7 |
| 207.6 | 400 | 662 | 697 | 298 | - | 20 | 2410 | 5.8 | 37 | 3.6 |
| 207.6 | 400 | 662 | 383 | 573 | - | 20 | 2410 | 5.8 | 35.8 | 3.4 |
| 207.6 | 400 | 662 | - | 903 | - | 20 | 2410 | 5.8 | 34.5 | 3.3 |
| 217 | 353 | 660 | 861 | 209 | - | 20 | 2330 | 6.3 | 44.9 | - |
| 229 | 353 | 647 | 527 | 513 | - | 20 | 2330 | 6.3 | 44.7 | - |
| 241 | 353 | 625 | - | 993 | - | 20 | 2330 | 6.3 | 46.8 | - |
| 230 | 353 | 661 | 853 | 202 | - | 20 | 2330 | 6.3 | 43.2 | - |
| 247 | 353 | 647 | 524 | 496 | - | 20 | 2330 | 6.3 | 39.7 | - |
| 271 | 353 | 625 | - | 959 | - | 20 | 2330 | 6.3 | 43.3 | - |
| 206 | 353 | 661 | 864 | 216 | - | 20 | 2330 | 6.3 | 43 | - |
| 207 | 353 | 649 | 531 | 531 | - | 20 | 2330 | 6.3 | 38.1 | - |
| 165 | 300 | 765 | 905 | 267 | 4.98 | 25 | 2430 | 4.4 | 42 | 3 |
| 165 | 318 | 739 | 608 | 537 | 6.042 | 25 | 2430 | 4.4 | 41 | 3.2 |
| 162 | 325 | 683 | - | 1123 | 6.175 | 25 | 2430 | 4.4 | 40 | 3.2 |
| 160.6 | 380 | 598 | 1182 | 52 | 4.9 | 20 | 2165 | 6.8 | 62.2 | - |
| 165.4 | 380 | 529 | 1175 | 103 | 4.9 | 20 | 2165 | 6.8 | 58.4 | - |
| 170.2 | 380 | 460 | 1168 | 154 | 4.9 | 20 | 2165 | 6.8 | 61.3 | 3.7 |
| 175.6 | 380 | 327 | 1162 | 254 | 4.9 | 20 | 2165 | 6.8 | 60.8 | - |
| 180.9 | 380 | - | 1162 | 509 | 4.9 | 20 | 2165 | 6.8 | 61 | 3 |
| 225 | 410 | 642 | 840 | 204 | - | 20 | 2570 | 3.5 | 45.3 | - |
| 225 | 410 | 642 | 524 | 506 | - | 20 | 2570 | 3.5 | 42.5 | - |
| 225 | 410 | 642 | 210 | 814 | - | 20 | 2570 | 3.5 | 39.2 | - |
| 225 | 410 | 642 | - | 1017 | - | 20 | 2570 | 3.5 | 37.1 | - |
| 180 | 400 | 708 | 886 | 215 | - | 20 | 2570 | 3.5 | 62.4 | 3.2 |
| 180 | 400 | 708 | 554 | 538 | - | 20 | 2570 | 3.5 | 55.8 | 3 |
| 180 | 400 | 708 | - | 1075 | - | 20 | 2570 | 3.5 | 42 | 2.8 |
| 225 | 410 | 642 | 840 | 204 | - | 20 | 2570 | 3.5 | 45.3 | 3.2 |
| 225 | 410 | 642 | 524 | 506 | - | 20 | 2570 | 3.5 | 42.5 | 3.2 |
| 225 | 410 | 642 | - | 1017 | - | 20 | 2570 | 3.5 | 38.1 | 3.1 |
| 234 | 360 | 705 | - | 1100 | - | 19 | 2390 | 4.4 | 22.1 | - |
| 190 | 380 | 705 | - | 1100 | - | 19 | 2390 | 4.4 | 25.1 | - |
| 192 | 400 | 705 | - | 1100 | - | 19 | 2390 | 4.4 | 27.2 | - |
| 181 | 420 | 705 | - | 1100 | - | 19 | 2390 | 4.4 | 28.7 | - |
| 184 | 460 | 705 | - | 1100 | - | 19 | 2390 | 4.4 | 29.5 | - |
| 178 | 264 | 835 | - | 1030 | - | 30 | 2520 | 3.8 | 18 | - |
| 174 | 262 | 830 | - | 1020 | - | 30 | 2510 | 3.9 | 15.4 | - |
| 148 | 427 | 760 | - | 1000 | 4.2 | 30 | 2520 | 3.8 | 36.4 | - |
| 153 | 423 | 755 | - | 990 | 4.1 | 30 | 2510 | 3.9 | 35.7 | - |
| 152 | 443 | 855 | - | 885 | 3.9 | 30 | 2520 | 3.8 | 44.4 | - |
| 225 | 410 | 642 | 840 | 204 | - | 20 | 2580 | 3.5 | 45.3 | 3.6 |
| 225 | 410 | 642 | 524 | 506 | - | 20 | 2580 | 3.5 | 42.5 | 3.4 |
| 225 | 410 | 642 | - | 1017 | - | 20 | 2580 | 3.5 | 38.1 | 3.3 |
| 205 | 410 | 662 | 865 | 210 | - | 20 | 2580 | 3.5 | 51.7 | 3.6 |
| 205 | 410 | 662 | 541 | 525 | - | 20 | 2580 | 3.5 | 47.1 | 3.6 |
| 205 | 410 | 662 | - | 1049 | - | 20 | 2580 | 3.5 | 43.4 | 3.4 |
| 180 | 400 | 708 | 886 | 215 | 5.6 | 20 | 2580 | 3.5 | 62.4 | 3.7 |
| 180 | 400 | 708 | 554 | 538 | 5.6 | 20 | 2580 | 3.5 | 56.8 | 3.7 |
| 180 | 400 | 708 | - | 1075 | 5.6 | 20 | 2580 | 3.5 | 52.1 | 3.5 |
| 160 | 400 | 729 | 912 | 221 | 7.8 | 20 | 2580 | 3.5 | 69.6 | 4.1 |
| 160 | 400 | 729 | 570 | 554 | 7.8 | 20 | 2580 | 3.5 | 65.3 | 4 |
| 160 | 400 | 729 | - | 1107 | 7.8 | 20 | 2580 | 3.5 | 58.5 | 3.8 |
| 175 | 350 | 730 | 711 | 297 | 1.68 | 25 | 2530 | 1.9 | 36.7 | 4.2 |
| 175 | 350 | 730 | 508 | 494 | 1.68 | 25 | 2530 | 1.9 | 38 | 4 |
| 175 | 350 | 730 | - | 989 | 1.68 | 25 | 2530 | 1.9 | 36 | 3.8 |
| 175 | 350 | 730 | 711 | 282 | 1.68 | 25 | - | - | 32.6 | 3.6 |
| 175 | 350 | 730 | 508 | 469 | 1.68 | 25 | 2400 | 6.2 | 30.4 | 3.4 |
| 175 | 350 | 730 | - | 938 | 1.68 | 25 | 2400 | 6.2 | 29.5 | 3.2 |
| 190 | 380 | 744.45 | 756.97 | 189.24 | 2.66 | 20 | 2338 | 5.2 | 47.4 | - |
| 190 | 380 | 709.54 | 471.13 | 471.12 | 2.66 | 20 | 2338 | 5.2 | 47.3 | - |
| 190 | 380 | 714.56 | - | 874.04 | 5.32 | 20 | 2338 | 5.2 | 54.8 | - |
| 140 | 350 | 732 | 519 | 556 | 4.2 | 12 | 2420 | 6.8 | 43.3 | - |
| 153 | 340 | 723 | 512 | 549 | 3.4 | 12 | 2400 | 6.8 | 39.6 | - |
| 165 | 330 | 715 | 507 | 543 | 2.64 | 12 | 2400 | 6.8 | 38.1 | - |
| 176 | 320 | 708 | 502 | 537 | 1.92 | 12 | 2400 | 6.8 | 34.5 | - |
| 186 | 310 | 702 | 497 | 533 | 1.24 | 12 | 2400 | 6.8 | 31.6 | - |
| 140 | 350 | 732 | 553 | 523 | 4.2 | 22 | 2420 | 8.8 | 46.1 | - |
| 153 | 340 | 723 | 547 | 517 | 3.4 | 22 | 2420 | 8.8 | 45.8 | - |
| 165 | 330 | 715 | 541 | 511 | 2.64 | 22 | 2420 | 8.8 | 39.9 | - |
| 176 | 320 | 708 | 535 | 506 | 1.92 | 22 | 2420 | 8.8 | 36.3 | - |
| 186 | 310 | 702 | 531 | 501 | 1.24 | 22 | 2420 | 8.8 | 34.7 | - |
| 186 | 372 | 617.65 | 1030.22 | 257.56 | - | 20 | 2400 | - | 27.2 | 3.1 |
| 186 | 372 | 617.65 | 772.67 | 515.55 | - | 20 | 2400 | - | 26.5 | 2.8 |
| 186 | 372 | 617.65 | 515.11 | 772.67 | - | 20 | 2400 | - | 25.4 | 2.7 |
| 186 | 372 | 617.65 | 257.56 | 1030.22 | - | 20 | 2400 | - | 25.1 | 2.2 |
| 186 | 372 | 494.12 | 128.78 | 123.53 | - | 20 | 2630 | - | 26.4 | 2.6 |
| 186 | 372 | 370.59 | 128.78 | 247.06 | - | 20 | 2630 | - | 25.9 | 2.5 |
| 186 | 372 | 247.06 | 128.78 | 370.59 | - | 20 | 2630 | - | 23.5 | 2.3 |
| 186 | 372 | 123.53 | 128.78 | 494.12 | - | 20 | 2630 | - | 15.4 | 2 |
| 200 | 270 | 750 | 675 | 200 | 1.08 | 19 | 2440 | 5.8 | 18.5 | 1.9 |
| 210 | 270 | 750 | 450 | 400 | 1.35 | 19 | 2440 | 5.8 | 18 | 1.9 |
| 220 | 270 | 750 | 225 | 600 | 1.62 | 19 | 2440 | 5.8 | 16.5 | 1.4 |
| 165 | 370 | 865 | 760 | 230 | 1.48 | 19 | 2440 | 5.8 | 33 | 3.1 |
| 165 | 370 | 865 | 505 | 455 | 1.85 | 19 | 2440 | 5.8 | 34.5 | 3.1 |
| 165 | 370 | 865 | 250 | 680 | 2.59 | 19 | 2440 | 5.8 | 34 | 2.9 |
| 178.5 | 275 | 938.05 | 723.07 | 180.77 | 1.925 | 16 | 2400 | 5 | 31.7 | 2.4 |
| 178.5 | 275 | 962.73 | 423.77 | 423.77 | 1.925 | 16 | 2400 | 5 | 32.4 | 2.5 |
| 178.5 | 275 | 1005.18 | - | 756.46 | 1.925 | 16 | 2400 | 5 | 30.1 | 2.6 |
| 190 | 380 | 794.31 | 750.04 | 187.57 | 2.66 | 16 | 2400 | 5 | 43.7 | 3.1 |
| 190 | 380 | 811.37 | 443.71 | 443.71 | 2.66 | 16 | 2400 | 5 | 37.5 | 2.9 |
| 190 | 380 | 838.29 | - | 807.97 | 2.66 | 16 | 2400 | 5 | 40.5 | 2.9 |
| 151 | 335 | 630 | 414 | 720 | 1.266 | 19 | 2420 | 5.4 | 41.4 | - |
| 156 | 349 | 888 | - | 792 | 1.67616 | 19 | 2420 | 5.4 | 43.9 | - |
| 161 | 358 | 645 | 281 | 813 | 1.3584 | 19 | 2500 | 3.3 | 44.8 | - |
| 156 | 349 | 857 | - | 867 | 1.2564 | 19 | 2500 | 3.3 | 45.9 | - |
| 172.43 | 401 | 574 | 911 | 303 | 0.2005 | 20 | 2661 | 1.9 | 47 | 2.3 |
| 172.43 | 401 | 574 | 585 | 585 | 0.70175 | 20 | 2602 | 2.6 | 46 | 2.1 |
| 172.43 | 401 | 574 | - | 1119 | 0.90225 | 20 | 2510 | 3.9 | 42.5 | 2 |
| 190.8 | 424 | 770 | - | 980 | - | 19 | 2490 | 4.8 | 41 | - |
| 192.5 | 350 | 800 | - | 1015 | - | 19 | 2490 | 4.8 | 33.3 | - |
| 191.75 | 295 | 814 | - | 1039 | - | 19 | 2490 | 4.8 | 24.8 | - |
| 150 | 250 | 762 | 858 | 286 | 4.375 | 19 | - | - | 26.7 | 2.2 |
| 150 | 250 | 753 | 564 | 564 | 4.375 | 19 | - | - | 21.5 | 1.8 |
| 150 | 250 | 743 | 279 | 836 | 4.375 | 19 | - | - | 21.4 | 1.4 |
| 150 | 250 | 734 | - | 1100 | 4.375 | 19 | - | - | 20 | 1.2 |
| 180 | 400 | 685 | 770 | 257 | 3 | 19 | - | - | 38.3 | 3.1 |
| 180 | 400 | 676 | 507 | 507 | 3 | 19 | - | - | 37 | 2.7 |
| 180 | 400 | 667 | 250 | 751 | 3 | 19 | - | - | 35 | 2.5 |
| 180 | 400 | 659 | - | 988 | 3 | 19 | - | - | 33.3 | 2.1 |
| 175 | 325 | - | - | 1762 | 3.45 | 32 | 2263 | 6 | 33.2 | - |
| 222 | 350 | - | - | 1778 | 4.5 | 32 | 2283 | 4.2 | 35.6 | - |
| 221 | 350 | - | - | 1771 | 4.5 | 32 | 2292 | 4.3 | 34.6 | - |
| 195 | 325 | - | - | 1710 | 3.25 | 32 | 2301 | 5 | 37.3 | - |
| 123 | 300 | - | 192 | 1728 | 3 | 32 | 2609 | 1.5 | 45.4 | - |
| 144 | 325 | - | 768 | 1152 | 3.25 | 32 | 2518 | 2.7 | 54.3 | - |
| 123 | 325 | - | 754.4 | 1131.6 | 3.25 | 32 | 2584 | 1.6 | 54.4 | - |
| 132 | 300 | - | 1448.25 | 482.75 | 3 | 32 | 2594 | 1.6 | 53.4 | - |
| 180 | 275 | 625 | 882 | 378 | - | 20 | 2340 | 5.3 | 20 | - |
| 180 | 295 | 595 | 635 | 635 | - | 20 | 2340 | 5.3 | 19 | - |
| 180 | 310 | 610 | - | 1240 | - | 20 | 2340 | 5.3 | 18 | - |
| 180 | 330 | 585 | 872 | 373 | - | 20 | 2340 | 5.3 | 23 | - |
| 180 | 355 | 560 | 623 | 623 | - | 20 | 2340 | 5.3 | 24 | - |
| 180 | 372 | 536 | - | 1252 | - | 20 | 2340 | 5.3 | 21 | - |
| 180 | 355 | 560 | 872 | 373 | - | 20 | 2340 | 5.3 | 25 | - |
| 180 | 385 | 550 | 613 | 613 | - | 20 | 2340 | 5.3 | 29 | - |
| 180 | 409 | 525 | - | 1226 | - | 20 | 2340 | 5.3 | 30 | - |
| 180 | 375 | 544 | 869 | 372 | - | 20 | 2340 | 5.3 | 39 | - |
| 180 | 405 | 508 | 624 | 624 | - | 20 | 2340 | 5.3 | 31 | - |
| 180 | 426 | 494 | - | 1241 | - | 20 | 2340 | 5.3 | 34 | - |
| 193 | 350 | 661 | 1061 | 57 | - | 12 | 2010 | 10.9 | 40 | 2.9 |
| 194 | 350 | 515 | 1061 | 170 | - | 12 | 2010 | 10.9 | 38.6 | 2.7 |
| 196 | 350 | 368 | 1061 | 283 | - | 12 | 2010 | 10.9 | 37.6 | 2.6 |
| 199 | 158 | - | 1061 | 566 | - | 12 | 2010 | 10.9 | 38.6 | 2.5 |
| 158 | 350 | 693 | 1111 | 59 | 3.5 | 12 | 2010 | 10.9 | 53.7 | 3.4 |
| 163 | 350 | 536 | 1105 | 177 | 3.5 | 12 | 2010 | 10.9 | 51 | 3.3 |
| 168 | 350 | 381 | 1100 | 294 | 3.5 | 12 | 2010 | 10.9 | 47.8 | 3.1 |
| 178 | 350 | - | 1089 | 582 | 3.5 | 12 | 2010 | 10.9 | 45.1 | 3 |
| 137 | 350 | 713 | 1143 | 61 | 3.5 | 12 | 2010 | 10.9 | 64.6 | 4.2 |
| 139 | 350 | 555 | 1143 | 183 | 3.5 | 12 | 2010 | 10.9 | 65.4 | 4.5 |
| 143 | 350 | 395 | 1138 | 304 | 3.5 | 12 | 2010 | 10.9 | 63.2 | 3.7 |
| 150 | 350 | - | 1132 | 605 | 3.5 | 12 | 2010 | 10.9 | 63 | 3.4 |
| 180 | 281 | 802 | - | 970 | - | 10 | 2360 | 4.7 | 38.6 | 3.5 |
| 170 | 293 | 648 | - | 919 | - | 10 | 2280 | 6.2 | 38.1 | 3.1 |
| 165 | 337 | 841 | - | 879 | - | 10 | 2220 | 7.8 | 39.3 | 3.3 |
| 190 | 463 | 621 | - | 970 | - | 10 | 2360 | 4.7 | 60.1 | 3.8 |
| 190 | 500 | 621 | - | 919 | 3.24 | 10 | 2280 | 6.2 | 60.2 | 3.7 |
| 180 | 600 | 567 | - | 879 | 5.04 | 10 | 2220 | 7.8 | 62.8 | 3.7 |
| 220 | 537 | 693 | 782 | 138 | - | 20 | 2330 | 4.4 | 50.8 | - |
| 220 | 537 | 693 | 644 | 276 | - | 20 | 2330 | 4.4 | 44.9 | - |
| 220 | 537 | 693 | 506 | 414 | - | 20 | 2330 | 4.4 | 44.6 | - |
| 220 | 537 | 693 | 368 | 552 | - | 20 | 2330 | 4.4 | 42.4 | - |
| 220 | 537 | 693 | 782 | 138 | - | 20 | 2370 | 4 | 54 | - |
| 220 | 537 | 693 | 644 | 276 | - | 20 | 2370 | 4 | 56 | - |
| 220 | 537 | 693 | 506 | 414 | - | 20 | 2370 | 4 | 54.4 | - |
| 220 | 537 | 693 | 368 | 552 | - | 20 | 2370 | 4 | 40.6 | - |
| 220 | 537 | 693 | 782 | 138 | - | 20 | 2390 | 3.6 | 55.2 | - |
| 220 | 537 | 693 | 644 | 276 | - | 20 | 2390 | 3.6 | 53.5 | - |
| 220 | 537 | 693 | 506 | 414 | - | 20 | 2390 | 3.6 | 56.9 | - |
| 220 | 537 | 693 | 368 | 552 | - | 20 | 2390 | 3.6 | 54.7 | - |
| 220 | 537 | 693 | 782 | 138 | - | 20 | 2320 | 4.6 | 50.5 | - |
| 220 | 537 | 693 | 644 | 276 | - | 20 | 2320 | 4.6 | 48.9 | - |
| 220 | 537 | 693 | 506 | 414 | - | 20 | 2320 | 4.6 | 45.8 | - |
| 220 | 537 | 693 | 368 | 552 | - | 20 | 2320 | 4.6 | 40 | - |
| 220 | 537 | 693 | 782 | 138 | - | 20 | 2390 | 3.7 | 54.4 | - |
| 220 | 537 | 693 | 644 | 276 | - | 20 | 2390 | 3.7 | 50.2 | - |
| 220 | 537 | 693 | 506 | 414 | - | 20 | 2390 | 3.7 | 49.5 | - |
| 220 | 537 | 693 | 368 | 552 | - | 20 | 2390 | 3.7 | 40.4 | - |
| 220 | 537 | 693 | 782 | 138 | - | 20 | 2390 | 3.5 | 45 | - |
| 220 | 537 | 693 | 644 | 276 | - | 20 | 2390 | 3.5 | 46.9 | - |
| 220 | 537 | 693 | 506 | 414 | - | 20 | 2390 | 3.5 | 51.4 | - |
| 220 | 537 | 693 | 368 | 552 | - | 20 | 2390 | 3.5 | 53.2 | - |
| 220 | 537 | 693 | 782 | 138 | - | 20 | 2380 | 3.8 | 55.3 | - |
| 220 | 537 | 693 | 644 | 276 | - | 20 | 2380 | 3.8 | 55.9 | - |
| 220 | 537 | 693 | 506 | 414 | - | 20 | 2380 | 3.8 | 52.6 | - |
| 220 | 537 | 693 | 368 | 552 | - | 20 | 2380 | 3.8 | 48 | - |
| 220 | 537 | 693 | 782 | 138 | - | 20 | 2380 | 3.8 | 49.1 | - |
| 220 | 537 | 693 | 644 | 276 | - | 20 | 2380 | 3.8 | 49.9 | - |
| 220 | 537 | 693 | 506 | 414 | - | 20 | 2380 | 3.8 | 50.3 | - |
| 220 | 537 | 693 | 368 | 552 | - | 20 | 2380 | 3.8 | 47.5 | - |
| 220 | 537 | 693 | 782 | 138 | - | 20 | 2400 | 3.5 | 43.2 | - |
| 220 | 537 | 693 | 644 | 276 | - | 20 | 2400 | 3.5 | 53.7 | - |
| 220 | 537 | 693 | 506 | 414 | - | 20 | 2400 | 3.5 | 50 | - |
| 220 | 537 | 693 | 368 | 552 | - | 20 | 2400 | 3.5 | 43.3 | - |
| 220 | 537 | 693 | 782 | 138 | - | 20 | 2370 | 4 | 52.9 | - |
| 220 | 537 | 693 | 644 | 276 | - | 20 | 2370 | 4 | 49.9 | - |
| 220 | 537 | 693 | 506 | 414 | - | 20 | 2370 | 4 | 53.7 | - |
| 220 | 537 | 693 | 368 | 552 | - | 20 | 2370 | 4 | 46 | - |
| 206 | 413 | 606 | - | 987 | - | 25 | 2452 | 4.1 | 51 | - |
| 206 | 413 | 606 | - | 987 | - | 25 | 2452 | 4.1 | 49 | - |
| 206 | 413 | 606 | - | 987 | - | 25 | 2452 | 4.1 | 48 | - |
| 206 | 413 | 606 | 537 | 494 | - | 25 | 2452 | 4.1 | 51 | - |
| 206 | 413 | 606 | 537 | 494 | - | 25 | 2452 | 4.1 | 51 | - |
| 206 | 413 | 606 | 537 | 494 | - | 25 | 2452 | 4.1 | 51 | - |
| 206 | 413 | 606 | 805 | 245 | - | 25 | 2452 | 4.1 | 52 | - |
| 206 | 413 | 606 | 805 | 245 | - | 25 | 2452 | 4.1 | 50 | - |
| 206 | 413 | 606 | 805 | 245 | - | 25 | 2452 | 4.1 | 49 | - |
| 145.6 | 520 | 577.2 | - | 1040 | - | 25 | 2260 | 7.5 | 38.3 | - |
| 145.6 | 520 | 577.2 | - | 1040 | - | 25 | 2260 | 7.5 | 32.9 | - |
| 119.6 | 520 | 577.2 | - | 1040 | - | 25 | 2260 | 7.5 | 33.2 | - |
| 146.2 | 430 | 653.6 | - | 1032 | - | 25 | 2260 | 7.5 | 31.3 | - |
| 146.2 | 430 | 653.6 | - | 1032 | - | 25 | 2260 | 7.5 | 28.4 | - |
| 120.4 | 430 | 653.6 | - | 1032 | - | 25 | 2260 | 7.5 | 28 | - |
| 145.77 | 339 | 728.85 | - | 1050.9 | - | 25 | 2260 | 7.5 | 26.5 | - |
| 145.77 | 339 | 728.85 | - | 1050.9 | - | 25 | 2260 | 7.5 | 23.3 | - |
| 118.65 | 339 | 728.85 | - | 1050.9 | - | 25 | 2260 | 7.5 | 21.6 | - |
| 144.06 | 294 | 767.34 | - | 1029 | - | 25 | 2260 | 7.5 | 21.6 | - |
| 144.06 | 294 | 767.34 | - | 1029 | - | 25 | 2260 | 7.5 | 18 | - |
| 117.6 | 294 | 767.34 | - | 1029 | - | 25 | 2260 | 7.5 | 18.8 | - |
| 146.91 | 249 | 804.27 | - | 1045.8 | - | 25 | 2260 | 7.5 | 16.1 | - |
| 146.91 | 249 | 804.27 | - | 1045.8 | - | 25 | 2260 | 7.5 | 13.4 | - |
| 119.52 | 249 | 804.27 | - | 1045.8 | - | 25 | 2260 | 7.5 | 13.9 | - |
| 179 | 275 | 878 | 735 | 184 | - | 20 | 2320 | 5.3 | 41 | 2.8 |
| 179 | 275 | 849 | 455 | 455 | - | 20 | 2320 | 5.3 | 44 | 3.1 |
| 179 | 275 | 868 | - | 830 | - | 20 | 2320 | 5.3 | 45 | 2.4 |
| 190 | 380 | 744 | 757 | 189 | - | 20 | 2320 | 5.3 | 50.5 | 3.5 |
| 190 | 380 | 710 | 471 | 471 | - | 20 | 2320 | 5.3 | 45 | 2.7 |
| 190 | 380 | 715 | - | 874 | - | 20 | 2320 | 5.3 | 56 | 3.7 |
| 179 | 275 | 961 | 740 | 185 | - | 20 | 2320 | 5.3 | 33.5 | 2.5 |
| 179 | 275 | 978 | 408 | 408 | - | 20 | 2320 | 5.3 | 32 | 2.5 |
| 179 | 275 | 1010 | - | 640 | - | 20 | 2320 | 5.3 | 32 | 2.3 |
| 190 | 380 | 813 | 767 | 192 | - | 20 | 2320 | 5.3 | 44 | 2.8 |
| 190 | 380 | 822 | 426 | 427 | - | 20 | 2320 | 5.3 | 41 | 2.6 |
| 190 | 380 | 836 | - | 683 | - | 20 | 2320 | 5.3 | 41.5 | 2.3 |
| 179 | 325 | 799 | 839 | 210 | - | 20 | 2320 | 5.3 | 44 | 2.8 |
| 179 | 325 | 831 | 490 | 490 | - | 20 | 2320 | 5.3 | 41 | 2.7 |
| 179 | 325 | 825 | - | 923 | - | 20 | 2320 | 5.3 | 33.5 | 2.3 |
| 173 | 385 | 698 | 892 | 223 | - | 20 | 2320 | 5.3 | 53.5 | 3.1 |
| 173 | 385 | 742 | 515 | 515 | - | 20 | 2320 | 5.3 | 54 | 3.9 |
| 173 | 385 | 746 | - | 963 | - | 20 | 2320 | 5.3 | 40 | 2.4 |
| 159.6 | 380 | 862.4 | 489.3 | 489.3 | 5.7 | 20 | 2330 | 6.1 | 41.6 | - |
| 193.8 | 380 | 934.1 | - | 867.7 | 6.46 | 20 | 2330 | 6.1 | 31.4 | - |
| 197.6 | 380 | 862.4 | 489.3 | 489.3 | 5.7 | 20 | 2330 | 6.1 | 35.5 | - |
| 231.8 | 380 | 934.1 | - | 867.7 | 6.46 | 20 | 2330 | 6.1 | 26 | - |
| 167.2 | 380 | 862.4 | 489.3 | 489.3 | 5.7 | 20 | 2320 | 5.8 | 44.6 | - |
| 193.8 | 380 | 934.1 | - | 867.7 | 6.46 | 20 | 2320 | 5.8 | 36.7 | - |
| 235.6 | 380 | 934.1 | - | 867.7 | 6.46 | 20 | 2320 | 5.8 | 29.5 | - |
| 155.8 | 380 | 818.5 | 840.9 | 210.2 | 4.56 | 20 | 2360 | 3.9 | 46.1 | - |
| 159.6 | 380 | 862.4 | 489.3 | 489.3 | 5.7 | 20 | 2360 | 3.9 | 45.1 | - |
| 171 | 380 | 934.1 | - | 867.7 | 6.46 | 20 | 2360 | 3.9 | 42.9 | - |
| 190 | 380 | 818.5 | 840.9 | 210.2 | 4.56 | 20 | 2360 | 3.9 | 39.3 | - |
| 197.6 | 380 | 862.4 | 489.3 | 489.3 | 5.7 | 20 | 2360 | 3.9 | 39.5 | - |
| 205.2 | 380 | 934.1 | - | 867.7 | 6.46 | 20 | 2360 | 3.9 | 37.7 | - |
| 159.6 | 380 | 818.5 | 840.9 | 210.2 | 4.56 | 20 | 2350 | 4.5 | 48.1 | - |
| 163.4 | 380 | 862.4 | 489.3 | 489.3 | 5.7 | 20 | 2350 | 4.5 | 41 | - |
| 152 | 380 | 934.1 | - | 867.7 | 6.46 | 20 | 2350 | 4.5 | 38.7 | - |
| 193.8 | 380 | 818.5 | 840.9 | 210.2 | 4.56 | 20 | 2350 | 4.5 | 42.7 | - |
| 197.6 | 380 | 862.4 | 489.3 | 489.3 | 5.7 | 20 | 2350 | 4.5 | 35.4 | - |
| 190 | 380 | 934.1 | - | 867.7 | 6.46 | 20 | 2350 | 4.5 | 31.4 | - |
| 159.6 | 380 | 818.5 | 840.9 | 210.2 | 4.56 | 20 | 2350 | 4.7 | 48.5 | - |
| 159.6 | 380 | 862.4 | 489.3 | 489.3 | 5.7 | 20 | 2350 | 4.7 | 45.4 | - |
| 163.4 | 380 | 934.1 | - | 867.7 | 6.46 | 20 | 2350 | 4.7 | 37 | - |
| 197.6 | 380 | 818.5 | 840.9 | 210.2 | 4.56 | 20 | 2350 | 4.7 | 41.3 | 0- |
| 197.6 | 380 | 862.4 | 489.3 | 489.3 | 5.7 | 20 | 2350 | 4.7 | 36.8 | - |
| 212.8 | 380 | 934.1 | - | 867.7 | 6.46 | 20 | 2350 | 4.7 | 31.2 | - |
| 159.8 | 340 | 556 | 1020 | 238 | - | 20 | 2336 | 3.6 | 50 | - |
| 159.8 | 340 | 556 | 638 | 596 | - | 20 | 2315 | 3.6 | 45.3 | - |
| 159.8 | 340 | 556 | 319 | 894 | - | 20 | 2295 | 3.6 | 44 | - |
| 137.1 | 380 | 927 | 869.2 | 202 | - | 10 | 2470 | 3.7 | 108 | 5.7 |
| 146.5 | 380 | 927 | 543.2 | 505.1 | - | 10 | 2470 | 3.7 | 104.8 | 5 |
| 162.3 | 380 | 927 | - | 1010.2 | - | 10 | 2470 | 3.7 | 108.5 | 5.1 |
| 138.2 | 380 | 927 | 869.2 | 195 | - | 10 | 2390 | 4.9 | 102.5 | 6.3 |
| 149.8 | 380 | 927 | 543.2 | 487.5 | - | 10 | 2390 | 4.9 | 103.1 | 5.1 |
| 170.4 | 380 | 927 | - | 975.1 | - | 10 | 2390 | 4.9 | 100.8 | 5.9 |
| 139.7 | 380 | 927 | 869.2 | 187.8 | - | 10 | 2300 | 5.9 | 104.3 | 5.3 |
| 153.1 | 380 | 927 | 543.4 | 469.4 | - | 10 | 2300 | 5.9 | 96.8 | 6.2 |
| 175 | 380 | 927 | - | 938.8 | - | 10 | 2300 | 5.9 | 91.2 | 4.2 |
| 185.4 | 309 | 864 | 848 | 211 | 1.0197 | 16 | 2380 | 6.9 | 42.9 | - |
| 191.7 | 320 | 817.5 | 538 | 538 | 1.056 | 16 | 2380 | 6.9 | 42.5 | - |
| 201.6 | 336 | 785 | - | 1060 | 1.1088 | 16 | 2380 | 6.9 | 40.9 | - |
| 192.5 | 386 | 829 | 808 | 202 | 2.0458 | 16 | 2380 | 6.9 | 51.6 | - |
| 200 | 399 | 795 | 504 | 504 | 2.1147 | 16 | 2380 | 6.9 | 51.6 | - |
| 210 | 420 | 738 | - | 1014 | 2.226 | 16 | 2380 | 6.9 | 50.3 | - |
| 205 | 300 | 697 | - | 1075 | - | 20 | 2450 | 3.1 | 35 | 2.5 |
| 205 | 300 | 697 | - | 1027 | - | 20 | 2370 | 7.1 | 29.2 | 2.4 |
| 205 | 300 | 697 | - | 1027 | - | 20 | 2360 | 7.8 | 27.7 | 1.9 |
| 180 | 350 | 706 | - | 1089 | - | 20 | 2450 | 3.1 | 47.6 | 3.4 |
| 180 | 350 | 706 | - | 1041 | - | 20 | 2370 | 7.1 | 42 | 2.6 |
| 180 | 350 | 706 | - | 1041 | - | 20 | 2360 | 7.8 | 42.9 | 2.6 |
| 185 | 425 | 696 | - | 1028 | - | 20 | 2450 | 3.1 | 60 | 3.9 |
| 185 | 425 | 696 | - | 982 | - | 20 | 2370 | 7.1 | 53.7 | 3.7 |
| 185 | 425 | 696 | - | 982 | - | 20 | 2360 | 7.8 | 53.2 | 3.4 |
| 165 | 485 | 685 | - | 1039 | - | 20 | 2450 | 3.1 | 78.2 | 4.7 |
| 165 | 485 | 685 | - | 979 | - | 20 | 2370 | 7.1 | 71.2 | 4.1 |
| 165 | 485 | 685 | - | 982 | - | 20 | 2360 | 7.8 | 65.4 | 4.2 |
| 178.3 | 358 | 730.4 | 783.6 | 299.3 | 0.3 | 19 | 2570 | 2.7 | 33.6 | 3.9 |
| 178.3 | 358 | 730.4 | 458.3 | 598.4 | 0.3 | 19 | 2570 | 2.7 | 30.4 | 3.9 |
| 178.3 | 358 | 730.4 | - | 1020 | 0.3 | 19 | 2570 | 2.7 | 29.1 | 3.3 |
| 195 | 300 | 787.1 | 756.4 | 189.1 | - | 20 | 2300 | 5.2 | 39.5 | - |
| 195 | 300 | 737.4 | 485.5 | 485.5 | - | 20 | 2300 | 5.2 | 40.8 | - |
| 195 | 300 | 712.6 | - | 951.4 | - | 20 | 2300 | 5.2 | 43.7 | - |
| 195 | 300 | 814.4 | 733 | 183.2 | - | 20 | 2300 | 5.5 | 41 | - |
| 195 | 300 | 804.2 | 450.7 | 450.7 | - | 20 | 2300 | 5.5 | 38.8 | - |
| 195 | 300 | 807.9 | - | 855.2 | - | 20 | 2300 | 5.5 | 39.9 | - |
| 214.2 | 210 | 929 | - | 966 | - | 22 | 2451 | 7.8 | 19.7 | 2 |
| 196 | 280 | 866 | - | 940 | - | 22 | 2387 | 6.9 | 35.7 | 2.9 |
| 161 | 350 | 858 | - | 974 | 3.5 | 22 | 2362 | 4.2 | 66.8 | 4.6 |
| 212.1 | 210 | 932 | - | 970 | - | 22 | 2456 | 7.5 | 21.8 | 2 |
| 193.2 | 280 | 870 | - | 970 | - | 22 | 2455 | 6.4 | 36.1 | 2.9 |
| 157.5 | 350 | 858 | - | 1029 | 3.5 | 22 | 2496 | 4.2 | 68.5 | 4.8 |
| 207.9 | 210 | 938 | - | 953 | - | 22 | 2401 | 7.6 | 21 | 2.1 |
| 187.6 | 280 | 877 | - | 988 | - | 22 | 2484 | 5.4 | 41.1 | 3 |
| 150.5 | 350 | 868 | - | 982 | 3.5 | 22 | 2363 | 3.6 | 70.2 | 4.9 |
| 205.8 | 210 | 943 | - | 977 | - | 22 | 2447 | 6.9 | 23.6 | 2.2 |
| 190.4 | 280 | 873 | - | 962 | - | 22 | 2458 | 5.8 | 39.7 | 3 |
| 157.5 | 350 | 858 | - | 1016 | 3.5 | 22 | 2464 | 3.9 | 66.5 | 5 |
| 179 | 275 | 878 | 735 | 184 | - | 19 | 2320 | 5.3 | 49.3 | 4.1 |
| 179 | 275 | 849 | 455 | 455 | - | 19 | 2320 | 5.3 | 47.5 | 4.7 |
| 179 | 275 | 868 | - | 830 | - | 19 | 2320 | 5.3 | 53.7 | 4.9 |
| 190 | 380 | 714 | 757 | 189 | - | 19 | 2320 | 5.3 | 64.8 | 4.7 |
| 190 | 380 | 710 | 471 | 471 | - | 19 | 2320 | 5.3 | 63.5 | 4.8 |
| 190 | 380 | 715 | - | 874 | - | 19 | 2320 | 5.3 | 65.1 | 5 |
| 179 | 275 | 961 | 740 | 185 | - | 19 | 2320 | 5.3 | 64.8 | 2.5 |
| 179 | 275 | 978 | 408 | 408 | - | 19 | 2320 | 5.3 | 63.5 | 2.4 |
| 179 | 275 | 1010 | - | 640 | - | 19 | 2320 | 5.3 | 65.1 | 2.3 |
| 190 | 380 | 813 | 767 | 192 | - | 19 | 2320 | 5.3 | 54.9 | 3.2 |
| 190 | 380 | 822 | 426 | 427 | - | 19 | 2320 | 5.3 | 51.5 | 2.7 |
| 190 | 380 | 836 | - | 683 | - | 19 | 2320 | 5.3 | 50.3 | 2.4 |
| 179 | 325 | 799 | 839 | 210 | - | 19 | 2320 | 5.3 | 56.5 | 2.9 |
| 179 | 325 | 831 | 490 | 490 | - | 19 | 2320 | 5.3 | 48.9 | 2.6 |
| 179 | 325 | 825 | - | 923 | - | 19 | 2320 | 5.3 | 43.1 | 2.4 |
| 173 | 385 | 698 | 892 | 233 | - | 19 | 2320 | 5.3 | 67.4 | 3.5 |
| 173 | 385 | 742 | 515 | 515 | - | 19 | 2320 | 5.3 | 61.2 | 2.9 |
| 173 | 385 | 746 | - | 963 | - | 19 | 2320 | 5.3 | 53.7 | 2.5 |
References
- Erdem, S.; Dawson, A.R.; Thom, N.H. Microstructure-linked strength properties and impact response of conventional and recycled concrete reinforced with steel and synthetic macro fibres. Constr. Build. Mater. 2011, 25, 4025–4036. [Google Scholar] [CrossRef]
- Marinković, S.; Radonjanin, V.; Malešev, M.; Ignjatović, I. Comparative environmental assessment of natural and recycled aggregate concrete. Waste Manag. 2010, 30, 2255–2264. [Google Scholar] [CrossRef] [PubMed]
- Behera, M.; Bhattacharyya, S.; Minocha, A.; Deoliya, R.; Maiti, S. Recycled aggregate from C&D waste & its use in concrete—A breakthrough towards sustainability in construction sector: A review. Constr. Build. Mater. 2014, 68, 501–516. [Google Scholar] [CrossRef]
- Pacheco-Torgal, F.; Ding, Y.; Miraldo, S.; Abdollahnejad, Z.; Labrincha, J. Are geopolymers more suitable than Portland cement to produce high volume recycled aggregates HPC? Constr. Build. Mater. 2012, 36, 1048–1052. [Google Scholar] [CrossRef] [Green Version]
- Marie, I.; Quiasrawi, H. Closed-loop recycling of recycled concrete aggregates. J. Clean. Prod. 2012, 37, 243–248. [Google Scholar] [CrossRef]
- Topçu, I.B.; Şengel, S. Properties of concretes produced with waste concrete aggregate. Cem. Concr. Res. 2004, 34, 1307–1312. [Google Scholar] [CrossRef]
- Topçu, I. Physical and mechanical properties of concretes produced with waste concrete. Cem. Concr. Res. 1997, 27, 1817–1823. [Google Scholar] [CrossRef]
- Çakir, O. Experimental analysis of properties of recycled coarse aggregate (RCA) concrete with mineral additives. Constr. Build. Mater. 2014, 68, 17–25. [Google Scholar] [CrossRef]
- Younis, K.; Pilakoutas, K. Strength prediction model and methods for improving recycled aggregate concrete. Constr. Build. Mater. 2013, 49, 688–701. [Google Scholar] [CrossRef]
- Flower, D.J.M.; Sanjayan, J.G. Green house gas emissions due to concrete manufacture. Int. J. Life Cycle Assess. 2007, 12, 282–288. [Google Scholar] [CrossRef]
- Turner, L.K.; Collins, F. Carbon dioxide equivalent (CO2-e) emissions: A comparison between geopolymer and OPC cement concrete. Constr. Build. Mater. 2013, 43, 125–130. [Google Scholar] [CrossRef]
- Thomas, A.; Lombardi, D.R.; Hunt, D.; Gaterell, M. Estimating carbon dioxide emissions for aggregate use. Proc. Inst. Civ. Eng. Eng. Sustain. 2009, 162, 135–144. [Google Scholar] [CrossRef]
- Dong, J.; Wang, Q.; Guan, Z. Material properties of basalt fibre reinforced concrete made with recycled earthquake waste. Constr. Build. Mater. 2017, 130, 241–251. [Google Scholar] [CrossRef]
- Ahmad, W.; Ahmad, A.; Ostrowski, K.A.; Aslam, F.; Joyklad, P. A scientometric review of waste material utilization in concrete for sustainable construction. Case Stud. Constr. Mater. 2021, 15, e00683. [Google Scholar] [CrossRef]
- Sufian, M.; Ullah, S.; Ostrowski, K.; Ahmad, A.; Zia, A.; Śliwa-Wieczorek, K.; Siddiq, M.; Awan, A. An Experimental and Empirical Study on the Use of Waste Marble Powder in Construction Material. Materials 2021, 14, 3829. [Google Scholar] [CrossRef]
- Ahmad, W.; Ahmad, A.; Ostrowski, K.A.; Aslam, F.; Joyklad, P.; Zajdel, P. Sustainable approach of using sugarcane bagasse ash in cement-based composites: A systematic review. Case Stud. Constr. Mater. 2021, 15, e00698. [Google Scholar] [CrossRef]
- Duan, Z.; Singh, A.; Xiao, J.; Hou, S. Combined use of recycled powder and recycled coarse aggregate derived from construction and demolition waste in self-compacting concrete. Constr. Build. Mater. 2020, 254, 119323. [Google Scholar] [CrossRef]
- Li, X.; Qin, D.; Hu, Y.; Ahmad, W.; Ahmad, A.; Aslam, F.; Joyklad, P. A systematic review of waste materials in cement-based composites for construction applications. J. Build. Eng. 2021, 45, 103447. [Google Scholar] [CrossRef]
- Bairagi, N.; Vidyadhara, H.; Ravande, K. Mix design procedure for recycled aggregate concrete. Constr. Build. Mater. 1990, 4, 188–193. [Google Scholar] [CrossRef]
- Feng, D.-C.; Liu, Z.-T.; Wang, X.-D.; Chen, Y.; Chang, J.-Q.; Wei, D.-F.; Jiang, Z.-M. Machine learning-based compressive strength prediction for concrete: An adaptive boosting approach. Constr. Build. Mater. 2020, 230, 117000. [Google Scholar] [CrossRef]
- Van Dao, D.; Adeli, H.; Ly, H.-B.; Le, L.M.; Le, V.M.; Le, T.-T.; Pham, B.T. A Sensitivity and Robustness Analysis of GPR and ANN for High-Performance Concrete Compressive Strength Prediction Using a Monte Carlo Simulation. Sustainability 2020, 12, 830. [Google Scholar] [CrossRef] [Green Version]
- Javed, M.F.; Amin, M.N.; Shah, M.I.; Khan, K.; Iftikhar, B.; Farooq, F.; Aslam, F.; Alyousef, R.; Alabduljabbar, H. Applications of Gene Expression Programming and Regression Techniques for Estimating Compressive Strength of Bagasse Ash based Concrete. Crystals 2020, 10, 737. [Google Scholar] [CrossRef]
- Gholampour, A.; Gandomi, A.; Ozbakkaloglu, T. New formulations for mechanical properties of recycled aggregate concrete using gene expression programming. Constr. Build. Mater. 2017, 130, 122–145. [Google Scholar] [CrossRef]
- Han, T.; Siddique, A.; Khayat, K.; Huang, J.; Kumar, A. An ensemble machine learning approach for prediction and optimization of modulus of elasticity of recycled aggregate concrete. Constr. Build. Mater. 2020, 244, 118271. [Google Scholar] [CrossRef]
- Ahmad, A.; Chaiyasarn, K.; Farooq, F.; Ahmad, W.; Suparp, S.; Aslam, F. Compressive Strength Prediction via Gene Expression Programming (GEP) and Artificial Neural Network (ANN) for Concrete Containing RCA. Buildings 2021, 11, 324. [Google Scholar] [CrossRef]
- Ahmad, A.; Ahmad, W.; Chaiyasarn, K.; Ostrowski, K.A.; Aslam, F.; Zajdel, P.; Joyklad, P. Prediction of Geopolymer Concrete Compressive Strength Using Novel Machine Learning Algorithms. Polymers 2021, 13, 3389. [Google Scholar] [CrossRef]
- Huang, J.; Sun, Y.; Zhang, J. Reduction of computational error by optimizing SVR kernel coefficients to simulate concrete compressive strength through the use of a human learning optimization algorithm. Eng. Comput. 2021, 1, 3. [Google Scholar] [CrossRef]
- Sarir, P.; Chen, J.; Asteris, P.G.; Armaghani, D.J.; Tahir, M.M. Developing GEP tree-based, neuro-swarm, and whale optimization models for evaluation of bearing capacity of concrete-filled steel tube columns. Eng. Comput. 2021, 37, 1–19. [Google Scholar] [CrossRef]
- Balf, F.R.; Kordkheili, H.M. A New Method for Predicting the Ingredients of Self-Compacting Concrete (SCC) Including Fly Ash (FA) Using Data Envelopment Analysis (DEA). Arab. J. Sci. Eng. 2021, 46, 4439–4460. [Google Scholar] [CrossRef]
- Ahmad, A.; Farooq, F.; Ostrowski, K.; Śliwa-Wieczorek, K.; Czarnecki, S. Application of Novel Machine Learning Techniques for Predicting the Surface Chloride Concentration in Concrete Containing Waste Material. Materials 2021, 14, 2297. [Google Scholar] [CrossRef]
- Azimi-Pour, M.; Eskandari-Naddaf, H.; Pakzad, A. Linear and non-linear SVM prediction for fresh properties and compressive strength of high volume fly ash self-compacting concrete. Constr. Build. Mater. 2020, 230, 117021. [Google Scholar] [CrossRef]
- Saha, P.; Debnath, P.; Thomas, P. Prediction of fresh and hardened properties of self-compacting concrete using support vector regression approach. Neural Comput. Appl. 2020, 32, 7995–8010. [Google Scholar] [CrossRef]
- Shahmansouri, A.A.; Bengar, H.A.; Jahani, E. Predicting compressive strength and electrical resistivity of eco-friendly concrete containing natural zeolite via GEP algorithm. Constr. Build. Mater. 2019, 229, 116883. [Google Scholar] [CrossRef]
- Aslam, F.; Farooq, F.; Amin, M.N.; Khan, K.; Waheed, A.; Akbar, A.; Javed, M.F.; Alyousef, R.; Alabdulijabbar, H. Applications of Gene Expression Programming for Estimating Compressive Strength of High-Strength Concrete. Adv. Civ. Eng. 2020, 2020, 8850535. [Google Scholar] [CrossRef]
- Farooq, F.; Amin, M.N.; Khan, K.; Sadiq, M.R.; Javed, M.F.F.; Aslam, F.; Alyousef, R. A Comparative Study of Random Forest and Genetic Engineering Programming for the Prediction of Compressive Strength of High Strength Concrete (HSC). Appl. Sci. 2020, 10, 7330. [Google Scholar] [CrossRef]
- Asteris, P.G.; Kolovos, K. Self-compacting concrete strength prediction using surrogate models. Neural Comput. Appl. 2019, 31, 409–424. [Google Scholar] [CrossRef]
- Selvaraj, S.; Sivaraman, S. Prediction model for optimized self-compacting concrete with fly ash using response surface method based on fuzzy classification. Neural Comput. Appl. 2019, 31, 1365–1373. [Google Scholar] [CrossRef]
- Zhang, J.; Ma, G.; Huang, Y.; Sun, J.; Aslani, F.; Nener, B. Modelling uniaxial compressive strength of lightweight self-compacting concrete using random forest regression. Constr. Build. Mater. 2019, 210, 713–719. [Google Scholar] [CrossRef]
- Kaveh, A.; Bakhshpoori, T.; Hamze-Ziabari, S.M. M5’ and Mars Based Prediction Models for Properties of Self-compacting Concrete Containing Fly Ash. Period. Polytech. Civ. Eng. 2018, 62, 281–294. [Google Scholar] [CrossRef] [Green Version]
- Sathyan, D.; Anand, K.B.; Prakash, A.J.; Premjith, B. Modeling the Fresh and Hardened Stage Properties of Self-Compacting Concrete using Random Kitchen Sink Algorithm. Int. J. Concr. Struct. Mater. 2018, 12, 24. [Google Scholar] [CrossRef]
- Vakhshouri, B.; Nejadi, S. Prediction of compressive strength of self-compacting concrete by ANFIS models. Neurocomputing 2018, 280, 13–22. [Google Scholar] [CrossRef]
- Douma, O.B.; Boukhatem, B.; Ghrici, M.; Tagnit-Hamou, A. Prediction of properties of self-compacting concrete containing fly ash using artificial neural network. Neural Comput. Appl. 2017, 28, 707–718. [Google Scholar] [CrossRef]
- Abu Yaman, M.; Elaty, M.A.; Taman, M. Predicting the ingredients of self compacting concrete using artificial neural network. Alexandria Eng. J. 2017, 56, 523–532. [Google Scholar] [CrossRef]
- Ahmad, A.; Farooq, F.; Niewiadomski, P.; Ostrowski, K.; Akbar, A.; Aslam, F.; Alyousef, R. Prediction of Compressive Strength of Fly Ash Based Concrete Using Individual and Ensemble Algorithm. Materials 2021, 14, 794. [Google Scholar] [CrossRef]
- Farooq, F.; Ahmed, W.; Akbar, A.; Aslam, F.; Alyousef, R. Predictive modeling for sustainable high-performance concrete from industrial wastes: A comparison and optimization of models using ensemble learners. J. Clean. Prod. 2021, 292, 126032. [Google Scholar] [CrossRef]
- Bušić, R.; Benšić, M.; Miličević, I.; Strukar, K. Prediction Models for the Mechanical Properties of Self-Compacting Concrete with Recycled Rubber and Silica Fume. Materials 2020, 13, 1821. [Google Scholar] [CrossRef] [PubMed] [Green Version]
- Javed, M.F.; Farooq, F.; Memon, S.A.; Akbar, A.; Khan, M.A.; Aslam, F.; Alyousef, R.; Alabduljabbar, H.; Rehman, S.K.U. New Prediction Model for the Ultimate Axial Capacity of Concrete-Filled Steel Tubes: An Evolutionary Approach. Crystals 2020, 10, 741. [Google Scholar] [CrossRef]
- Al-Mughanam, T.; Aldhyani, T.; AlSubari, B.; Al-Yaari, M. Modeling of Compressive Strength of Sustainable Self-Compacting Concrete Incorporating Treated Palm Oil Fuel Ash Using Artificial Neural Network. Sustainability 2020, 12, 9322. [Google Scholar] [CrossRef]
- Nematzadeh, M.; Shahmansouri, A.A.; Fakoor, M. Post-fire compressive strength of recycled PET aggregate concrete reinforced with steel fibers: Optimization and prediction via RSM and GEP. Constr. Build. Mater. 2020, 252, 119057. [Google Scholar] [CrossRef]
- Song, H.; Ahmad, A.; Ostrowski, K.A.; Dudek, M. Analyzing the Compressive Strength of Ceramic Waste-Based Concrete Using Experiment and Artificial Neural Network (ANN) Approach. Materials 2021, 14, 4518. [Google Scholar] [CrossRef]
- Ahmad, A.; Ostrowski, K.; Maślak, M.; Farooq, F.; Mehmood, I.; Nafees, A. Comparative Study of Supervised Machine Learning Algorithms for Predicting the Compressive Strength of Concrete at High Temperature. Materials 2021, 14, 4222. [Google Scholar] [CrossRef] [PubMed]
- Song, H.; Ahmad, A.; Farooq, F.; Ostrowski, K.A.; Maślak, M.; Czarnecki, S.; Aslam, F. Predicting the compressive strength of concrete with fly ash admixture using machine learning algorithms. Constr. Build. Mater. 2021, 308, 125021. [Google Scholar] [CrossRef]
- Ahmad, W.; Ahmad, A.; Ostrowski, K.A.; Aslam, F.; Joyklad, P.; Zajdel, P. Application of Advanced Machine Learning Approaches to Predict the Compressive Strength of Concrete Containing Supplementary Cementitious Materials. Materials 2021, 14, 5762. [Google Scholar] [CrossRef] [PubMed]
- Feng, D.-C.; Li, J. Stochastic Nonlinear Behavior of Reinforced Concrete Frames. II: Numerical Simulation. J. Struct. Eng. 2016, 142, 04015163. [Google Scholar] [CrossRef]
- Feng, D.-C.; Liu, Z.-T.; Wang, X.-D.; Jiang, Z.-M.; Liang, S.-X. Failure mode classification and bearing capacity prediction for reinforced concrete columns based on ensemble machine learning algorithm. Adv. Eng. Inform. 2020, 45, 101126. [Google Scholar] [CrossRef]
- Ahmad, A.; Ahmad, W.; Aslam, F.; Joyklad, P. Compressive strength prediction of fly ash-based geopolymer concrete via advanced machine learning techniques. Case Stud. Constr. Mater. 2021, 16, e00840. [Google Scholar] [CrossRef]
- Zhang, J.; Huang, Y.; Aslani, F.; Ma, G.; Nener, B. A hybrid intelligent system for designing optimal proportions of recycled aggregate concrete. J. Clean. Prod. 2020, 273, 122922. [Google Scholar] [CrossRef]


| Sr. No | Algorithm Used | Notation | Data Points | Prediction Properties | Year | Material Used | References |
|---|---|---|---|---|---|---|---|
| 1. | Support vector machine | SVM | 144 | CS | 2021 | Fly ash (FA) | [28] |
| 2. | Gene expression programming | GEP | 303 | Column’s bearing capacity | 2019 | _ | [29] |
| 3. | Data Envelopment Analysis | DEA | 114 | Fresh and harden properties of concrete | 2021 | FA | [30] |
| 4. | Gene expression programming, Artificial neural network, Decision tree | GEP, ANN, DT | 642 | Surface Chloride Concentration | 2021 | FA | [31] |
| 5. | Support vector machine | SVM | - | CS | 2020 | FA | [32] |
| 6. | Support vector machine | SVM | 115 | Fresh properties of concrete CS | 2020 | FA | [33] |
| 7. | Gene Expression Programming | GEP | 351 | CS | 2020 | Ground Granulated Blast Furnace Slag | [34] |
| 8. | Gene Expression Programming | GEP | 54 | CS | 2019 | NZ (Natural Zeolite) | [34] |
| 9. | Gene expression programming | GEP | 357 | CS | 2020 | - | [35] |
| 10. | Random forest and gene expression programming | RF and GEP | 357 | CS | 2020 | - | [36] |
| 11. | Artificial neuron network | ANN | 205 | CS | 2019 | Fly ash GGBFS Rice husk ash | [37] |
| 12. | Intelligent rule-based enhanced multiclass support vector machine and fuzzy rules | IREMSVM-FR with RSM | 114 | CS | 2019 | Fly ash | [38] |
| 13. | Random forest | RF | 131 | CS | 2019 | Fly ash GGBFS FA | [39] |
| 14. | Multivariate adaptive regression spline | M5 MARS | 114 | CS Slump test L-box test V-funnel test | 2018 | FA | [40] |
| 15. | Random Kitchen Sink Algorithm | RKSA | 40 | V-funnel test J-ring test Slump test CS | 2018 | FA | [41] |
| 16. | Adaptive neuro fuzzy inference system | ANFIS | 55 | CS | 2018 | - | [42] |
| 17. | Artificial neuron network | ANN | 114 | CS | 2017 | FA | [43] |
| 18. | Artificial neuron network | ANN | 69 | CS | 2017 | FA | [44] |
| 19 | Individual and ensemble algorithm | GEP, DT, Bagging | 270 | CS | 2021 | FA | [45] |
| 20. | Individual with ensemble modeling | ANN, bagging, boosting | 1030 | CS | 2021 | FA | [46] |
| 21. | Multivariate | MV | 21 | CS | 2020 | Crumb rubber with SF | [47] |
| 22. | Gene expression programming | GEP | 277 | Axial capacity | 2020 | - | [48] |
| 23. | Adaptive neuro fuzzy inference system | ANFIS with ANN | 7 | CS | 2020 | Palm oil fuel ash | [49] |
| 24. | Response Surface Method, Gene expression programming | RSM, GEP | 108 | CS | 2020 | Steel Fibers | [50] |
| 25. | Artificial neural network | ANN | 60 | CS | 2021 | Ceramic waste powder | [51] |
| 27. | Decision tree, Artificial neural network, Bagging, Gradient boosting | DT, ANN, BR, GB | 207 | CS | 2021 | FA | [52] |
| 28. | Gene expression programming, Artificial neural network, Decision tree | GEP, ANN, DT | 98 | CS | 2021 | FA | [53] |
| 29. | Individual and Ensemble techniques | BR, GEP, DT | 1030 | CS | 2021 | FA | [54] |
| Statistics | Water | Cement | FA | NCA | RCA | SP | RCA Size | RCA Density | Absorption |
|---|---|---|---|---|---|---|---|---|---|
| Mean | 184.62 | 386.86 | 681.89 | 398.07 | 650.74 | 1.32 | 19.76 | 2231.06 | 4.80 |
| Standard Error | 1.39 | 4.43 | 11.07 | 19.99 | 20.37 | 0.11 | 0.22 | 31.32 | 0.12 |
| Median | 180.00 | 380.00 | 698.00 | 471.00 | 552.00 | 0.00 | 20.00 | 2362.50 | 4.90 |
| Mode | 220.00 | 380.00 | 693.00 | 0.00 | 138.00 | 0.00 | 20.00 | 2320.00 | 5.30 |
| Standard Deviation | 25.84 | 82.16 | 205.28 | 370.71 | 377.73 | 2.05 | 4.02 | 580.95 | 2.26 |
| Sample Variance | 667.47 | 6750.28 | 42,141.11 | 137,424.94 | 142,682.56 | 4.21 | 16.16 | 337,504.80 | 5.12 |
| Minimum | 117.6 | 158 | 0 | 0.00 | 52 | 0. | 10 | 0 | 0 |
| Maximum | 271. | 600 | 1010 | 1448 | 1778 | 7.8 | 32 | 2661 | 10.9 |
| Sum | 63,510.69 | 133,081.00 | 234,568 | 136,937 | 223,853 | 455.5 | 6796 | 767,484 | 1652.8 |
| Count | 344.00 | 344.00 | 344 | 344 | 344 | 344 | 344 | 344 | 344 |
| AdaBoost | Decision Tree | ||||||||
|---|---|---|---|---|---|---|---|---|---|
| K-Fold | MAE | MSE | RMSE | R2 | K-Fold | MAE | MSE | RMSE | R2 |
| 1 | 7.49 | 87.20 | 9.34 | 0.95 | 1 | 13.45 | 216.60 | 14.72 | 0.76 |
| 2 | 11.08 | 124.99 | 11.18 | 0.91 | 2 | 23.10 | 271.26 | 16.47 | 0.89 |
| 3 | 7.04 | 114.49 | 10.70 | 0.83 | 3 | 14.85 | 204.20 | 14.29 | 0.97 |
| 4 | 8.45 | 90.82 | 9.53 | 0.79 | 4 | 9.59 | 131.79 | 11.48 | 0.92 |
| 5 | 6.52 | 85.74 | 9.26 | 0.90 | 5 | 11.17 | 217.26 | 14.74 | 0.98 |
| 6 | 16.74 | 435.13 | 20.86 | 9.98 | 6 | 12.51 | 197.40 | 14.05 | 0.82 |
| 7 | 9.88 | 193.48 | 13.91 | 0.93 | 7 | 9.07 | 210.54 | 14.51 | 0.77 |
| 8 | 8.72 | 123.43 | 11.11 | 0.85 | 8 | 10.15 | 194.60 | 13.95 | 0.88 |
| 9 | 7.02 | 40.44 | 6.36 | 0.87 | 9 | 9.00 | 108.16 | 10.42 | 0.90 |
| 10 | 9.00 | 87.42 | 9.35 | 0.90 | 10 | 7.44 | 90.44 | 9.51 | 0.87 |
| AdaBoost | Decision Tree | ||||||||
|---|---|---|---|---|---|---|---|---|---|
| K-Fold | MAE | MSE | RMSE | R2 | K-Fold | MAE | MSE | RMSE | R2 |
| 1 | 0.76 | 1.44 | 1.20 | 0.91 | 1 | 0.52 | 0.50 | 0.71 | 0.73 |
| 2 | 1.04 | 2.37 | 1.54 | 0.88 | 2 | 1.76 | 7.02 | 2.65 | 0.88 |
| 3 | 0.78 | 1.39 | 1.18 | 0.74 | 3 | 0.77 | 0.98 | 0.99 | 0.97 |
| 4 | 0.84 | 1.82 | 1.35 | 0.90 | 4 | 1.41 | 3.45 | 1.86 | 0.91 |
| 5 | 0.45 | 0.28 | 0.53 | 0.98 | 5 | 1.17 | 2.72 | 1.65 | 0.79 |
| 6 | 1.11 | 2.13 | 1.46 | 0.95 | 6 | 1.25 | 3.68 | 1.92 | 0.84 |
| 7 | 0.93 | 2.62 | 1.62 | 0.79 | 7 | 1.20 | 4.24 | 2.06 | 0.80 |
| 8 | 1.31 | 3.31 | 1.82 | 0.81 | 8 | 1.25 | 2.22 | 1.49 | 0.96 |
| 9 | 0.59 | 0.57 | 0.76 | 0.93 | 9 | 0.43 | 0.57 | 0.75 | 0.91 |
| 10 | 1.16 | 3.57 | 1.89 | 0.87 | 10 | 1.85 | 5.15 | 2.27 | 0.85 |
| Algorithms Used | MAE (MPa) | MSE (MPa) | RMSE (MPa) |
|---|---|---|---|
| Decision tree (DT) | 3.58 | 11.02 | 3.32 |
| AdaBoost | 2.33 | 7.8 | 2.79 |
| Algorithm Used | MAE (MPa) | MSE (MPa) | RMSE (MPa) |
|---|---|---|---|
| Decision tree (DT) | 0.31 | 0.29 | 0.54 |
| AdaBoost | 0.30 | 0.20 | 0.45 |
Publisher’s Note: MDPI stays neutral with regard to jurisdictional claims in published maps and institutional affiliations. |
© 2022 by the authors. Licensee MDPI, Basel, Switzerland. This article is an open access article distributed under the terms and conditions of the Creative Commons Attribution (CC BY) license (https://creativecommons.org/licenses/by/4.0/).
Share and Cite
Shang, M.; Li, H.; Ahmad, A.; Ahmad, W.; Ostrowski, K.A.; Aslam, F.; Joyklad, P.; Majka, T.M. Predicting the Mechanical Properties of RCA-Based Concrete Using Supervised Machine Learning Algorithms. Materials 2022, 15, 647. https://doi.org/10.3390/ma15020647
Shang M, Li H, Ahmad A, Ahmad W, Ostrowski KA, Aslam F, Joyklad P, Majka TM. Predicting the Mechanical Properties of RCA-Based Concrete Using Supervised Machine Learning Algorithms. Materials. 2022; 15(2):647. https://doi.org/10.3390/ma15020647
Chicago/Turabian StyleShang, Meijun, Hejun Li, Ayaz Ahmad, Waqas Ahmad, Krzysztof Adam Ostrowski, Fahid Aslam, Panuwat Joyklad, and Tomasz M. Majka. 2022. "Predicting the Mechanical Properties of RCA-Based Concrete Using Supervised Machine Learning Algorithms" Materials 15, no. 2: 647. https://doi.org/10.3390/ma15020647