

Some Issues with Statistical Crystal Plasticity Models: Description of the Effects Triggered in FCC Crystals by Loading with Strain-Path Changes


Abstract
:1. Introduction
2. Two-Level Statistical Constitutive Model for Describing Inelastic Deformation of FCC Polycrystals
- isotropic hardening law:
3. Results and Discussion
- (1) Tension–rolling
- (2) Rolling–tension
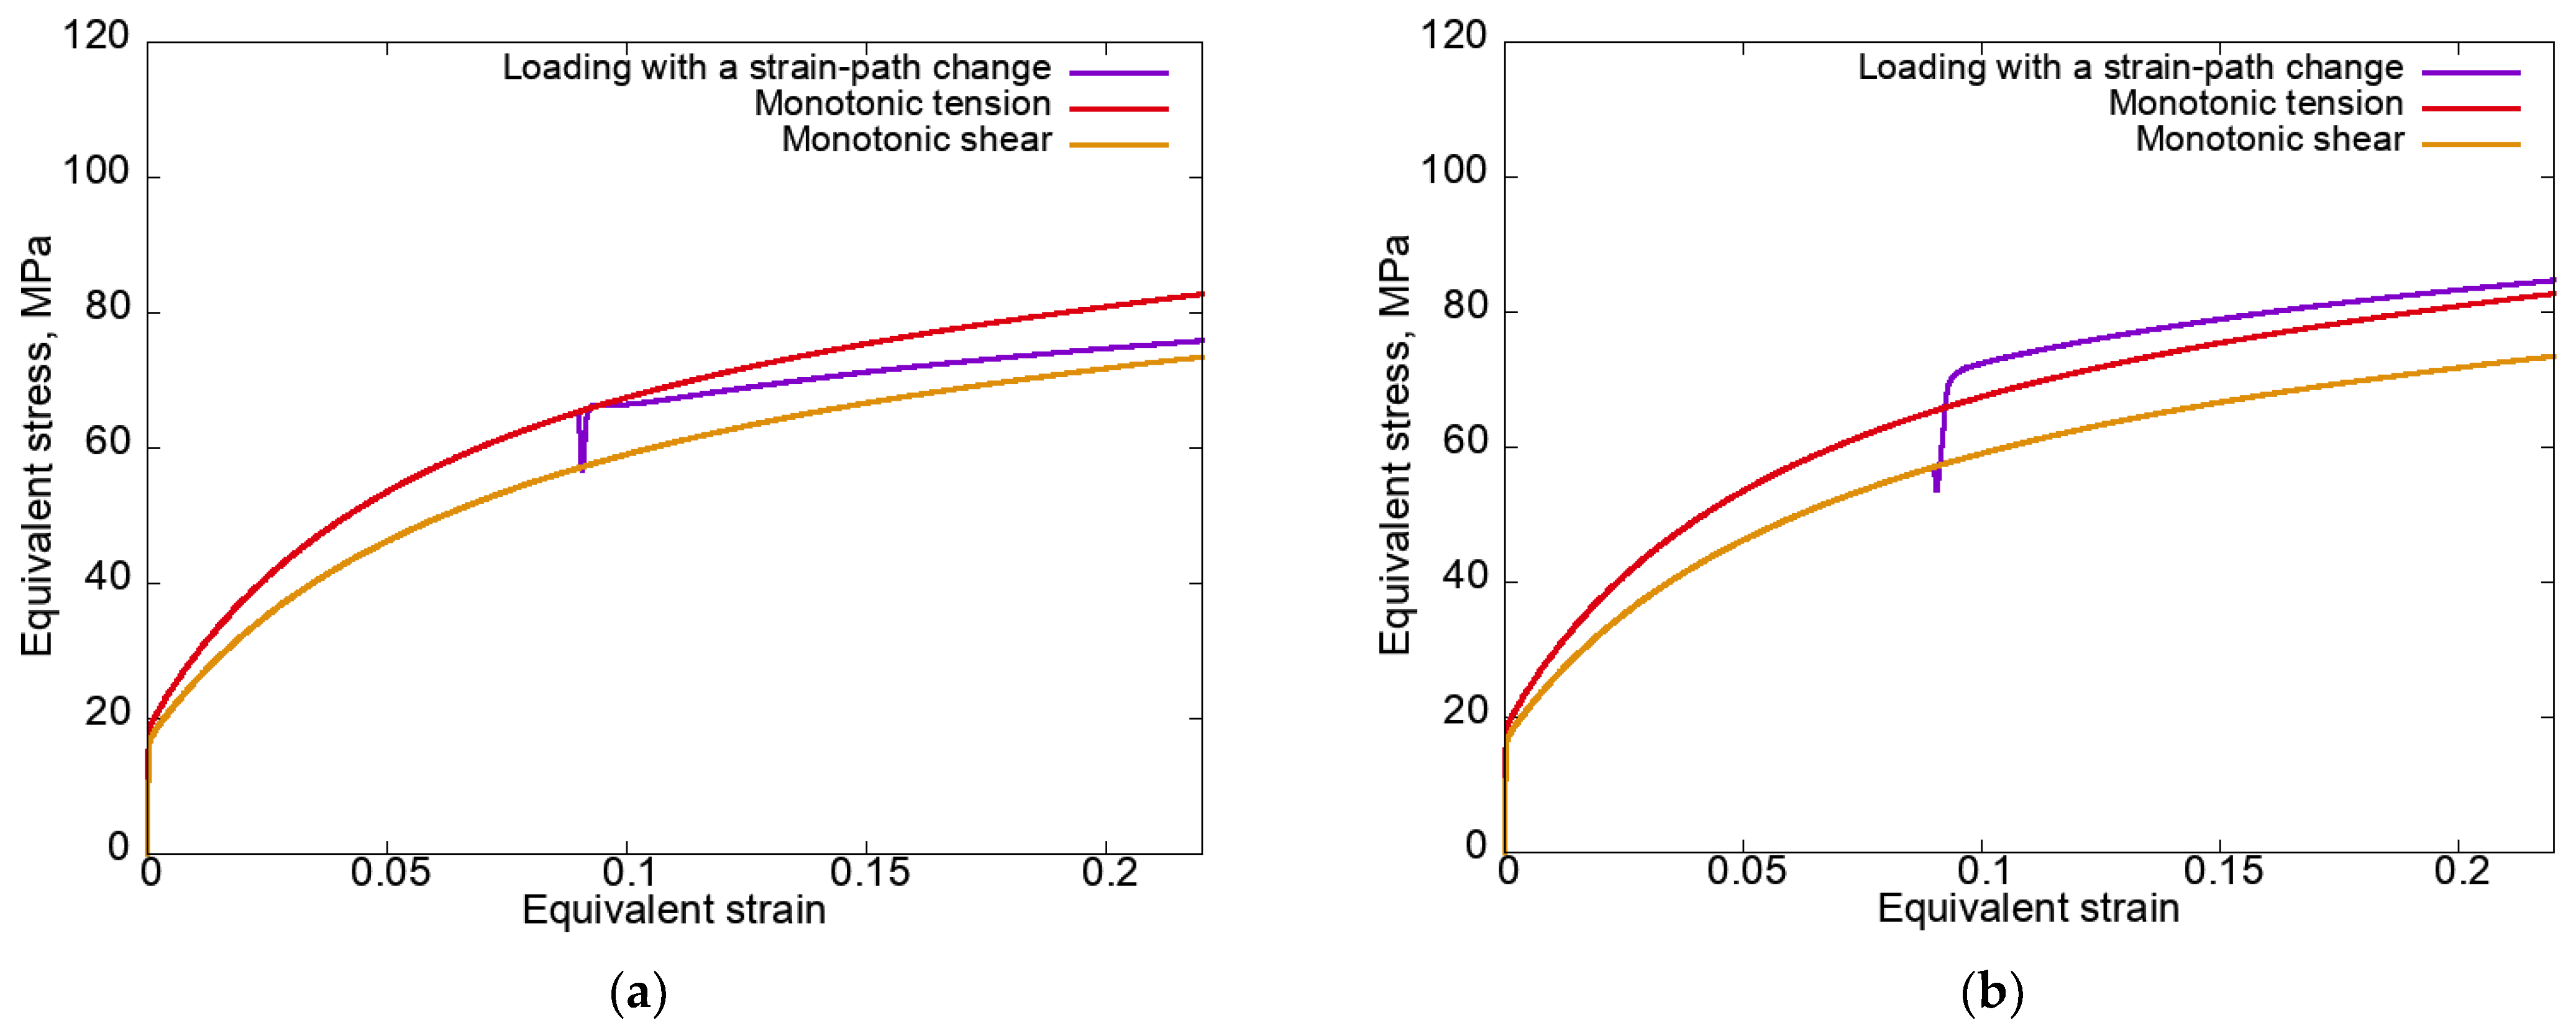
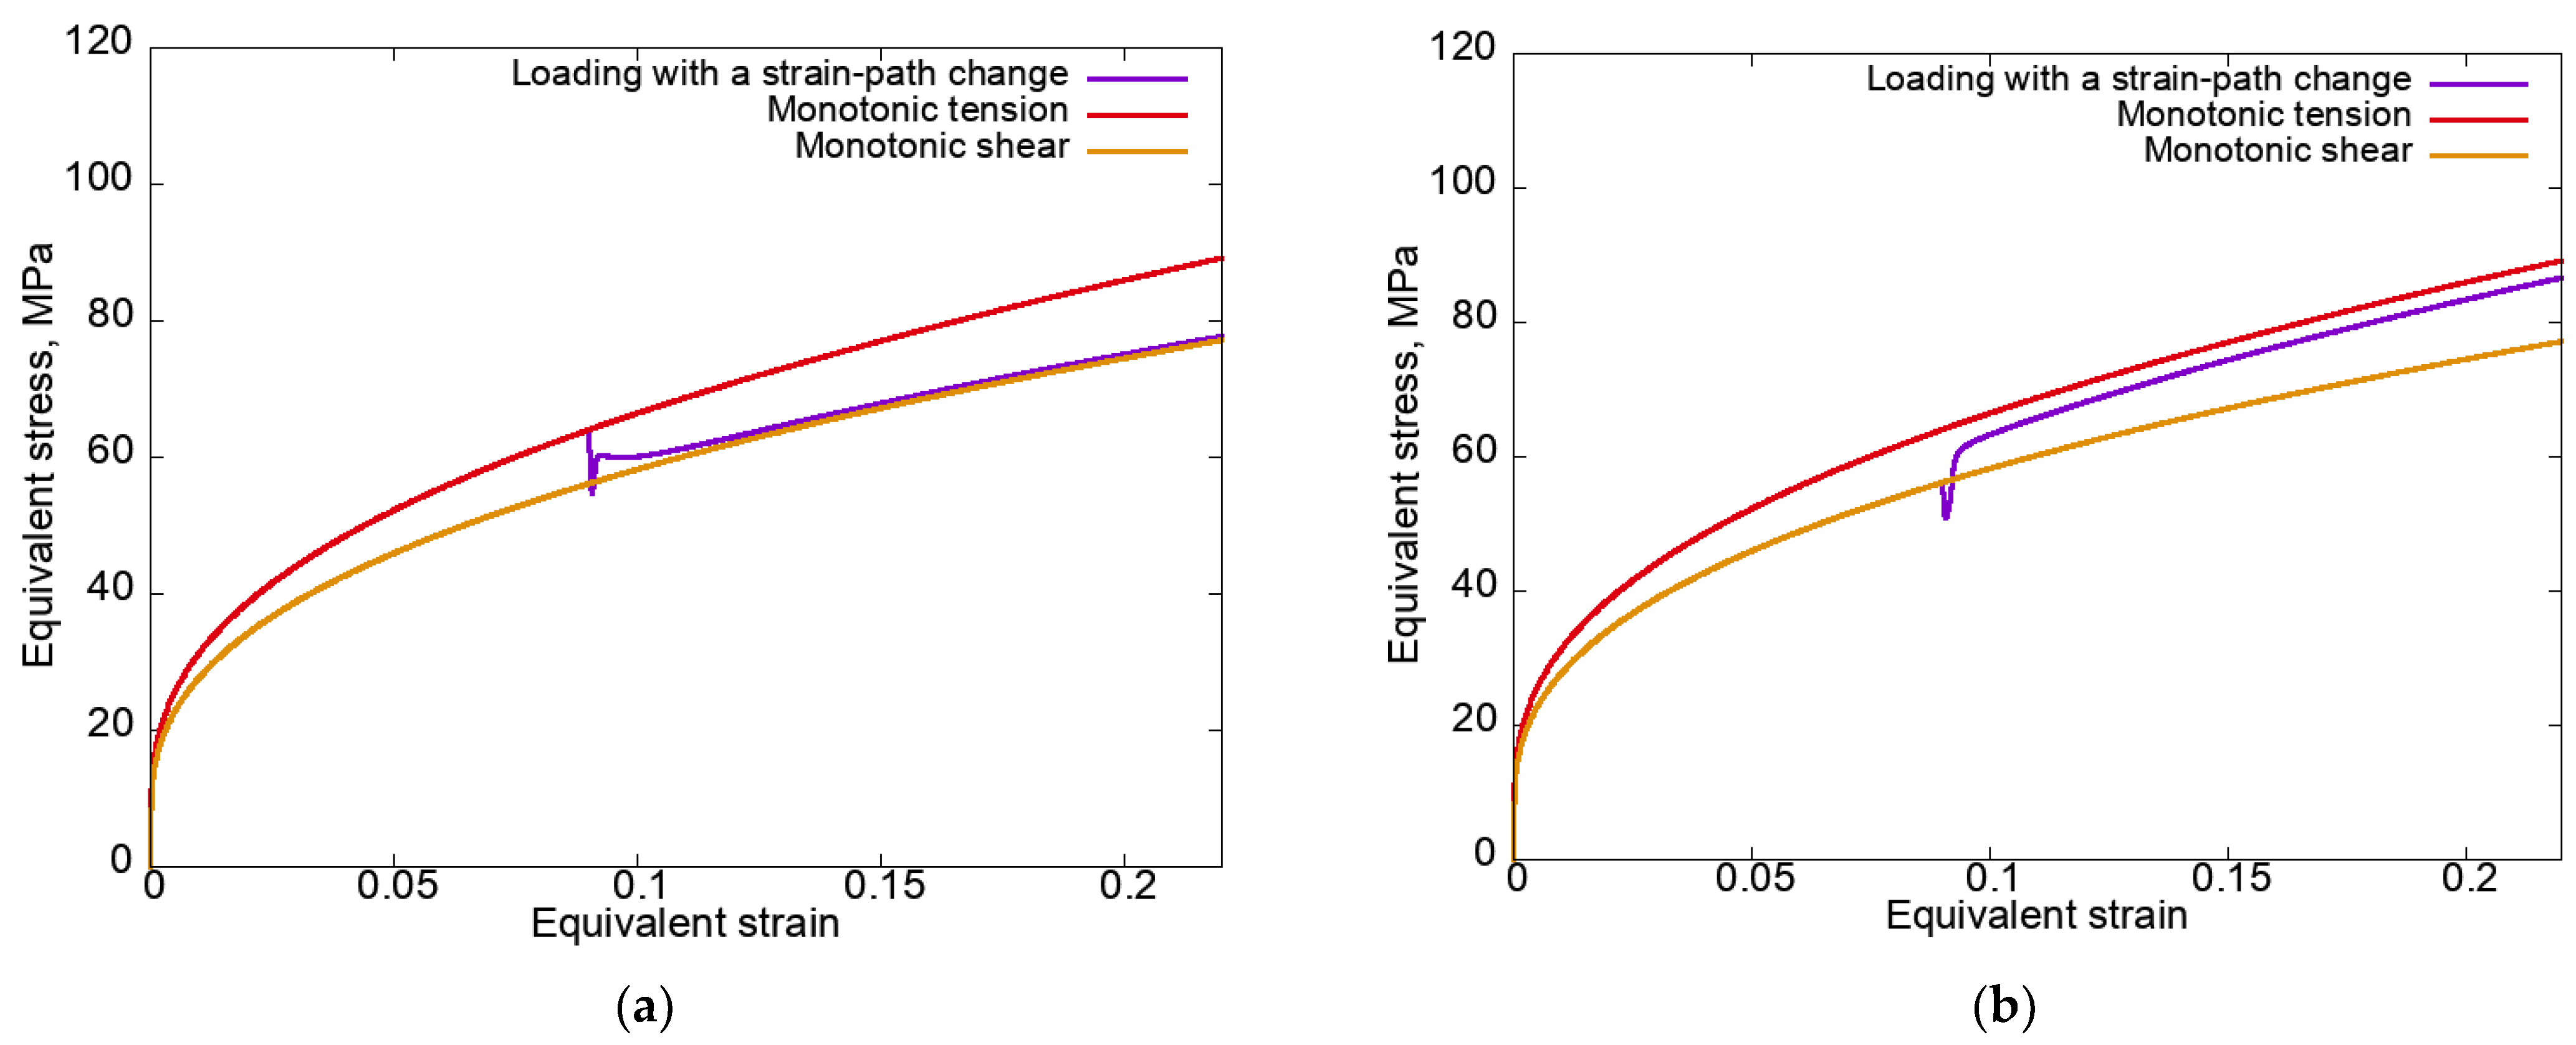
- (3) Tension–shear
- (4) Shear–tension
4. Conclusions
Author Contributions
Funding
Institutional Review Board Statement
Informed Consent Statement
Data Availability Statement
Conflicts of Interest
References
- Valiev, R.Z.; Korznikov, A.V.; Mulyukov, R.R. The structure and properties of metallic materials with a submicron-grained structure. Phys. Met. Metallogr. 1992, 73, 373–384. [Google Scholar]
- Kozlov, E.V.; Zhdanov, A.N.; Koneva, A.N. Barrier Retardation of Dislocations. Hall-Petch Problem. Phys. Mesomech. 2006, 9, 75–85. [Google Scholar]
- Valiev, R.Z.; Langdon, T.G. Principles of equal-channel angular pressing as a processing tool for grain refinement. Prog. Mater. Sci. 2006, 51, 881–981. [Google Scholar] [CrossRef]
- Trusov, P.V. Classical and Multi-Level Constitutive Models for Describing the Behavior of Metals and Alloys: Problems and Prospects (as a Matter for Discussion). Mech. Solids 2021, 56, 55–64. [Google Scholar] [CrossRef]
- Truesdell, C. A First Course in Rational Continuum Mechanics; Academic Press: London, UK, 1977; p. 304. [Google Scholar]
- Trusov, P.; Ashikhmin, V.; Volegov, P.; Shveykin, A. Constitutive relations and their application to the description of microstructure evolution. Phys. Mesomech. 2010, 13, 38–46. [Google Scholar] [CrossRef]
- Zhilin, P.A. Rational Continuum Mechanics; Polytechnic University Press: Saint-Petersburg, Russia, 2012; p. 584. (In Russian) [Google Scholar]
- Trusov, P.V.; Shveykin, A.I.; Kondratyev, N.S.; Yants, A.Y. Multilevel Models in Physical Mesomechanics of Metals and Alloys: Results and Prospects. Phys. Mesomech. 2021, 24, 391–417. [Google Scholar] [CrossRef]
- McDowell, D.L. A perspective on trends in multiscale plasticity. Int. J. Plast. 2010, 26, 1280–1309. [Google Scholar] [CrossRef]
- Roters, F.; Eisenlohr, P.; Hantcherli, L.; Tjahjanto, D.; Bieler, T.; Raabe, D. Overview of constitutive laws, kinematics, homogenization and multiscale methods in crystal plasticity finite-element modeling: Theory, experiments, applications. Acta Mater. 2009, 58, 1152–1211. [Google Scholar] [CrossRef]
- Khadyko, M.; Dumoulin, S.; Cailletaud, G.; Hopperstad, O. Latent hardening and plastic anisotropy evolution in AA6060 aluminium alloy. Int. J. Plast. 2016, 76, 51–74. [Google Scholar] [CrossRef]
- Diehl, M. Review and outlook: Mechanical, thermodynamic, and kinetic continuum modeling of metallic materials at the grain scale. MRS Commun. 2017, 7, 735–746. [Google Scholar] [CrossRef]
- Beyerlein, I.J.; Knezevic, M. Review of microstructure and micromechanism-based constitutive modeling of polycrystals with a low-symmetry crystal structure. J. Mater. Res. 2018, 33, 3711–3738. [Google Scholar] [CrossRef]
- Knezevic, M.; Beyerlein, I.J. Multiscale Modeling of Microstructure-Property Relationships of Polycrystalline Metals during Thermo-Mechanical Deformation. Adv. Eng. Mater. 2018, 20, 1700956. [Google Scholar] [CrossRef]
- Han, F.; Diehl, M.; Roters, F.; Raabe, D. Using spectral-based representative volume element crystal plasticity simulations to predict yield surface evolution during large scale forming simulations. J. Mater. Process. Technol. 2019, 277, 116449. [Google Scholar] [CrossRef]
- Li, Y.L.; Kohar, C.P.; Mishra, R.K.; Inal, K. A new crystal plasticity constitutive model for simulating precipitation-hardenable aluminum alloys. Int. J. Plast. 2020, 132, 102759. [Google Scholar] [CrossRef]
- Iftikhar, C.M.A.; Li, Y.L.; Kohar, C.P.; Inal, K.; Khan, A.S. Evolution of subsequent yield surfaces with plastic deformation along proportional and non-proportional loading paths on annealed AA6061 alloy: Experiments and crystal plasticity finite element modeling. Int. J. Plast. 2021, 143, 102956. [Google Scholar] [CrossRef]
- Trusov, P.V.; Shveikin, A.I. Multilevel Models of Mono—And Polycrystalline Materials: Theory, Algorithms and Applied Examples; SB RAS Publ.: Novosibirsk, Russia, 2019; p. 605. (In Russian) [Google Scholar] [CrossRef]
- McDowell, D.L. Internal state variable theory. In Handbook of Materials Modeling; Yip, S., Ed.; Springer: Cham, The Netherlands, 2005; pp. 1151–1169. [Google Scholar]
- Ashikhmin, V.N.; Volegov, P.S.; Trusov, P.V. Constitutive Relations with Internal Variables: General Structure and Application to Texture Formation in Polycrystals. PNRPU Mech. Bull. 2006, 14, 11–26. (In Russian) [Google Scholar]
- Horstemeyer, M.F.; Bammann, D.J. Historical review of internal state variable theory for inelasticity. Int. J. Plast. 2010, 26, 1310–1334. [Google Scholar] [CrossRef]
- Shveykin, A.; Trusov, P.; Sharifullina, E. Statistical Crystal Plasticity Model Advanced for Grain Boundary Sliding Description. Crystals 2020, 10, 822. [Google Scholar] [CrossRef]
- Trusov, P.; Shveykin, A.; Kondratev, N. Some Issues on Crystal Plasticity Models Formulation: Motion Decomposition and Constitutive Law Variants. Crystals 2021, 11, 1392. [Google Scholar] [CrossRef]
- Vasin, R.A. Properties of Plasticity Functionals for Metals, Determined in Experiments on Two-Link Strain Trajectories. Elast. Inelast. 1987, 115–127. (In Russian) [Google Scholar]
- Zubchaninov, V.G. Stability and Plasticity; Fizmalit: Moscow, Russia, 2008; Volume 2, p. 336. (In Russian) [Google Scholar]
- Kim, H.; Barlat, F.; Lee, Y.; Bin Zaman, S.; Lee, C.S.; Jeong, Y. A crystal plasticity model for describing the anisotropic hardening behavior of steel sheets during strain-path changes. Int. J. Plast. 2018, 111, 85–106. [Google Scholar] [CrossRef]
- Wroński, M.; Kumar, M.A.; McCabe, R.; Wierzbanowski, K.; Tomé, C. Deformation behavior of CP-titanium under strain path changes: Experiment and crystal plasticity modeling. Int. J. Plast. 2021, 148, 103129. [Google Scholar] [CrossRef]
- Sharma, R.; Sargeant, D.; Daroju, S.; Knezevic, M.; Miles, M.P.; Fullwood, D.T. Multi-strain path deformation behavior of AA6016-T4: Experiments and crystal plasticity modeling. Int. J. Solids Struct. 2022, 244–245, 111536. [Google Scholar] [CrossRef]
- Esche, S.K.; Ahmetoglu, M.A.; Kinzel, G.L.; Altan, T. Numerical and experimental investigation of redrawing of sheet metals. J. Mater. Process. Technol. 2000, 98, 17–24. [Google Scholar] [CrossRef]
- Yapici, G.; Beyerlein, I.; Karaman, I.; Tomé, C. Tension–compression asymmetry in severely deformed pure copper. Acta Mater. 2007, 55, 4603–4613. [Google Scholar] [CrossRef]
- Annin, B.D.; Zhigalkin, V.M. Behavior of Materials under Complex Loading Conditions; SB RAS Publ.: Novosibirsk, Russia, 1999; p. 342. (In Russian) [Google Scholar]
- Trusov, P.V.; Volegov, P.S.; Yanz, A.Y. Two-scale models of polycrystals: Analysis of complex loading. Phys. Mesomech. 2014, 17, 349–355. [Google Scholar] [CrossRef]
- Trusov, P.V.; Volegov, P.S.; Yanz, A.Y. Two-level models of polycrystalline elastoviscoplasticity: Complex loading under large deformations. ZAMM 2015, 95, 1067–1080. [Google Scholar] [CrossRef]
- Peleshko, V.A. Applied and engineering versions of the theory of elastoplastic processes of active complex loading part 2: Identification and verification. Mech. Solids 2016, 51, 91–113. [Google Scholar] [CrossRef]
- Zubchaninov, V.G.; Alekseeva, E.G.; Alekseev, A.A.; Gultiaev, V.I. Modeling of Elastoplastic Steel Deformation in Two-Link Broken Trajectories and Delaying of Vector and Scalar Material Properties. Mater. Phys. Mech. 2019, 42, 436–444. [Google Scholar] [CrossRef]
- Vasin, R.A. Some issues of the relationship between stresses and deformations under complex loading. Elast. Inelast. 1971, 1, 59–126. (In Russian) [Google Scholar]
- Zubchaninov, V.G. Fundamentals of the Theory of Elasticity and Plasticity; High School: Moscow, Russia, 1990; p. 368. (In Russian) [Google Scholar]
- Ilyushin, A.A. Plasticity. Fundamentals of General Mathematical Theory; AS USSR: Moscow, Russia, 1963; p. 272. (In Russian) [Google Scholar]
- Hasegawa, T.; Yakou, T.; Karashima, S. Deformation behaviour and dislocation structures upon stress reversal in polycrystalline aluminium. Mater. Sci. Eng. 1975, 20, 267–276. [Google Scholar] [CrossRef]
- Sang, H.; Lloyd, D.J. The influence of biaxial prestrain on the tensile properties of three aluminum alloys. Met. Mater. Trans. A 1979, 10, 1773–1776. [Google Scholar] [CrossRef]
- Lloyd, D.J.; Sang, H. The influence of strain path on subsequent mechanical properties—Orthogonal tensile paths. Met. Mater. Trans. A 1979, 10, 1767–1772. [Google Scholar] [CrossRef]
- Li, F.; Bate, P. Strain path change effects in cube textured aluminium sheet. Acta Met. Mater. 1991, 39, 2639–2650. [Google Scholar] [CrossRef]
- Bate, P.S. The effects of combined strain-path and strain-rate changes in aluminum. Met. Mater. Trans. A 1993, 24, 2679–2689. [Google Scholar] [CrossRef]
- Wilson, D.; Zandrahimi, M.; Roberts, W. Effects of changes in strain path on work-hardening in CP aluminium and an Al-Cu-Mg alloy. Acta Met. Mater. 1990, 38, 215–226. [Google Scholar] [CrossRef]
- Barlat, F.; Duarte, J.F.; Grácio, J.J.; Lopes, A.B.; Rauch, E.F. Plastic flow for non-monotonic loading conditions of an aluminum alloy sheet sample. Int. J. Plast. 2003, 19, 1215–1244. [Google Scholar] [CrossRef]
- Beyerlein, I.J.; Alexander, D.J.; Tomé, C.N. Plastic anisotropy in aluminum and copper pre-strained by equal channel angular extrusion. J. Mater. Sci. 2007, 42, 1733–1750. [Google Scholar] [CrossRef]
- Beyerlein, I.J.; Tomé, C.N. Modeling transients in the mechanical response of copper due to strain path changes. Int. J. Plast. 2007, 23, 640–664. [Google Scholar] [CrossRef]
- Boers, S.; Schreurs, P.; Geers, M.; Levkovitch, V.; Wang, J.; Svendsen, B. Experimental characterization and model identification of directional hardening effects in metals for complex strain path changes. Int. J. Solids Struct. 2010, 47, 1361–1374. [Google Scholar] [CrossRef]
- Schmitt, J.; Fernandes, J.; Gracio, J.; Vieira, M. Plastic behaviour of copper sheets during sequential tension tests. Mater. Sci. Eng. A 1991, 147, 143–154. [Google Scholar] [CrossRef]
- Wejdemann, C.; Poulsen, H.F.; Lienert, U.; Pantleon, W. In Situ Observation of the Dislocation Structure Evolution During a Strain Path Change in Copper. JOM 2012, 65, 35–43. [Google Scholar] [CrossRef]
- Bouvier, S.; Gardey, B.; Haddadi, H.; Teodosiu, C. Characterization of the strain-induced plastic anisotropy of rolled sheets by using sequences of simple shear and uniaxial tensile tests. J. Mater. Process. Technol. 2006, 174, 115–126. [Google Scholar] [CrossRef]
- Holmedal, B.; Van Houtte, P.; An, Y. A crystal plasticity model for strain-path changes in metals. Int. J. Plast. 2008, 24, 1360–1379. [Google Scholar] [CrossRef]
- Clausmeyer, T.; Bargmann, S.; Svendsen, B. Modeling of anisotropy induced by evolution of dislocation microstructures on different scales. AIP Conf. Proc. 2011, 1353, 121–126. [Google Scholar] [CrossRef]
- Mánik, T.; Holmedal, B.; Hopperstad, O.S. Strain-path change induced transients in flow stress, work hardening and r-values in aluminum. Int. J. Plast. 2015, 69, 1–20. [Google Scholar] [CrossRef]
- Verma, R.K.; Kuwabara, T.; Chung, K.; Haldar, A. Experimental evaluation and constitutive modeling of non-proportional deformation for asymmetric steels. Int. J. Plast. 2011, 27, 82–101. [Google Scholar] [CrossRef]
- Ha, J.; Lee, M.-G.; Barlat, F. Strain hardening response and modeling of EDDQ and DP780 steel sheet under non-linear strain path. Mech. Mater. 2013, 64, 11–26. [Google Scholar] [CrossRef]
- Teodosiu, C.; Hu, Z. Evolution of the intragranular microstructure at moderate and large strains: Modelling and computa-tional significance. In Proceedings of the 5th International Conference on Numerical Methods in Industrial Forming Processes (NUMIFORM’95), Ithaca, NY, USA, 18 June 1995; pp. 173–182. [Google Scholar]
- Holmedal, B.; Hopperstad, O.S.; Berstad, T. Modeling transients related to strain-path changes. In Proceedings of the 12th International Conference on Aluminium Alloys, Yokohama, Japan, 5 September 2010; pp. 510–515. [Google Scholar]
- Levkovitch, V.; Svendsen, B. Accurate hardening modeling as basis for the realistic simulation of sheet forming processes with complex strain-path changes. AIP Conf. Proc. 2007, 907, 358–363. [Google Scholar] [CrossRef]
- Barlat, F.; Gracio, J.J.; Lee, M.-G.; Rauch, E.F.; Vincze, G. An alternative to kinematic hardening in classical plasticity. Int. J. Plast. 2011, 27, 1309–1327. [Google Scholar] [CrossRef]
- Barlat, F.; Ha, J.; Grácio, J.J.; Lee, M.-G.; Rauch, E.F.; Vincze, G. Extension of homogeneous anisotropic hardening model to cross-loading with latent effects. Int. J. Plast. 2012, 46, 130–142. [Google Scholar] [CrossRef]
- Barlat, F.; Vincze, G.; Grácio, J.; Lee, M.-G.; Rauch, E.; Tomé, C. Enhancements of homogenous anisotropic hardening model and application to mild and dual-phase steels. Int. J. Plast. 2013, 58, 201–218. [Google Scholar] [CrossRef]
- Lee, J.; Kim, D.; Lee, Y.-S.; Bong, H.; Barlat, F.; Lee, M.-G. Stress update algorithm for enhanced homogeneous anisotropic hardening model. Comput. Methods Appl. Mech. Eng. 2014, 286, 63–86. [Google Scholar] [CrossRef]
- Valanis, K.C. A Theory of Viscoplasticity without a Yield Surface. Part 1. General Theory. Arch. Mech. 1971, 23, 517–533. [Google Scholar]
- Valanis, K.C. A Theory of Viscoplasticity without a Yield Surface. Part 2. Application to the Mechanical Behavior of Metals. Arch. Mech. 1971, 23, 535–551. [Google Scholar]
- Raphanel, J.; Schmitt, J.-H.; Baudelet, B. Effect of a prestrain on the subsequent yielding of low carbon steel sheets: Experiments and simulations. Int. J. Plast. 1986, 2, 371–378. [Google Scholar] [CrossRef]
- Peeters, B.; Seefeldt, M.; Teodosiu, C.; Kalidindi, S.; Van Houtte, P.; Aernoudt, E. Work-hardening/softening behaviour of b.c.c. polycrystals during changing strain paths: I. An integrated model based on substructure and texture evolution, and its prediction of the stress–strain behaviour of an IF steel during two-stage strain paths. Acta Mater. 2001, 49, 1607–1619. [Google Scholar] [CrossRef]
- Kitayama, K.; Tomé, C.; Rauch, E.; Gracio, J.; Barlat, F. A crystallographic dislocation model for describing hardening of polycrystals during strain path changes. Application to low carbon steels. Int. J. Plast. 2012, 46, 54–69. [Google Scholar] [CrossRef]
- Muhammad, W.; Brahme, A.P.; Kang, J.; Mishra, R.K.; Inal, K. Experimental and numerical investigation of texture evolution and the effects of intragranular backstresses in aluminum alloys subjected to large strain cyclic deformation. Int. J. Plast. 2017, 93, 137–163. [Google Scholar] [CrossRef]
- Zecevic, M.; Knezevic, M. Latent hardening within the elasto-plastic self-consistent polycrystal homogenization to enable the prediction of anisotropy of AA6022-T4 sheets. Int. J. Plast. 2018, 105, 141–163. [Google Scholar] [CrossRef]
- Beyerlein, I.; Lebensohn, R.; Tomé, C. Modeling texture and microstructural evolution in the equal channel angular extrusion process. Mater. Sci. Eng. A 2003, 345, 122–138. [Google Scholar] [CrossRef]
- Tóth, L.S.; Estrin, Y.; Lapovok, R.; Gu, C. A model of grain fragmentation based on lattice curvature. Acta Mater. 2010, 58, 1782–1794. [Google Scholar] [CrossRef]
- Trusov, P.V.; Volegov, P.S.; Yanz, A.Y. Two-scale models of polycrystals: Evaluation of validity of Ilyushin’s isotropy postulate at large displacement gradients. Phys. Mesomech. 2016, 19, 21–34. [Google Scholar] [CrossRef]
- Bronkhorst, C.A.; Kalidindi, S.R.; Anand, L. Polycrystalline plasticity and the evolution of crystallographic texture in FCC metals. Philos. Trans. R. Soc. London. Ser. A: Phys. Eng. Sci. 1992, 341, 443–477. [Google Scholar] [CrossRef]
- Habraken, A.M. Modelling the plastic anisotropy of metals. Arch. Comput. Methods Eng. 2004, 11, 3–96. [Google Scholar] [CrossRef]
- Van Houtte, P.; Li, S.; Seefeldt, M.; Delannay, L. Deformation texture prediction: From the Taylor model to the advanced Lamel model. Int. J. Plast. 2005, 21, 589–624. [Google Scholar] [CrossRef]
- Zhang, K.; Holmedal, B.; Hopperstad, O.; Dumoulin, S.; Gawad, J.; Van Bael, A.; Van Houtte, P. Multi-level modelling of mechanical anisotropy of commercial pure aluminium plate: Crystal plasticity models, advanced yield functions and parameter identification. Int. J. Plast. 2014, 66, 3–30. [Google Scholar] [CrossRef]
- Trusov, P.V.; Shveykin, A.I.; Kondratev, N.S. Multilevel Metal Models: Formulation for Large Displacement Gradients. NST 2017, 8, 133–166. [Google Scholar] [CrossRef]
- Romanova, V.; Balokhonov, R.; Emelianova, E.; Sinyakova, E.; Kazachenok, M. Early prediction of macroscale plastic strain localization in titanium from observation of mesoscale surface roughening. Int. J. Mech. Sci. 2019, 161–162, 105047. [Google Scholar] [CrossRef]
- Emelianova, E.S.; Romanova, V.A.; Balokhonov, R.R.; Pisarev, M.; Zinovieva, O.S. A Numerical Study of the Contribution of Different Slip Systems to the Deformation Response of Polycrystalline Titanium. Phys. Mesomech. 2021, 24, 166–177. [Google Scholar] [CrossRef]
- Anand, L. Single-crystal elasto-viscoplasticity: Application to texture evolution in polycrystalline metals at large strains. Comput. Methods Appl. Mech. Eng. 2004, 193, 5359–5383. [Google Scholar] [CrossRef]
- Bhattacharyya, A.; El-Danaf, E.; Kalidindi, S.; Doherty, R.D. Evolution of grain-scale microstructure during large strain simple compression of polycrystalline aluminum with quasi-columnar grains: OIM measurements and numerical simulations. Int. J. Plast. 2001, 17, 861–883. [Google Scholar] [CrossRef]
- Liu, B.; Raabe, D.; Roters, F.; Eisenlohr, P.; Lebensohn, R. Comparison of finite element and fast Fourier transform crystal plasticity solvers for texture prediction. Model. Simul. Mater. Sci. Eng. 2010, 18, 085005. [Google Scholar] [CrossRef]
- Zhang, H.; Diehl, M.; Roters, F.; Raabe, D. A virtual laboratory using high resolution crystal plasticity simulations to determine the initial yield surface for sheet metal forming operations. Int. J. Plast. 2016, 80, 111–138. [Google Scholar] [CrossRef]
- Liu, W.; Chen, B.K.; Pang, Y. Numerical investigation of evolution of earing, anisotropic yield and plastic potentials in cold rolled FCC aluminium alloy based on the crystallographic texture measurements. Eur. J. Mech.—A/Solids 2018, 75, 41–55. [Google Scholar] [CrossRef]
- Demir, E.; Gutierrez-Urrutia, I. Investigation of strain hardening near grain boundaries of an aluminum oligocrystal: Experiments and crystal based finite element method. Int. J. Plast. 2020, 136, 102898. [Google Scholar] [CrossRef]
- Trusov, P.V.; Gribov, D.S. The Three-Level Elastoviscoplastic Model and Its Application to Describing Complex Cyclic Loading of Materials with Different Stacking Fault Energies. Materials 2022, 15, 760. [Google Scholar] [CrossRef]
- Trusov, P.V.; Shveykin, A.I. On motion decomposition and constitutive relations in geometrically nonlinear elastoviscoplasticity of crystallites. Phys. Mesomech. 2017, 20, 377–391. [Google Scholar] [CrossRef]
- Shveykin, A.; Trusov, P.V. Multilevel Models of Polycrystalline Metals: Comparison of Relations Describing the Crystallite Lattice Rotations. Nanosci. Technol. Int. J. 2019, 10, 1–20. [Google Scholar] [CrossRef]
- Horstemeyer, M.F.; Potirniche, G.P.; Marin, E.B. Crystal plasticity. In Handbook of Materials Modeling; Yip, S., Ed.; Springer: Cham, The Netherlands, 2005; pp. 1133–1149. [Google Scholar]
- Maresca, F.; Kouznetsova, V.; Geers, M. Reduced crystal plasticity for materials with constrained slip activity. Mech. Mater. 2015, 92, 198–210. [Google Scholar] [CrossRef]
- Grilli, N.; Janssens, K.; Nellessen, J.; Sandlöbes, S.; Raabe, D. Multiple slip dislocation patterning in a dislocation-based crystal plasticity finite element method. Int. J. Plast. 2017, 100, 104–121. [Google Scholar] [CrossRef]
- Roters, F.; Diehl, M.; Shanthraj, P.; Eisenlohr, P.; Reuber, C.; Wong, S.; Maiti, T.; Ebrahimi, A.; Hochrainer, T.; Fabritius, H.-O.; et al. DAMASK—The Düsseldorf Advanced Material Simulation Kit for modeling multi-physics crystal plasticity, thermal, and damage phenomena from the single crystal up to the component scale. Comput. Mater. Sci. 2018, 158, 420–478. [Google Scholar] [CrossRef]
- Shveykin, A.I. Multilevel Models of Polycrystalline Metals: Comparison of Constitutive Relations for Crystallites. Probl. Strength Plast. 2017, 79, 385–397. [Google Scholar] [CrossRef]
- Qin, J.; Holmedal, B.; Zhang, K.; Hopperstad, O.S. Modeling strain-path changes in aluminum and steel. Int. J. Solids Struct. 2017, 117, 123–136. [Google Scholar] [CrossRef]
- Silbermann, C.; Shutov, A.; Ihlemann, J. Modeling the evolution of dislocation populations under non-proportional loading. Int. J. Plast. 2014, 55, 58–79. [Google Scholar] [CrossRef]
- Forest, S.; Rubin, M. A rate-independent crystal plasticity model with a smooth elastic–plastic transition and no slip indeterminacy. Eur. J. Mech.—A/Solids 2016, 55, 278–288. [Google Scholar] [CrossRef]
- Kotha, S.; Ozturk, D.; Ghosh, S. Parametrically homogenized constitutive models (PHCMs) from micromechanical crystal plasticity FE simulations, part I: Sensitivity analysis and parameter identification for Titanium alloys. Int. J. Plast. 2019, 120, 296–319. [Google Scholar] [CrossRef]
- Schmitt, J.; Shen, E.; Raphanel, J. A parameter for measuring the magnitude of a change of strain path: Validation and comparison with experiments on low carbon steel. Int. J. Plast. 1994, 10, 535–551. [Google Scholar] [CrossRef]
- Viatkina, E.M.; Brekelmans, W.A.M.; Geers, M.G.D. Numerical analysis of strain path dependency in FCC metals. Comput. Mech. 2007, 41, 391–405. [Google Scholar] [CrossRef]
- Rocks, U.; Canova, G.; Jonas, J. Yield vectors in f.c.c. crystals. Acta Met. 1983, 31, 1243–1252. [Google Scholar] [CrossRef]
- Kuhlmann-Wilsdorf, D.; Moore, J.T.; Starke, E.A.; Kulkarni, S.S. Deformation bands, the LEDS theory, and their importance in texture development: Part I. Previous evidence and new observations. Met. Mater. Trans. A 1999, 30, 2491–2501. [Google Scholar] [CrossRef]
- Trusov, P.V.; Yanz, A.Y. Physical meaning of nonholonomic strain measure. Phys. Mesomech. 2016, 19, 215–222. [Google Scholar] [CrossRef]


| Parameter | Definition | Value |
|---|---|---|
| independent components of the elastic property tensor [77] | 106.75 GPa | |
| 60.41 GPa | ||
| 28.34 GPa | ||
| parameters for viscoplastic relation (2)2 [77] | 0.001 s−1 | |
| 50 | ||
| initial critical shear stress for the anisotropic hardening law | 6 MPa | |
| latent hardening parameter | 2 | |
| saturation stress | 34 MPa | |
| anisotropic hardening law parameters | 115 MPa | |
| 2.25 | ||
| initial critical shear stress for the isotropic hardening law | 3 MPa | |
| isotropic hardening law parameters | 29 MPa | |
| 0.4 |
Publisher’s Note: MDPI stays neutral with regard to jurisdictional claims in published maps and institutional affiliations. |
© 2022 by the authors. Licensee MDPI, Basel, Switzerland. This article is an open access article distributed under the terms and conditions of the Creative Commons Attribution (CC BY) license (https://creativecommons.org/licenses/by/4.0/).
Share and Cite
Shveykin, A.; Romanov, K.; Trusov, P. Some Issues with Statistical Crystal Plasticity Models: Description of the Effects Triggered in FCC Crystals by Loading with Strain-Path Changes. Materials 2022, 15, 6586. https://doi.org/10.3390/ma15196586
Shveykin A, Romanov K, Trusov P. Some Issues with Statistical Crystal Plasticity Models: Description of the Effects Triggered in FCC Crystals by Loading with Strain-Path Changes. Materials. 2022; 15(19):6586. https://doi.org/10.3390/ma15196586
Chicago/Turabian StyleShveykin, Alexey, Kirill Romanov, and Peter Trusov. 2022. "Some Issues with Statistical Crystal Plasticity Models: Description of the Effects Triggered in FCC Crystals by Loading with Strain-Path Changes" Materials 15, no. 19: 6586. https://doi.org/10.3390/ma15196586