
Early-Stage Geopolymerization Process of Metakaolin-Based Geopolymer
 , ,
, ,
Abstract
:1. Introduction
2. Materials and Methods
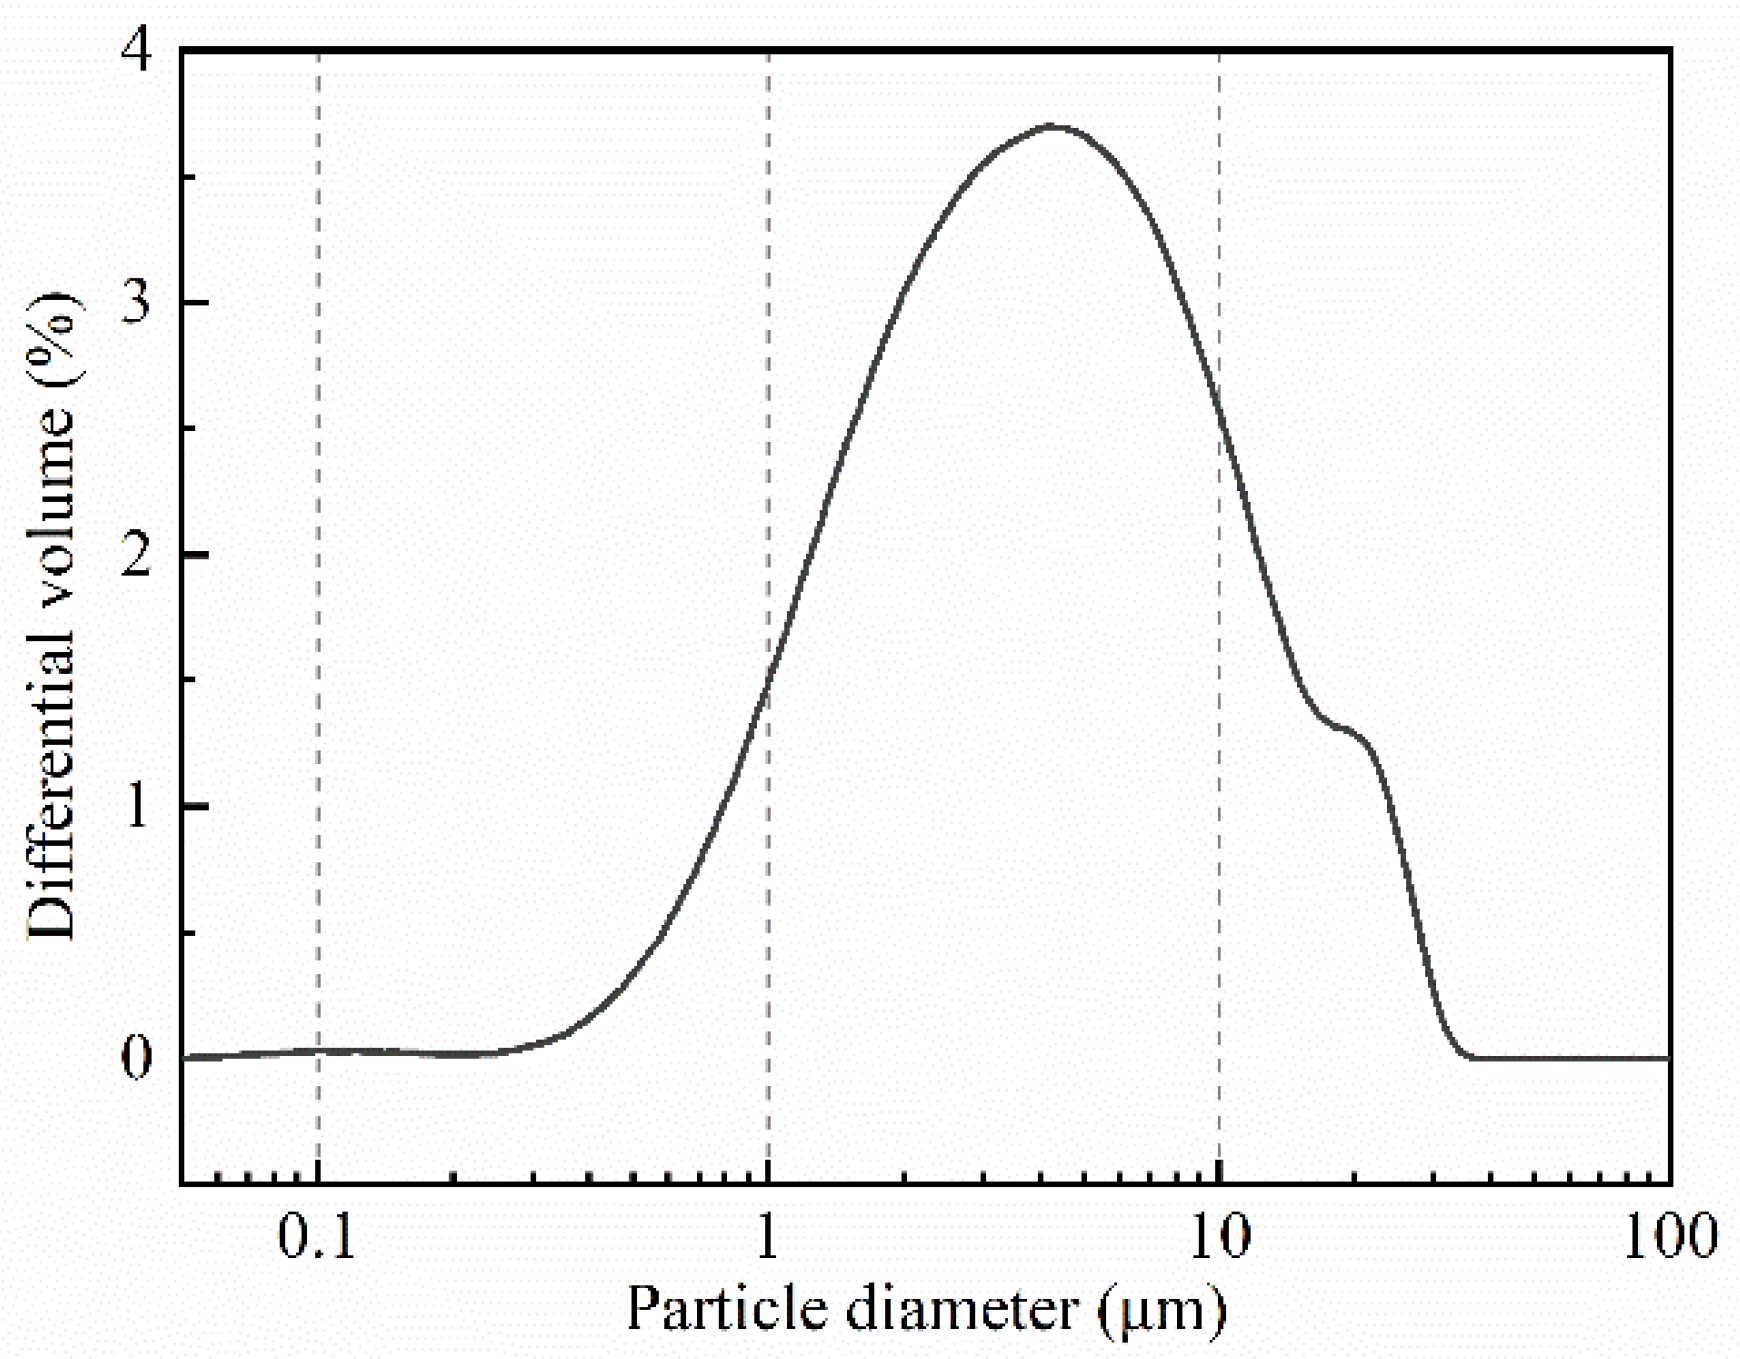
2.1. Sample Preparation
2.2. Non-Contact Electrical Resistivity Test
2.3. Chemical Deformation Test
2.4. Autogenous Strain Test
2.5. Setting Time Test
2.6. Water Loss Measurement
2.7. ICP-OES Test
3. Results
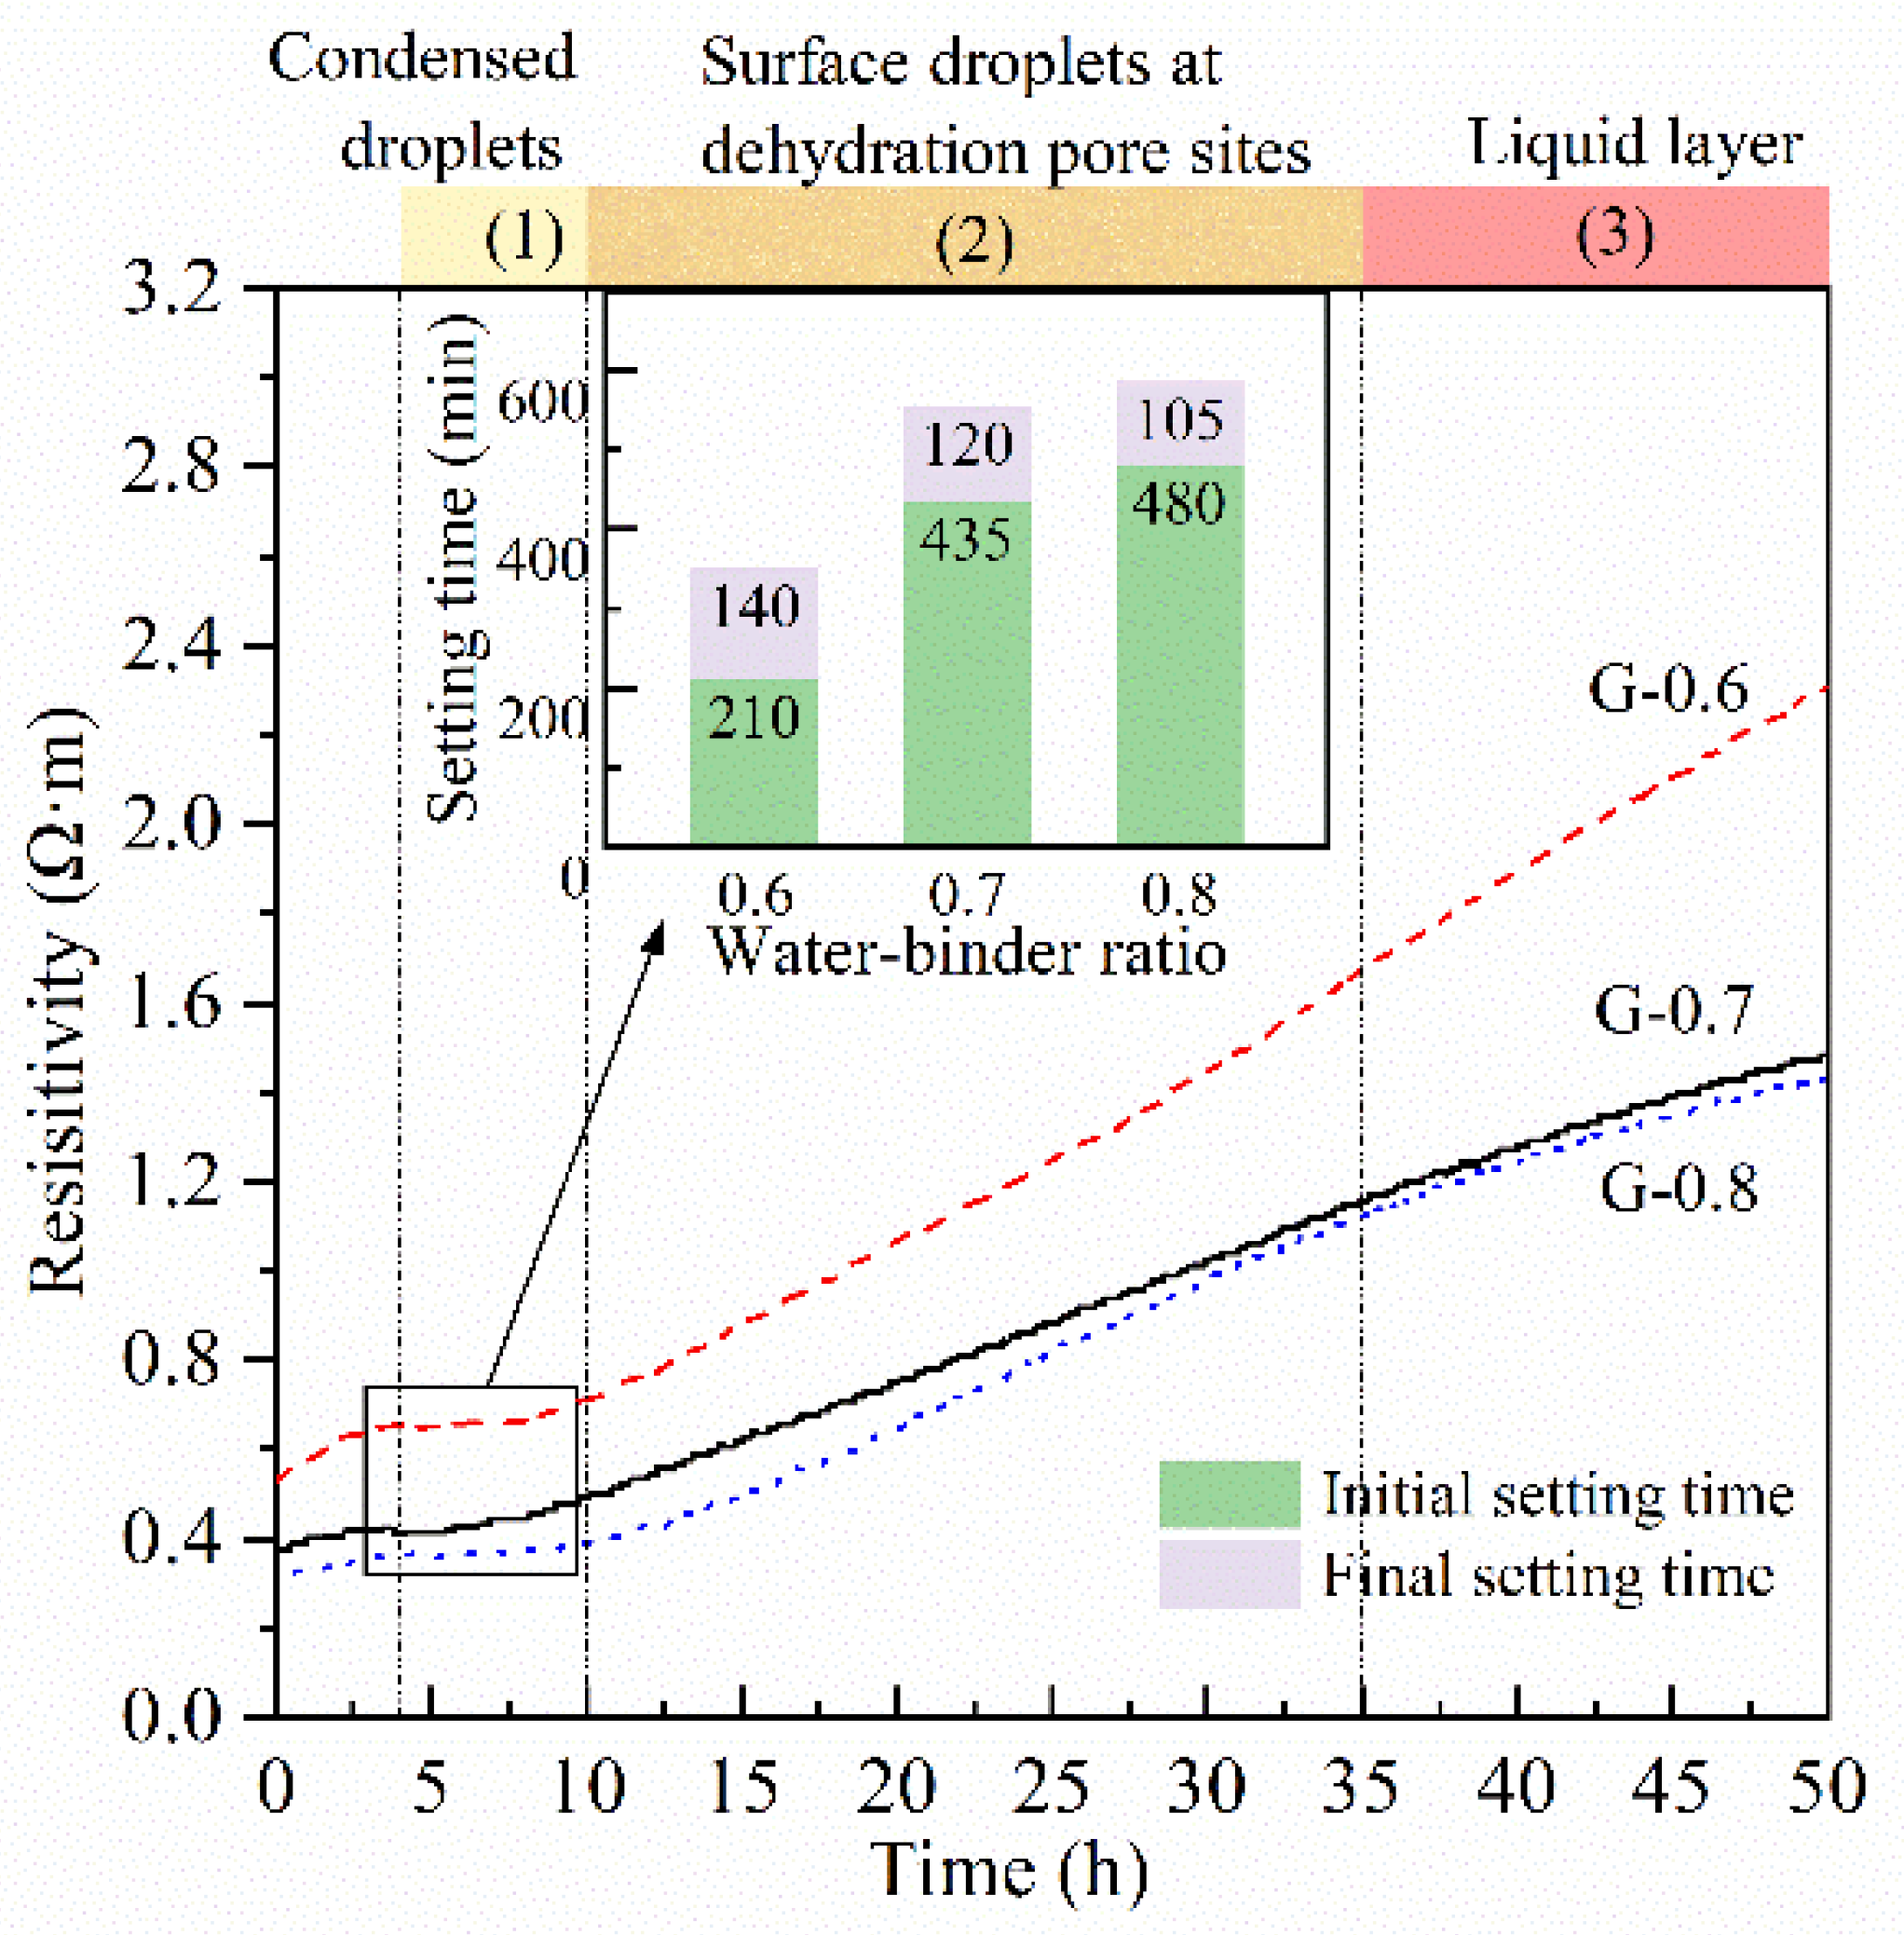
3.1. Resistivity Evolution
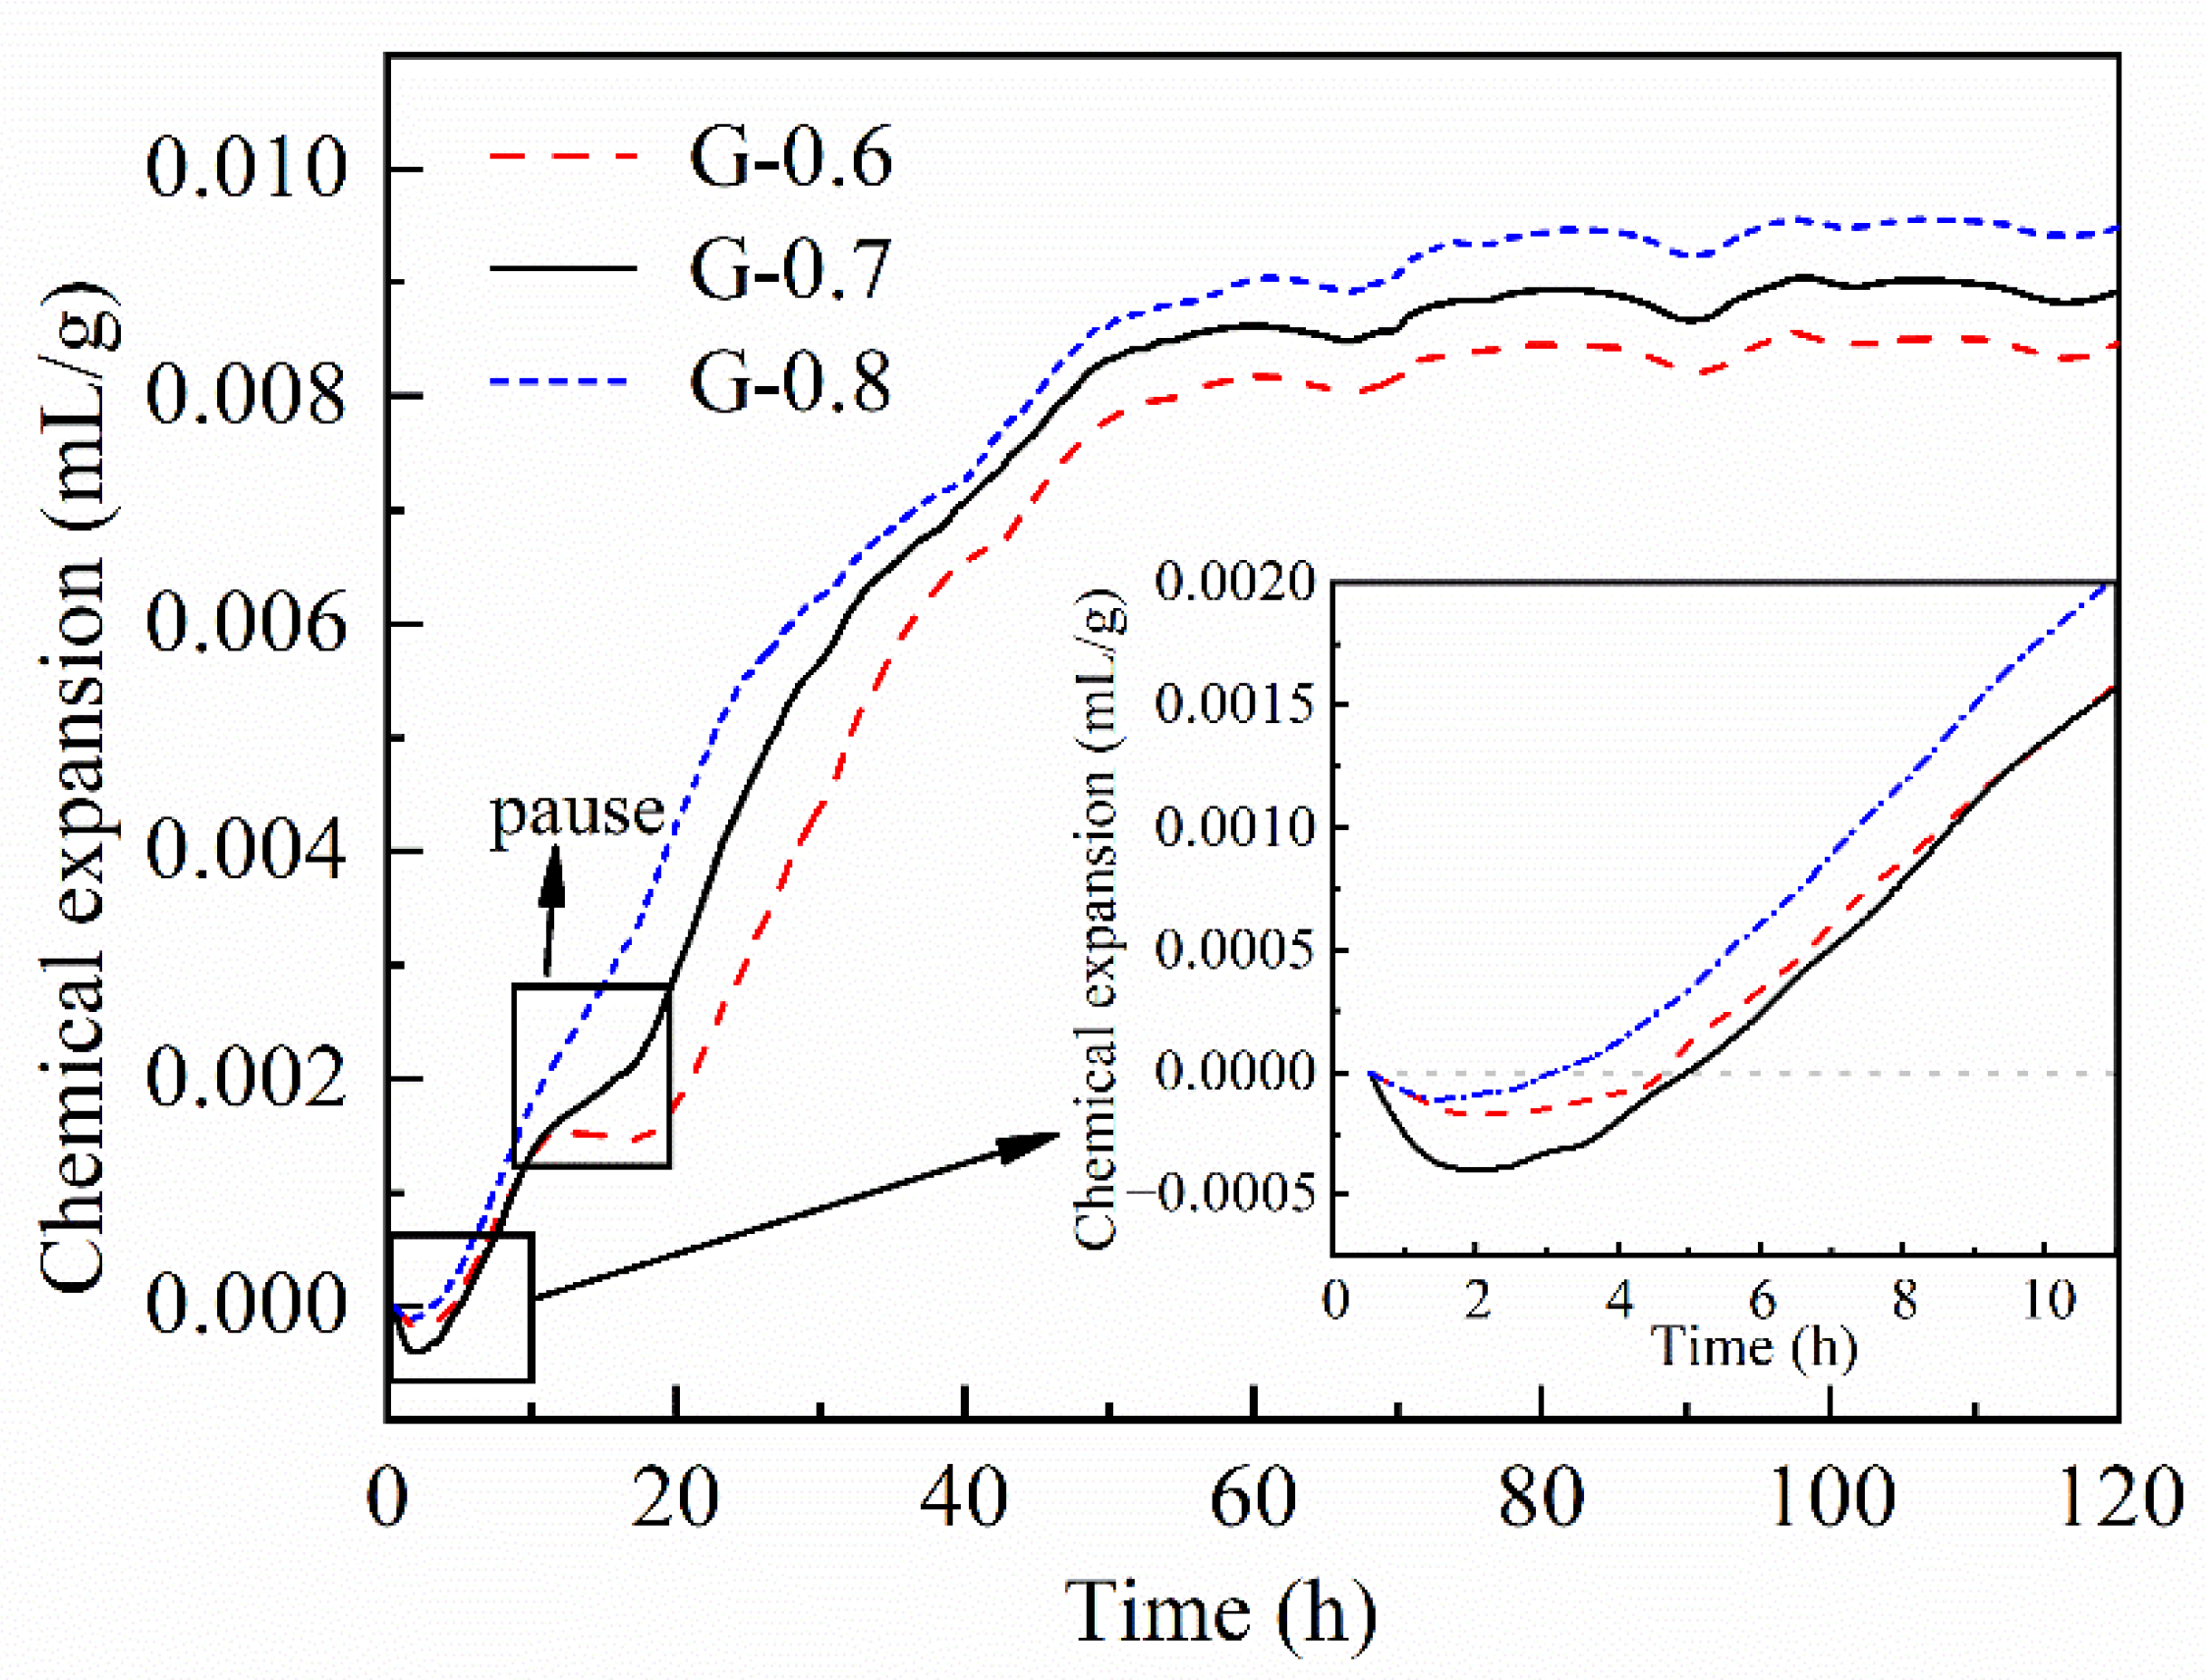
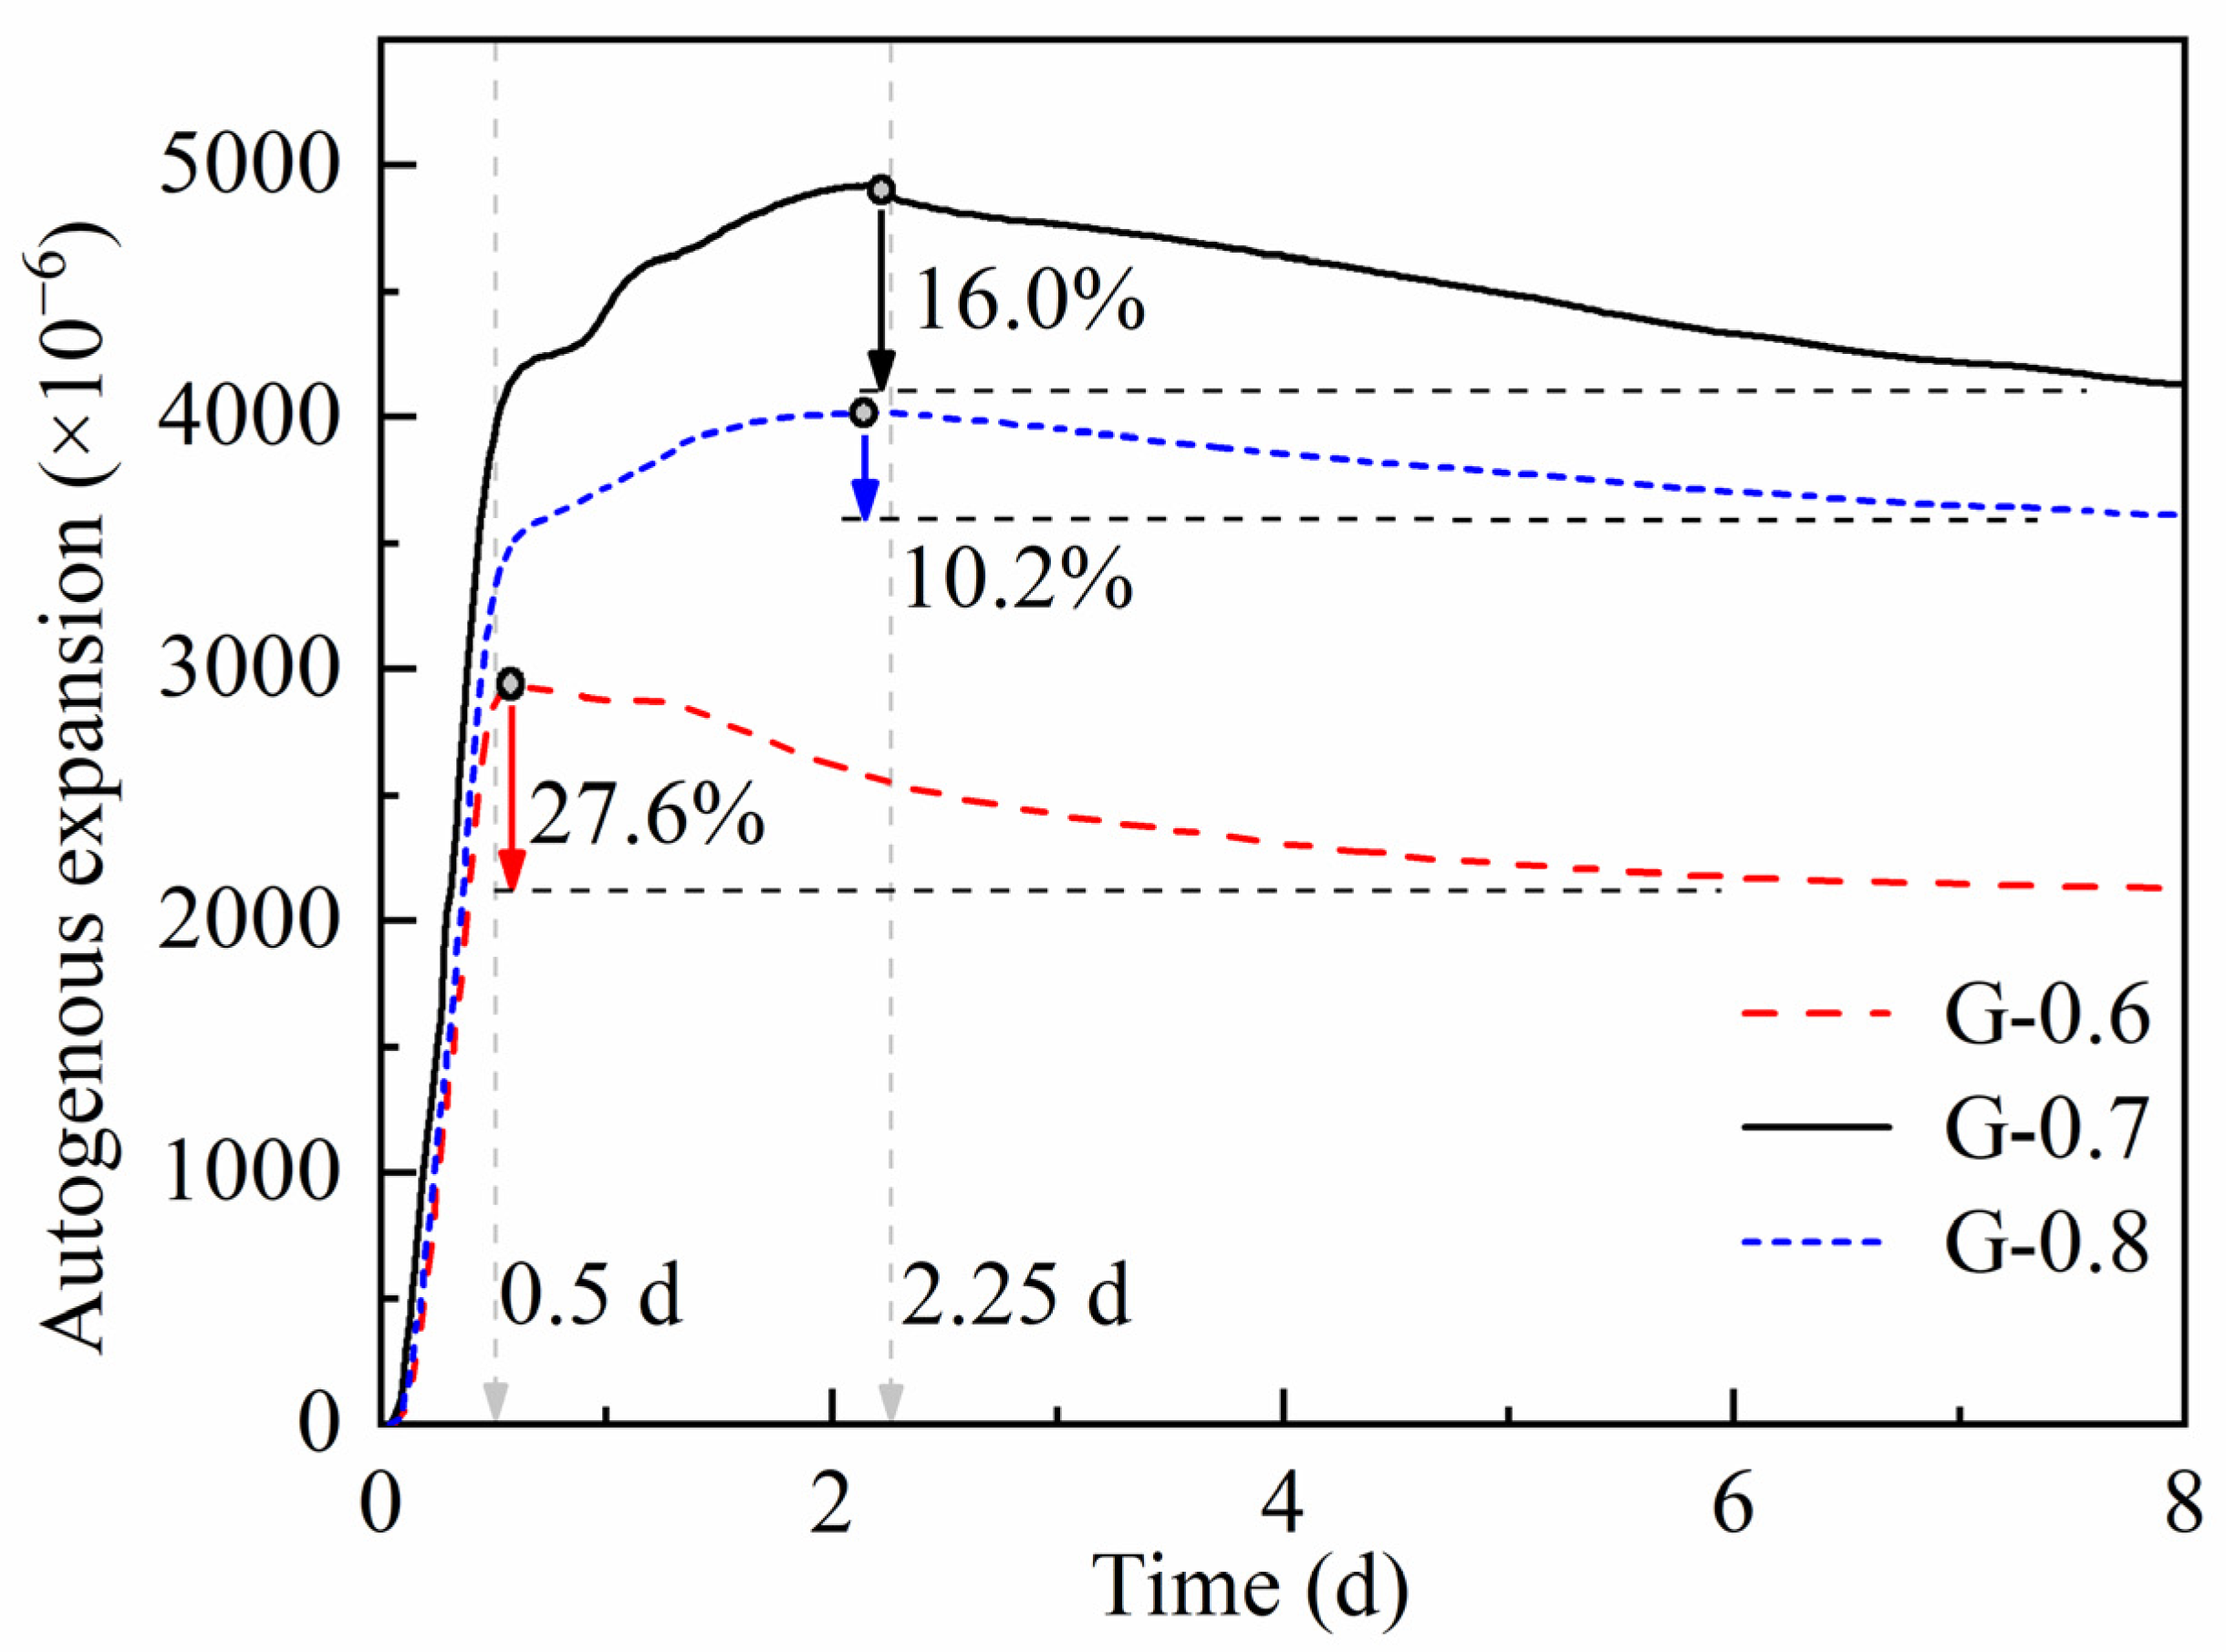
3.2. Chemical Deformation and Autogenous Strain
3.3. Setting Time
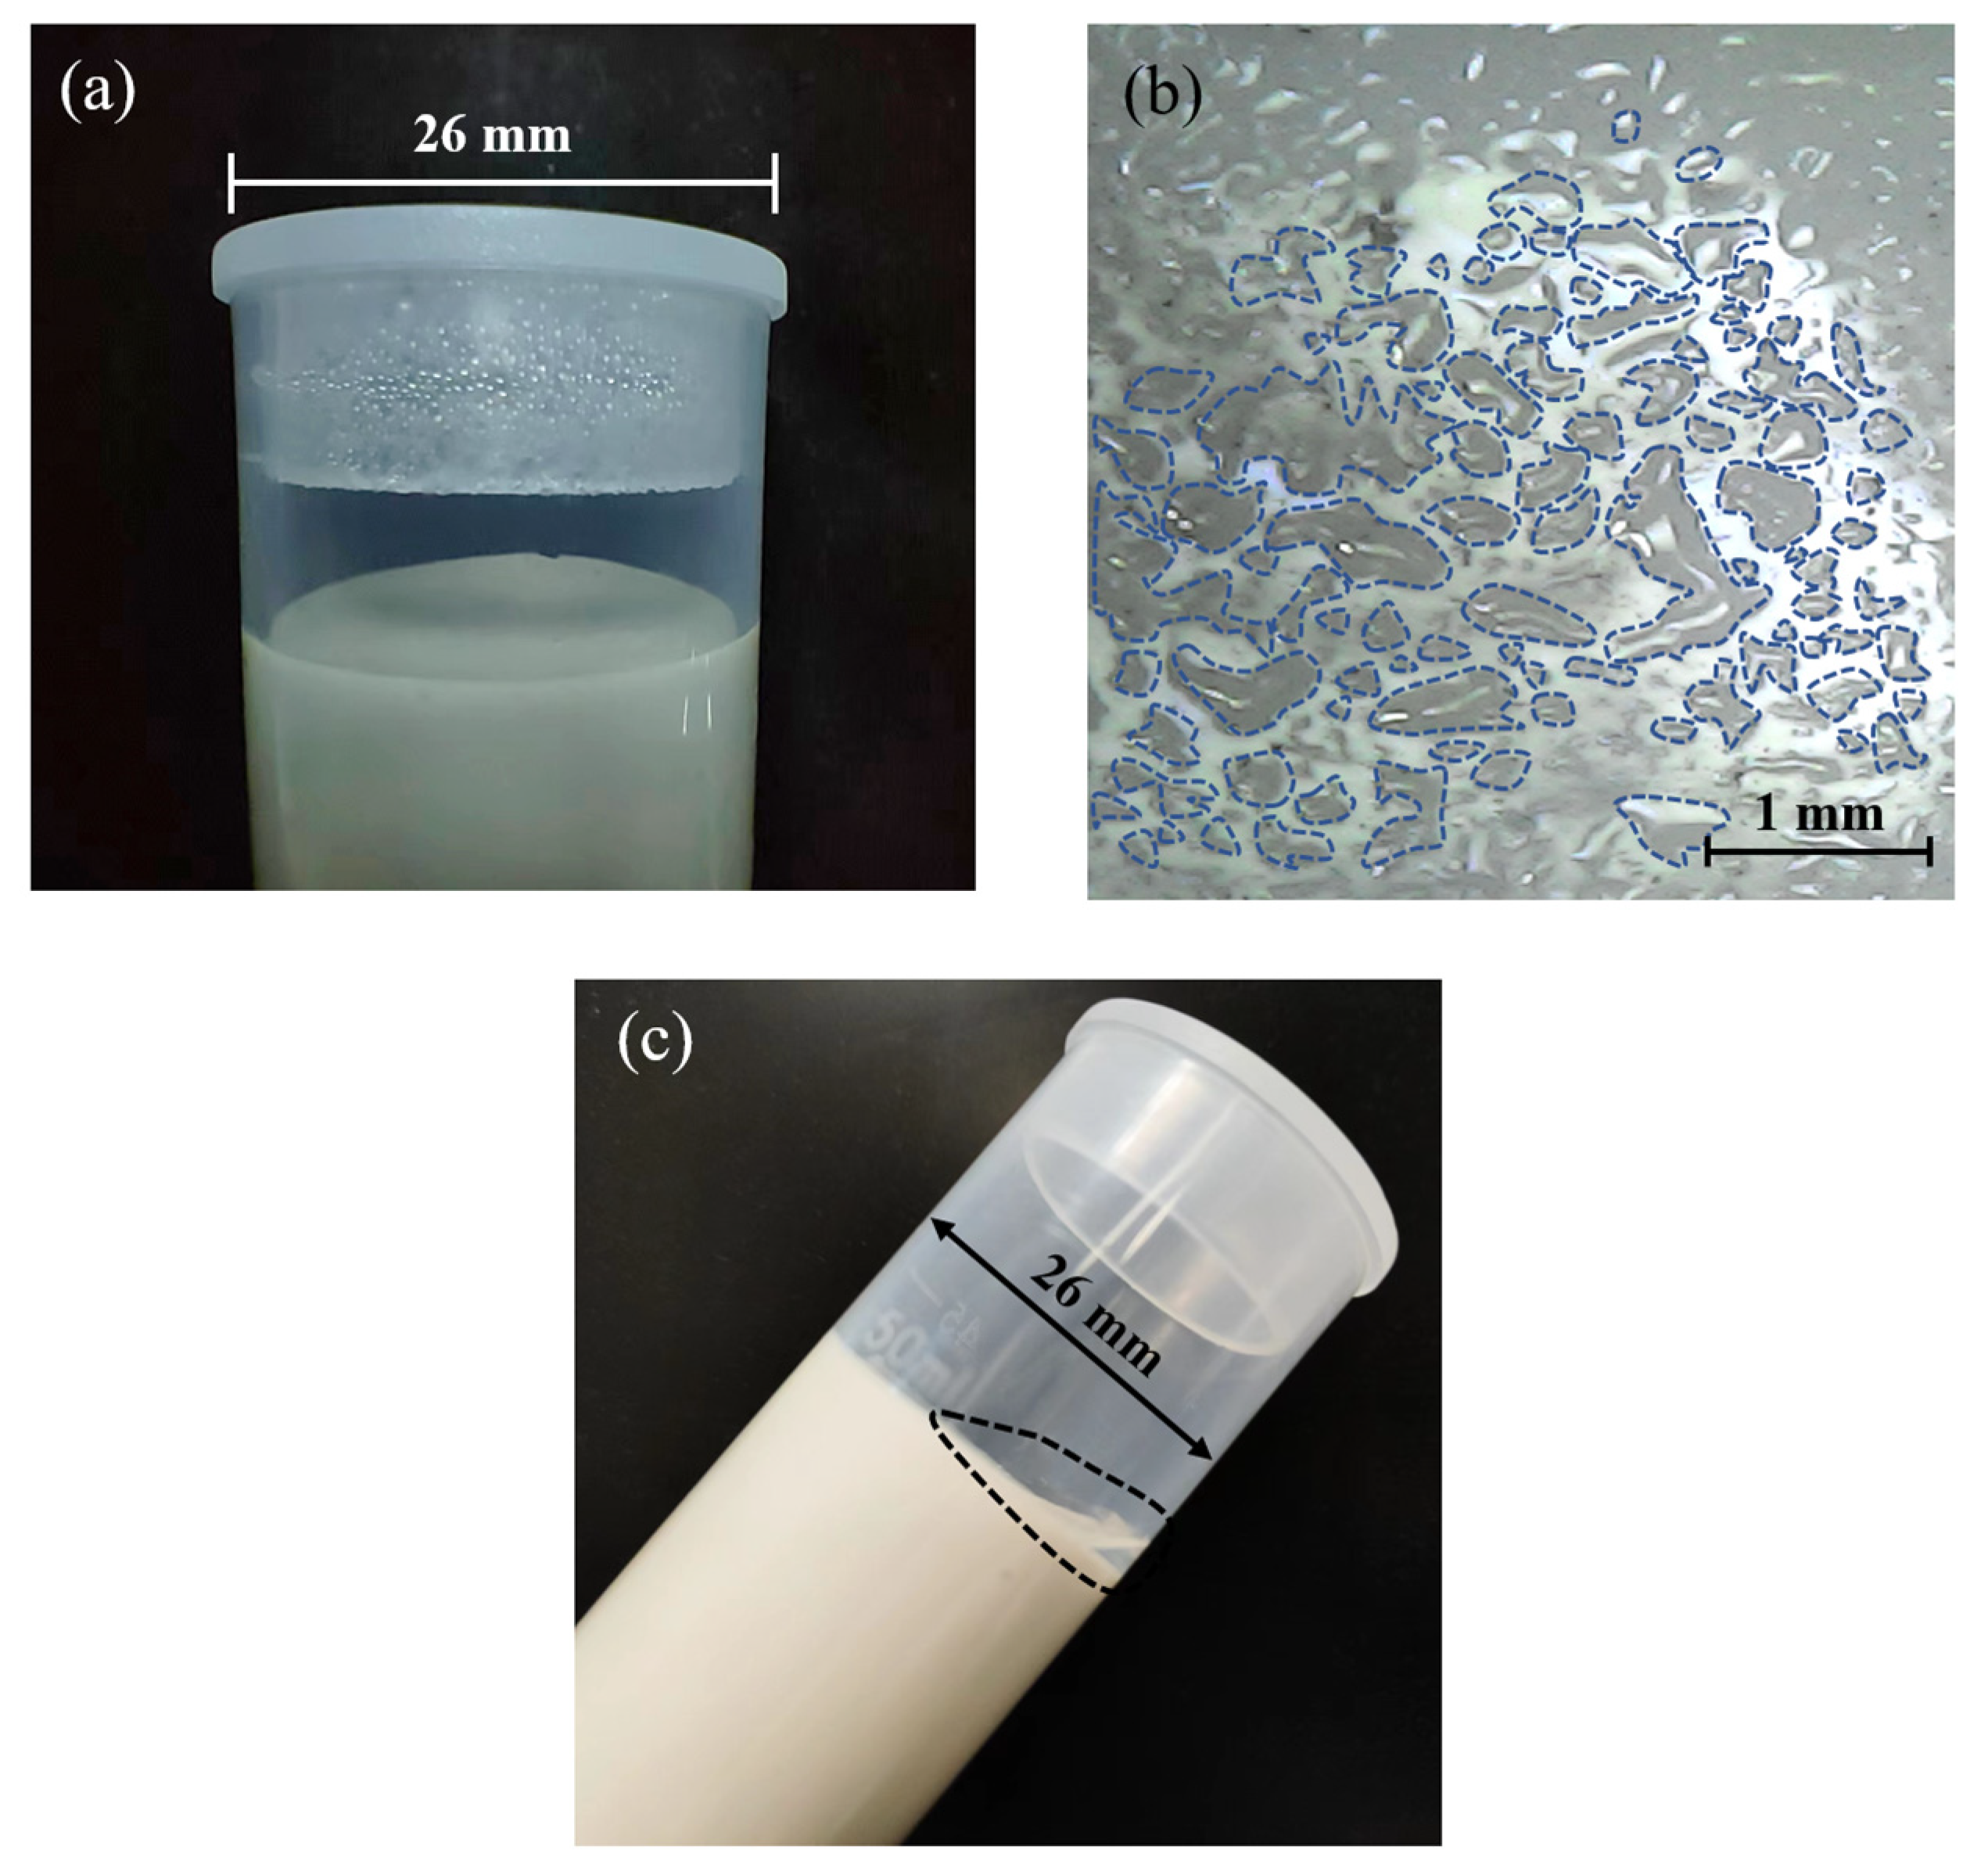
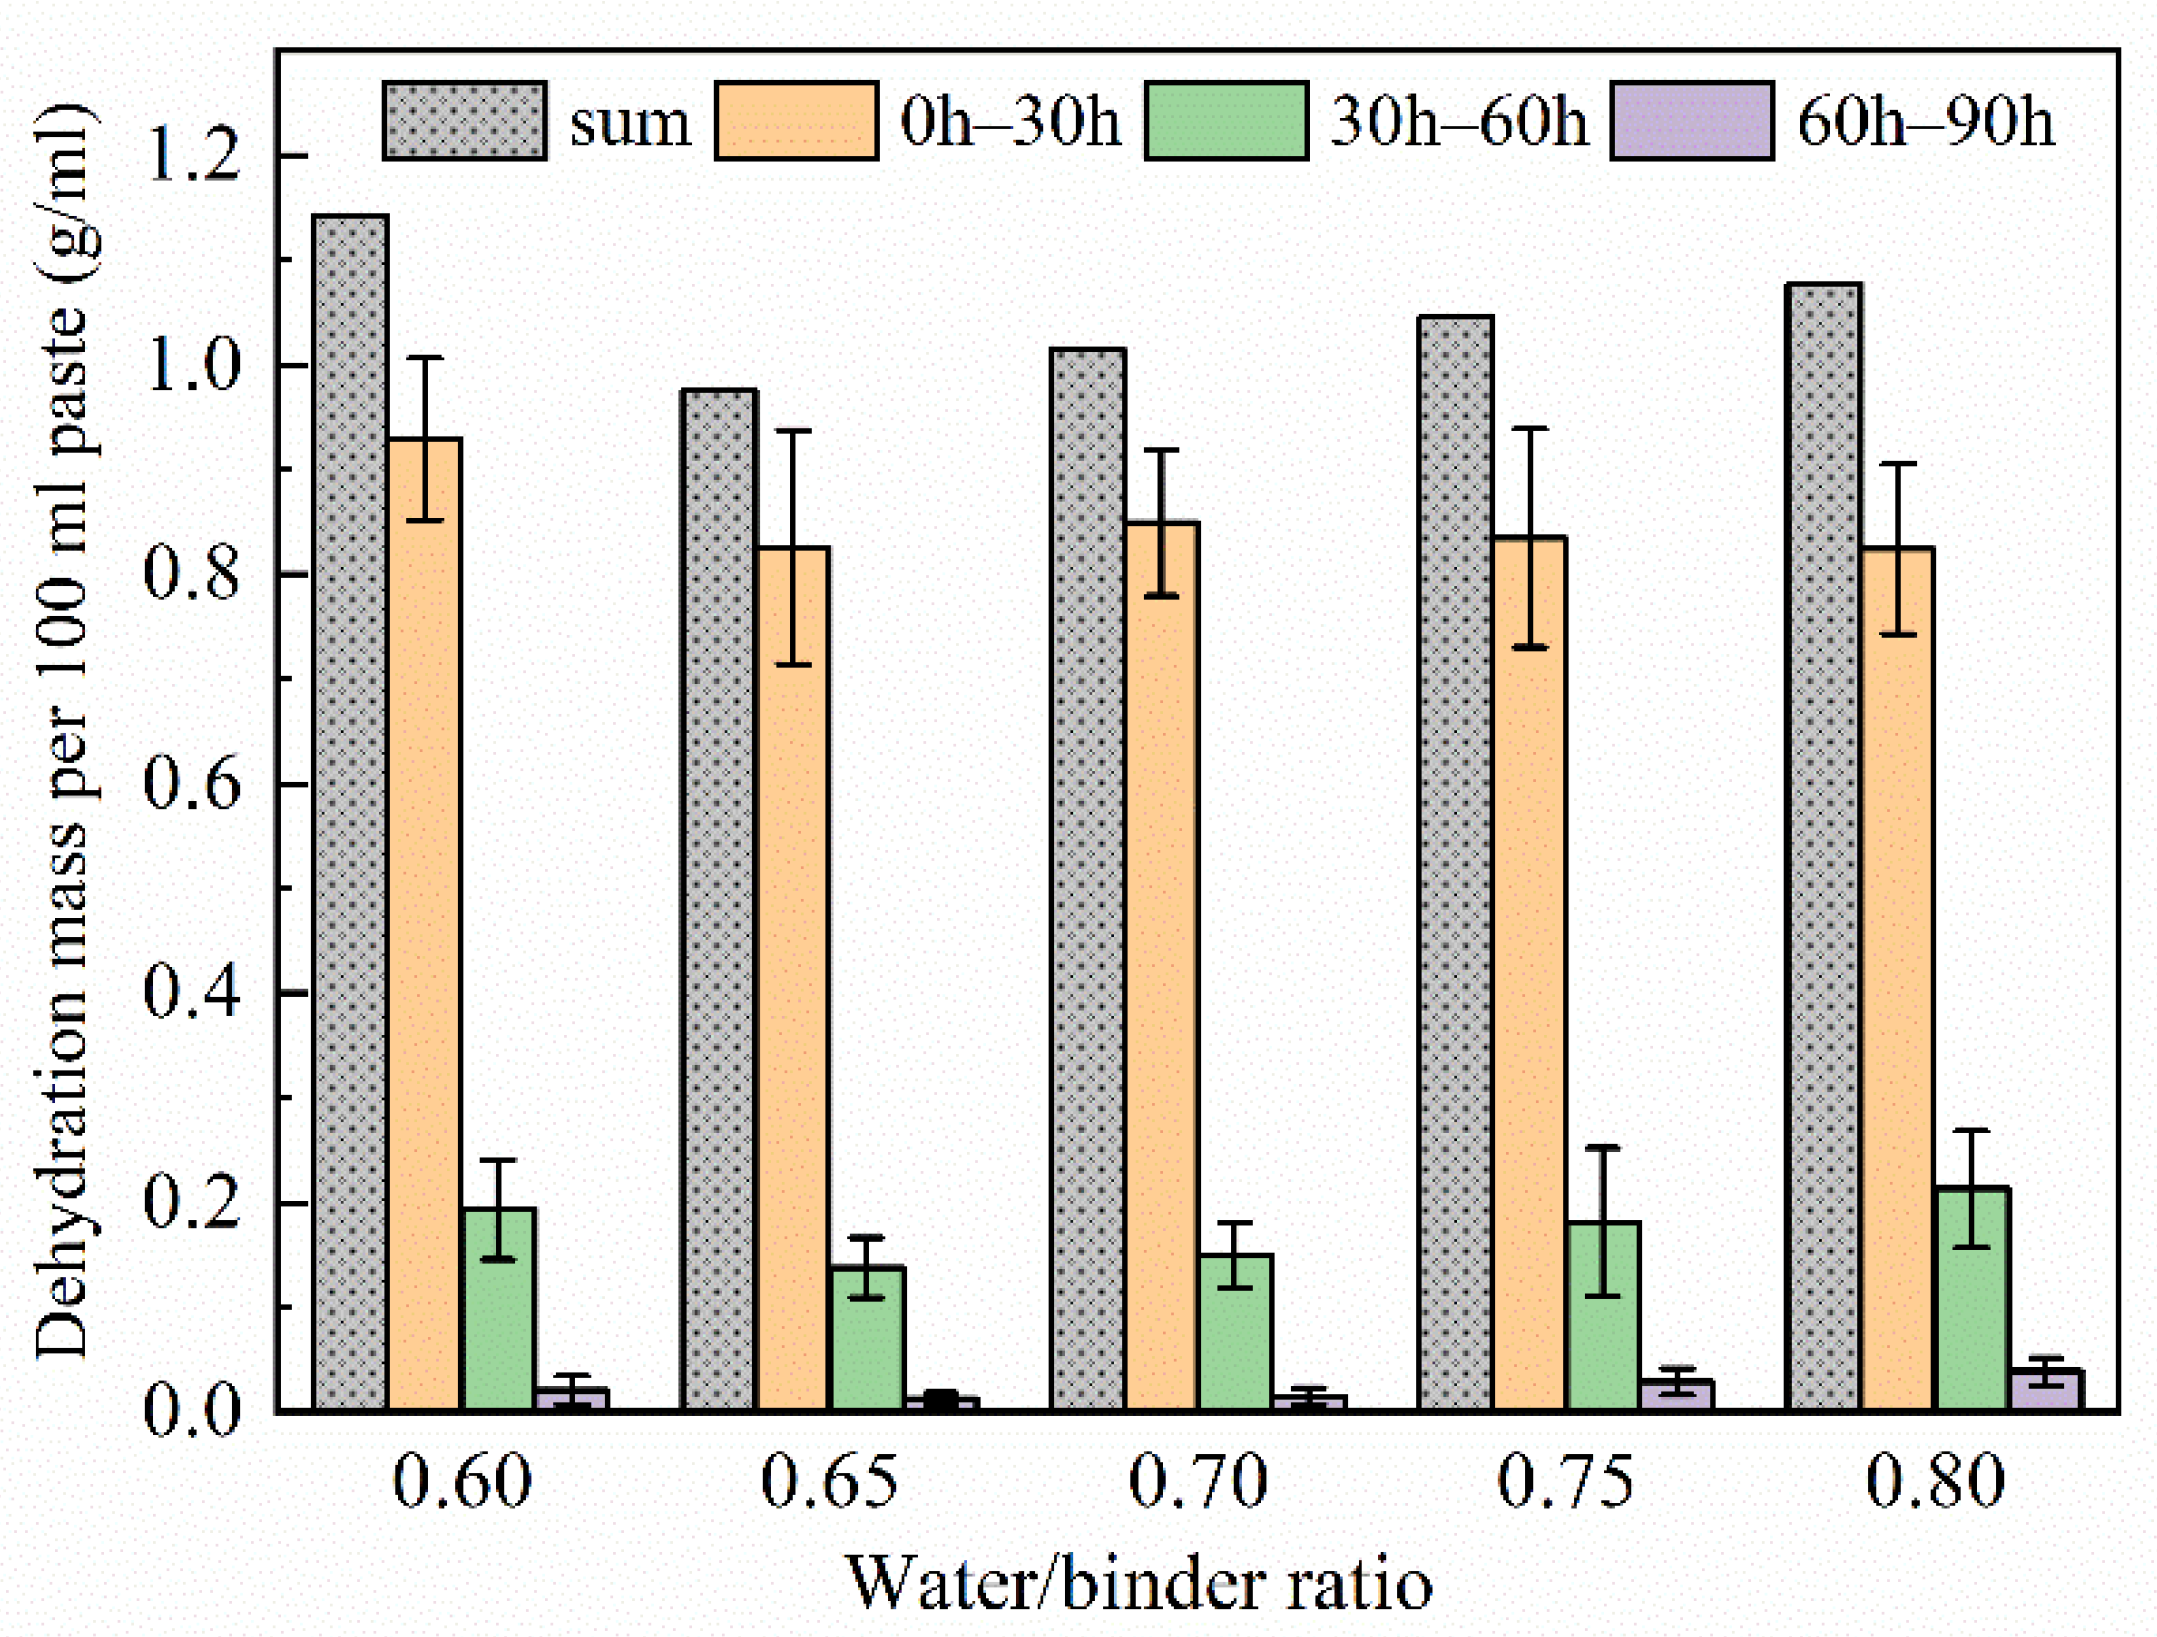
3.4. Water Loss
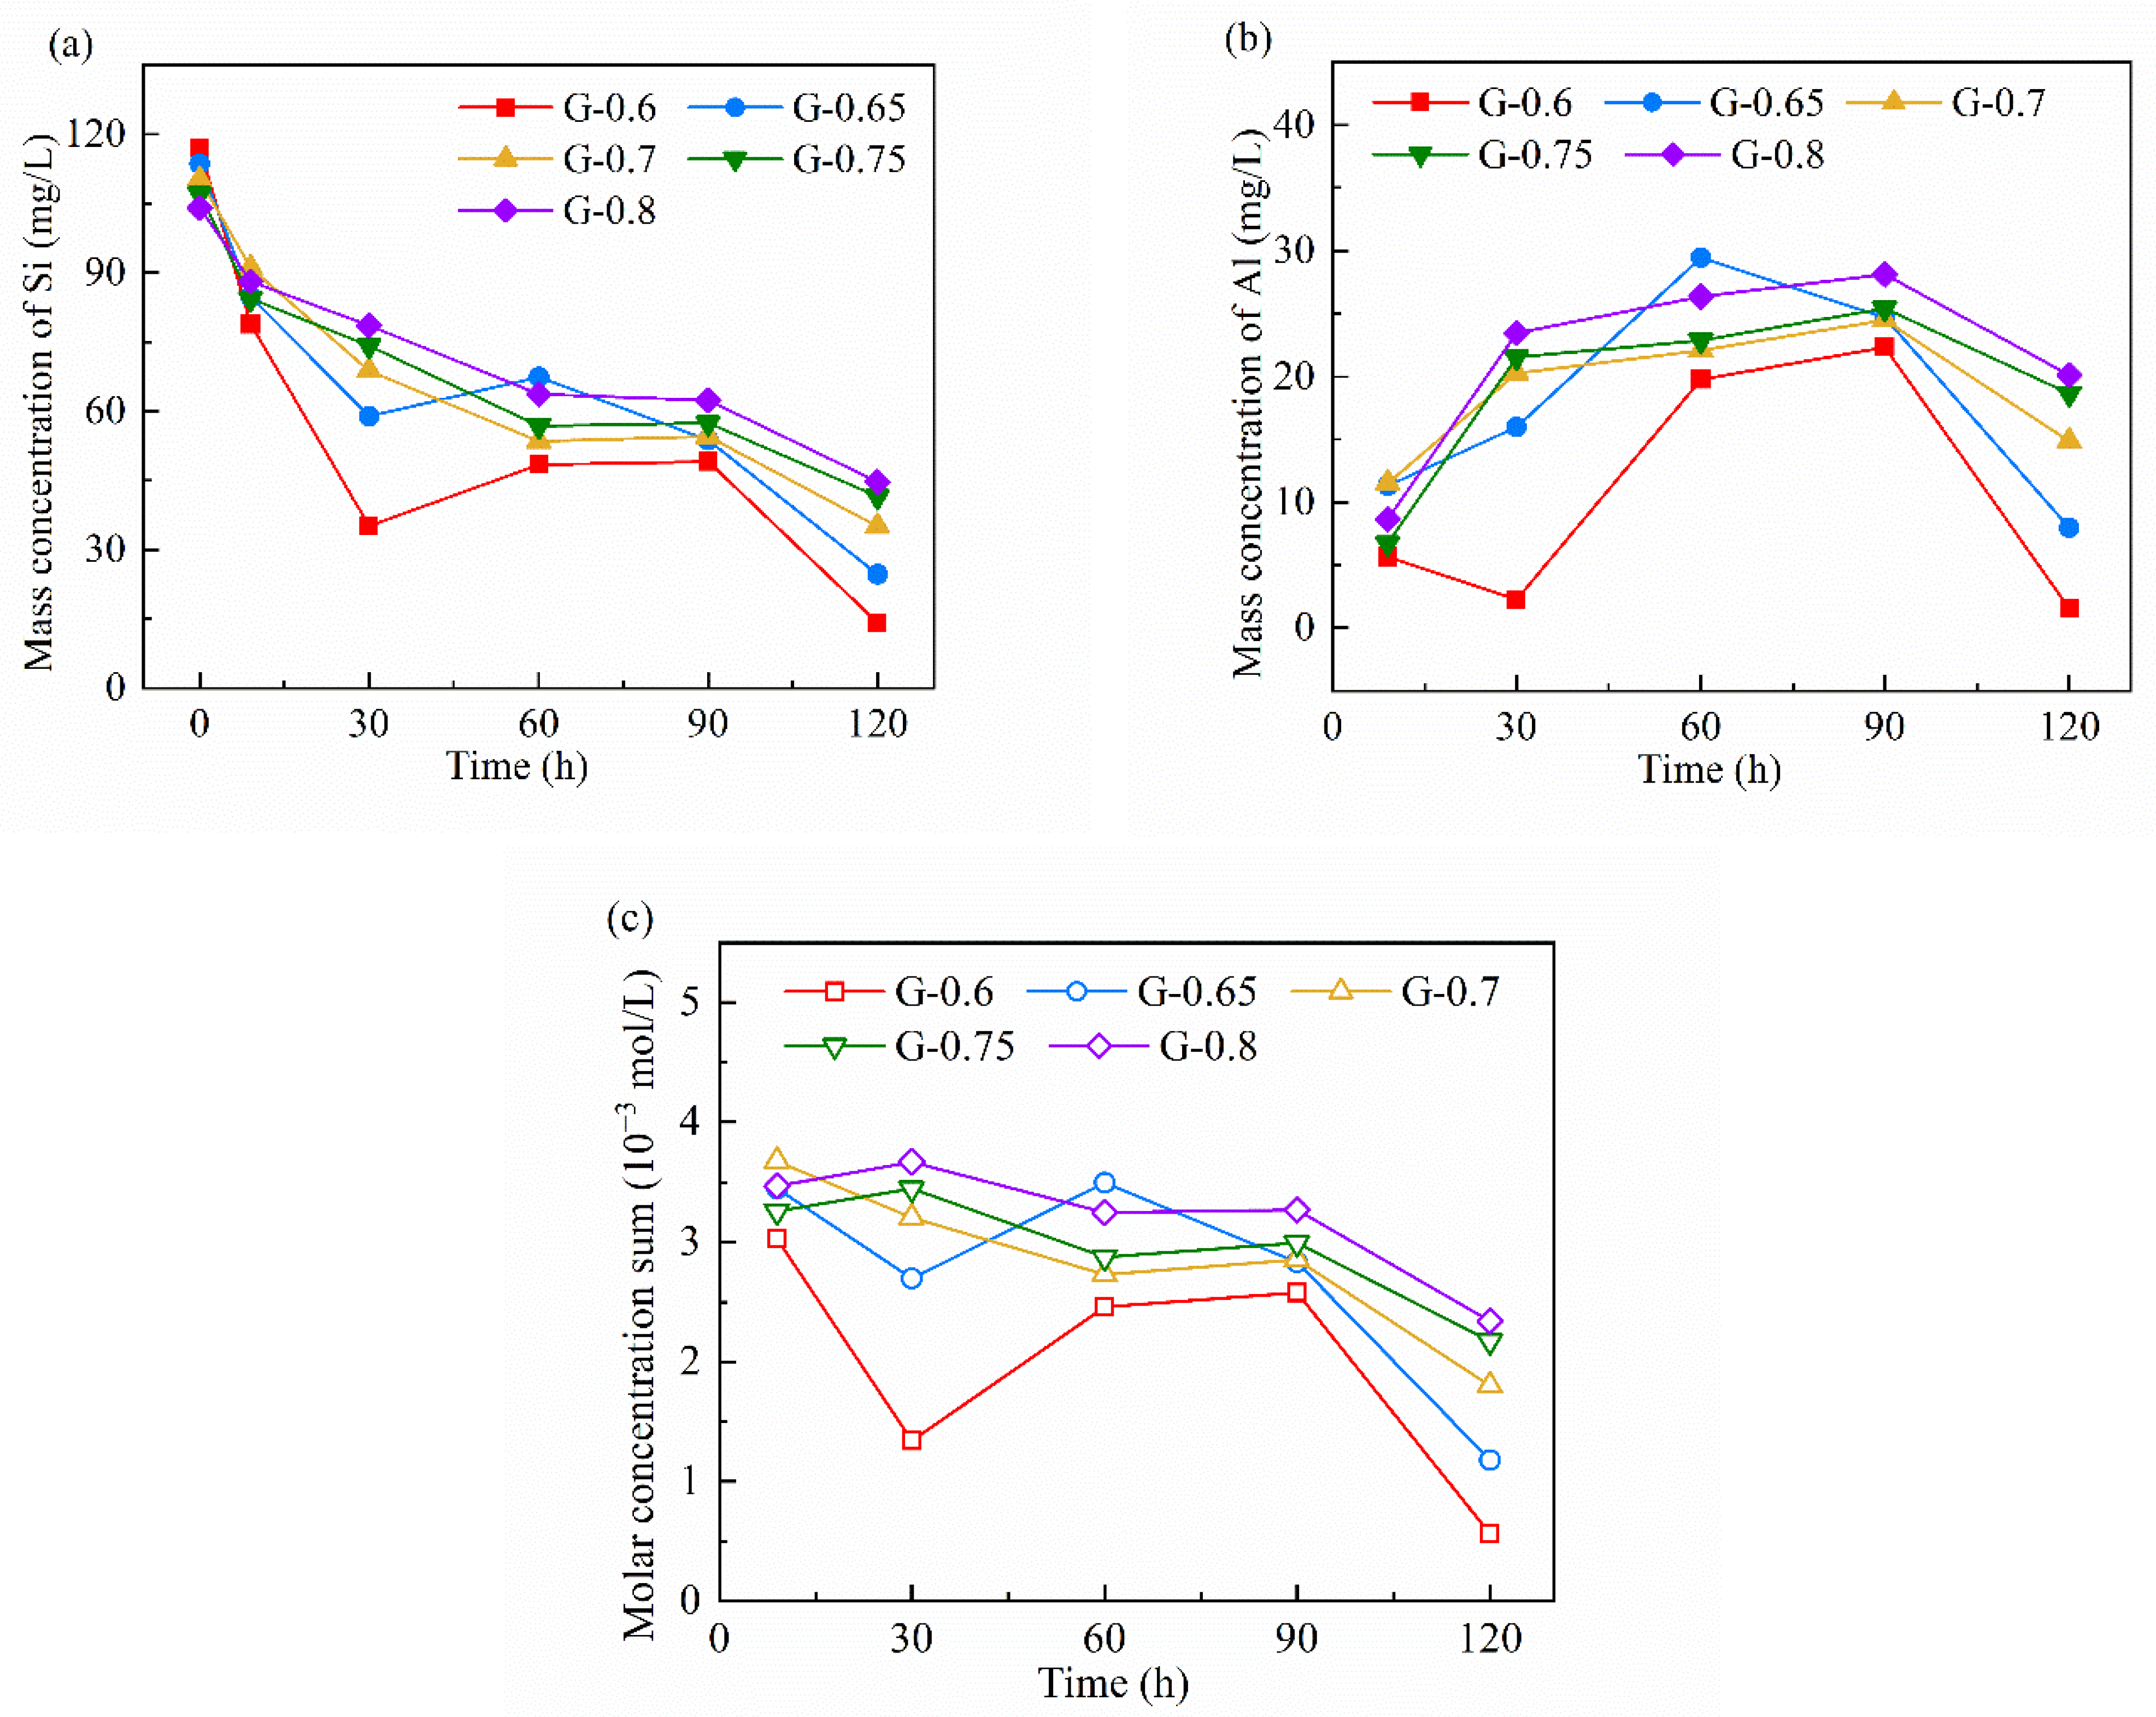
3.5. Ionic Concentration
4. Discussion
4.1. Spatial Filling Rules of Geopolymerization
4.2. Six-Stage Geopolymerization Process
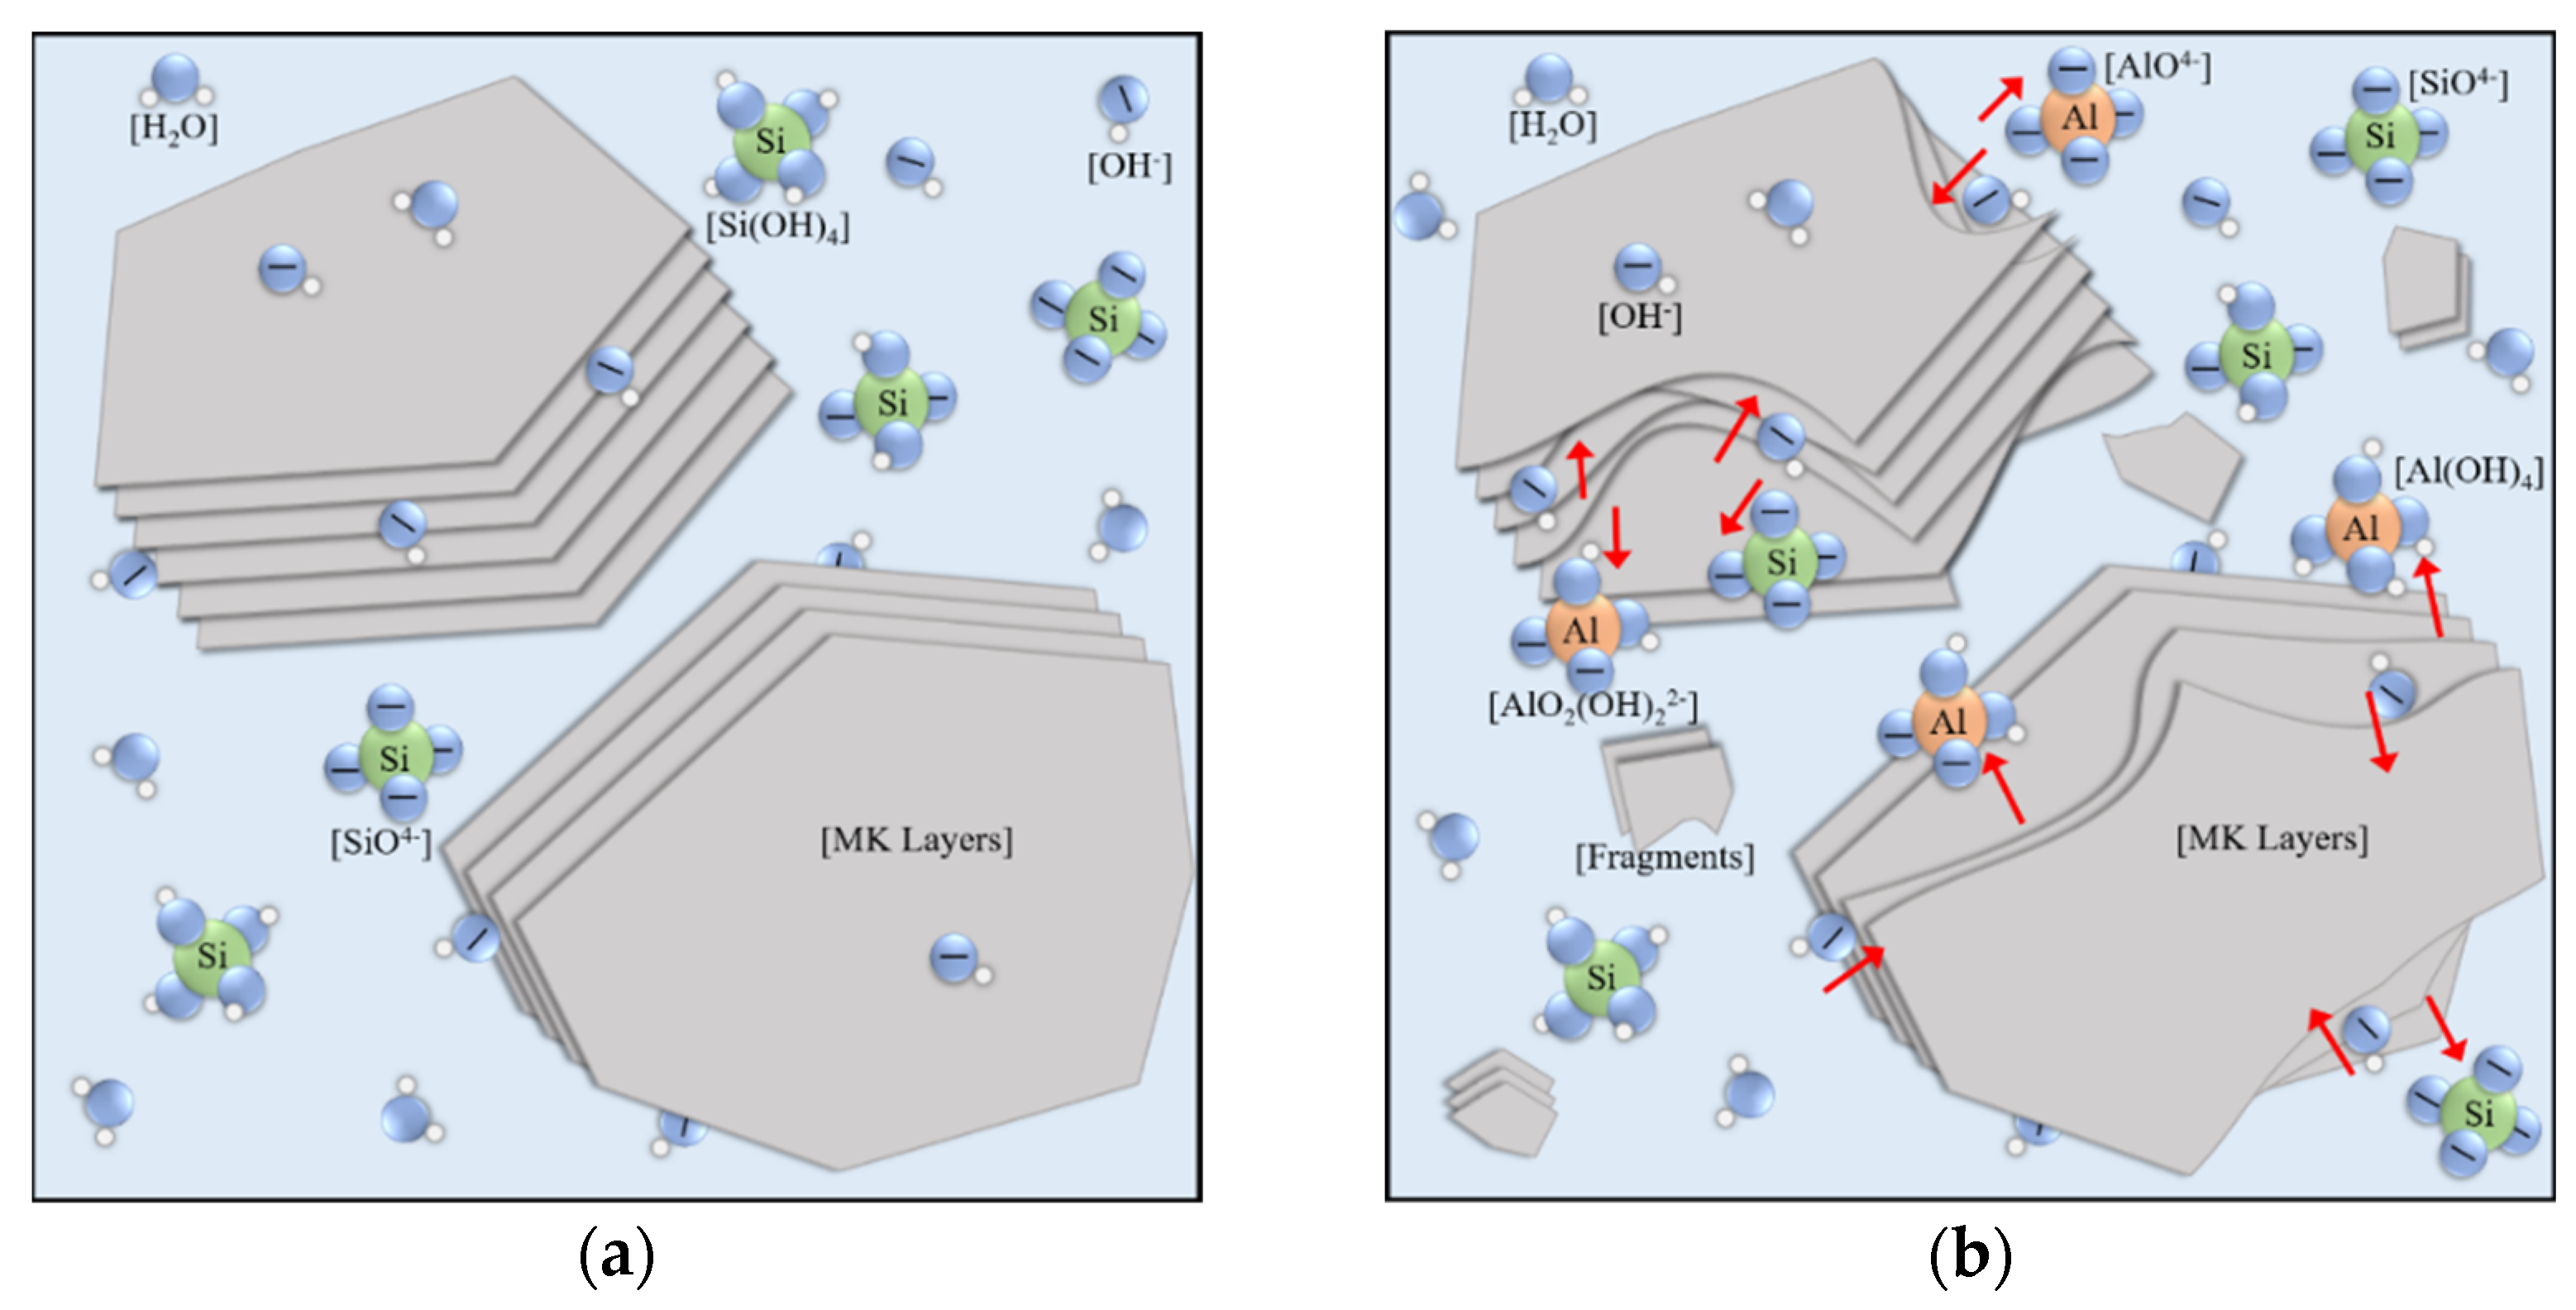
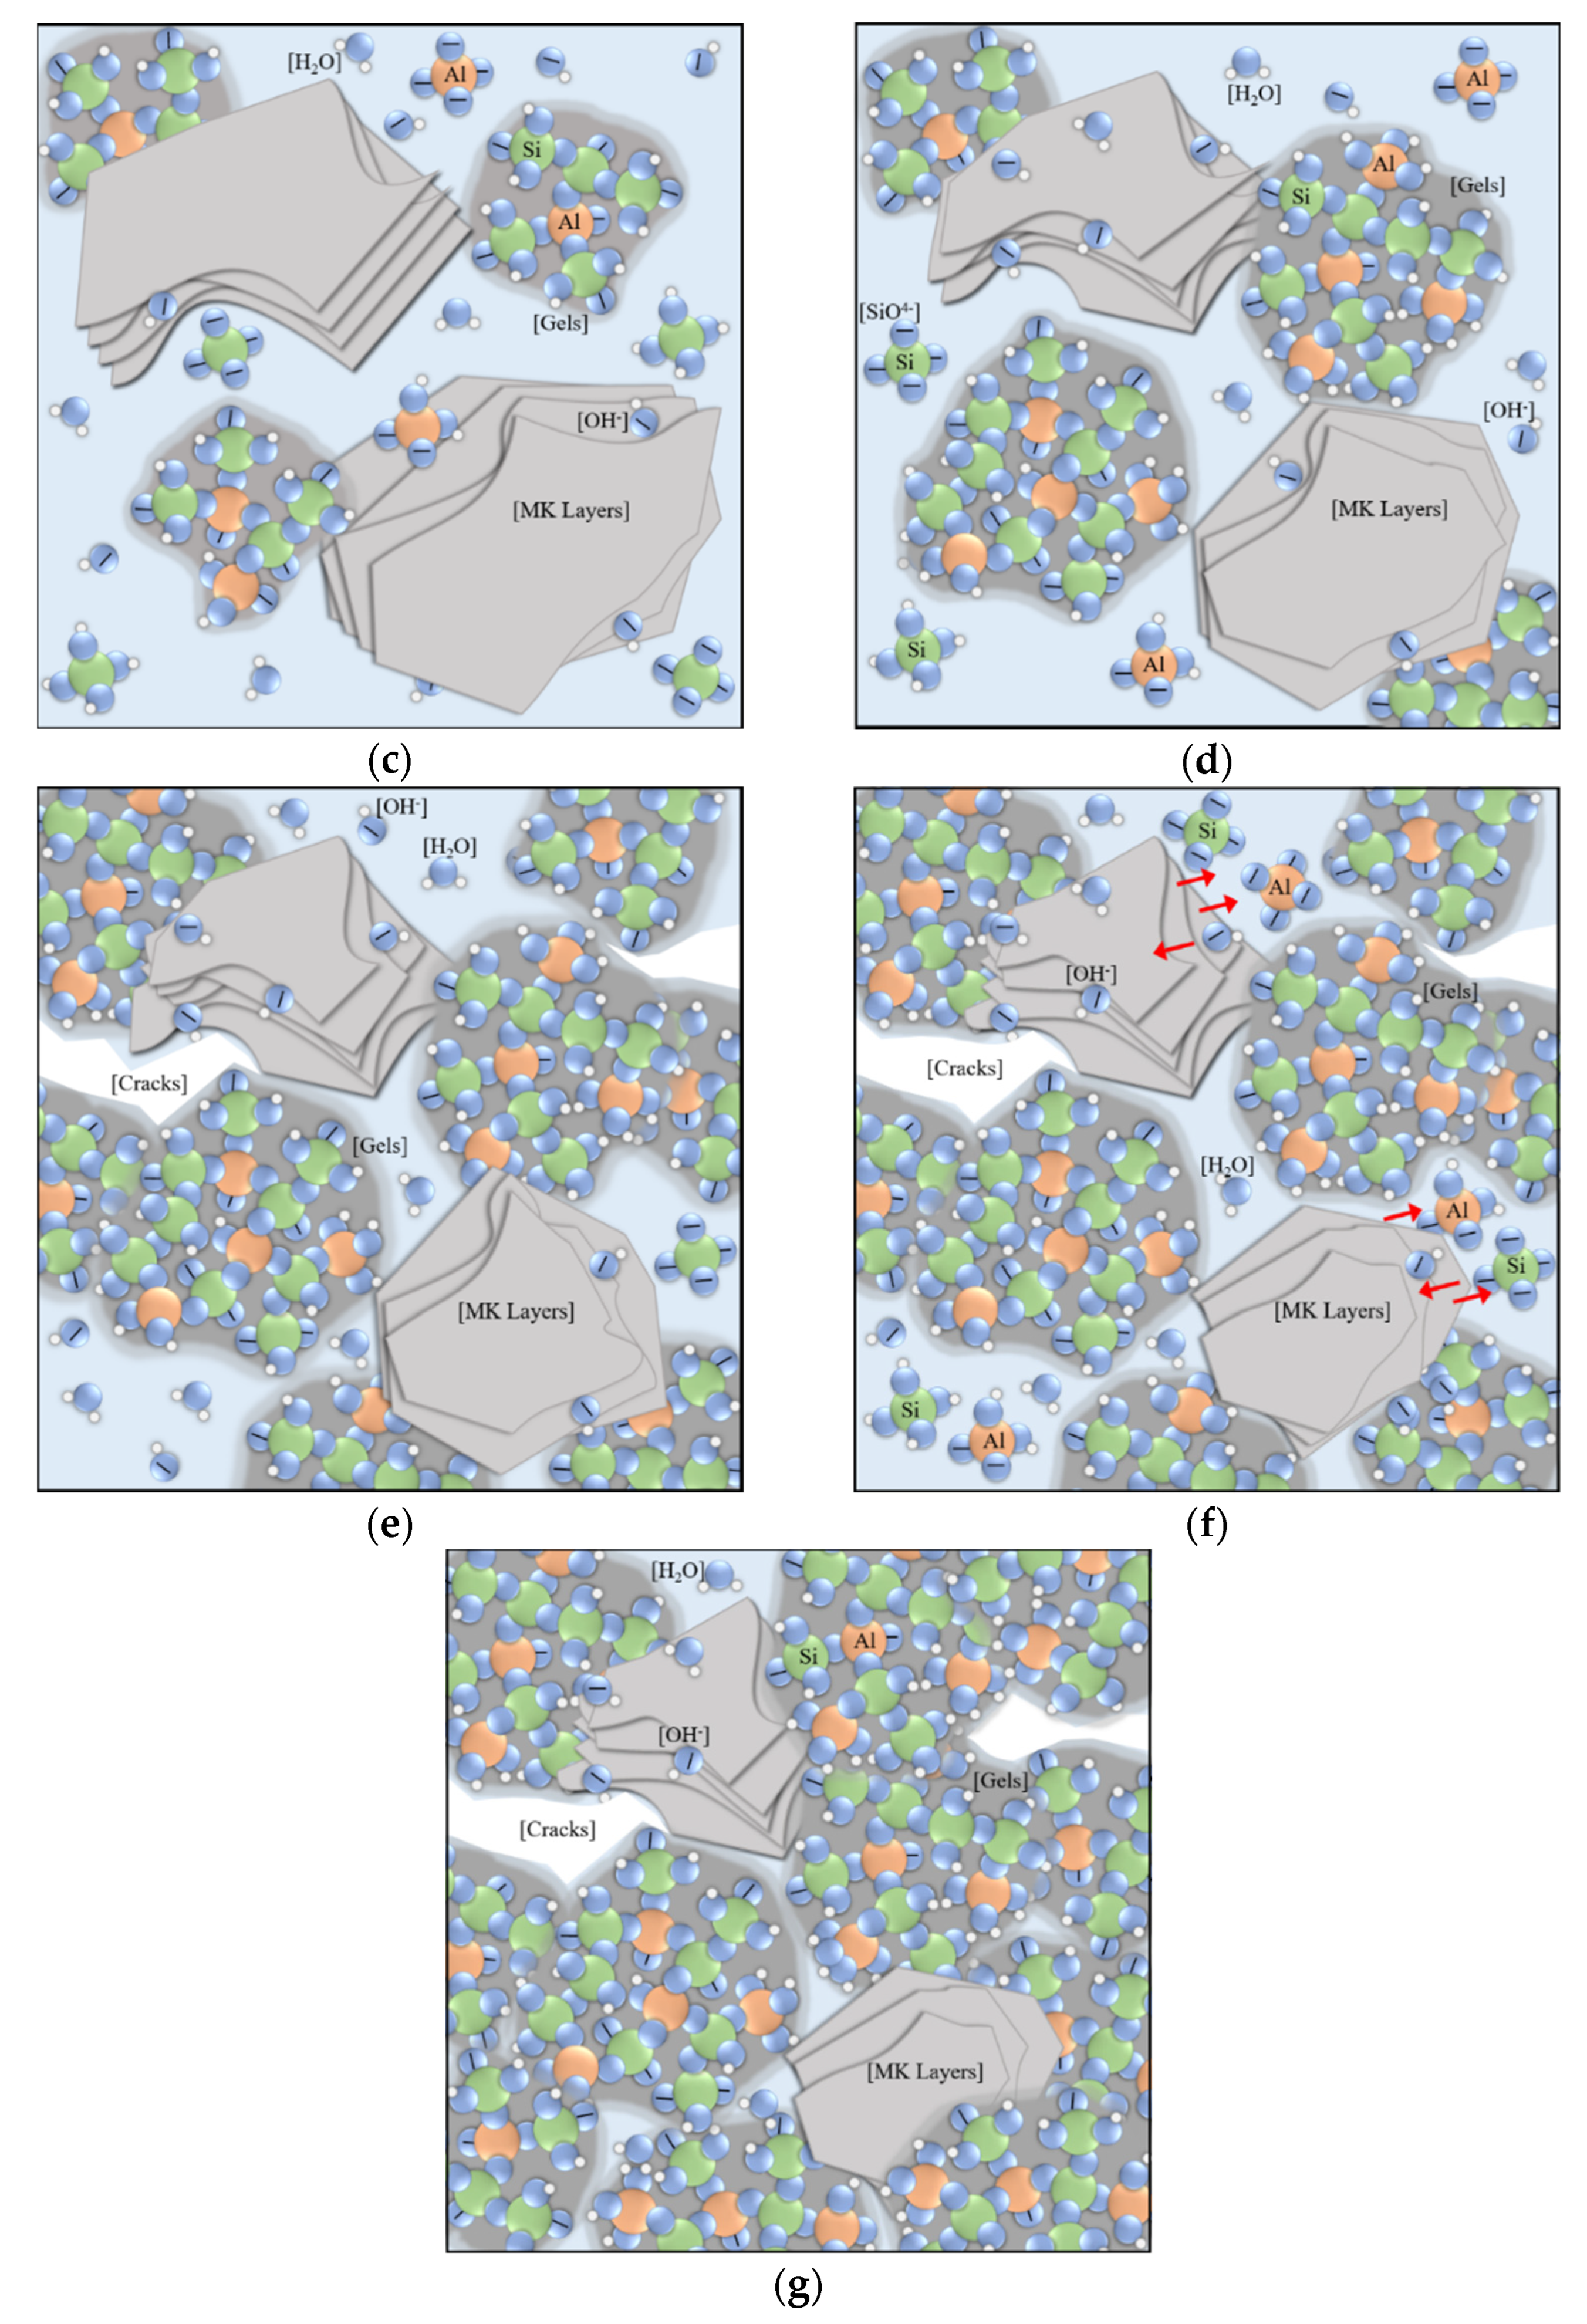
- (1)
- Precursor dismantling (0–4 h). Aluminosilicate precursors are dispersed into the water environment. Firstly, the aluminate sites in Al2O3·2SiO2 layers quickly dissolve (Figure 10a), causing lamellar metakaolin to tear apart from those sites into fragments [53]. The wildly stacked fragments show chemical shrinkage and block the transmission of oligomers to improve resistivity. The dissolved aluminate monomers that randomly distribute in liquid or lie on the fragments’ surface act as central trigger sites. Much silicate monomers from water glass are consumed for initial polymerization (Figure 10b) [22,34,54].
- (2)
- Locking fixation (4–10 h). The dissolution of fragments and the surface polymerization of the nucleus maintain a dissolution balance in the liquid phase. The number and volume of nuclei continue to increase, which act as locks and form linkages and fixations among disorderly stacked fragments. This phenomenon will generate a loose and unstable framework, which manifests as the physical solidification and initial setting strength. More new nuclei drift away and form linkages in larger zones, indicating that the framework spreads out in space; therefore, both chemical expansion and autogenous expansion keep surging. The system at this stage releases heat and a large amount of water vapor (Figure 10c).
- (3)
- Free filling (10–35 h). The dissolution equilibrium is disturbed, and most nuclei grow quickly into clusters. New nuclei are continuously formed and connect more fragments, so chemical expansion rapidly accumulates. Linear increase of resistivity indicates that the water environment in the system is connected, and the inner filling of clusters into frameworks is spatially free. The water environment and abundant free ions allow the formation of more regular and saturated aluminosilicate compound ions [55]. The inner liquid is dehydrated when polymerized gel clusters occupy the space in the aluminosilicate framework. Winding pores are formed as the main drainage path to the surface (Figure 10d).
- (4)
- Limited filling (35–60 h). Resistivity gradually turns from a linear increase to a logarithmic increase. Considering dehydration on the sample surface, the main restraint of gel filling comes from internal space. The nuclei considerably grew in size such that they were spatially close and affected each other. Polymerization in some small cavities can no longer obtain enough free ions from pore fluid to form ordered and saturated molecular chains [10,23]. The pore structure is refined, and the capillary pressure leads to squeezing dehydration. The uneven shrinkage or collapse may tear apart the product layers wrapping out of precursors and dissolving them again [45]. Therefore, autogenous expansion gradually turns into shrinkage (Figure 10e).
- (5)
- Second dissolution equilibrium (60–90 h). During this stage, autogenous shrinkages gradually accumulate as new gels are formed. At the same time, the dissolution caused by product layer breakage gradually weakens, and a new ionic balance is formed in the local pore fluid (Figure 10f).
- (6)
- Local mending (90–120 h). At the end of the second dissolution equilibrium, new polymerization activity mainly occurs in the zones near cracks and cavities caused by the shrinkage and collapse. As the pore structure gradually becomes disconnected, the ions of local polymerization come from nearby pores and cavities [23,53]. The cracks and defect zones are sewed up partly with new linkages or filled by new clusters. This process leads to a secondary strength increase in the long curing period [55] (Figure 10g).
5. Conclusions
Author Contributions
Funding
Institutional Review Board Statement
Informed Consent Statement
Data Availability Statement
Acknowledgments
Conflicts of Interest
References
- Bouasker, M.; Mounanga, P.; Turcry, P.; Loukili, A.; Khelidj, A. Chemical shrinkage of cement pastes and mortars at very early age: Effect of limestone filler and granular inclusions. Cem. Concr. Compos. 2008, 30, 13–22. [Google Scholar] [CrossRef]
- Brooks, J.J. Creep of Concrete-Concrete and Masonry Movements-12. In Concrete and Masonry Movements; Butterworth-Heinemann: Oxford, UK, 2015; pp. 403–456. [Google Scholar]
- Cao, J.; Chung, D.D.L. Damage Evolution During Freeze–Thaw Cycling of Cement Mortar, Studied by Electrical Resistivity Measurement. Cem. Concr. Res. 2002, 32, 1657–1661. [Google Scholar] [CrossRef]
- Chen, X.; Sutrisno, A.; Zhu, L.; Struble, L.J. Setting and nanostructural evolution of metakaolin geopolymer. J. Am. Ceram. Soc. 2017, 100, 2285–2295. [Google Scholar] [CrossRef]
- Duxson, P.; Fernández-Jiménez, A.; Provis, J.L.; Lukey, G.C.; Palomo, A.; van Deventer, J.S.J. Geopolymer technology: The current state of the art. J. Mater. Sci. 2007, 42, 2917–2933. [Google Scholar] [CrossRef]
- Duxson, P.; Mallicoat, S.W.; Lukey, G.C.; Kriven, W.M.; van Deventer, J.S. The effect of alkali and Si/Al ratio on the development of mechanical properties of metakaolin-based geopolymers. Colloids Surf. A Physicochem. Eng. Asp. 2007, 292, 8–20. [Google Scholar] [CrossRef]
- Ekaputri, J.J.; Junaedi, S.; Wijaya. Effect of Curing Temperature and Fiber on Metakaolin-based Geopolymer. Procedia Eng. 2017, 171, 572–583. [Google Scholar] [CrossRef]
- Fang, G.; Bahrami, H.; Zhang, M. Mechanisms of autogenous shrinkage of alkali-activated fly ash-slag pastes cured at ambient temperature within 24 h. Constr. Build. Mater. 2018, 171, 377–387. [Google Scholar] [CrossRef]
- Gharzouni, A.; Joussein, E.; Samet, B.; Baklouti, S.; Rossignol, S. Effect of the reactivity of alkaline solution and metakaolin on geopolymer formation. J. Non-Cryst. Solids 2015, 410, 127–134. [Google Scholar] [CrossRef]
- Glukhovsky, V.D. Ancient, Modern and Future Concretes. In Proceedings of the First International Conference on Alkaline Cements and Concretes, Kiev, Ukraine, 10–14 October 1994. [Google Scholar]
- Gowers, K.; Millard, S. Measurement of Concrete Resistivity for Assessment of Corrosion. ACI Mater. J. 1999, 96, 536–541. [Google Scholar]
- Hajimohammadi, A.; Provis, J.L.; van Deventer, J.S.J. Effect of Alumina Release Rate on the Mechanism of Geopolymer Gel Formation. Chem. Mater. 2010, 22, 5199–5208. [Google Scholar] [CrossRef]
- Hajimohammadi, A.; van Deventer, J.S.J. Characterisation of One-Part Geopolymer Binders Made from Fly Ash. Waste Biomass Valorization 2017, 8, 225–233. [Google Scholar] [CrossRef]
- Hajimohammadi, A.; van Deventer, J.S.J. Dissolution Behaviour of Source Materials for Synthesis of Geopolymer Binders: A Kinetic Approach. Int. J. Miner. Process. 2016, 153, 80–86. [Google Scholar] [CrossRef]
- Hou, D.; Ma, H.; Zhu, Y.; Li, Z. Calcium silicate hydrate from dry to saturated state: Structure, dynamics and mechanical properties. Acta Mater. 2014, 67, 81–94. [Google Scholar] [CrossRef]
- Hu, C.; Li, Z. Property investigation of individual phases in cementitious composites containing silica fume and fly ash. Cem. Concr. Compos. 2015, 57, 17–26. [Google Scholar] [CrossRef]
- Ismail, I.; Bernal, S.A.; Provis, J.L.; San Nicolas, R.; Hamdan, S.; van Deventer, J.S.J. Modification of phase evolution in alkali-activated blast furnace slag by the incorporation of fly ash. Cem. Concr. Compos. 2014, 45, 125–135. [Google Scholar] [CrossRef]
- Jiang, Z.; Sun, Z.; Wang, P. Autogenous relative humidity change and autogenous shrinkage of high-performance cement pastes. Cem. Concr. Res. 2005, 35, 1539–1545. [Google Scholar] [CrossRef]
- Kuenzel, C.; Vandeperre, L.; Donatello, S.; Boccaccini, A.R.; Cheeseman, C. Ambient Temperature Drying Shrinkage and Cracking in Metakaolin-Based Geopolymers. J. Am. Ceram. Soc. 2012, 95, 3270–3277. [Google Scholar] [CrossRef]
- Lee, N.K.; Jang, J.G.; Lee, H.K. Shrinkage characteristics of alkali-activated fly ash/slag paste and mortar at early ages. Cem. Concr. Compos. 2014, 53, 239–248. [Google Scholar] [CrossRef]
- Li, Z.; Ye, G. Experimental Study of the Chemical Deformation of Metakaolin Based Geopolymer. In Proceedings of the SynerCrete 2018, Funchal, Portugal, 24–26 October 2018; Volume 18. [Google Scholar]
- Li, Z.; Zhang, S.; Zuo, Y.; Chen, W.; Ye, G. Chemical deformation of metakaolin based geopolymer. Cem. Concr. Res. 2019, 120, 108–118. [Google Scholar] [CrossRef]
- Ma, H.; Tang, S.; Li, Z. New Pore Structure Assessment Methods for Cement Paste. J. Mater. Civ. Eng. 2015, 27, A4014002. [Google Scholar] [CrossRef]
- McCarter, W.J. Effects of Temperature on Conduction and Polarization in Portland Cement Mortar. J. Am. Ceram. Soc. 1995, 78, 411–415. [Google Scholar] [CrossRef]
- Neto, A.A.M.; Cincotto, M.A.; Repette, W. Drying and autogenous shrinkage of pastes and mortars with activated slag cement. Cem. Concr. Res. 2008, 38, 565–574. [Google Scholar] [CrossRef]
- Nath, P.; Sarker, P.K. Use of OPC to improve setting and early strength properties of low calcium fly ash geopolymer concrete cured at room temperature. Cem. Concr. Compos. 2015, 55, 205–214. [Google Scholar] [CrossRef]
- Nath, S.; Maitra, S.; Mukherjee, S.; Kumar, S. Microstructural and morphological evolution of fly ash based geopolymers. Constr. Build. Mater. 2016, 111, 758–765. [Google Scholar] [CrossRef]
- Panchmatia, P.; Olvera, R.; Genedy, M.; Juenger, M.C.; van Oort, E. Shrinkage behavior of Portland and geopolymer cements at elevated temperature and pressure. J. Pet. Sci. Eng. 2020, 195, 107884. [Google Scholar] [CrossRef]
- Provis, J.L. Geopolymers and other alkali activated materials: Why, how, and what? Mater. Struct. 2014, 47, 11–25. [Google Scholar] [CrossRef]
- Provis, J.L.; Palomo, A.; Shi, C. Advances in understanding alkali-activated materials. Cem. Concr. Res. 2015, 78, 110–125. [Google Scholar] [CrossRef]
- Provis, J.L.; Van Deventer, J.S.J. Geopolymers: Structures, Processing, Properties and Industrial Applications; CRC: Boca Raton, FL, USA; Woodhead: Sawston, UK, 2009. [Google Scholar]
- Ramlochan, T.; Thomas, M.; Gruber, K.A. The effect of metakaolin on alkali–silica reaction in concrete. Cem. Concr. Res. 2000, 30, 339–344. [Google Scholar] [CrossRef]
- Rees, C.A.; Provis, J.L.; Lukey, G.C.; van Deventer, J.S. The mechanism of geopolymer gel formation investigated through seeded nucleation. Colloids Surf. A Physicochem. Eng. Asp. 2008, 318, 97–105. [Google Scholar] [CrossRef]
- Rovnaník, P. Effect of curing temperature on the development of hard structure of metakaolin-based geopolymer. Constr. Build. Mater. 2010, 24, 1176–1183. [Google Scholar] [CrossRef]
- Sarkar, M.; Dana, K. Partial replacement of metakaolin with red ceramic waste in geopolymer. Ceram. Int. 2021, 47, 3473–3483. [Google Scholar] [CrossRef]
- Shilar, F.A.; Ganachari, S.V.; Patil, V.B.; Khan, T.M.Y.; Almakayeel, N.M.; Alghamdi, S. Review on the Relationship between Nano Modifications of Geopolymer Concrete and Their Structural Characteristics. Polymers 2022, 14, 1421. [Google Scholar] [CrossRef] [PubMed]
- Šmilauer, V.; Hlaváček, P.; Škvára, F.; Šulc, R.; Kopecký, L.; Němeček, J. Micromechanical multiscale model for alkali activation of fly ash and metakaolin. J. Mater. Sci. 2011, 46, 6545–6555. [Google Scholar] [CrossRef]
- Temuujin, J.; Rickard, W.; Lee, M.; van Riessen, A. Preparation and thermal properties of fire resistant metakaolin-based geopolymer-type coatings. J. Non-Cryst. Solids 2011, 357, 1399–1404. [Google Scholar] [CrossRef]
- Tennakoon, C.; De Silva, P.; Sagoe-Crentsil, K.; Sanjayan, J. Influence and role of feedstock Si and Al content in Geopolymer synthesis. J. Sustain. Cem. Mater. 2015, 4, 129–139. [Google Scholar] [CrossRef]
- van Deventer, J.; Provis, J.; Duxson, P.; Lukey, G. Reaction mechanisms in the geopolymeric conversion of inorganic waste to useful products. J. Hazard. Mater. 2007, 139, 506–513. [Google Scholar] [CrossRef]
- Wang, X.; Zhang, C.; Zhu, H.; Wu, Q. Reaction kinetics and mechanical properties of a mineral-micropowder/metakaolin-based geopolymer. Ceram. Int. 2022, 48, 14173–14181. [Google Scholar] [CrossRef]
- Phavongkham, V.; Wattanasiriwech, S.; Wattanasiriwech, D. Tailored design of properties of Hongsa fly ash-based geopolymer paste via an adjustment of the alkali activator composition. Ceram. Int. 2021, 47, 13374–13380. [Google Scholar] [CrossRef]
- Wei, X.; Li, Z. Study on hydration of Portland cement with fly ash using electrical measurement. Mater. Struct. 2005, 38, 411–417. [Google Scholar] [CrossRef]
- Xiao, L.; Li, Z. Early-age hydration of fresh concrete monitored by non-contact electrical resistivity measurement. Cem. Concr. Res. 2008, 38, 312–319. [Google Scholar] [CrossRef]
- Xu, Z.; Jiang, Z.; Wu, D.; Peng, X.; Xu, Y.; Li, N.; Qi, Y.; Li, P. Immobilization of strontium-loaded zeolite A by metakaolin based-geopolymer. Ceram. Int. 2017, 43, 4434–4439. [Google Scholar] [CrossRef]
- Yang, T.; Zhu, H.; Zhang, Z. Influence of fly ash on the pore structure and shrinkage characteristics of metakaolin-based geopolymer pastes and mortars. Constr. Build. Mater. 2017, 153, 284–293. [Google Scholar] [CrossRef]
- Yang, Y.; Le, T.; Kudo, I.; Do, T.; Niihara, K.; Suematsu, H.; Thorogood, G. Pore-Forming Process in Dehydration of Metakaolin-Based Geopolymer. Int. J. Ceram. Eng. Sci. 2021, 3, 211–216. [Google Scholar] [CrossRef]
- Yao, X.; Zhang, Z.; Zhu, H.; Chen, Y. Geopolymerization process of alkali–metakaolinite characterized by isothermal calorimetry. Thermochim. Acta 2009, 493, 49–54. [Google Scholar] [CrossRef]
- Zhang, Z.; Wang, H.; Provis, J.L.; Bullen, F.; Reid, A.; Zhu, Y. Quantitative kinetic and structural analysis of geopolymers. Part 1. The activation of metakaolin with sodium hydroxide. Thermochim. Acta 2012, 539, 23–33. [Google Scholar] [CrossRef]
- Zhang, Z.; Wang, H.; Zhu, Y.; Reid, A.; Provis, J.; Bullen, F. Using fly ash to partially substitute metakaolin in geopolymer synthesis. Appl. Clay Sci. 2014, 88–89, 194–201. [Google Scholar] [CrossRef]
- Zhao, J.; Tong, L.; Li, B.; Chen, T.; Wang, C.; Yang, G.; Zheng, Y. Eco-friendly geopolymer materials: A review of performance improvement, potential application and sustainability assessment. J. Clean. Prod. 2021, 307, 127085. [Google Scholar] [CrossRef]
- Zhu, X.; Yan, D.; Fang, H.; Chen, S.; Ye, H. Early-stage geopolymerization revealed by 27Al and 29Si nuclear magnetic resonance spectroscopy based on vacuum dehydration. Constr. Build. Mater. 2021, 266, 121114. [Google Scholar] [CrossRef]
- Živica, V.; Balkovic, S.; Drabik, M. Properties of metakaolin geopolymer hardened paste prepared by high-pressure compaction. Constr. Build. Mater. 2011, 25, 2206–2213. [Google Scholar] [CrossRef]
- Zongjin Li, X.W.A.W. Preliminary Interpretation of Portland Cement Hydration Process Using Resistivity Measurements. ACI Mater. J. 2003, 100, 253–257. [Google Scholar]
- Zong-Jin, L.; Xiao-Sheng, W. The electrical resistivity of cement paste incorporated with retarder. J. Wuhan Univ. Technol. Sci. Ed. 2003, 18, 76–78. [Google Scholar] [CrossRef]


| Component | Al2O3 | SiO2 | K2O | Na2O | CaO | TiO2 | Fe2O3 | LOI |
|---|---|---|---|---|---|---|---|---|
| Content | 39.68 | 57.26 | 0.21 | 0.27 | 0.04 | 1.78 | 0.43 | 0.34 |
| Component | Na2O | SiO2 | H2O |
|---|---|---|---|
| Content | 8.2 | 26.0 | 65.8 |
| Test Groups | MK(g) | WG(g) | NaOH(g) | Extra Water (g) | Water/Binder Ratio |
|---|---|---|---|---|---|
| G-0.6 | 38.72 | 48.25 | 7.28 | 5.75 | 0.6 |
| G-0.65 | 37.55 | 46.79 | 7.06 | 8.60 | 0.65 |
| G-0.7 | 36.45 | 45.41 | 6.85 | 11.29 | 0.7 |
| G-0.75 | 35.40 | 44.12 | 6.65 | 13.83 | 0.75 |
| G-0.8 | 34.41 | 42.89 | 6.47 | 16.23 | 0.8 |
Publisher’s Note: MDPI stays neutral with regard to jurisdictional claims in published maps and institutional affiliations. |
© 2022 by the authors. Licensee MDPI, Basel, Switzerland. This article is an open access article distributed under the terms and conditions of the Creative Commons Attribution (CC BY) license (https://creativecommons.org/licenses/by/4.0/).
Share and Cite
Zhu, X.; Qian, H.; Wu, H.; Zhou, Q.; Feng, H.; Zeng, Q.; Tian, Y.; Ruan, S.; Zhang, Y.; Chen, S.; et al. Early-Stage Geopolymerization Process of Metakaolin-Based Geopolymer. Materials 2022, 15, 6125. https://doi.org/10.3390/ma15176125
Zhu X, Qian H, Wu H, Zhou Q, Feng H, Zeng Q, Tian Y, Ruan S, Zhang Y, Chen S, et al. Early-Stage Geopolymerization Process of Metakaolin-Based Geopolymer. Materials. 2022; 15(17):6125. https://doi.org/10.3390/ma15176125
Chicago/Turabian StyleZhu, Xiuyu, Hao Qian, Hongxiao Wu, Quan Zhou, Huiping Feng, Qiang Zeng, Ye Tian, Shengqian Ruan, Yajun Zhang, Shikun Chen, and et al. 2022. "Early-Stage Geopolymerization Process of Metakaolin-Based Geopolymer" Materials 15, no. 17: 6125. https://doi.org/10.3390/ma15176125