
Damage Evolution Characteristics of Back-Filling Concrete in Gob-Side Entry Retaining Subjected to Cyclical Loading


Abstract
:1. Introduction
2. Materials and Methods
2.1. Sample Preparation
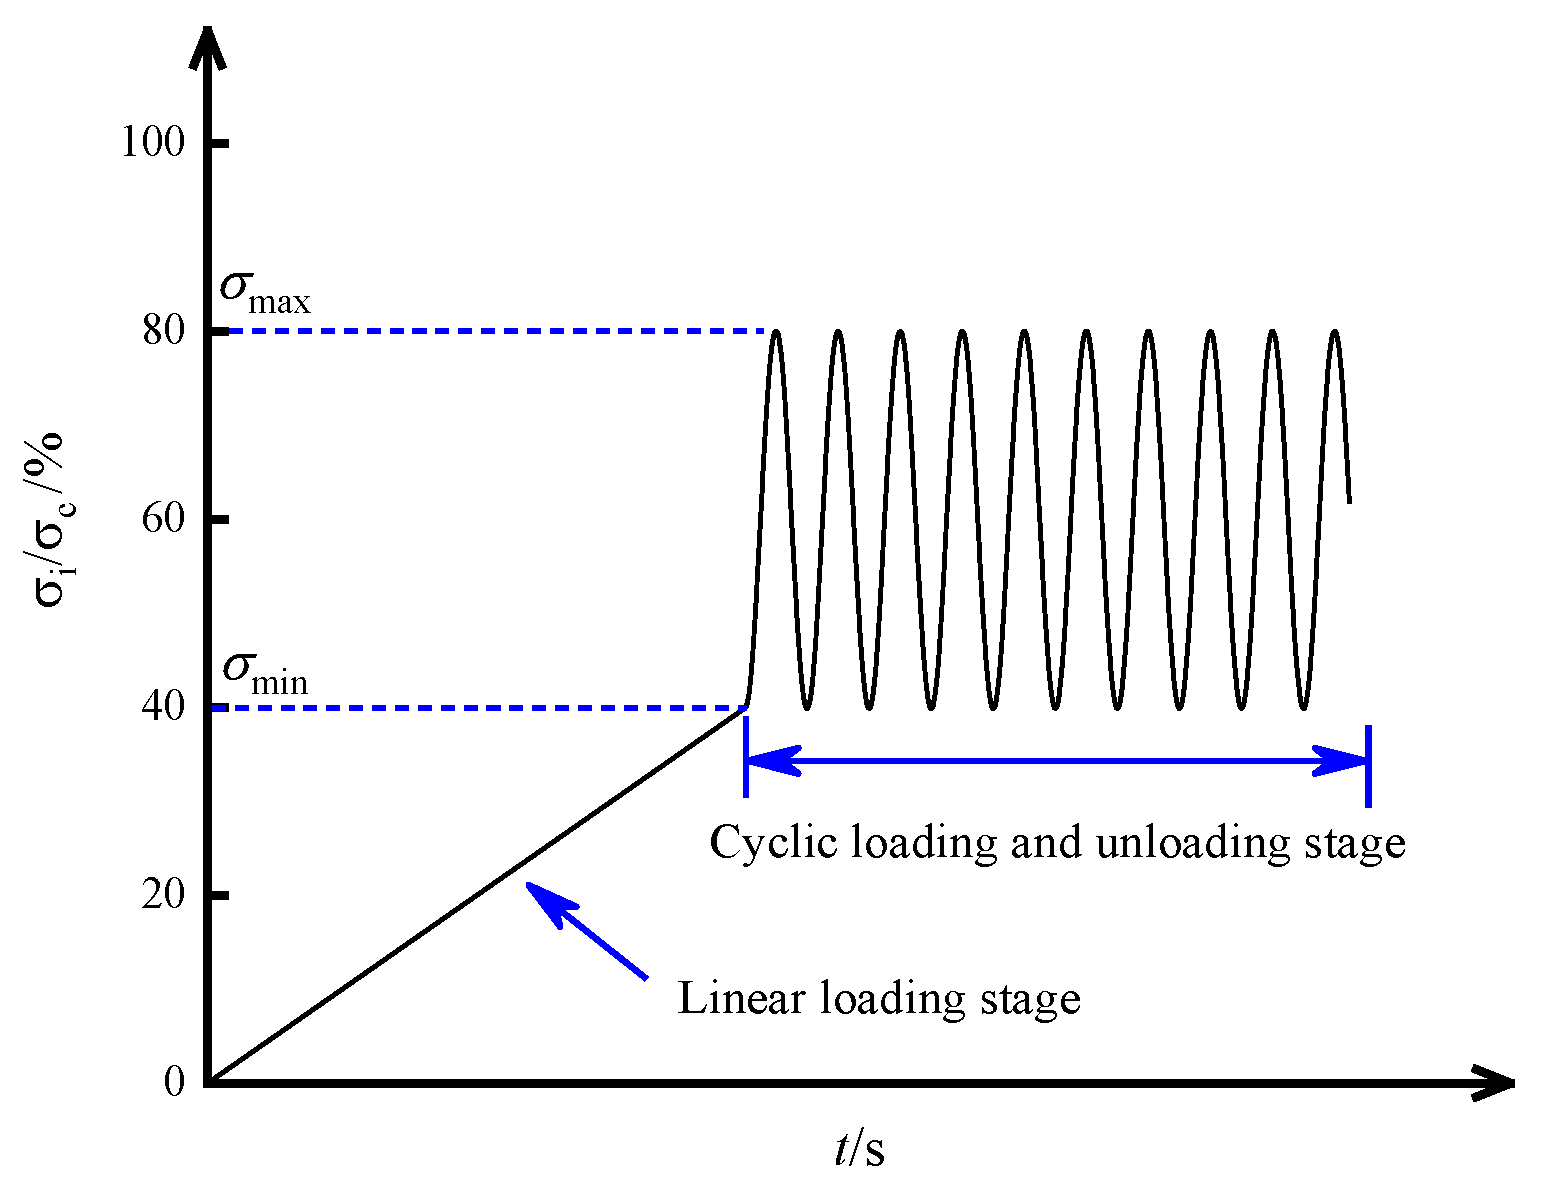
2.2. Test Scheme
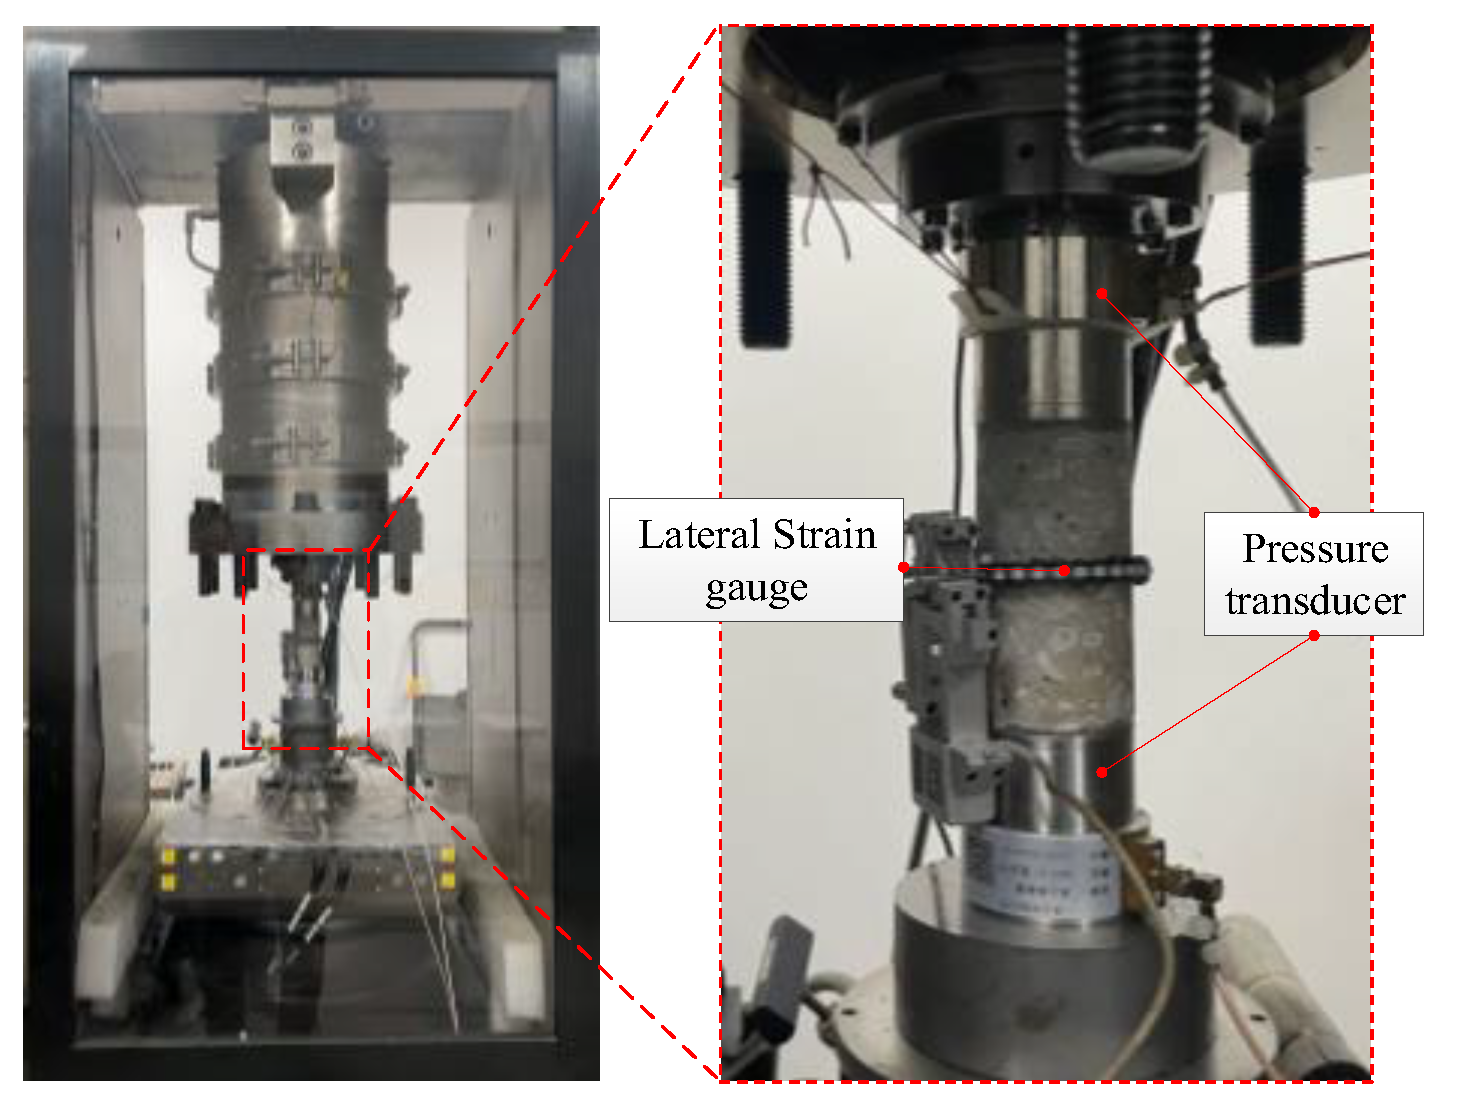
2.3. Equipment
3. Results and Discussion
3.1. Deterioration of Load-Bearing Performance of Concrete Samples Subjected to Cyclical Loading
- (1)
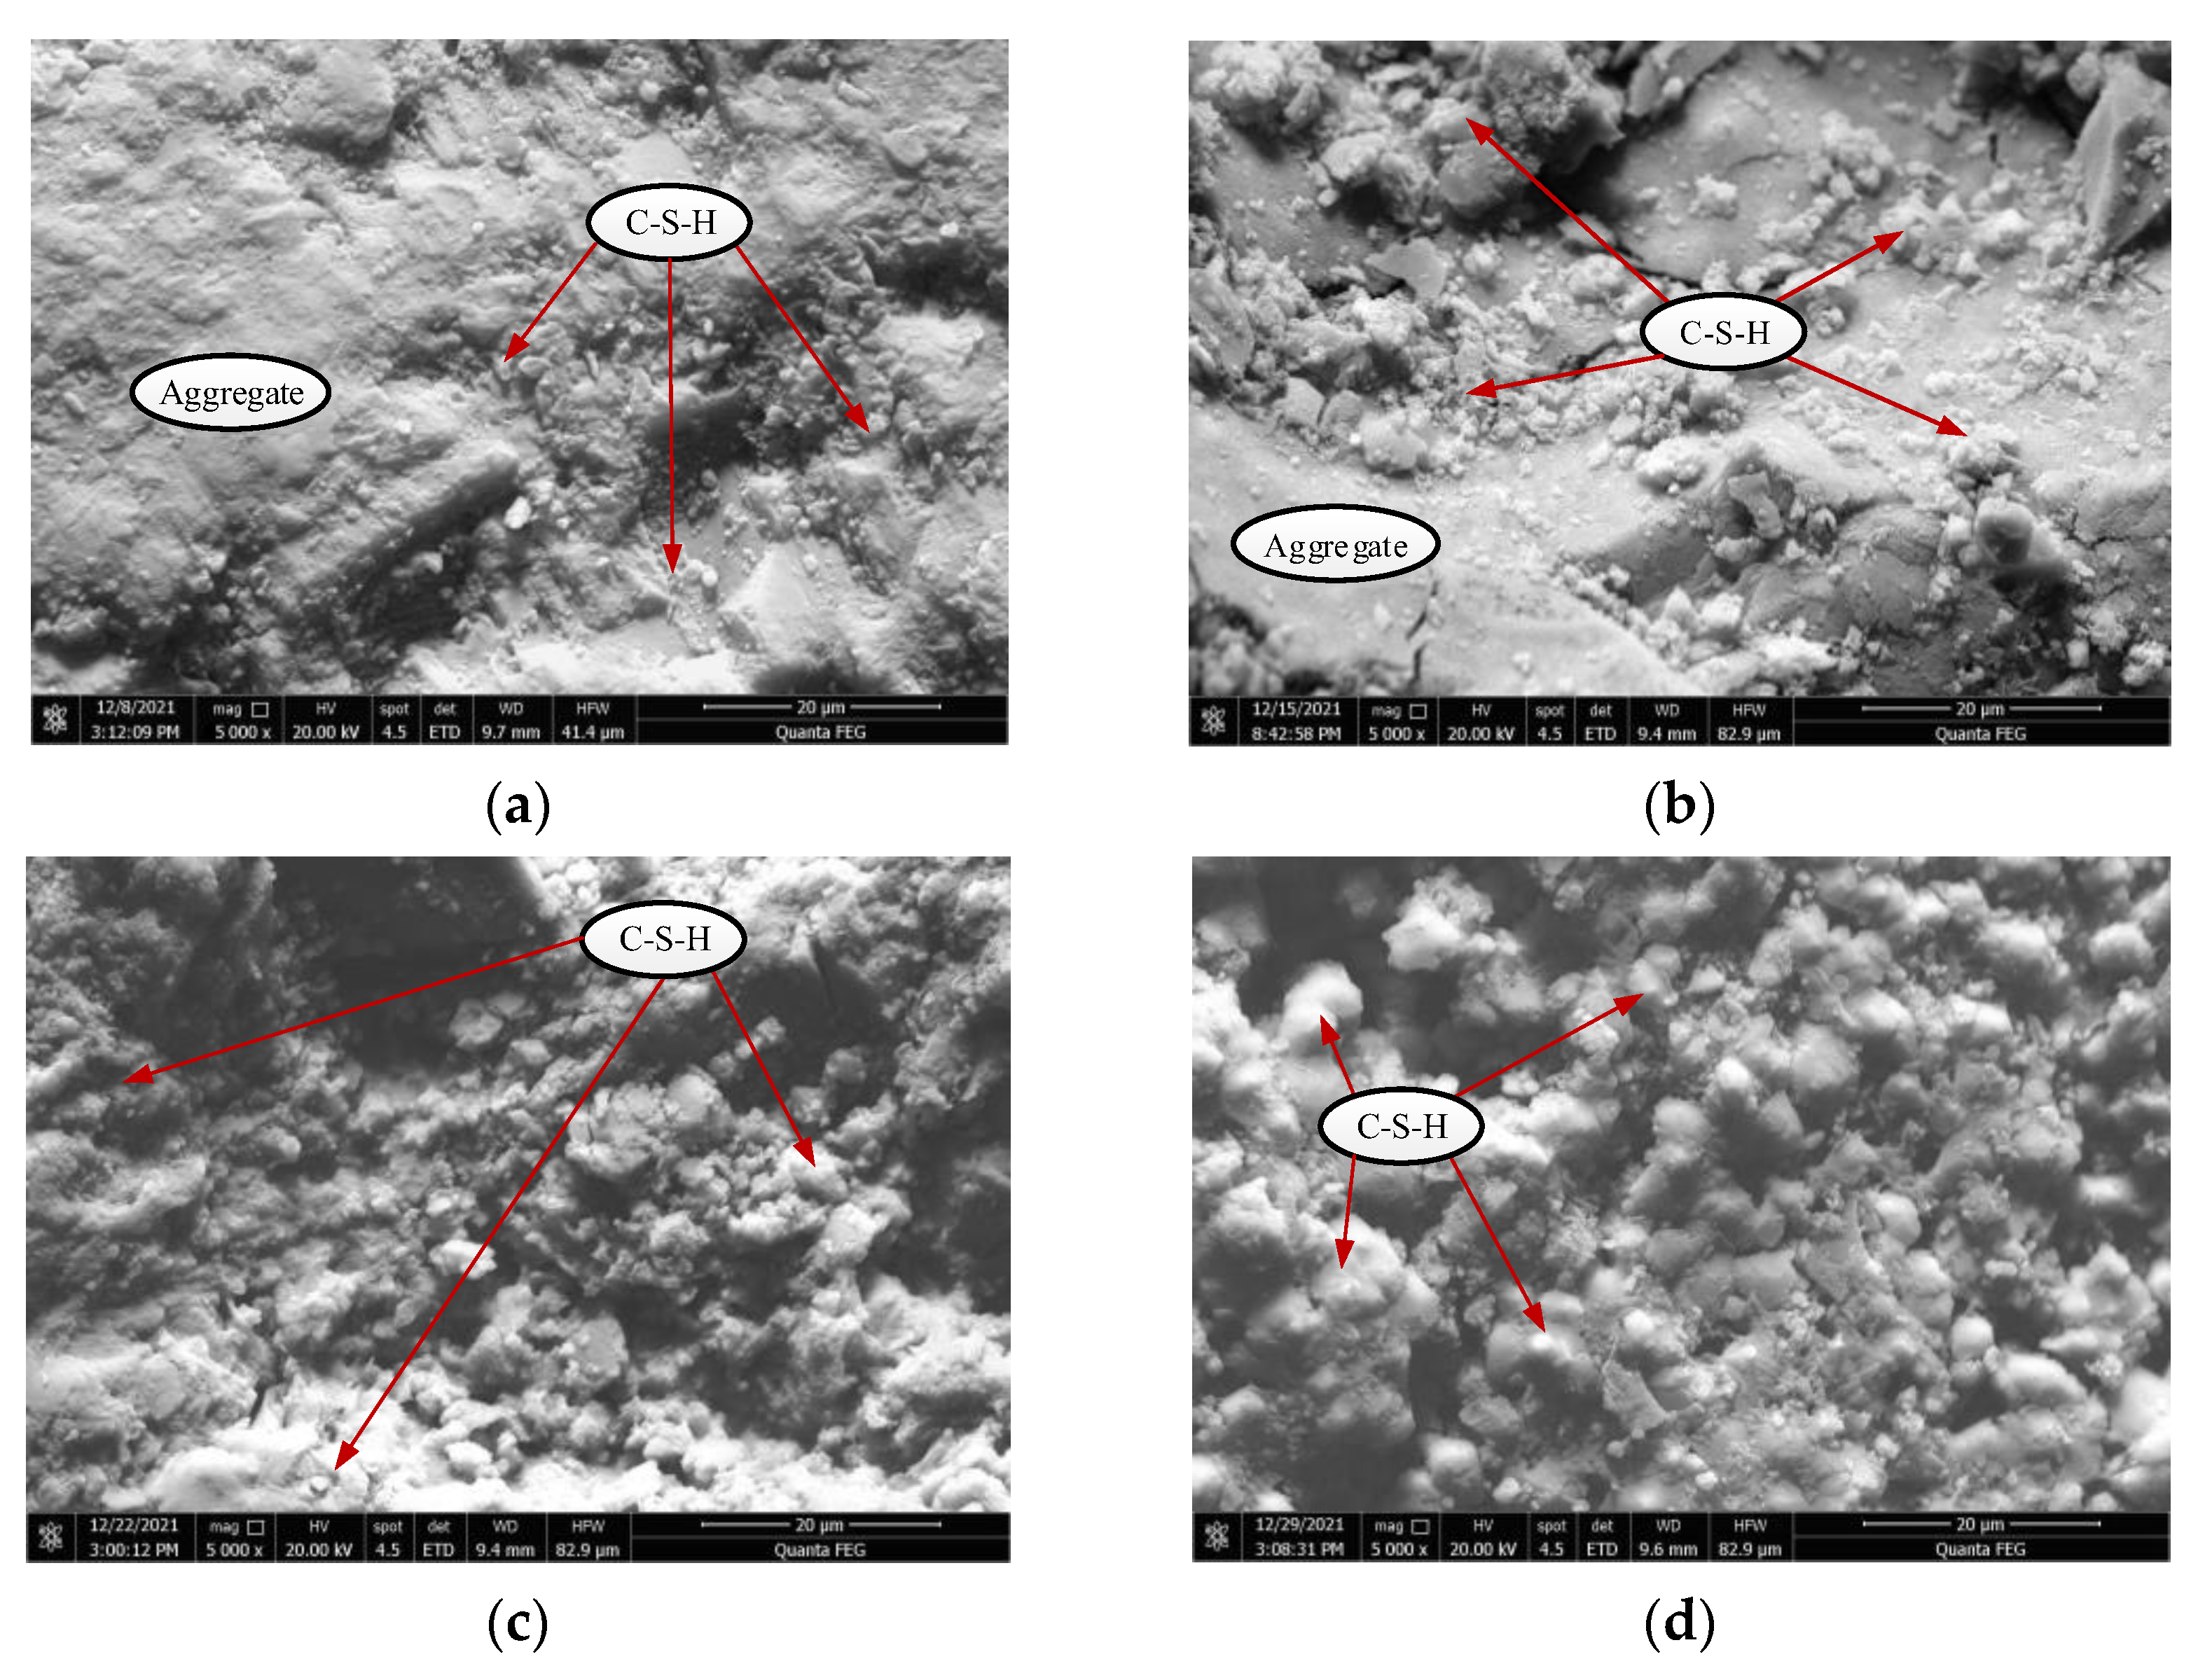
- Sample microstructures
- (2)
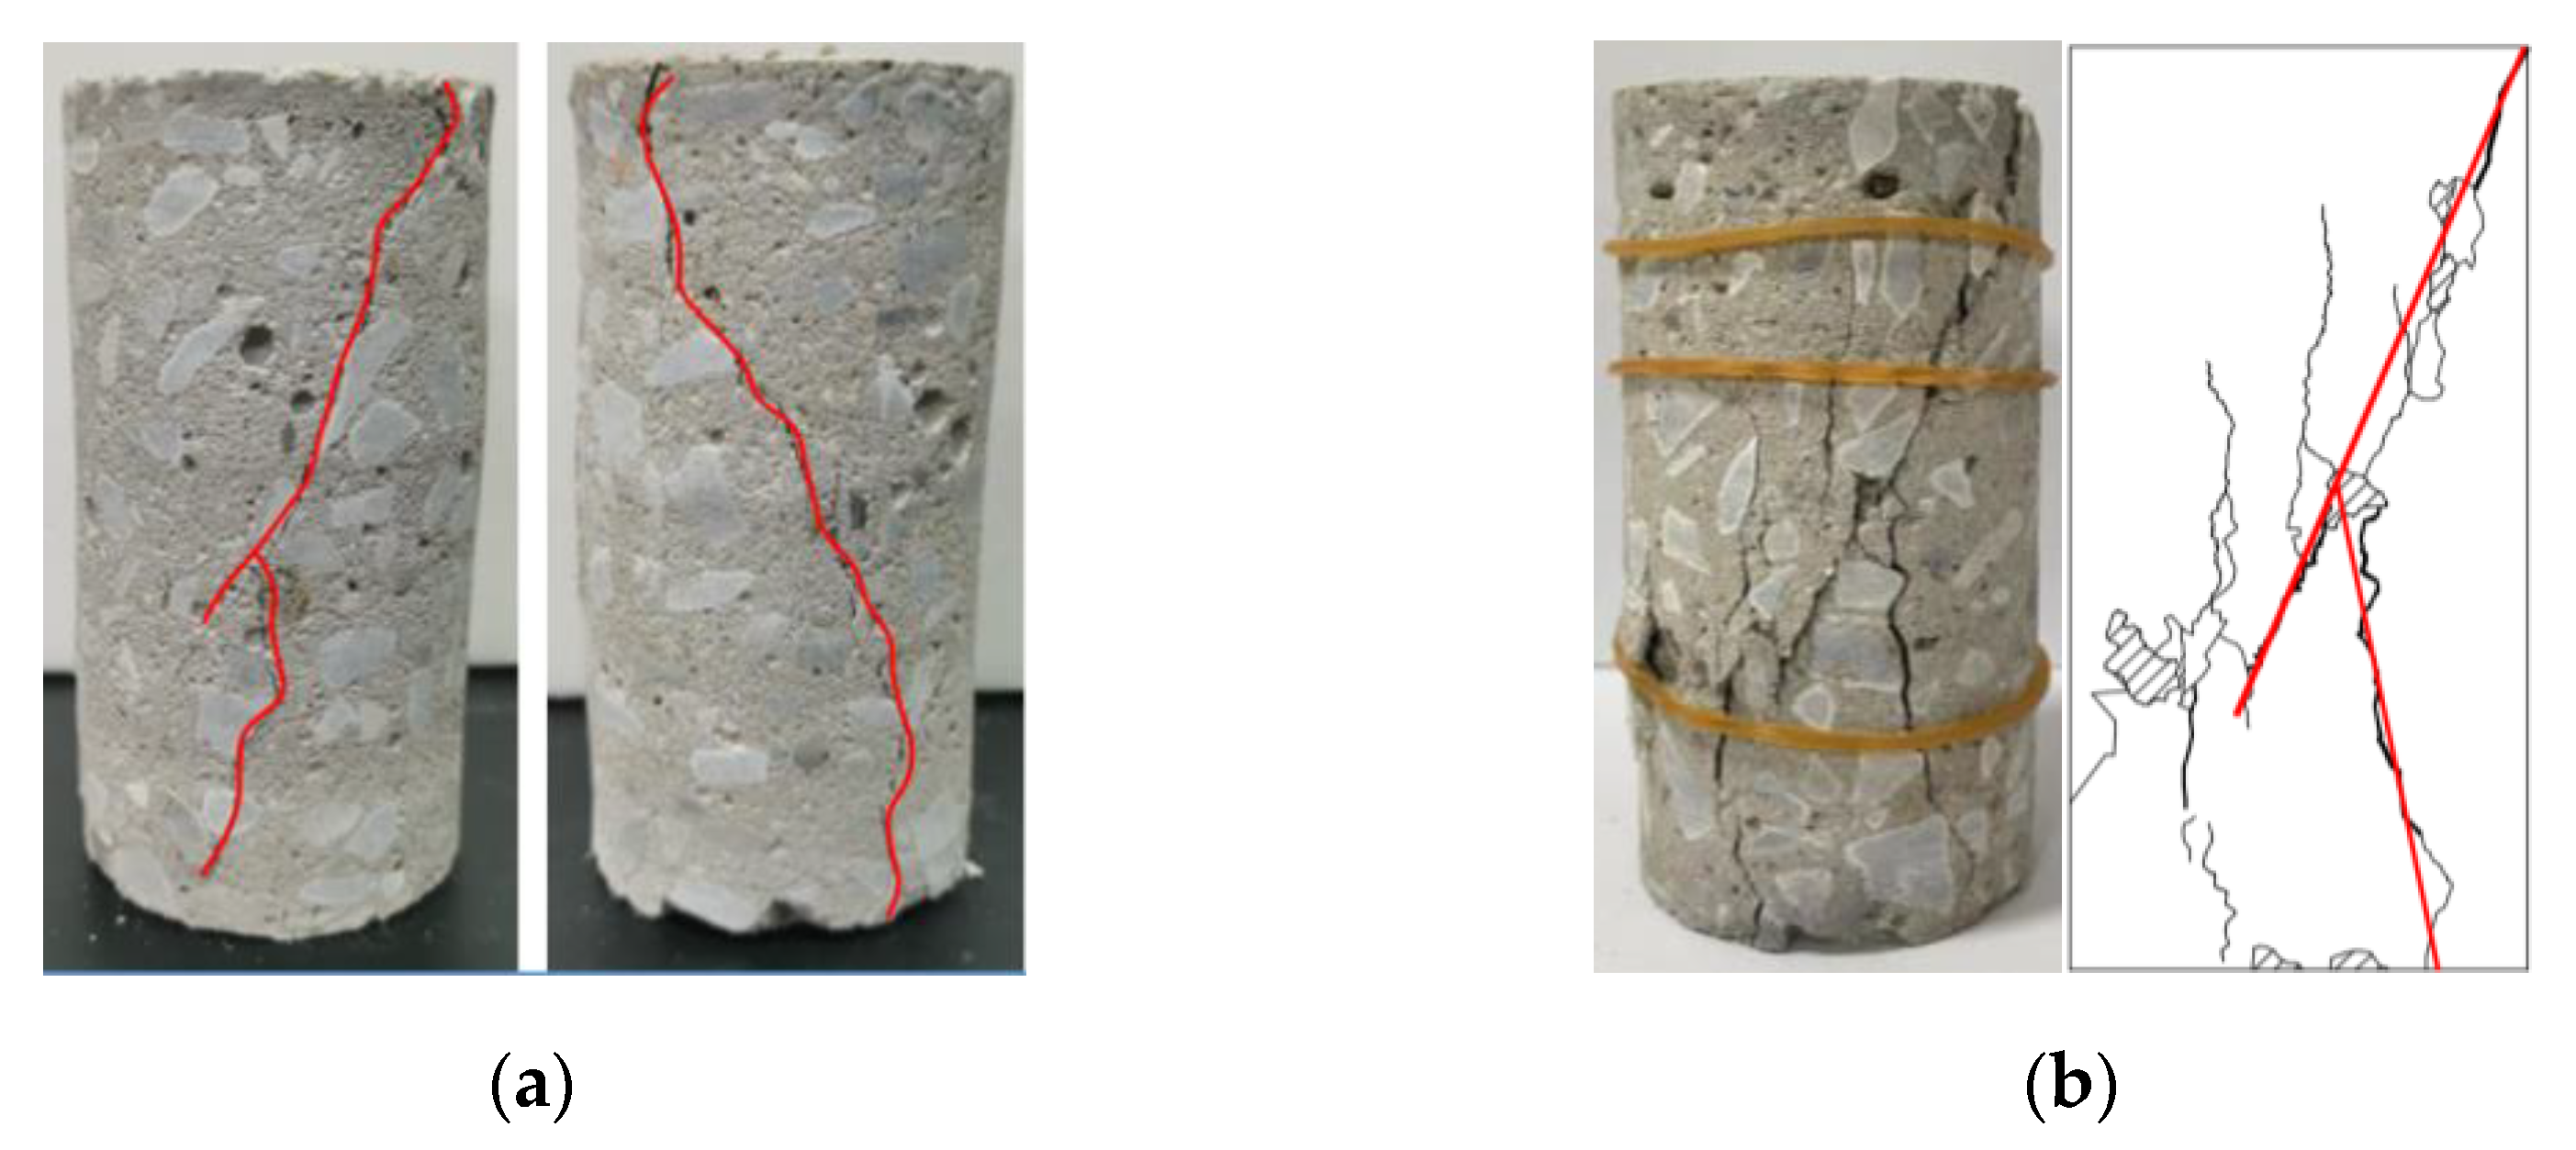
- Macroscopic fracture characteristics
3.2. Deformation Characteristics of Concrete Samples Subjected to Cyclical Loading
- (1)
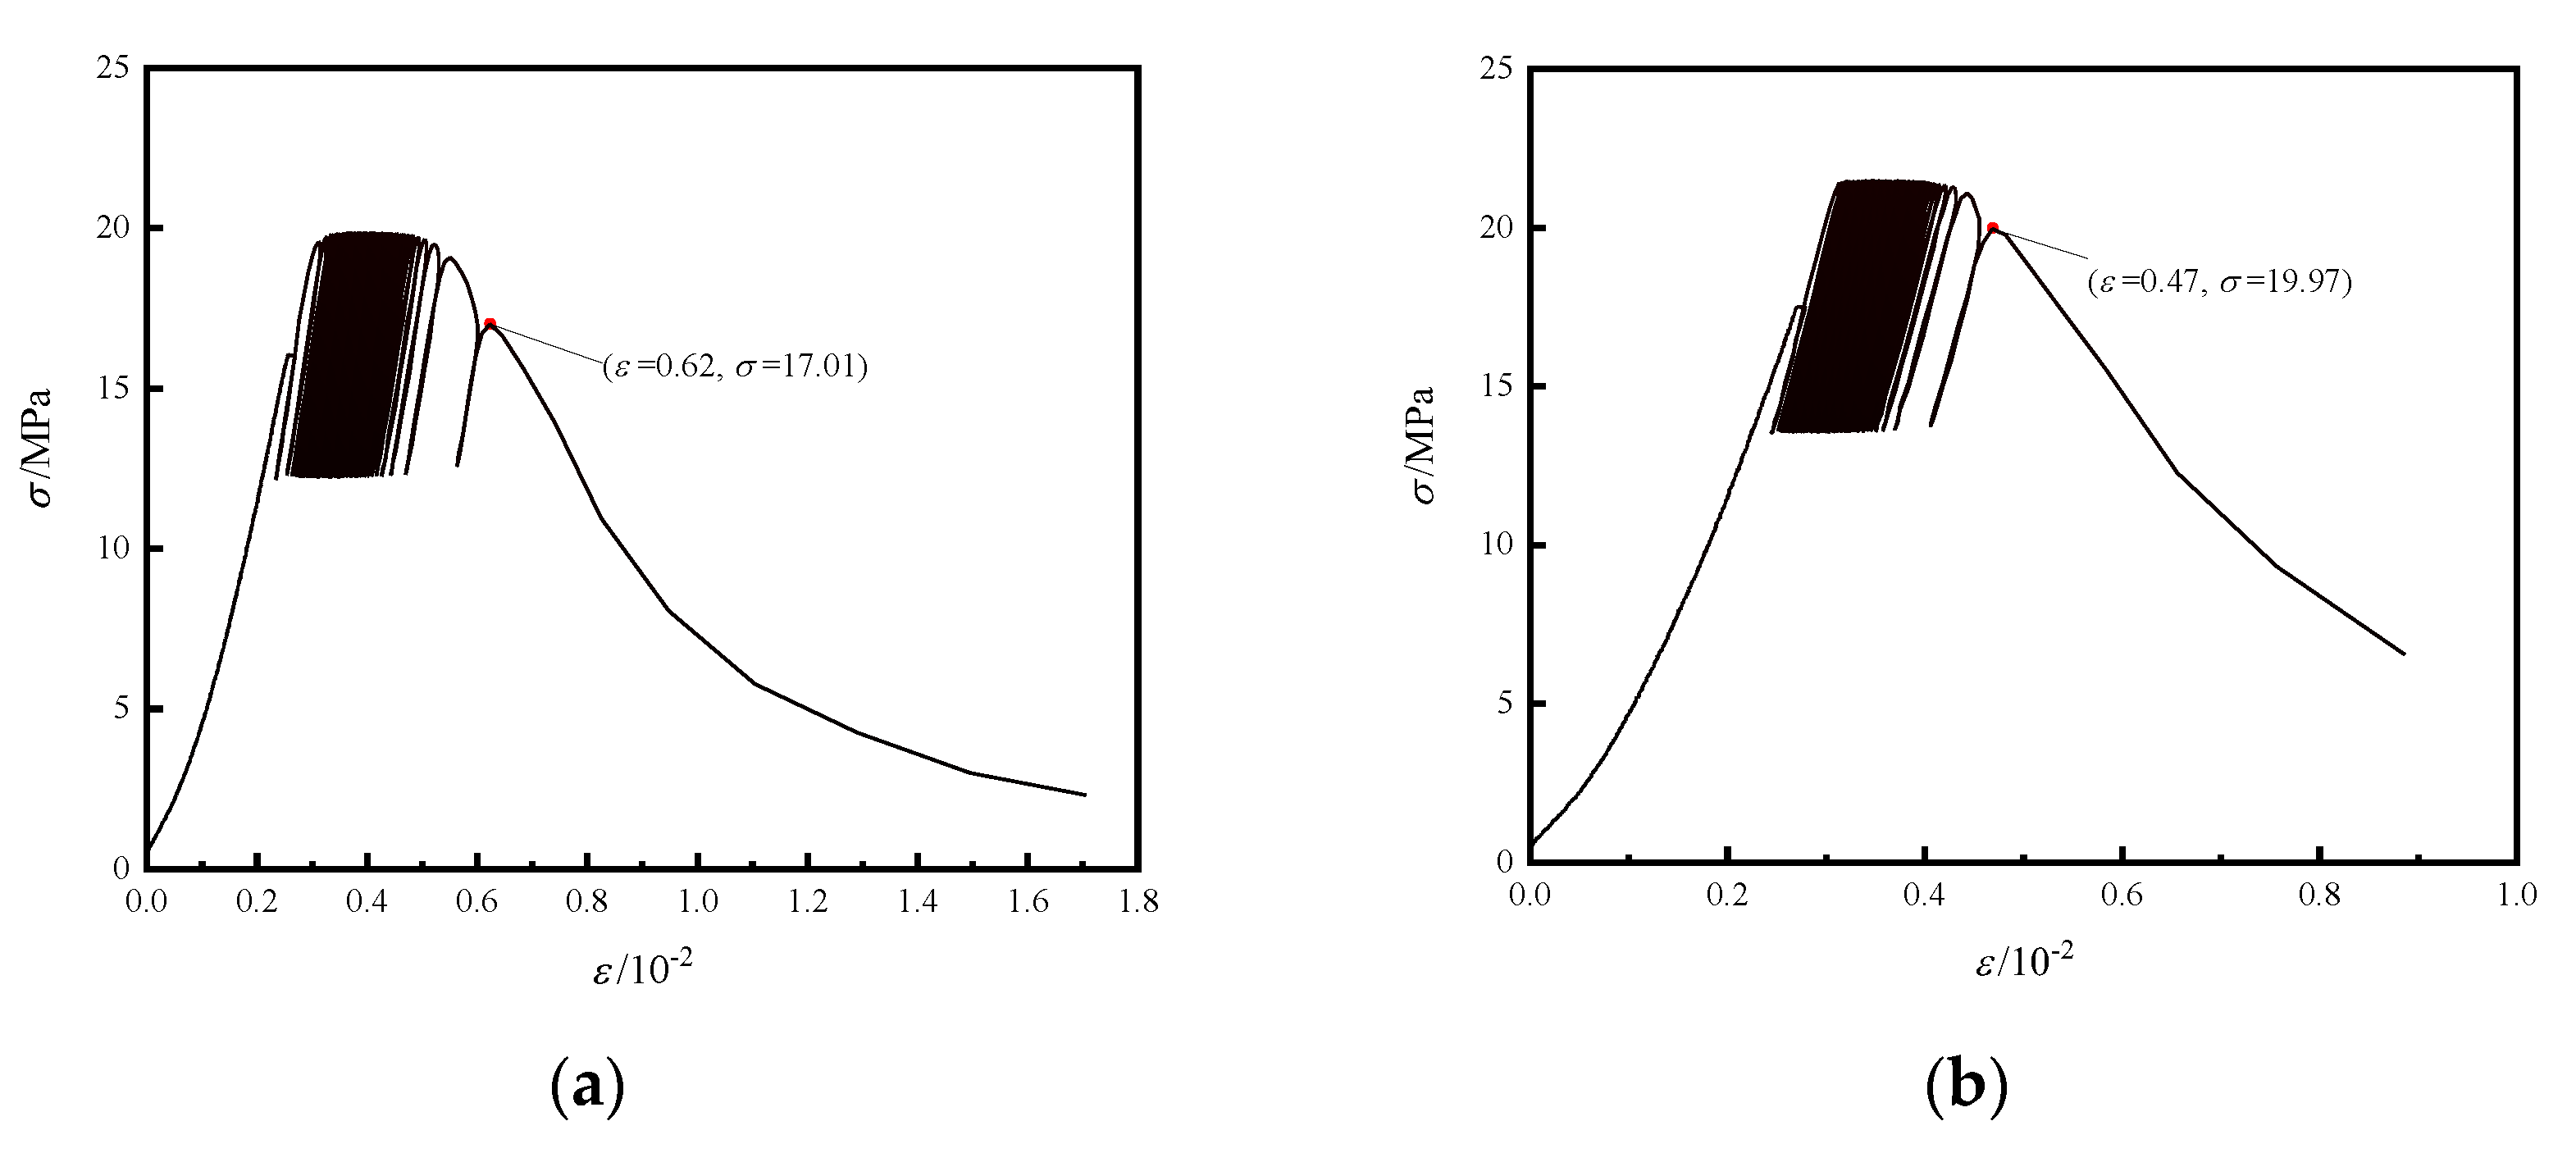
- Stress–strain curve
- (2)
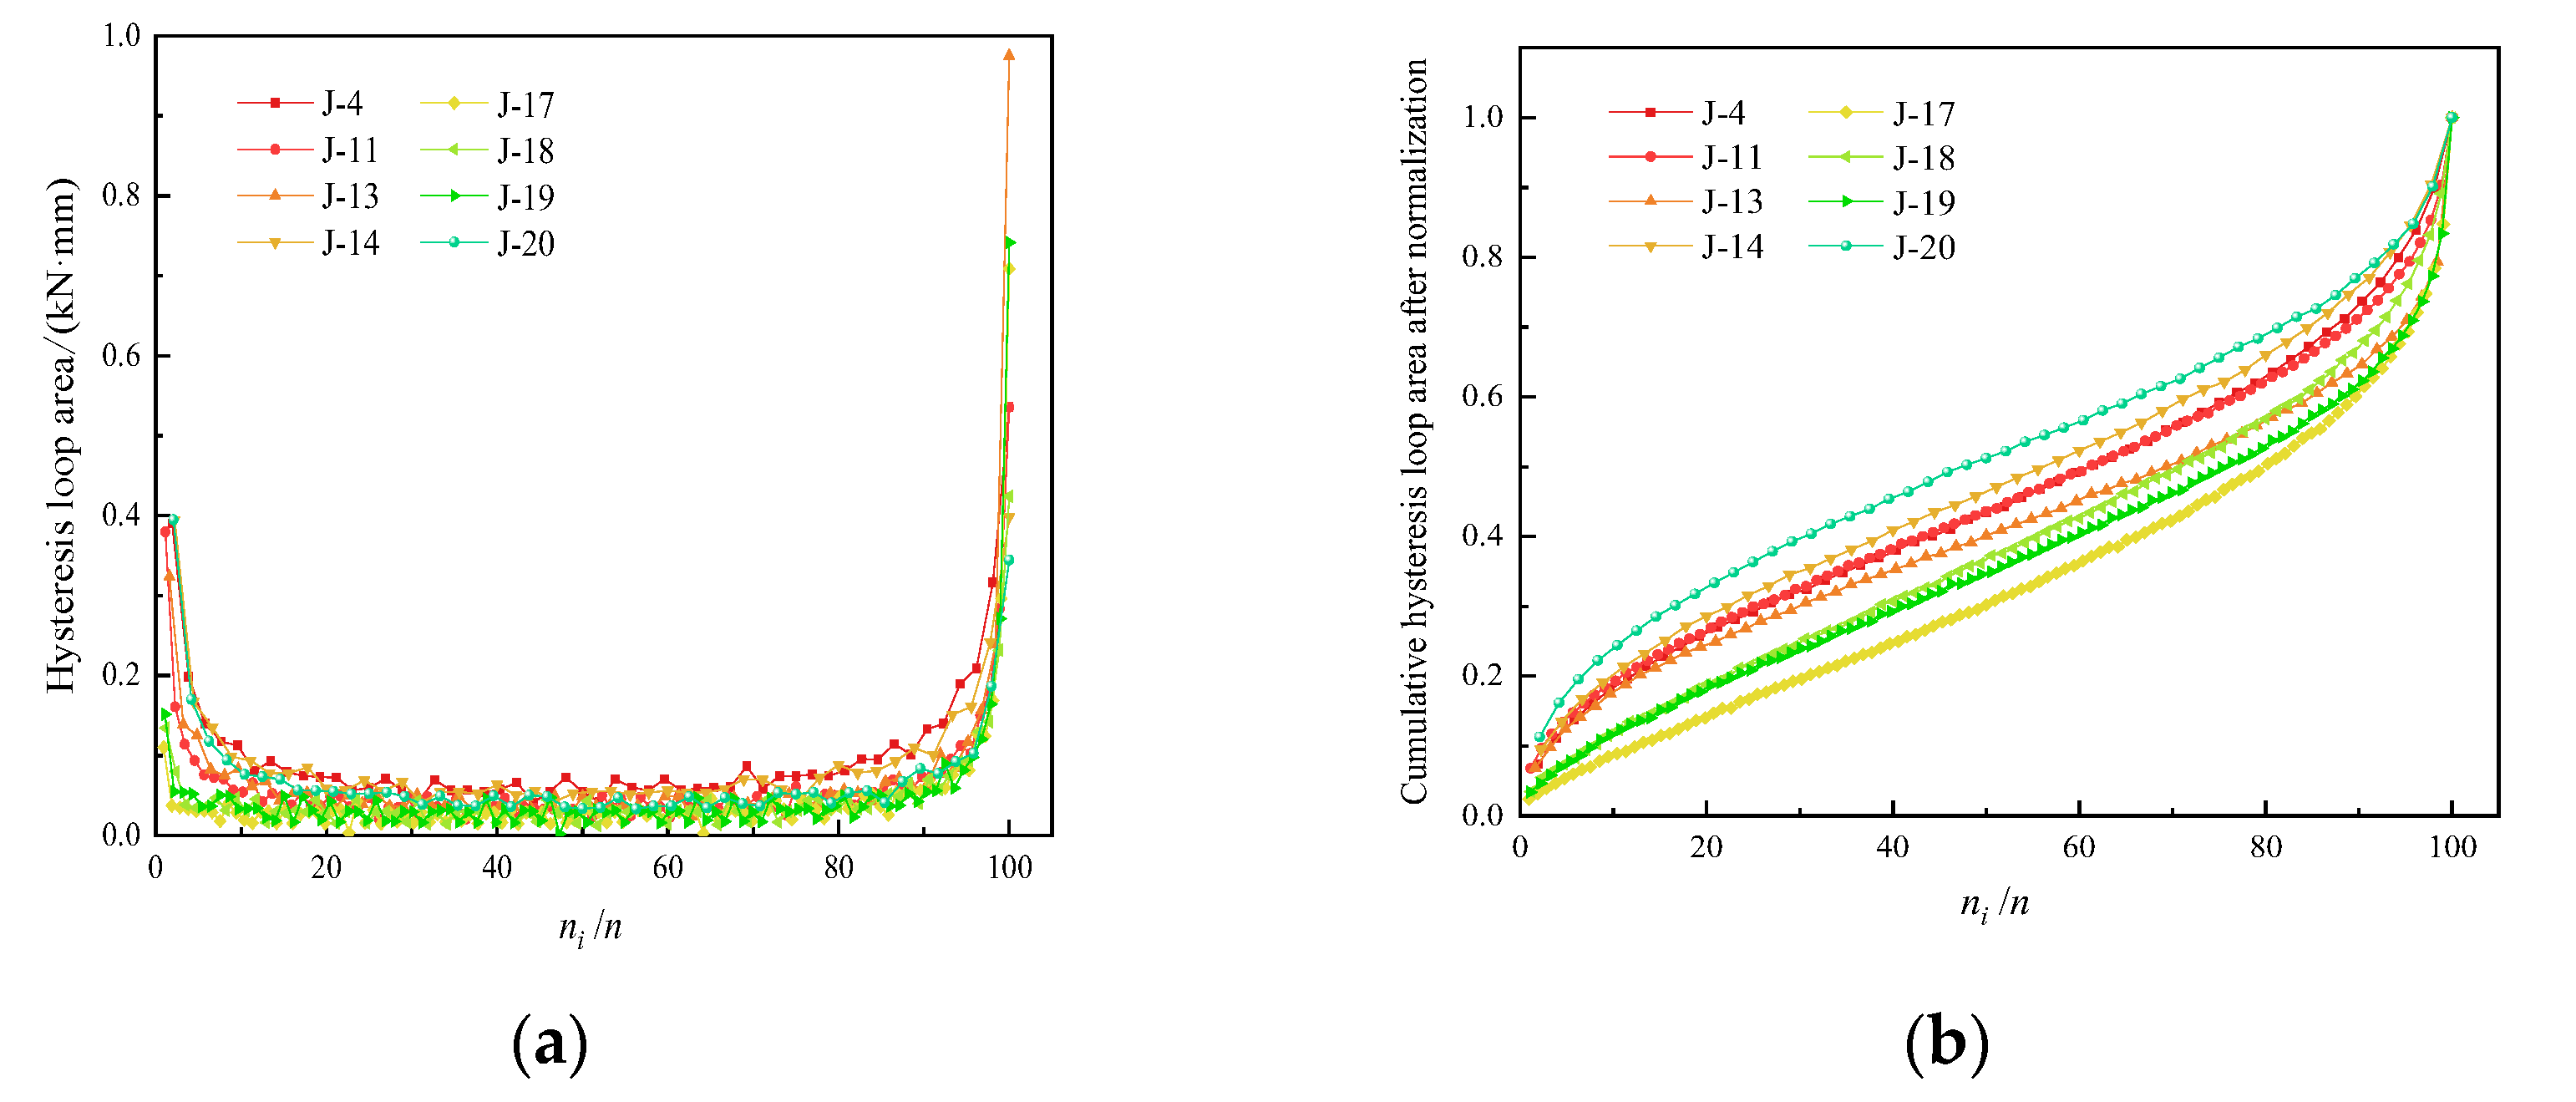
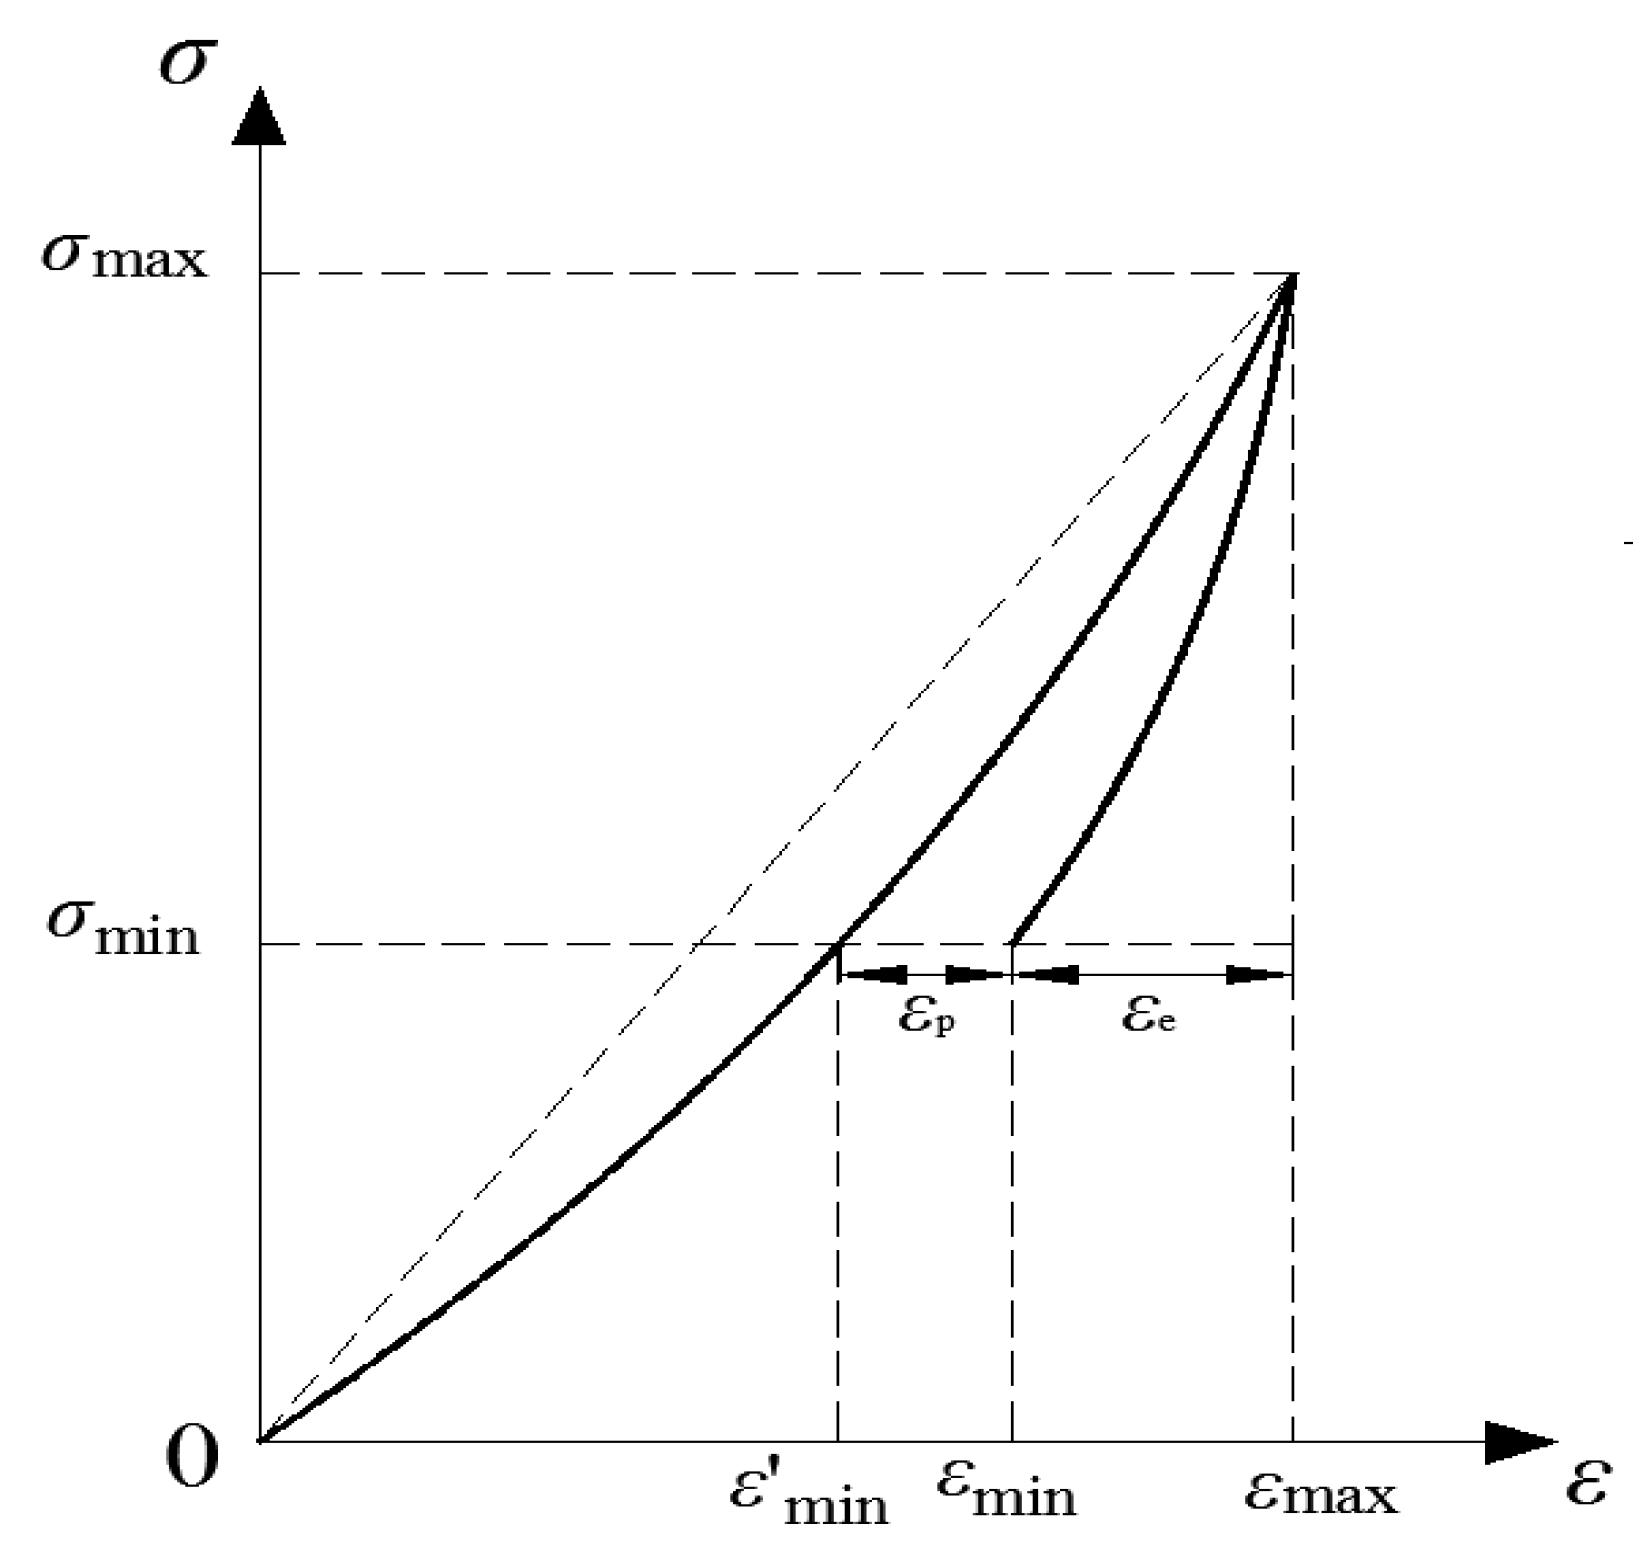
- Plastic hysteresis loop
- (3)
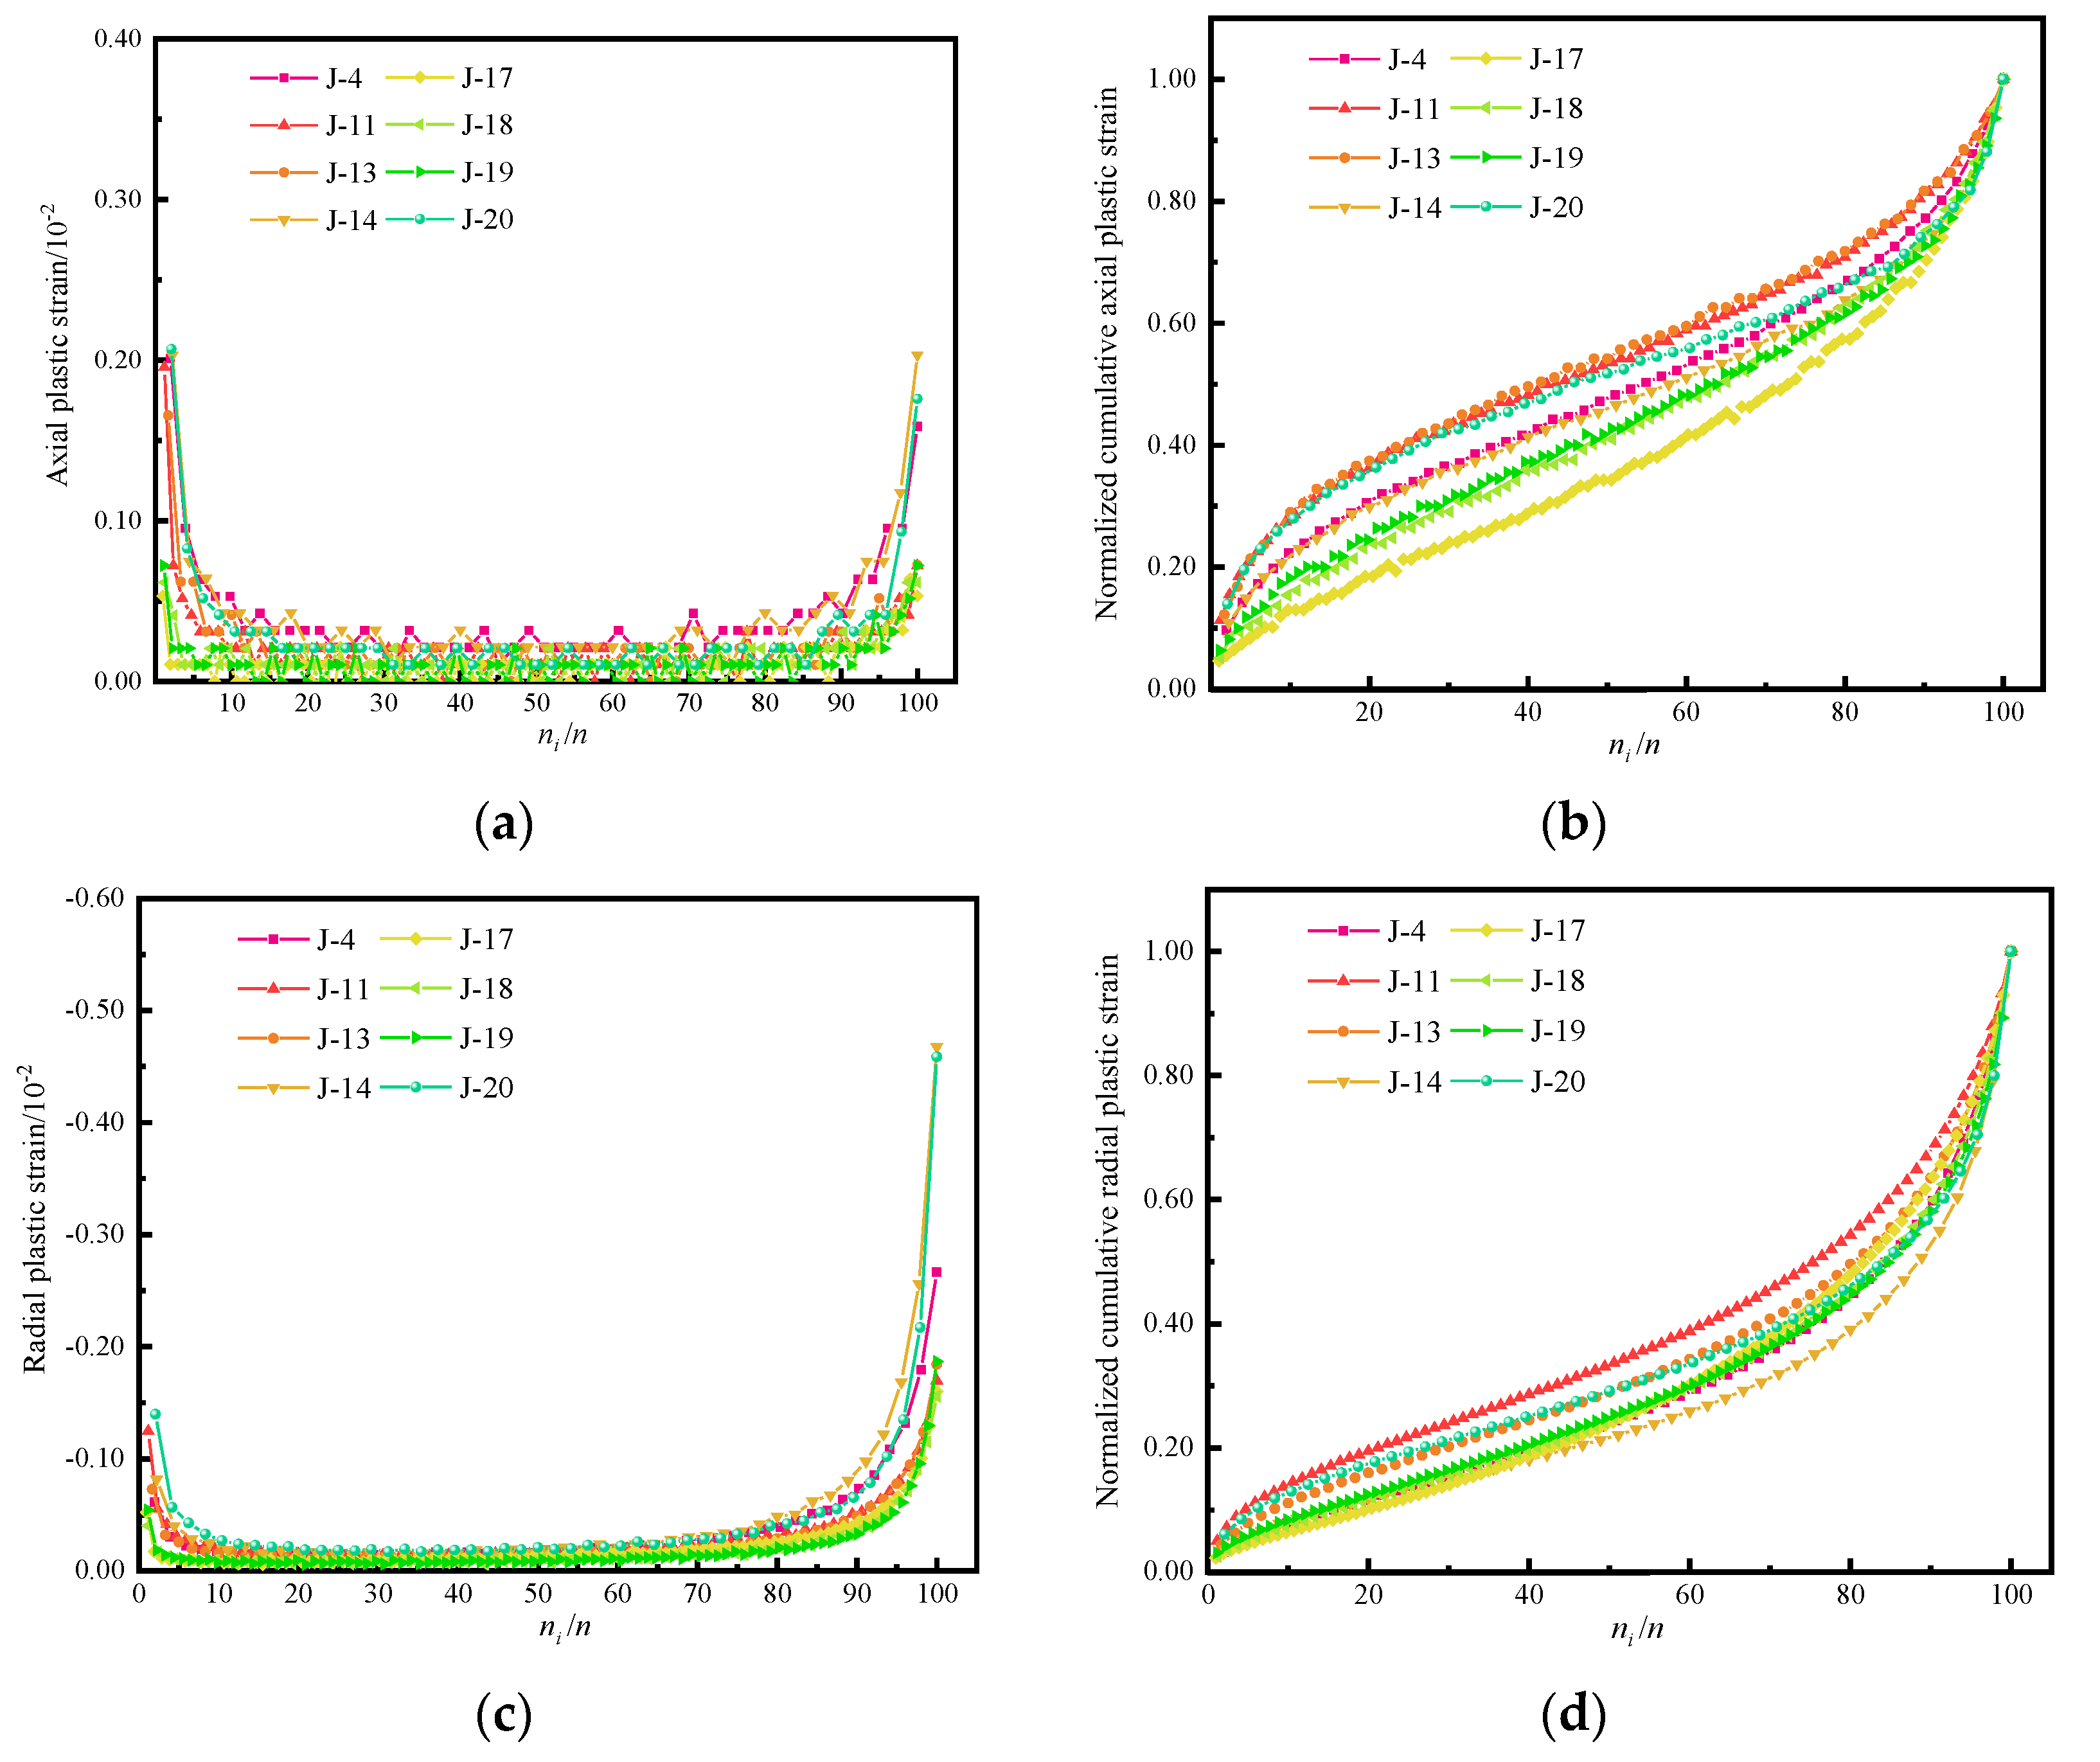
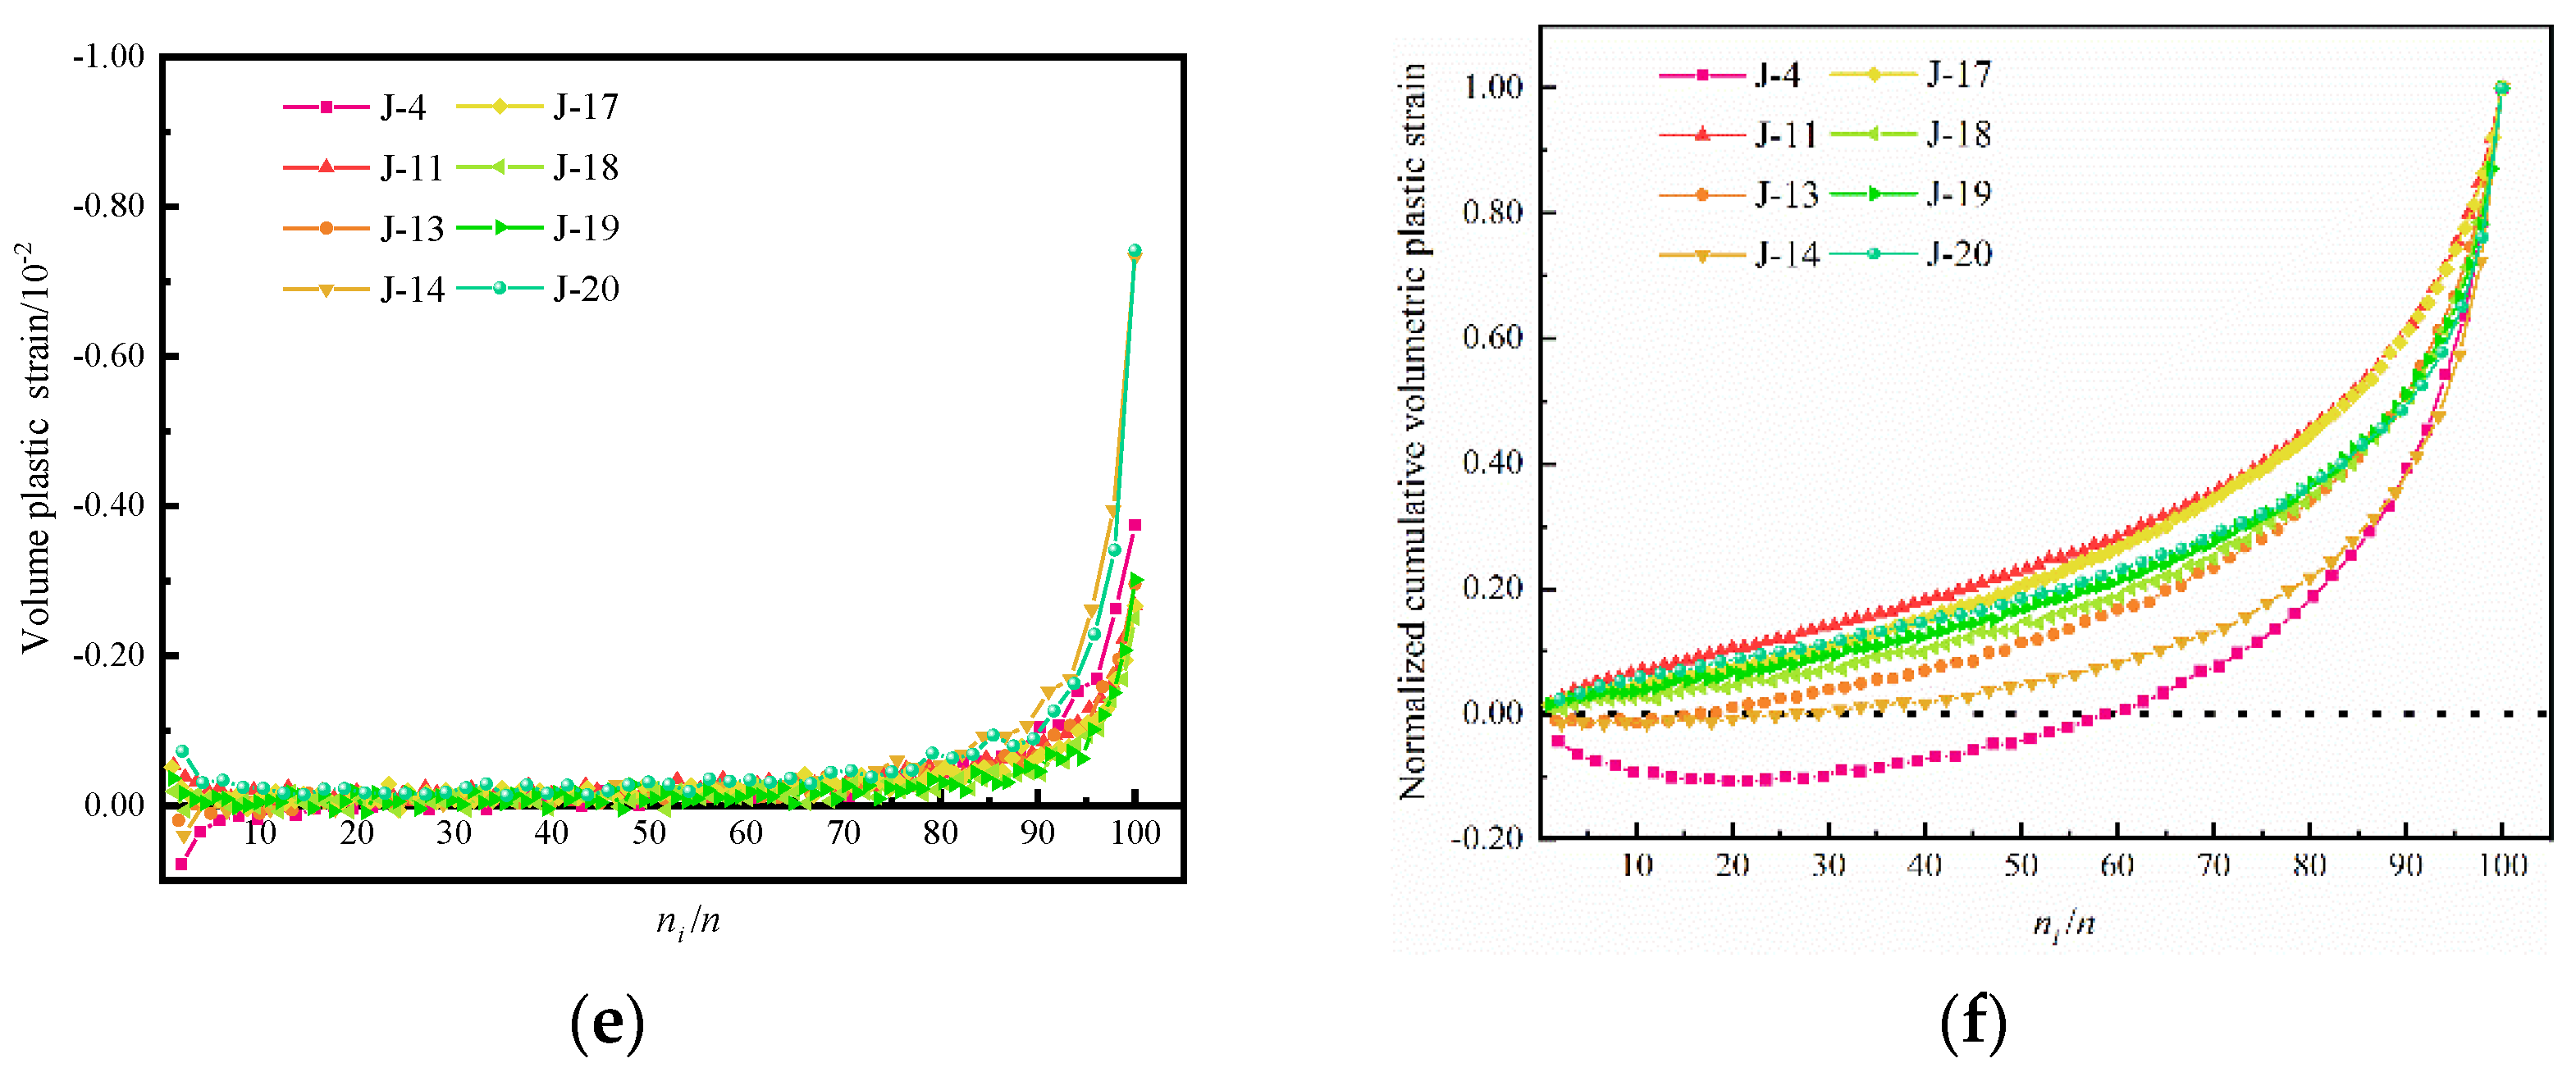
- Variation of plastic strain
3.3. Energy Dissipation of Concrete Samples Subjected to Cyclical Loading
- (1)
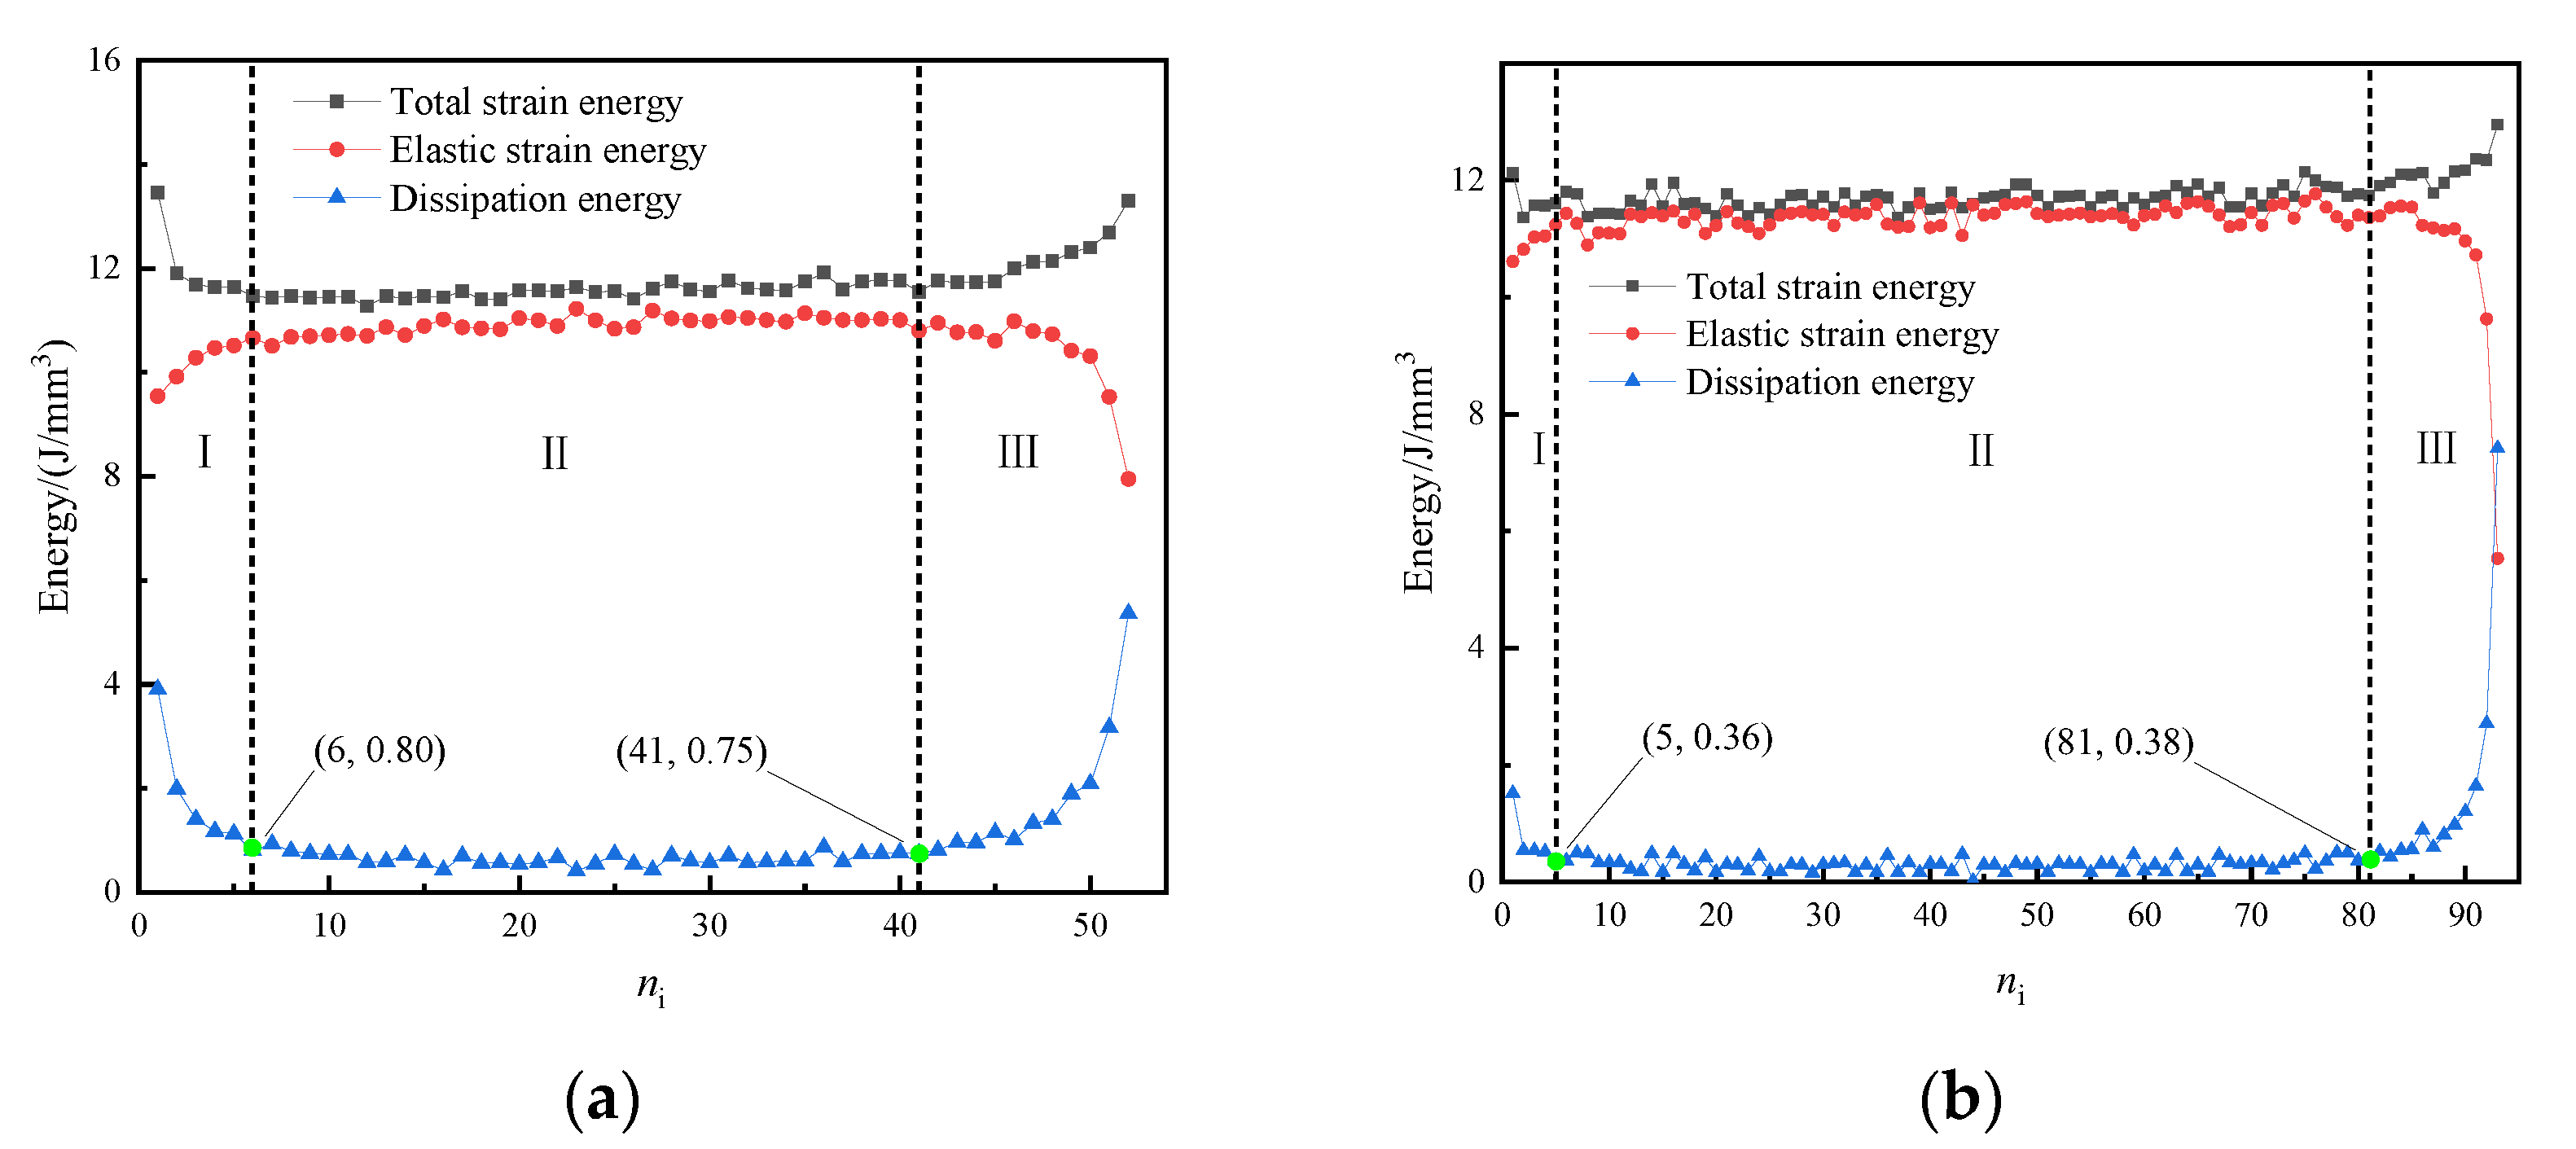
- Strain energy density
- (2)
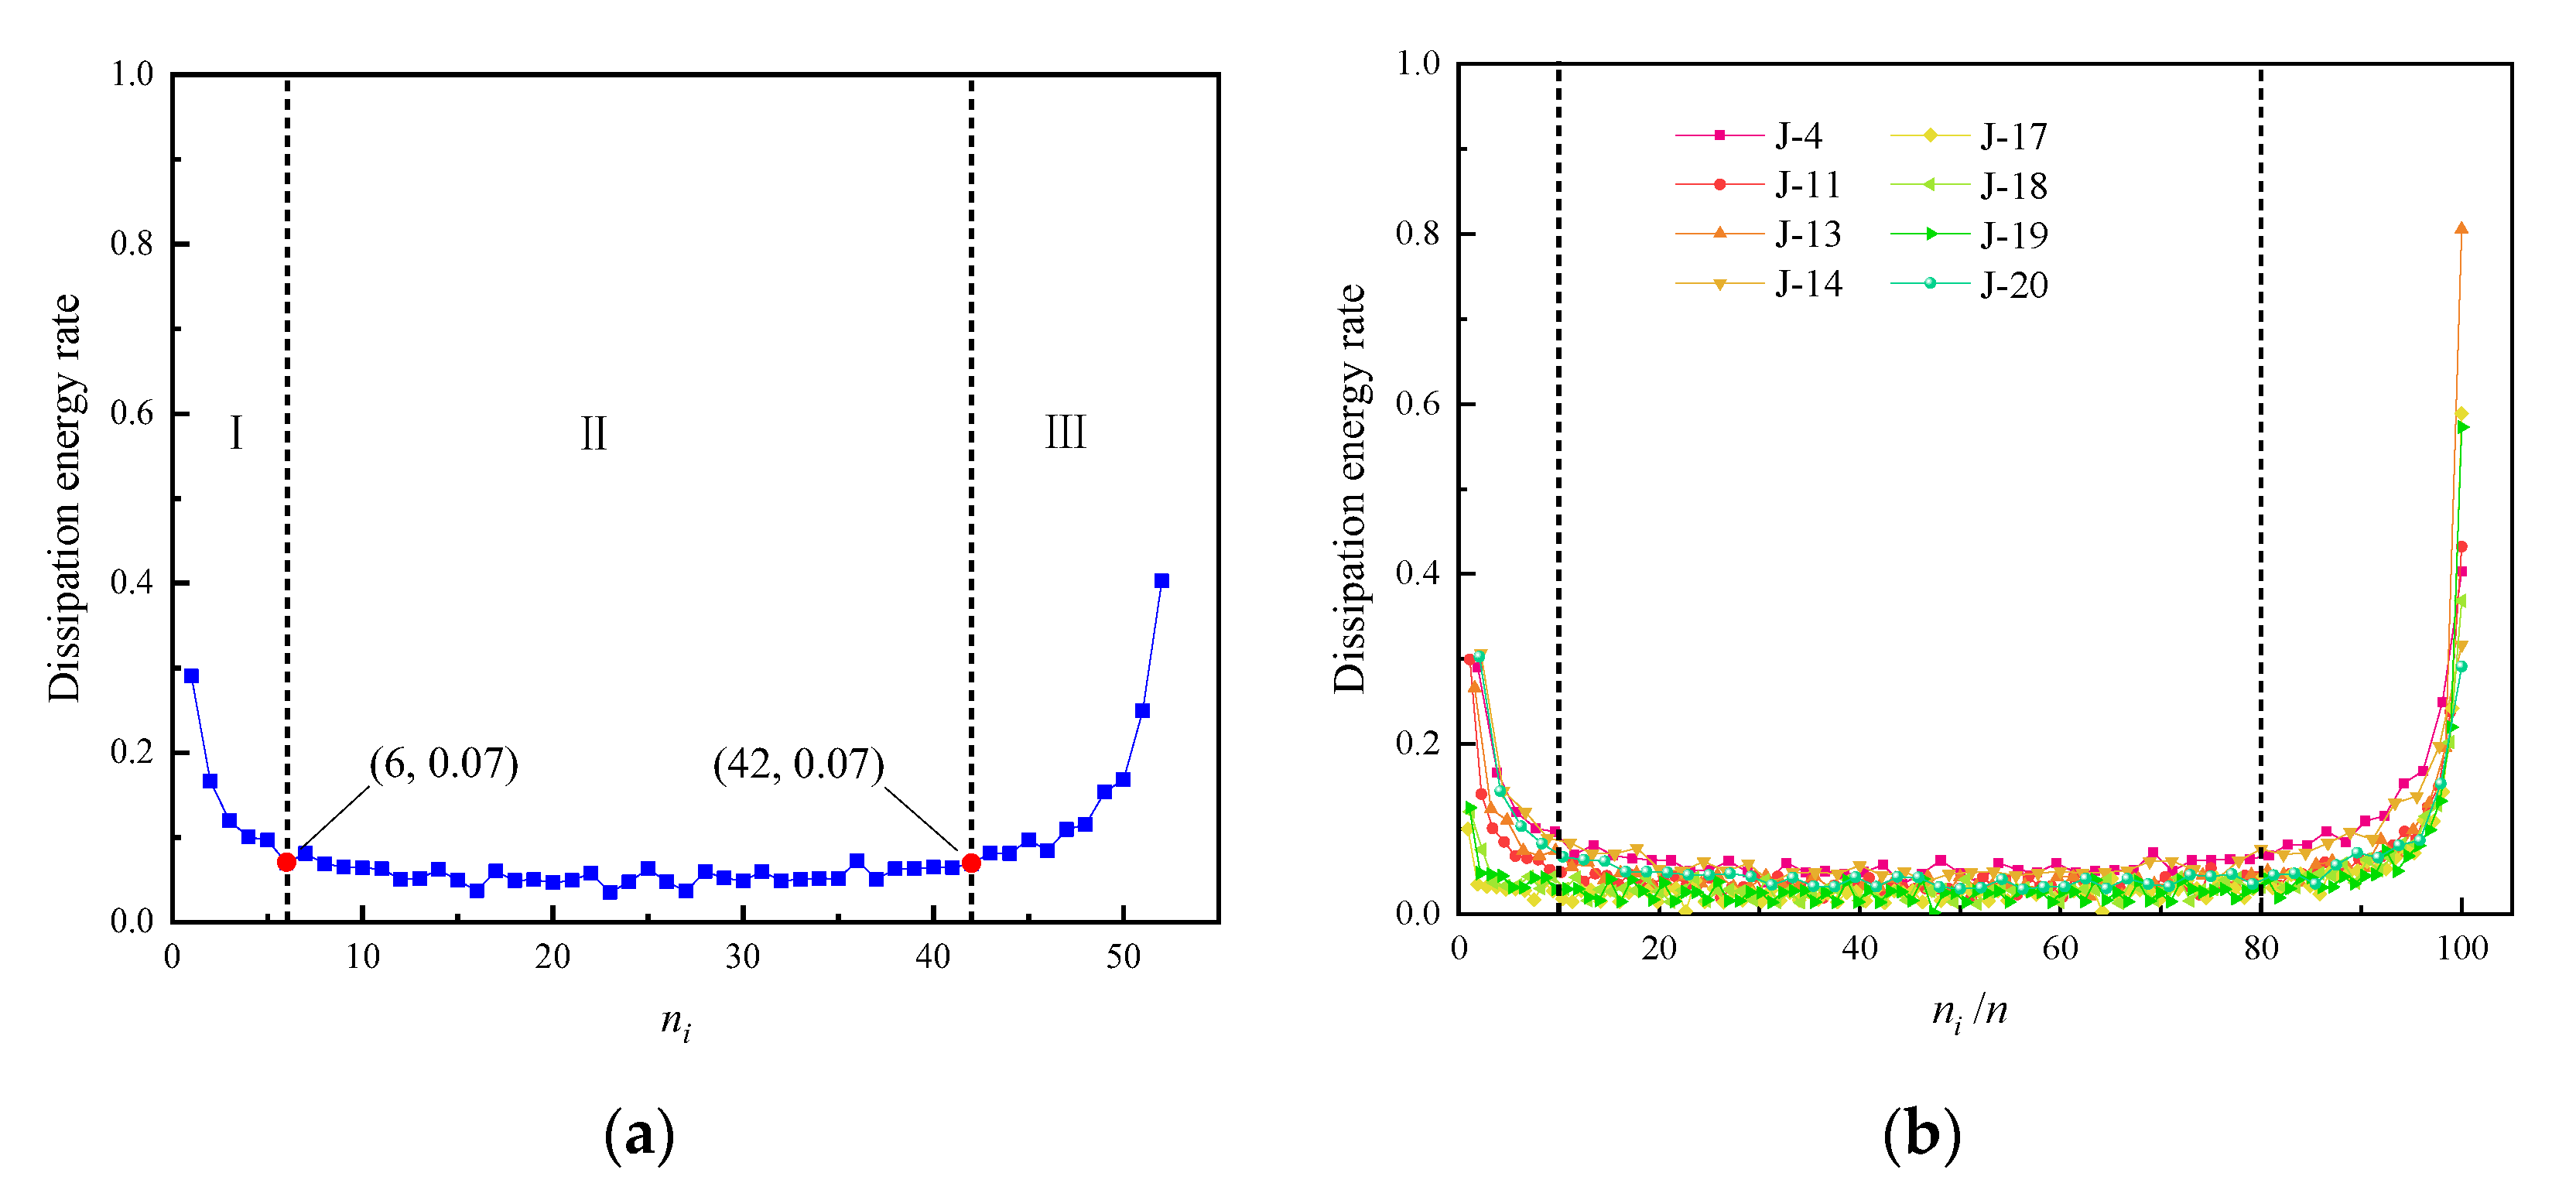
- Energy evolution characteristics
4. Conclusions
- (1)
- Back-filling concrete samples were prepared using Portland cement, river sand, crushed stone, and a high-efficiency water-reducing agent. With an increased curing period, hydration products increased, pores and fractures decreased, and the strength of the aggregate cement interface increased continuously, which has the characteristics of the fast lifting of the bearing strength and strong ductility. Due to the heterogeneity of the mesostructure, the failure modes were mainly tensile and shear failure, and the load-bearing performance decreased significantly after failure.
- (2)
- Under cyclical loading, the stress and strain curves of the concrete samples show obviously staged characteristics. With increased loading cycles, the evolution of plastic hysteresis loops shows the characteristic of “sparse–dense–sparse”, the area of the hysteresis loops showed a pattern of decrease–stabilization–rapid increase, and the larger the hysteresis loop area, the more obvious the volume expansion and the more obvious the bearing capacity reduction. Furthermore, the axial, radial, and volumetric plastic strain showed a “U” shape, and the plastic strain presented a staged pattern of a rapid decrease–stabilization–rapid increase, which directly reflects the regularity of fracture development and damage accumulation evolution in back-filling concrete samples under the influence of repeated mining.
- (3)
- Variation in the dissipated energy of the concrete sample subjected to cyclical loading was closely related to micro-crack propagation and damage evolution. The elastic energy increases with the increase in cyclic loading and unloading times, and the energy dissipation process could be divided into three stages: The initial dissipation stage, the stable dissipation stage, and the rapid dissipation stage. Furthermore, the dissipated energy first decreased, then stabilized with small fluctuations, and then increased rapidly. The calculation method of the dissipative energy rate is introduced to accurately describe the phase-change law of dissipative energy accumulation, which provides a basis for predicting the failure precursor of back-filling concrete samples.
Author Contributions
Funding
Informed Consent Statement
Data Availability Statement
Conflicts of Interest
References
- Kang, H.P.; Zhang, X.; Wang, D.P.; Tian, J.Z.; Yi, Z.Y.; Jiang, H. Strata control technology and application of non-pillar coal mining. J. China Coal Soc. 2022, 47, 16–44. [Google Scholar] [CrossRef]
- Chen, Y.; Bai, J.B.; Zhu, T.L.; Yan, S.; Zhao, S.H.; Li, X.C. Mechanisms of roadside support in gob-side entry retaining and its application. Rock Soil Mech. 2012, 33, 1427–1432. [Google Scholar] [CrossRef]
- Yang, B.S.; Tang, X.S.; Ling, Z.Q.; Wang, S. Study on surrounding rock moving law of roadside filling’s gob-side entry retaining in deep mining. J. Saf. Sci. Technol. 2012, 8, 58–64. [Google Scholar] [CrossRef]
- Liu, Z.; Zhao, L.H.; Wu, X.B.; Hu, G.P.; Zhou, Q.Y. Damage model of concrete considering hysteretic effect under cyclic loading. Adv. Eng. Sci. 2020, 52, 117–123. [Google Scholar] [CrossRef]
- Liu, H.Y.; Zhang, B.Y.; Li, X.L. Research on roof damage mechanism and control technology of gob-side entry retaining under close distance gob. Eng. Fail. Anal. 2022, 138, 106331. [Google Scholar] [CrossRef]
- Huang, Y.L.; Zhang, J.X.; Ju, F. Technology of roadside packing in gob-side entry retaining and law of rock pressure. J. Xi’an Univ. Sci. Technol. 2009, 29, 515–520. [Google Scholar] [CrossRef]
- Kan, J.G.; Zhang, N.; Li, B.Y.; Si, G.Y. Analysis of supporting resistance of back-filling wall for gob-side entry retaining under typical roof conditions. Rock Soil Mech. 2011, 32, 2778–2784. [Google Scholar] [CrossRef]
- Feng, G.R.; Ren, Y.Q.; Wang, P.F.; Guo, J.; Qian, R.P.; Li, S.Y.; Sun, Q.; Hao, C.L. Stress distribution and deformation characteristics of roadside backfill body for gob-side entry of fully-mechanized caving in thick coal seam. J. Min. Saf. Eng. 2019, 36, 1109–1119. [Google Scholar] [CrossRef]
- Meng, N.K.; Bai, J.B.; Chen, Y.; Wang, X.Y.; Wu, W.D.; Wu, B.W. Stability analysis of roadside backfill body at gob-side entry retaining under combined static and dynamic loading. Eng. Fail. Anal. 2021, 127, 105531. [Google Scholar] [CrossRef]
- Fan, D.Y.; Liu, X.S.; Tan, Y.L.; Yan, L.; Song, S.L.; Ning, J.G. An innovative approach for gob-side entry retaining in deep coal mines: A case study. Energy Sci. Eng. 2019, 7, 2321–2335. [Google Scholar] [CrossRef] [Green Version]
- Deng, H.F.; Hu, Y.; Li, J.L.; Wang, Z.; Zhang, X.J.; Hu, A.L. The evolution of sandstone energy dissipation under cyclic loading and unloading. Chin. J. Rock Mech. Eng. 2016, 35, 2869–2875. [Google Scholar] [CrossRef]
- Yang, X.B.; Han, X.X.; Liu, E.L.; Zhang, Z.P.; Wang, T.J.; Zhang, L.H. Properties of non-uniform deformation evolution of rock under uniaxial cyclic loading and unloading. J. China Coal Soc. 2018, 43, 449–456. [Google Scholar] [CrossRef]
- Li, J.T.; Xiao, F.; Ma, Y.P. Deformation damage and energy evolution of red sandstone under uni-axial cyclic loading and unloading. J. Hunan Univ. Nat. Sci. 2020, 47, 139–146. [Google Scholar] [CrossRef]
- Wu, Z.H.; Song, Z.Y.; Tan, J.; Zhang, Y.Z.; Qi, Z.J. The evolution law of rock energy under different graded cyclic loading and unloading modes. J. Min. Saf. Eng. 2020, 37, 836–844+851. [Google Scholar] [CrossRef]
- Yu, J.; Liu, Z.H.; Lin, L.H.; Huang, J.G.; Ren, W.B.; Zhou, L. Characteristics of dilatation of marble under variable amplitude cyclic loading and unloading. Rock Soil Mech. 2021, 42, 2934–2942. [Google Scholar] [CrossRef]
- Tang, H.D.; Zhu, M.L.; Zhu, Z.D. Three-dimensional propagation of local micro-cracks and non-linear deterioration mechanism of limestone under variable amplitude cyclic loading. Chin. J. Rock Mech. Eng. 2021, 40, 1170–1185. [Google Scholar] [CrossRef]
- Miao, S.J.; Liu, Z.J.; Zhao, X.G.; Huang, Z.J. Energy dissipation and damage characteristics of Beishan granite under cyclic loading and unloading. Chin. J. Rock Mech. Eng. 2021, 40, 928–938. [Google Scholar] [CrossRef]
- Breccolotti, M.; Bonfigli, M.F.; D’Alessandro, A.; Materazzi, A.L. Constitutive modeling of plain concrete subjected to cyclic uniaxial compressive loading. Constr. Build. Mater. 2015, 94, 172–180. [Google Scholar] [CrossRef]
- Park, S.J.; Kim, G.J.; Kwak, H.G. Characterization of stress-dependent ultrasonic nonlinearity variation in concrete under cyclic loading using nonlinear resonant ultrasonic method. Constr. Build. Mater. 2017, 145, 272–282. [Google Scholar] [CrossRef]
- Song, Z.; Frühwirt, T.; Konietzky, H. Characteristics of dissipated energy of concrete subjected to cyclic loading. Constr. Build. Mater. 2018, 168, 47–60. [Google Scholar] [CrossRef]
- Hu, X.; Lu, Q.; Xu, Z.; Zhang, W.; Cheng, S. Compressive stress-strain relation of recycled aggregate concrete under cyclic loading. Constr. Build. Mater. 2018, 193, 72–83. [Google Scholar] [CrossRef] [Green Version]
- Hutagi, A.; Khadiranaikar, R.B.; Zende, A.A. Behavior of geopolymer concrete under cyclic loading. Constr. Build. Mater. 2020, 246, 118430. [Google Scholar] [CrossRef]
- Hu, J.H.; Zeng, P.P.; Yang, D.J.; Xu, X. Analysis of damage deformation and mesoscopic structure of granite under deep cyclic loading. Chin. J. Nonferrous Met. 2022, 32, 1187–1198. [Google Scholar] [CrossRef]
- Xie, H.P.; Peng, R.D.; Ju, Y. Energy dissipation of rock deformation and fracture. Chin. J. Rock Mech. Eng. 2004, 23, 3565–3570. [Google Scholar] [CrossRef]
- Liu, X.H.; Hao, Q.J.; Hu, A.K.; Zheng, Y. Study on determination of uniaxial characteristic stress of coal rock under quasi-static strain rate. Chin. J. Rock Mech. Eng. 2020, 39, 2038–2046. [Google Scholar] [CrossRef]
- Guo, H.J.; Sun, J.M.; Zhou, Z.G.Z. Energy evolution characteristics of red sandstone under cyclic load. J. Min. Strat. Control Eng. 2021, 3, 15–23. [Google Scholar] [CrossRef]


| Sample | Prediction of Uniaxial Compressive Strength (MPa) | Cycle Loading Times | Failure Stress (MPa) | Intensity Decay Ratio (%) |
|---|---|---|---|---|
| J-4 | 24.83 | 55 | 17.01 | 31.49 |
| J-13 | 23.83 | 64 | 17.00 | 28.66 |
| J-14 | 24.83 | 48 | 17.57 | 29.24 |
| J-20 | 23.82 | 50 | 18.82 | 20.99 |
| J-11 | 24.82 | 90 | 18.81 | 24.21 |
| J-17 | 24.83 | 108 | 18.52 | 25.41 |
| J-18 | 26.82 | 90 | 19.98 | 25.50 |
| J-19 | 25.69 | 95 | 19.97 | 22.27 |
| Samples | n | n1 | n1/n | n2 | n2/n |
|---|---|---|---|---|---|
| J-4 | 55 | 6 | 10.91% | 45 | 81.82% |
| J-11 | 90 | 11 | 12.22% | 76 | 84.44% |
| J-13 | 64 | 9 | 14.06% | 53 | 82.81% |
| J-14 | 48 | 6 | 12.50% | 39 | 81.25% |
| J-17 | 108 | 11 | 10.19% | 92 | 85.19% |
| J-18 | 90 | 10 | 11.11% | 72 | 80.00% |
| J-19 | 95 | 10 | 10.53% | 80 | 84.21% |
| J-20 | 50 | 6 | 12.00% | 41 | 82.00% |
| average | / | / | 11.69% | / | 82.72% |
Publisher’s Note: MDPI stays neutral with regard to jurisdictional claims in published maps and institutional affiliations. |
© 2022 by the authors. Licensee MDPI, Basel, Switzerland. This article is an open access article distributed under the terms and conditions of the Creative Commons Attribution (CC BY) license (https://creativecommons.org/licenses/by/4.0/).
Share and Cite
Gao, X.; Liu, S.; Zhao, C.; Yin, J.; Fan, K. Damage Evolution Characteristics of Back-Filling Concrete in Gob-Side Entry Retaining Subjected to Cyclical Loading. Materials 2022, 15, 5772. https://doi.org/10.3390/ma15165772
Gao X, Liu S, Zhao C, Yin J, Fan K. Damage Evolution Characteristics of Back-Filling Concrete in Gob-Side Entry Retaining Subjected to Cyclical Loading. Materials. 2022; 15(16):5772. https://doi.org/10.3390/ma15165772
Chicago/Turabian StyleGao, Xicai, Shuai Liu, Cheng Zhao, Jianhui Yin, and Kai Fan. 2022. "Damage Evolution Characteristics of Back-Filling Concrete in Gob-Side Entry Retaining Subjected to Cyclical Loading" Materials 15, no. 16: 5772. https://doi.org/10.3390/ma15165772