Article

An Experimental Investigation of the Mechanical Behavior and Particle Crushing Characteristic of Volcanic Soil

College of Construction Engineering, Jilin University, Changchun 130026, China
*
Author to whom correspondence should be addressed.
Materials 2022, 15(15), 5423; https://doi.org/10.3390/ma15155423
Submission received: 11 July 2022 / Revised: 1 August 2022 / Accepted: 3 August 2022 / Published: 6 August 2022
(This article belongs to the Special Issue Testing of Materials and Elements in Civil Engineering (2nd Edition))

Abstract

:
Volcanic soil is a special soil that is well-known for its distinctive texture, vesicular nature, and particle fragility. The fragility characteristic of volcanic soil is the main factor affecting the foundation stability in road engineering. This study focuses on the mechanical properties and particle crushing characteristics of volcanic soil retrieved from Northeast China. A series of triaxial consolidation and drainage shear tests are performed on volcanic coarse-grained soil (5 mm > d > 0.075 mm) under different initial relative densities and effective confining pressures. Results show the peak friction angle of volcanic soil significantly decreases with the increase of confining pressure. The particle crushing degree of volcanic soil increases with the increase of confining pressure, particle size, and relative density. The relative breakage rate of the same particle size group has a good linear relationship with a fractal dimension. Moreover, for the same particle size, the relationship between plastic work and relative breakage rate can be fitted by a power function, which is not significantly affected by relative density or effective confining pressure. From an engineering view, in addition to increasing the compaction degree of volcanic soil, volcanic soil with fine particles used as a roadbed filler can significantly reduce the deformation of the roadbed and improve the bearing capacity of the foundation.

1. Introduction

In recent years, with the increasing expansion of road construction, some roads have to cross volcanic soil areas, considering local availability in large quantities and low cost [1], the use of volcanic soils in roadbed fill has increased.
As a regional special soil, volcanic soil differs from traditional sand and gravel stacks in that its genesis originates from the eruption and condensation of volcanic magma. This special genesis allows volcanic soils to play different roles in various fields, such as refractory materials and adsorbents to remove harmful ions from industrial wastewater [2,3,4,5,6,7]. Mechanical properties are the focus of the present study. With the ejection of magma, under the conditions of reduced external pressure and a sudden temperature drop, gas escapes from the lava and forms pores of various sizes and numbers, moreover, since this material has not undergone long-distance transport effects, as a result, volcanic soil exhibits porous characteristics and irregular particle shape characteristics [8]. These special structures make the volcanic soil particle easy to crush under lower loads [9,10], this causes excessive deformation even rapid weakening of volcanic soil foundation bearing capacity, leading to instability and other hazards, affecting the safe operation of road facilities. Therefore, an in-depth investigation of volcanic soil particle crushing characteristics is meaningful for the stability of road engineering.
The special crushing sensitivity of volcanic soils has attracted the attention of scholars. According to the results of previous studies, particle crushing is related to a variety of factors, mainly including mineral composition [11,12,13], particle shape [14,15,16], particle size [17,18,19], particle relative density [20,21], and external loads [22,23], etc. Extensive research has been performed to study the mechanical properties of crushable volcanic soils retrieved from different regions. For example, Agustian and Goto [9] investigated the effects of particle size, dry density, and effective confining stress on Japanese volcanic soils by drained triaxial compression tests and found particle sizes had a noticeable influence on internal friction angle. Kikkawa et al. [24] performed K0 compression tests to compare the compression behavior of loose and dense sand and pointed out that dense sand particles exhibited more crushing and less tendency during loading. Galvis-Castro et al. [25] conducted a one-dimensional compression study of volcanic soils in the Columbia area, the result showed that yield stress was low. Asadi et al. [26] reported a crushable volcanic soil acquired from the North Island of New Zealand and found its shear modulus was much lower than Toyoura sand. Scholars’ studies show that the mechanical strength of volcanic soil was low due to its fragile crushing nature. Although scholars have achieved plenty of achievements in crushable volcanic soil. However, quantitative studies on particle crushing characteristics and the mechanical behavior of volcanic soils are not sufficient, such as quantitative measurement of particle crushing, the relationship between the crushing of volcanic soil particles and the external input energy, etc. A deeper study of these aspects will help to better understand the mechanical properties of crushable volcanic soils and provide theoretical guidance for the construction in road engineering.
Given this, the objective of this study is to investigate particle size (d), confining pressure (σ3), and relative density (Dr) on the mechanical behavior and crushing characteristics of volcanic soils. The mechanical characteristics, strength indexes, and critical state of volcanic soils were examined. Then, particle crushing features after the shearing test was addressed using the quantitative indexes relative breakage rate and fractal dimension, and the particle crushing pattern was analyzed. Finally, from an energy perspective, the relationship between plastic work and relative breakage rate was established.

2. Materials and Methods
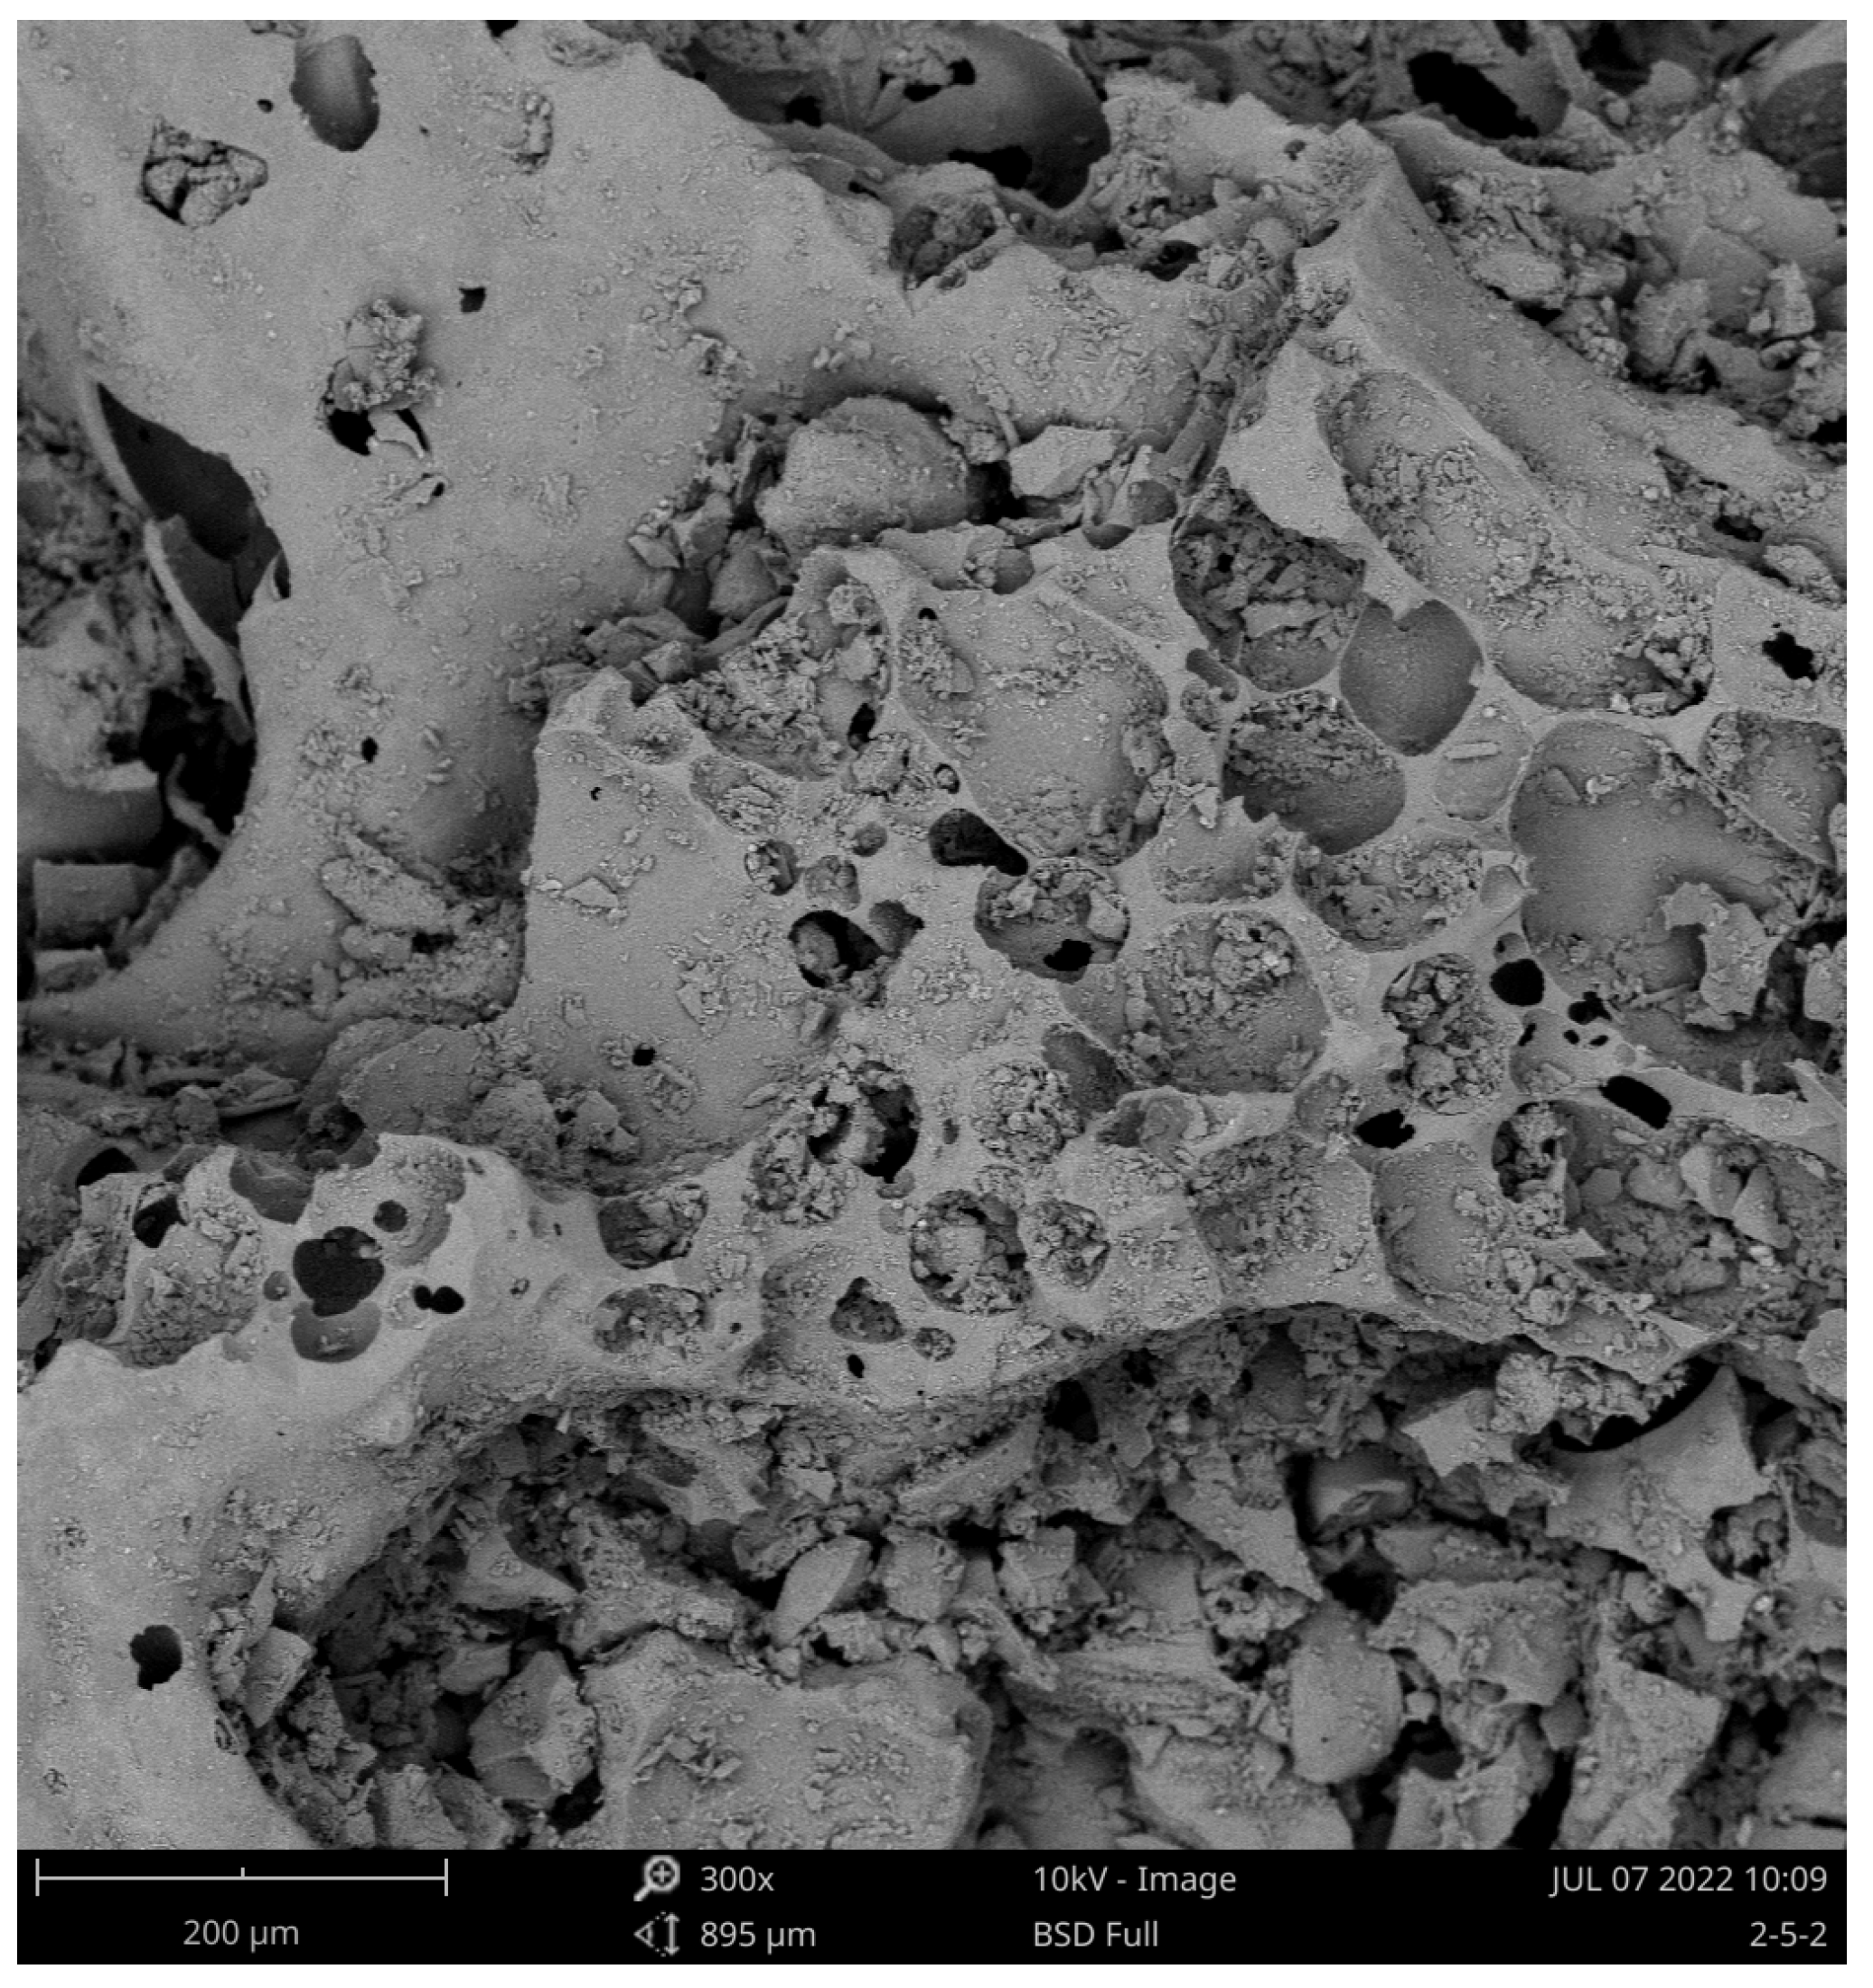
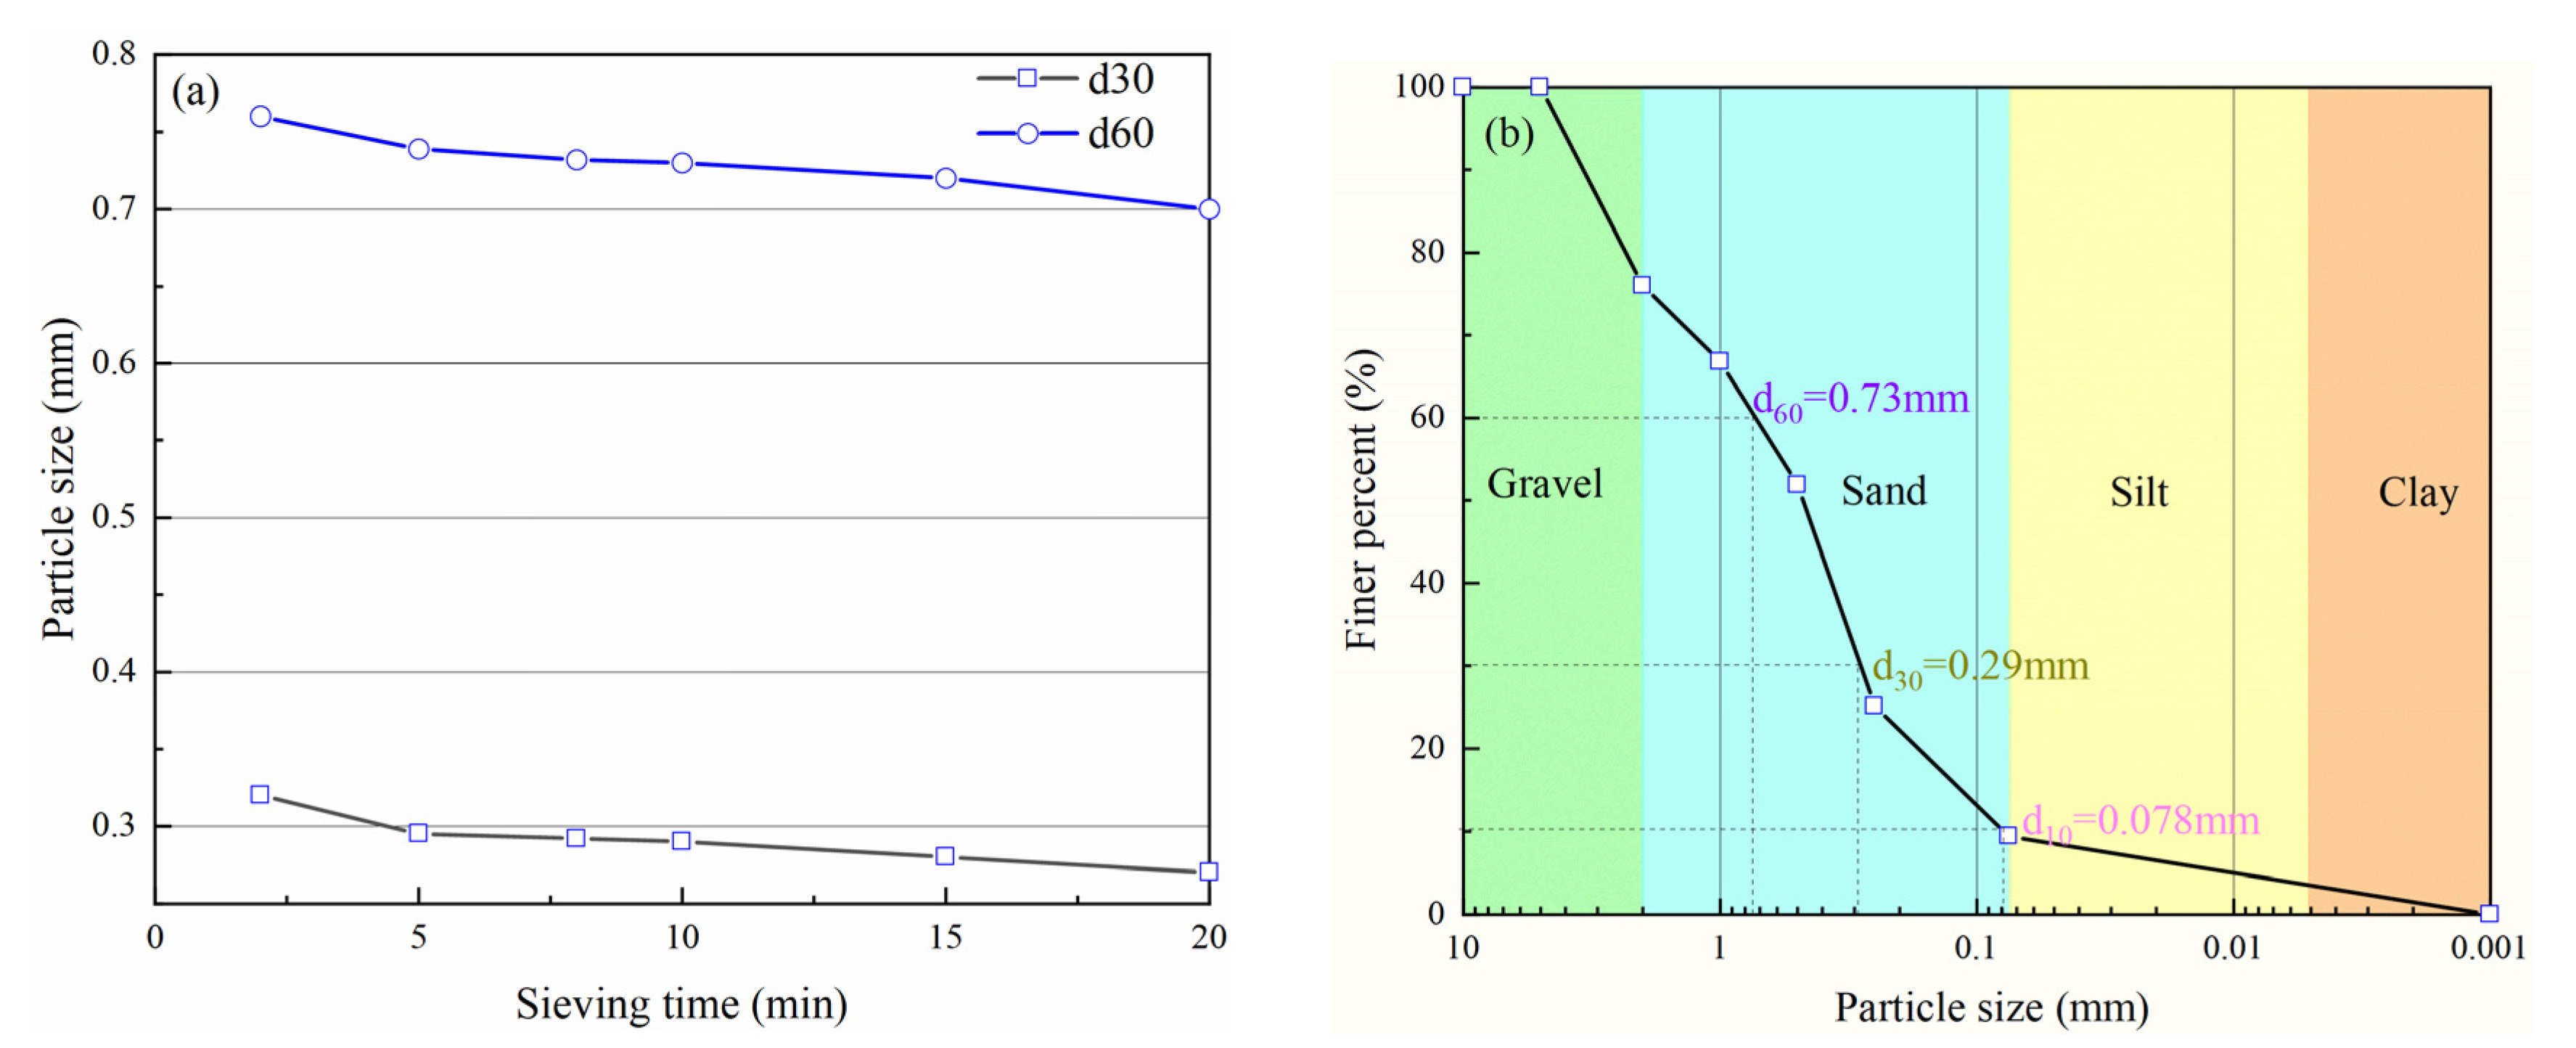
2.1. Material

The soil sample material was taken from Erdao Baihe District, Yanbian Korean Autonomous Prefecture, Jilin Province, China (Figure 1a). Thick layers of volcanic soil were formed at this site due to the eruptive action of Changbai Mountain; the sampling site was located at a slope formed by artificial excavation (Figure 1b). There are numerous small pores distributed inside the volcanic soil particles (Figure 2), hence this material is susceptible to crushing under external forces, distinguishing it from ordinary materials [27].
The mineralogical and chemical composition of volcanic soil were analyzed by X-ray diffraction (XRD) and X-ray fluorescence (XRF). (JASSO TTR III Multifunctional X-ray Diffractometer was adopted for the XRD test. The K-value method was used to calculate mineral content. M4 Tornado X-Ray Fluorescence Spectrometer was used for the XRF test. For more test details, please see the literature [28]). Table 1 shows the mineralogical composition of volcanic soil consisting mainly of quartz, feldspar (potassium feldspar and plagioclase), and hematite with little clay minerals. The chemical composition is dominated by SiO2.

2.2. Test Scheme

Due to the irregular shape and fragility of volcanic soil particles, the soil particle crushing degree increases with the increase of sieving time. This will affect the accuracy of the result of particle size distribution curves. To overcome the effect, a suitable sieving time needs to be determined. Figure 3a shows that with an increase in sieving time, control particle size d30, d60 gradually decrease, when the sieving time is within 8–10 min, control particle size change is not significant so sieving time is determined as 10 min. Figure 3b is the original curve in sieving 10 min. According to Hardin’s theory [11], it is difficult for a soil particle size < 0.074 mm to crush. Considering particle size groups engineering classification, four particle size groups were selected from original grading curves, which all belong to the category of coarse-grained soils [29]. The schematic diagram of the four particle sizes group is shown in Figure 4. The physical properties of volcanic soil were determined according to the Standard for Geotechnical Testing Method (2019) [30]. Combined with Figure 4 and Table 2, it can be found that for the 2–5 mm particle size group and 0.5–2 mm particle size group, particle shape is irregular and the maximum void ratio is relatively large with holes visible to the naked eye.
As volcanic soil has favorable permeability properties due to its porous nature [31], water can be discharged quickly under load, therefore consolidation and drainage test conditions are realistic. Considering that general road engineering load values are not large, effective confining pressures were set as 100 kPa, 200 kPa, and 400 kPa, and three defined in engineering relative densities (loose (0.3), medium-dense (0.5), and dense (0.7)) were selected in this paper to carry out consolidation drainage shear (CD) experiments, the test protocol is shown in Table 3.

2.3. Triaxial Experiment Procedure

The tested soil samples were 50 mm in diameter and 100 mm in height. A 0.5 mm thick rubber film was chosen to avoid particles from penetrating the rubber film. The soil was divided into five parts, and it was carefully dropped into rubber film embraced using a spoon. To avoid massive particle crushing during the sample loading stage, a sample maker was used to gently compress the sample surface to the preset height. Then, the sample was saturated by combining the water head and the backpressure saturation method. In the water head saturation stage, the sample was saturated for 2.0 h, and a back pressure of 400 kPa was applied to the sample in the backpressure saturation stage; when B-value > 0.95, the saturation stage finished and the sample was consolidated under the specified effective confining pressure; when the change of consolidation volume did not exceed 0.05 cm3/5 min, the stage was completed. Finally, triaxial shear tests were performed under drained conditions at a shear rate of 0.042 mm/min until the axial strain reached 30%. When the shearing stage was completed, the specimen was washed into the drying plate from the rubber membrane using the water washing method, followed by a drying and sieving test. (For 0.25–0.5 mm and 0.075–0.25 mm particle size groups, the gradation curve results after the test are not shown in the gradation curve evolution section. The main reason is that some of the particles adhered to the drying plate, these sticking particles suffered a non-negligible crushing amount when removed, which was not caused by pure mechanical behavior (triaxial test), thus interfering with the test results).

3. Triaxial Consolidation and Drainage Test Results

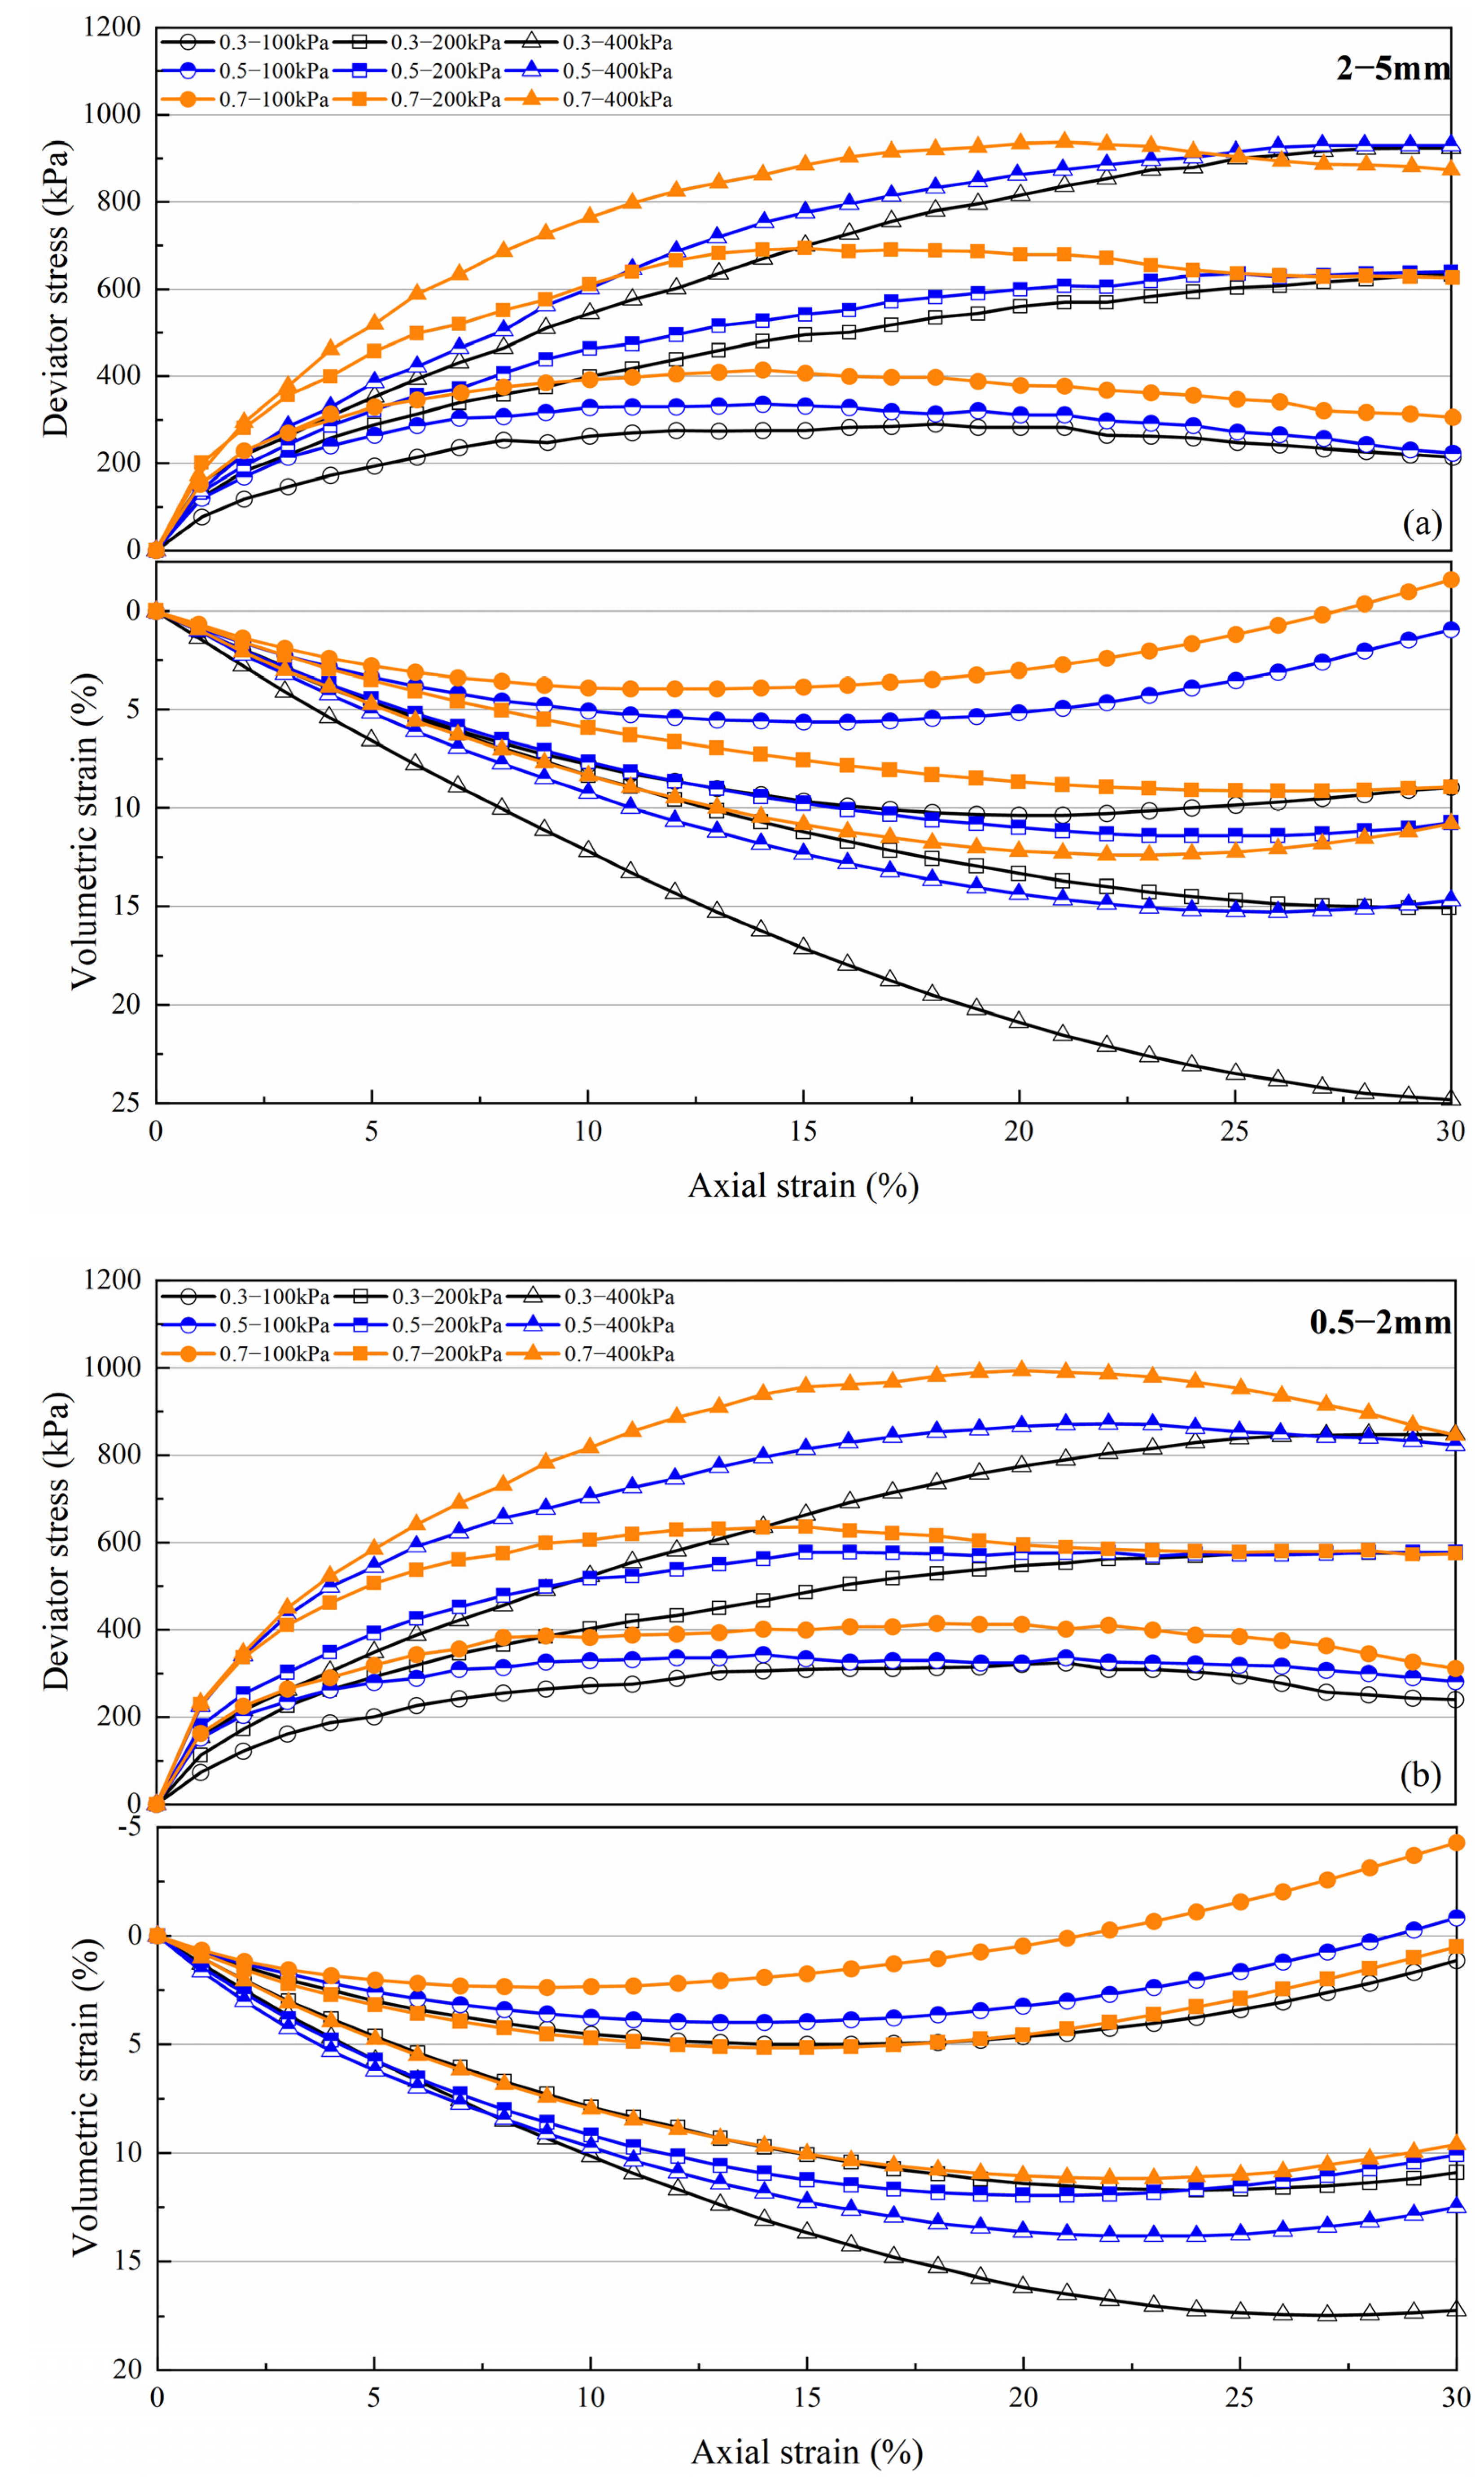
3.1. Stress–Volume Strain–Axial Strain Characteristics

Figure 5 shows deviator stress–axial strain–volumetric strain curves of volcanic soil with four particle size groups. Under 100 kPa confining pressure, stress–strain curves of the four particle sizes at different relative densities show a strain-softening type. For the 2–5 mm particle size group, loose samples show an initially compressive behavior, followed by an expansive behavior at low confining pressure and a purely compressive behavior at high confining pressure (400 kPa), while for the 0.075–0.25 mm particle size group, there is no pure compression behavior. For a certain particle size group, at a given confining pressure, increasing Dr remarkably increases the shear strength and the expansion trends, in addition, increasing confining pressure would postpone the arrival of the peak shear strength [21]. For the same particle size group, under a certain confining pressure, soil residual strengths are the same with different relative densities.
Under 30% terminating axial strain condition, four particle size groups have reached the stress critical state. For the small size group, 0.075–0.25 mm and 0.25–0.5 mm, the critical state appears to correspond to approximately 20% axial strain, while for the large size group, 0.5–2 mm and 2–5 mm, the stress critical state appears after 25% axial strain. This indicates that larger particles require greater axial shear strain to achieve stress stability.
Figure 6 shows the maximum volumetric contraction strain of four particle size groups after triaxial shear testing. The maximum volumetric contraction strain of all specimens increased with increasing confining pressure, particle size, and decreasing relative density varied from 1% to 25%; under the same relative density and confining pressure conditions, as particle size increases, the void ratio also increases, and particles are more likely to move and crush during shearing, producing greater compressibility [32]. Hence, in road engineering, the selection of smaller grain size volcanic soil as road foundation fill can significantly reduce the settlement deformation of the foundation.

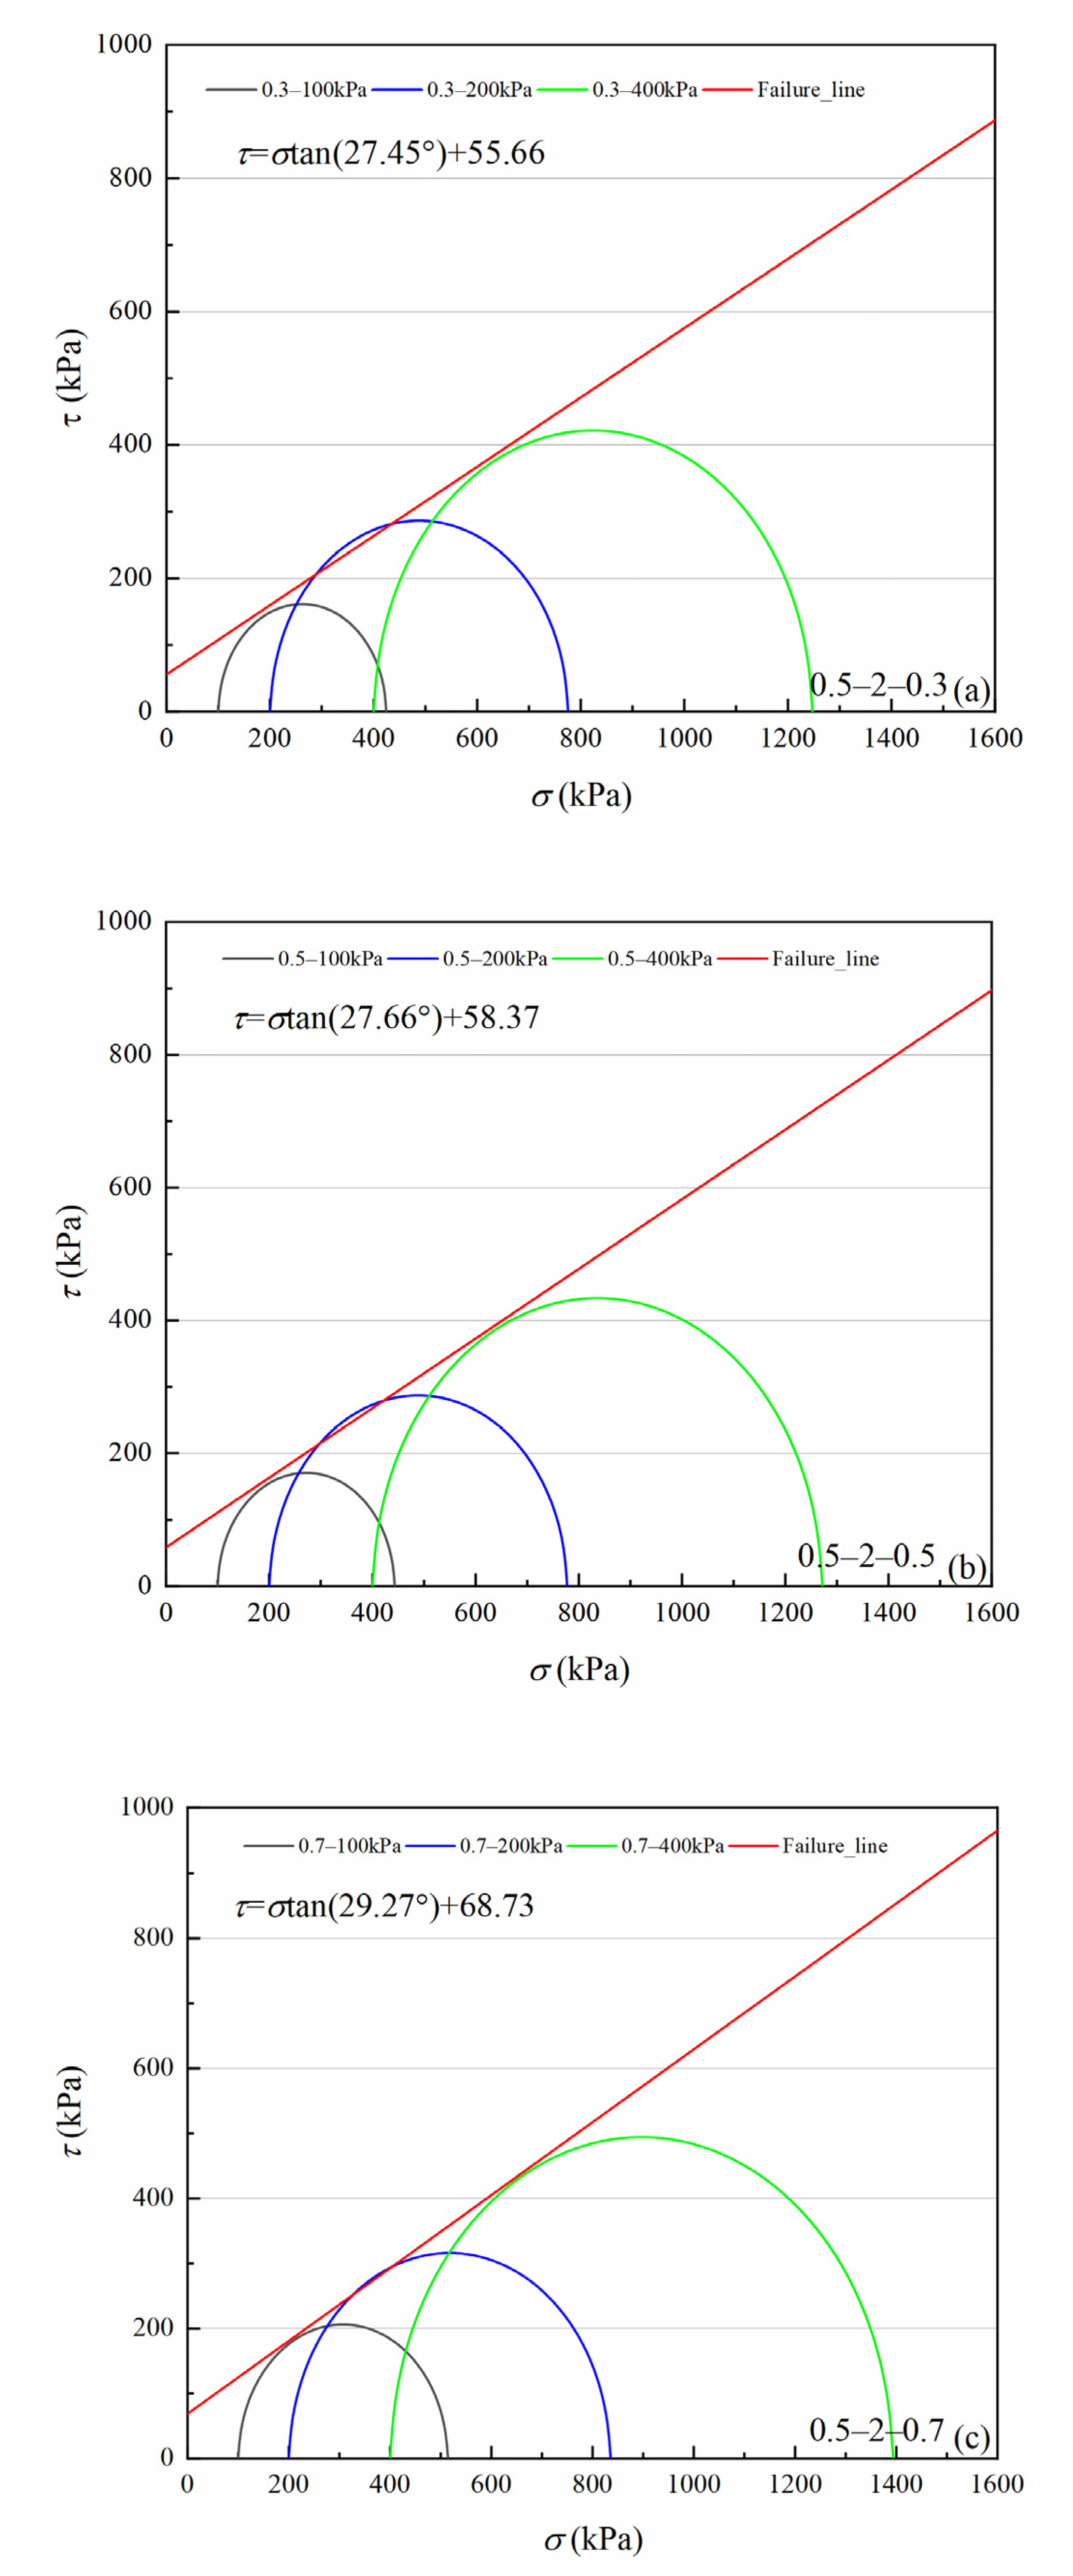
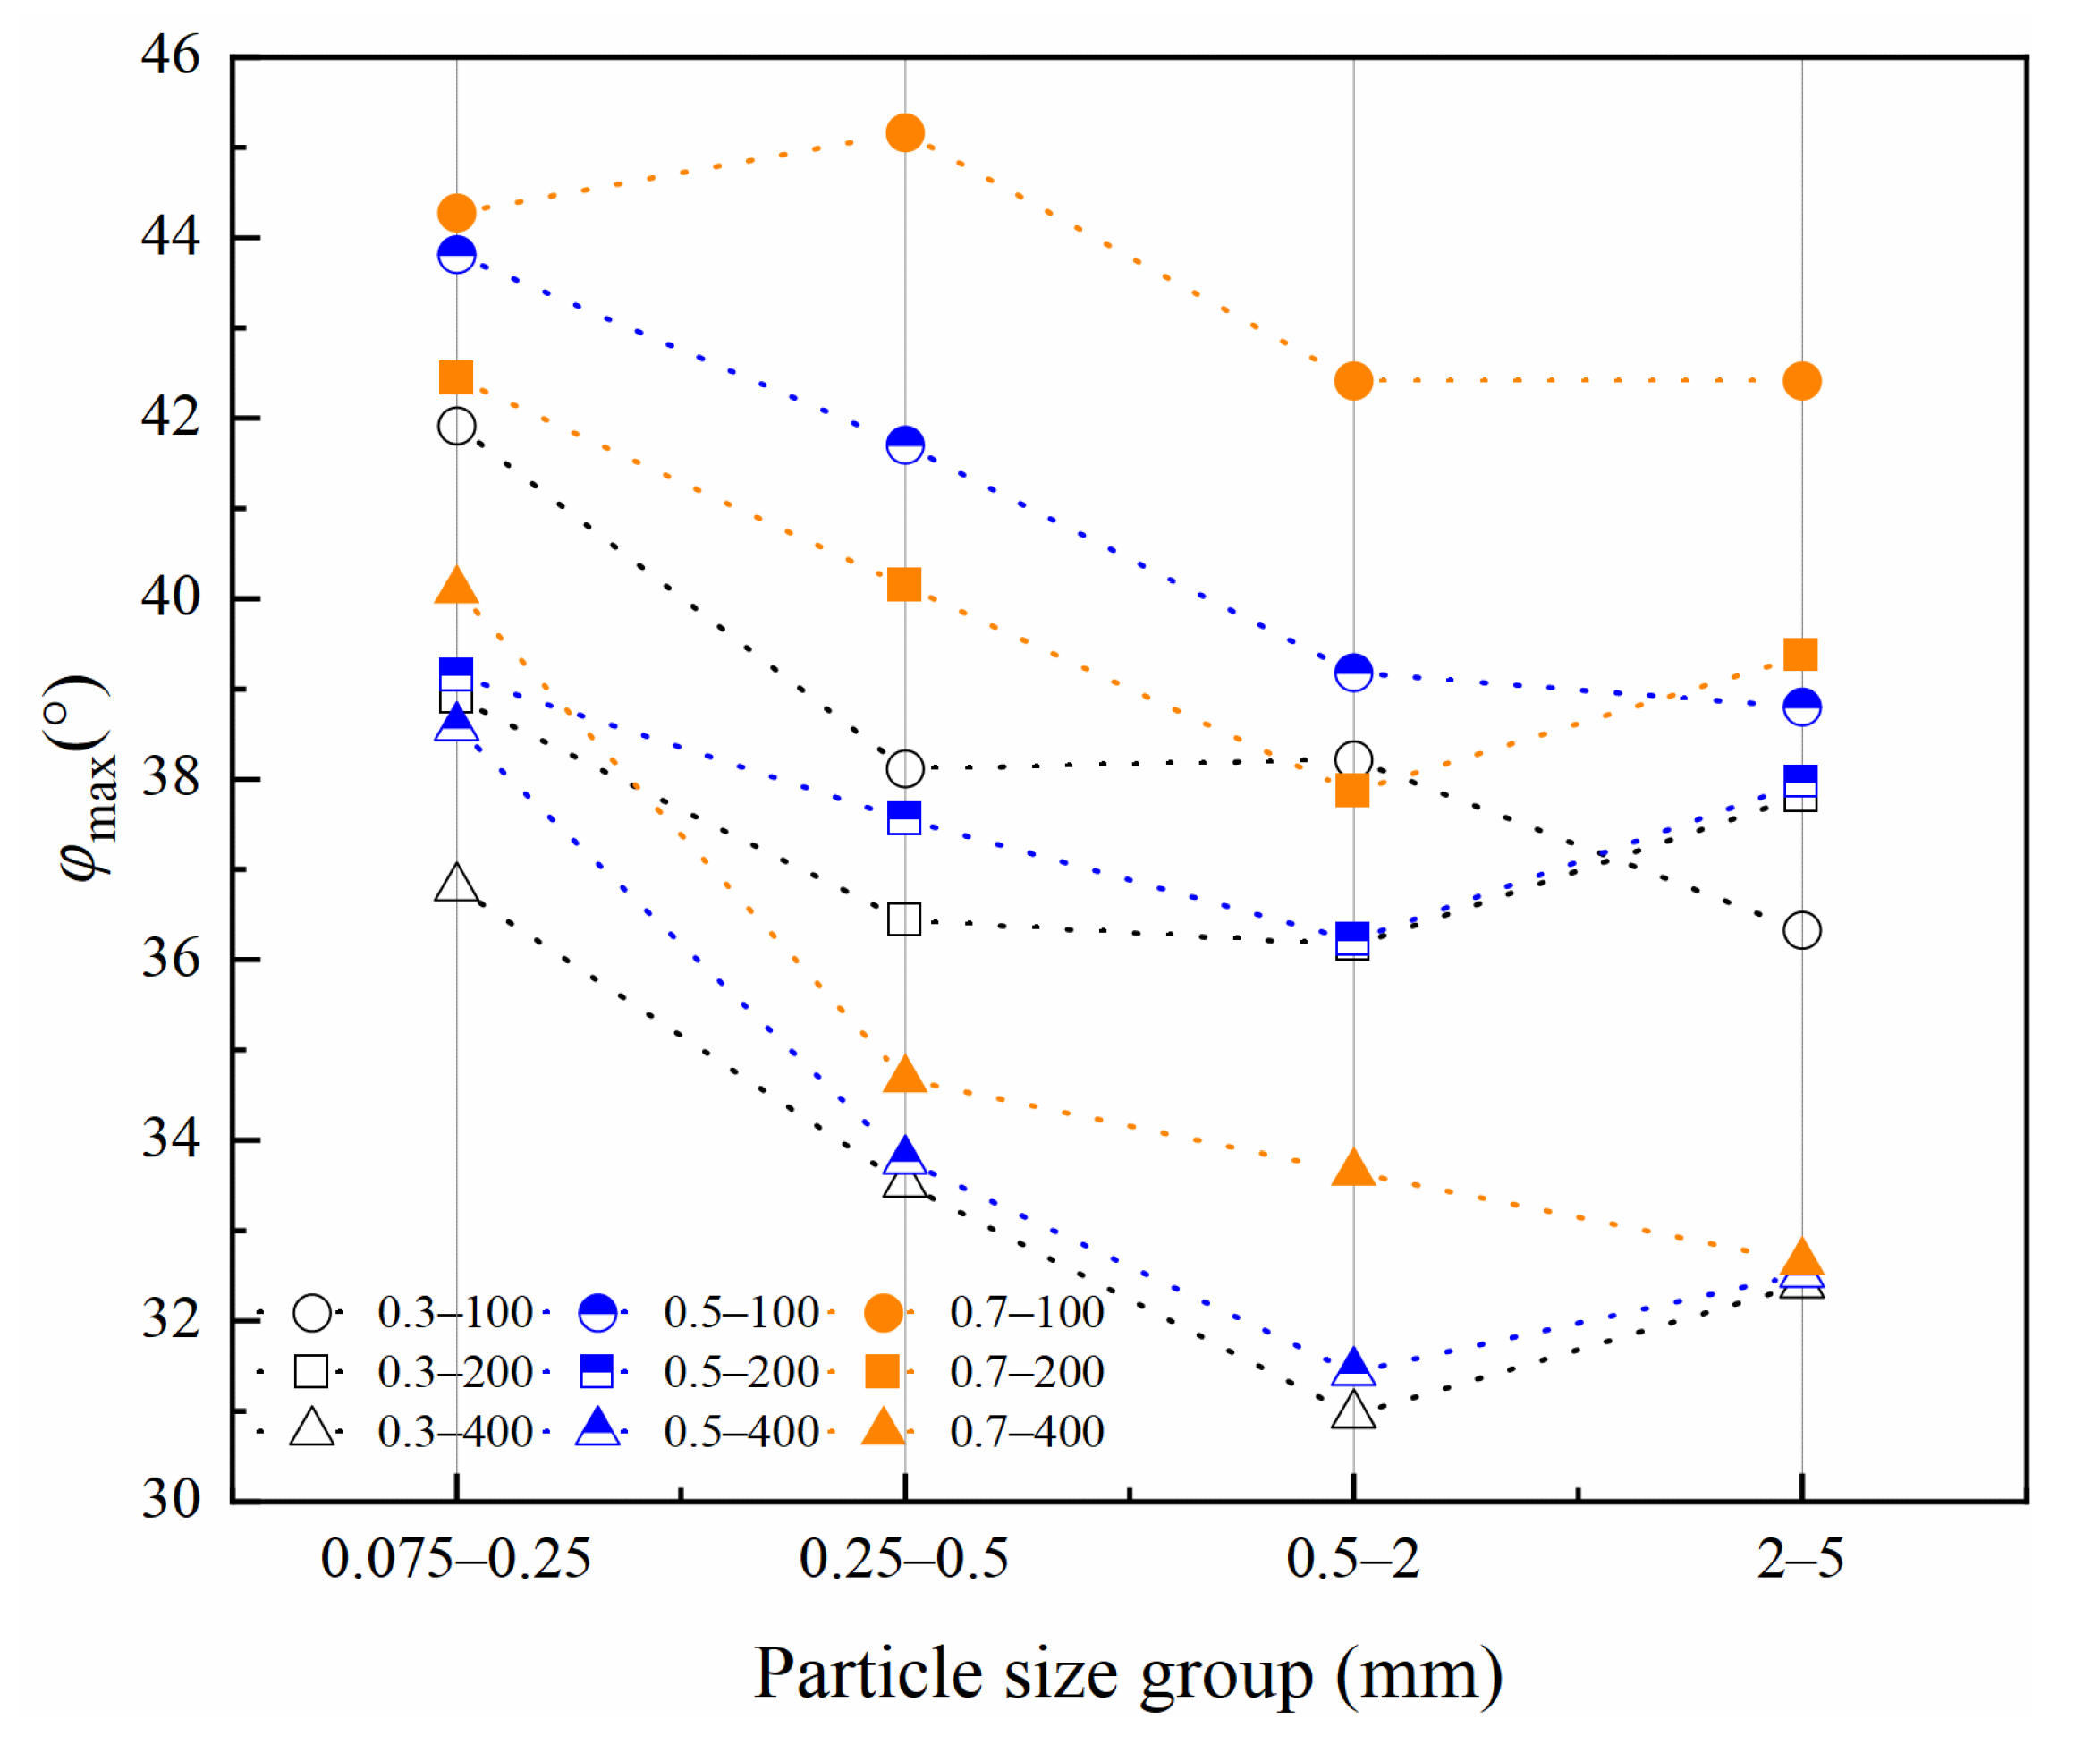
3.2. Peak Strength Index

Figure 7, Figure 8, Figure 9 and Figure 10 show four volcanic soil particle size groups shear strength envelopes with different relative densities (Dr) under peak state. Although these four particle sizes belong to the coarse particle size group in the particle size category, the fitted values reveal that there is still a non-negligible cohesion, approximately 30.62–94.64 kPa, which may be attributed to the occlusion effect caused by the irregular shape of coarse particles, according to previous studies on similar materials, e.g., calcareous sands [32,33]. For the >0.25 mm particle sizes group, as for the same particle size group, cohesion increases significantly with increases in relative density. For 0.5–2 mm and 0.075–0.25 mm particle groups, the internal friction angle slowly increases with increases in relative density. With an increase in relative density, the internal friction angle tends to decrease for 2–5 mm and 0.25–0.5 mm particle size groups.
According to classical Mohr–Coulomb theory, the shear strength index is only related to the material composition and the initial density of specimens, not to the load stress level [34]. If Mohr–Coulomb fitted values are used, the internal friction angle and cohesion are artificially separated from the engineering perspective. The occlusion effect is also a part of the friction component in coarse-grained soils [29,35]. Volcanic soils can be crushed at low load stress levels. As confining pressure increases, particle crushing degree increases to suppress shear dilation behavior between particles, which leads to a decrease in the internal friction angle [36]. Therefore, it is necessary to consider the internal friction angle decreasing effect as confining pressure increases for crushable volcanic soils. For coarse-grained soils, the peak friction angle ( φ m a x ) is calculated as Equation (1) [29].
φ m a x = s i n 1 ( σ 1 σ 3 ) m a x ( σ 1 + σ 3 ) m a x  
Figure 11 shows the peak internal friction angle of volcanic soil. Under the same relative density and particle size condition, peak friction angle decreases significantly with an increase in confining pressure. Under low confining pressure, the particle crushing degree is slight, and the shear dilation effect between the particles increases occlusion friction, causing a higher peak internal friction angle. With an increase of confining pressure, deviator stress increases, which causes particle crushing degree increases; particle crushing effect partially eliminates shear dilation effect, shear dilation gradually disappears, the occlusion effect is gradually eliminated, and the friction effect between particles is gradually reduced [36]. The results reveal that the peak friction angle decreases as particle size increases and relative density decreases. Therefore, in engineering construction, the greater the relative density and the higher the content of fine particles in road foundation fill, the better its bearing capacity.

3.3. Critical State Line

According to the results in Section 3.1, four grain size volcanic soils reached critical conditions at 30% axial strain. Figure 12 shows critical state lines of volcanic soil with four different particle size groups. Critical state stress ratios of different particle size groups are significantly different. The critical state stress ratio is the largest for the 2–5 mm particle size group and the smallest for the 0.075–0.25 mm particle size group.

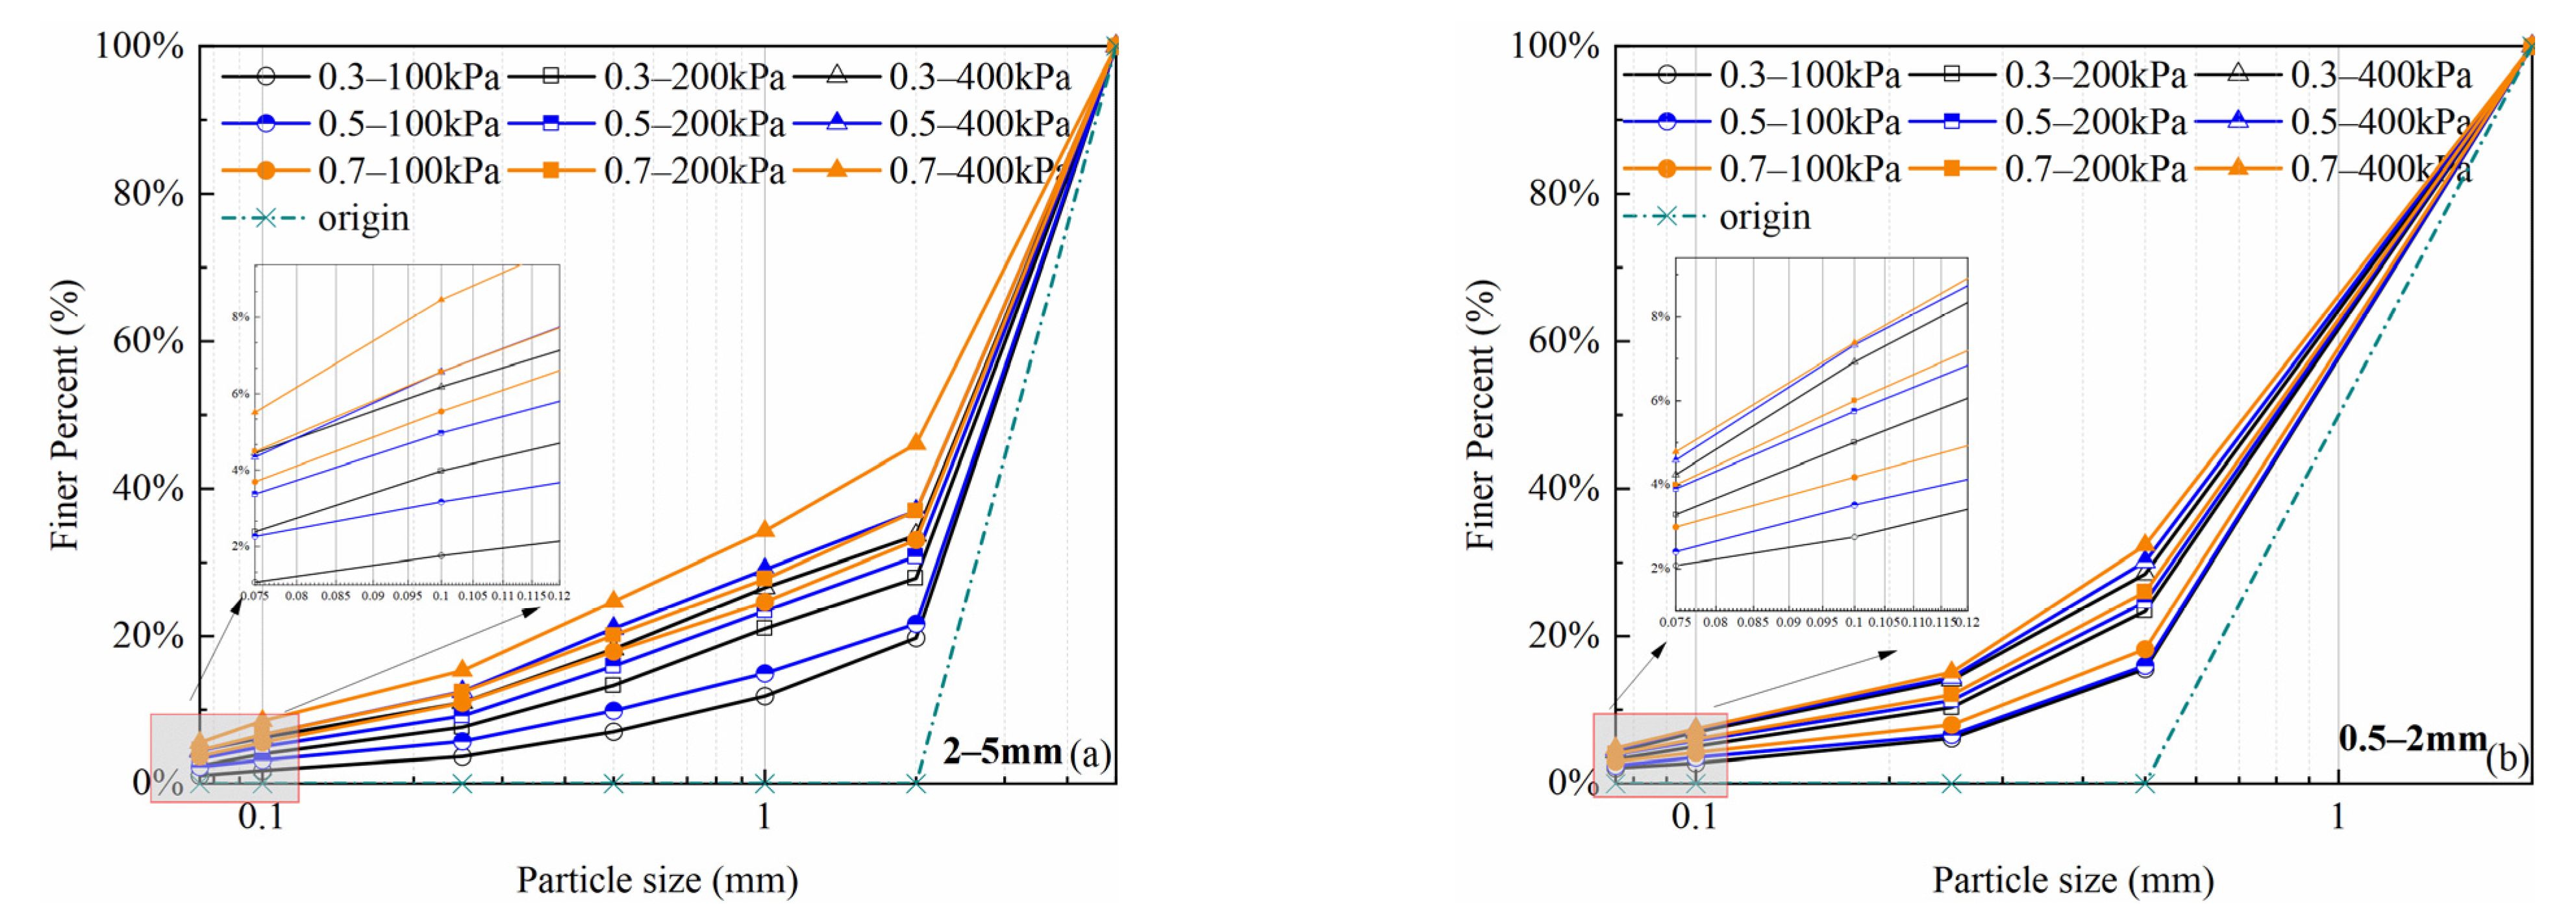
4. Gradation Curve Evolution

After shearing tests, the gradation curves of both particle size groups significantly shifted upward with an increase in relative density and confining pressure (Figure 13). At 100 kPa confining pressure condition, specimen gradation curves have changed significantly, which indicates that volcanic soils have generated large crushing amounts at low confining pressures [9]. For a certain particle size group, the gradation curve shifts upward continuously with increasing relative density (Dr) and confining pressure(σ3). Under the same conditions, the denser specimen shows a greater crushing amount. A dense specimen will contain an increased number of grains and therefore have a larger grain coordination number. Conversely, a larger grain coordination number will enhance the interactions between the grains and the surrounding grains and increase the probability of grain crushing [37]. For different particle size groups, the crushing degree of the 2–5 mm particle size group is greater under the same confining pressure and relative density. Larger particles are more vulnerable to crushing because they contain more internal flaws and the surface shapes are more irregular. Overall, the particle crushing degree of volcanic soil is influenced by confining pressure, relative density, and particle size.

4.1. Crushing Degree Measurement

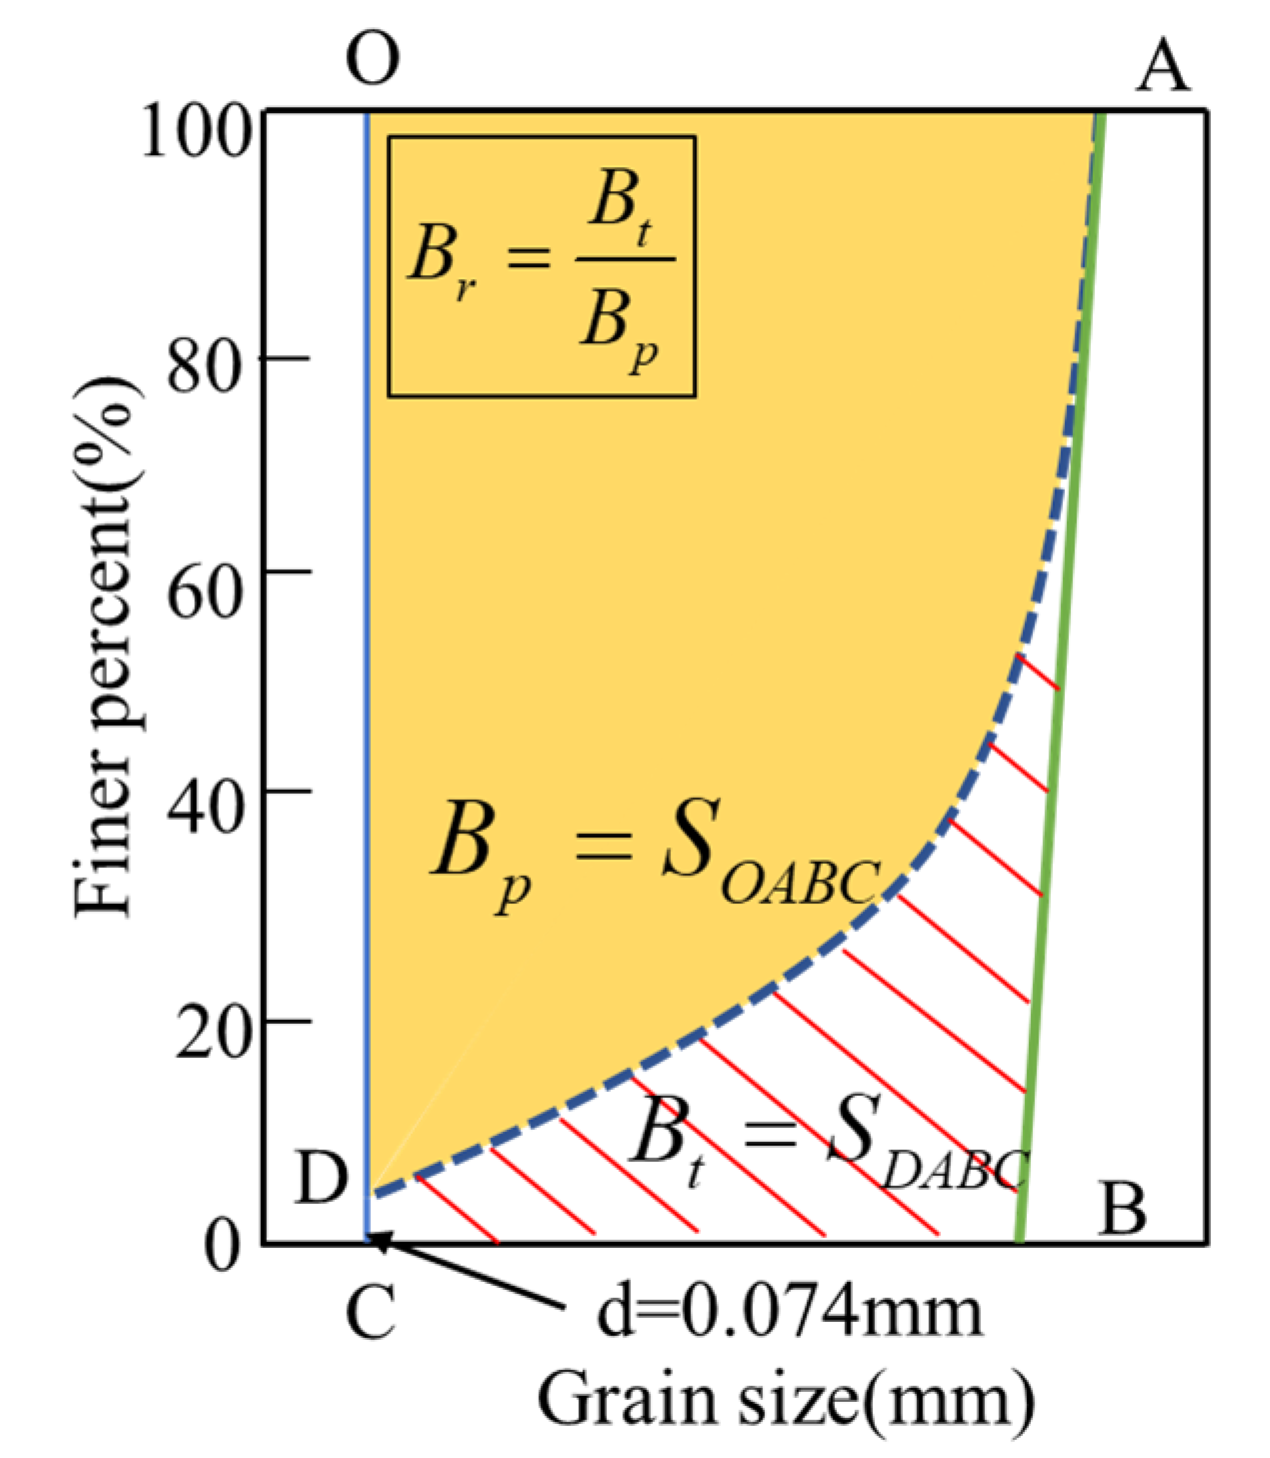
4.1.1. Relative Breakage Rate Br

The relative breakage rate Br proposed by Hardin [11] is broadly used to evaluate the particle crushing degree in the soil mass. The definition of Br calculated is shown in Figure 14. Where Bp is defined as the area enclosed inside the initial grading curve (AB line) and the line of 0.074 mm particle size (OC line); Bt is defined as the area enclosed inside the current grading (AD line), initial grading (AB line), and the 0.074 mm particle size line (CD line).
For both particle size groups, Br increases with increasing confining pressure and relative density (Table 4, 2nd column), and the maximum Br reached 0.382. There is a positive correlation between Br and confining pressure (Figure 15), and the 2–5 mm particle size group has a greater relative breakage rate under the same conditions.

4.1.2. Fractal Dimension D

Previous studies on soil particle crushing indicated that the mass distribution of crushed particles showed fractal characteristics [32,38,39,40]. The mass of particles with different sizes meets the relationship given in Equation (2).
M ( d < d i ) M t = ( d i d m a x ) 3 D  
where d is particle diameter, di is ith sieving diameter (i = 1, 2, …, n); dmax is the diameter of the largest particle, M (d < di) is the cumulative mass of soil particles with particle size less than di; Mt is the total mass of soil particles. D = 3 − k, where D is fractal dimension, k is the slope of the relationship curve between M(d < di)/Mt and di/dmax in the logarithmic coordinate system.
Before tests, these two particle size groups (0.5–2 mm, 2–5 mm) do not show fractal characteristics; after shear tests, all specimens exhibit obvious fractal characteristics, (Table 4, 3th column). Fractal dimension D increases with an increase of confining pressure σ3 and relative density Dr, and the fractal dimension shows a positive correlation with relative density (Figure 16). Under the same conditions, the 2–5 mm particle size group has a larger fractal dimension. This is because the initial particle size of that is larger, and particle crushing produces a wider particle size distribution, which makes fractal characteristics more obvious [32].

4.1.3. Associations between Br and D

Figure 17 shows the variation of fractal dimension D with relative breakage rate Br; there is a good linear relationship between them, and the relationship between D and Br is not affected by relative density and confining pressure only by particle size. The 2–5 mm particle size group has a larger fractal dimension compared with the 0.5–2 mm particle group under the same Br.

4.2. Particle Crushing Pattern

Soil particle crushing patterns are generally classified into three patterns: abrasion, breakoff, and splitting [41]. Dong et al. [42] proposed and experimentally verified a probability density function that can describe a single particle size group crushing pattern based on a large number of point load experiments. The Hill probability density function f is expressed as follows:
f = a b b ( x i 1 x i ) b x i x i 1 ( x i 1 x i ) b + a b 2  
where x i = d i / d m a x , di is crushed sub-particle size, and dmax is the maximum particle size of the original particle group. The fitting parameters are a and b. Parameter a controls the particle size ratio that is most likely to appear after particle crushing, and parameter b controls the curve shape. According to the parameters of a, b, three crushing patterns can be determined. In this paper, values a range from 0.68 to 3.173, and values b range from 0.64 to 1 (Table 4, 5th, 6th column).
Figure 18 shows the variation of Hill probability density function f in two particle size groups: for any one of the specimens, as xi increases, the probability density function f presents that extreme values appear at both ends (xi near 0 or 1) of the curve, and one end is higher than the other; according to Dong’s result [42], the curve types of these two particle size groups can be defined as breakoff type, which is in good agreement with the test photographs (Figure 19). For the same particle size groups, when xi is near zero, the probability density function f shifts upward as confining pressure increases under the same relative density condition. However, there is no obvious rule for the probability density function f at different relative densities under the same confining pressure, which indicates that the Hill probability density function may not be sensitive to the change in the relative density.

5. Plastic Work Analysis

Since grain crushing is a process in which grains consume external work and result in energy loss, the evolution laws of volcanic soil grain crushing during the test can be studied in terms of plastic work (Wp) [37,43]. Wp is defined as the irrecoverable energy extracted by the sample during the test, and it is equal to the sum of plastic work done by shear stress (W1) and the plastic work done by mean effective stress (W2). Given that crushable coarse-grained soils undergo only slight elastic deformation during the test, dεd and dεv could be directly adopted to determine the Wp [44].
W p = W 1 + W 2 = q d ε d p + p d ε v p q d ε d + p d ε v  
The results of plastic work for these two particle sizes group are shown in Table 4 (8th column); for the same particle size group, plastic work increases with the increase of confining pressure and relative density. For different particle size groups, the 2–5 mm particle size group needs to consume more plastic work, whereas the difference is not large. Under the same confining pressure and relative density conditions, for example, plastic work consumed by 2–5 and 0.3–100 kPa specimens and 0.5–2 to 0.3–100 kPa specimens are basically the same, but the difference between their relative breakage rate Br was larger, which indicates that the 0.5–2 mm particle group needs more plastic work than the 2–5 m particle group to reach the same relative breakage rate Br. The main reason is that the shape of the 2–5 mm particle group is more irregular, with larger internal flaws compared to the 0.5–2 mm particle group (Figure 4), which leads to a greater susceptibility to crushing for the same external load work conditions, causing a greater relative breakage rate. The relationship between the plastic work (Wp) and the relative breakage rate (Br) for these two particle sizes groups follows the power function (Figure 20a,b), which can be fitted using Equation (5), with A, B as the fitting parameters. For the same particle size groups, the relationship between plastic work and the relative breakage rate is not significantly influenced by the relative density and the confining pressure. Scholars’ studies on calcareous sands also confirm this conclusion [37], however, in their research,   B r = 1.17 × 10 5 W p 1.42 . By comparing the equations in this study with theirs, it can be found that the amount of crushing is greater under the same plastic work in this study, which is mainly because the main minerals strength of calcareous sand are stronger compared to volcanic soil particles, therefore, calcareous sand particles are less likely to crush under the external force, which also shows that the mineral composition has a great influence on particle breakage.
B r = A W p B

6. Conclusions

A series of consolidation drainage shear tests were carried out to investigate the effects of particle size, confining pressure, and relative density on the mechanical properties and crushing characteristics of volcanic soils. The characteristics of soil stress–strain curve, shear strength index, critical state behavior, and quantification of particle fragmentation characteristics, using fractal dimension and relative breakage rate were systematically investigated. Finally, the quantitative relationship between external work and fragmentation amount was established through the energy perspective. The main findings are as follows:
Stress–strain curves characteristic of volcanic soil were affected by particle size; the large particle size groups (>0.5 mm) required larger axial strain to reach a stress steady state. The critical stress ratio was significantly influenced by particle size, with the largest critical stress ratio for the 2–5 mm particle size group and the smallest critical stress ratio for the 0.075–0.25 mm particle size group.
For crushable volcanic soils, there was a clear physical significance in using the peak internal friction angle index when considering the confining pressure effect; peak friction angle decreased significantly with the increase of confining pressure, and peak friction angle decreased as particle size increased and relative density decreased.
The particle crushing amount increased with increasing particle size, relative density, and confining pressure. For the same particle size, there was a good linear relationship between Br and D. Crushing patterns of large particle size groups could be classified as breakoff type. From an energy perspective, the power function relationship between Wp and Br of large particle size group was established, the relationship was only affected by particle size, and it was not significantly affected by the relative density and effective confining pressure. The results of comparison with similar materials [37] also confirm that the mineral composition has a large influence on the particle crushing amount.
In terms of engineering, based on the results of this study, it can be concluded that volcanic soil with fine particles used as roadbed filler can significantly reduce the deformation of the roadbed and improve the bearing capacity of the foundation, in addition to increasing the compaction degree of volcanic soil.

Author Contributions

Conceptualization, X.-Y.L.; methodology, X.-Y.L.; writing—original draft preparation, X.-Y.L.; investigation, H.-L.L. and D.W.; data curation, X.-Y.L., H.-L.L. and D.W.; writing—review and editing, C.-M.W., H.-L.L. and D.W.; project administration, C.-M.W.; funding acquisition, C.-M.W. All authors have read and agreed to the published version of the manuscript.

Funding

This research was funded by National Natural Science Foundation of China (Grant Nos. 41972267).

Institutional Review Board Statement

Not applicable.

Informed Consent Statement

Not applicable.

Data Availability Statement

Data is contained within the article.

Conflicts of Interest

The authors declare no conflict of interest.

Abbreviations

GsSpecific gravity
ρdminMinimum dry density (Unit: g/cm3)
ρdmaxMaximum dry density (Unit: g/cm3)
eminMinimum void ratio
emaxMaximum void ratio
dParticle size (mm)
d30The mass of soil particles smaller than this particle size is 30% of the total mass of soil particles (mm)
d60The mass of soil particles smaller than this particle size is 60% of the total mass of soil particles (mm)
DrRelative density
σ3Confining pressure (Unit: kPa)
σNormal stress (Unit: kPa)
τShear stress (Unit: kPa)
cSoil cohesion (Unit: kPa)
φSoil internal friction angle (°)
DFractal dimension
BrRelative breakage rate
R2Coefficient of correlation
fProbability density function
WpPlastic work (Unit: kPa)
W1Plastic work done by shear stress (Unit: kPa)
W2Plastic work done by mean effective stress (Unit: kPa)
qDeviator stress (Unit: kPa)
pMean effective stress (Unit: kPa)
d ε d p Plastic shear strain increment
d ε v p Plastic volumetric strain increment
d ε d Shear strain increment
d ε v Volumetric strain increment
aFitting parameter
bFitting parameter
AFitting parameter
BFitting parameter

References

  1. Luo, Q.; Liang, D.; Wang, T.; Zhang, L.; Jiang, L. Engineering properties testing of scoria as railway subgrade fill. J. Zhejiang Univ. 2020, 54, 2395–2404. [Google Scholar] [CrossRef]
  2. Navia, R.; Rivela, B.; Lorber, K.E.; Mendez, R. Recycling contaminated soil as alternative raw material in cement facilities: Life cycle assessment. Resour. Conserv. Recycl. 2006, 48, 339–356. [Google Scholar] [CrossRef]
  3. Babel, S.; Opiso, E.M. Removal of Cr from synthetic wastewater by sorption into volcanic ash soil. Int. J. Environ. Sci. Technol. 2007, 4, 99–107. [Google Scholar] [CrossRef] [Green Version]
  4. Jalil, A.A.; Triwahyono, S.; Adam, S.H.; Rahim, N.D.; Aziz, M.A.A.; Hairom, N.H.H.; Razali, N.A.M.; Abidin, M.A.Z.; Mohamadiah, M.K.A. Adsorption of methyl orange from aqueous solution onto calcined Lapindo volcanic mud. J. Hazard. Mater. 2010, 181, 755–762. [Google Scholar] [CrossRef] [Green Version]
  5. Ji, M.; Su, X.; Zhao, Y.; Qi, W.; Wang, Y.; Chen, G.; Zhang, Z. Effective adsorption of Cr(VI) on mesoporous Fe-functionalized Akadama clay: Optimization, selectivity, and mechanism. Appl. Surf. Sci. 2015, 344, 128–136. [Google Scholar] [CrossRef]
  6. Lemougna, P.N.; Wang, K.T.; Tang, Q.; Nzeukou, A.N.; Billong, N.; Melo, U.C.; Cui, X.M. Review on the use of volcanic ashes for engineering applications. Resour. Conserv. Recycl. 2018, 137, 177–190. [Google Scholar] [CrossRef]
  7. Silva-Yumi, J.; Escudey, M.; Gacitua, M.; Pizarro, C. Kinetics, adsorption and desorption of Cd(II) and Cu(II) on natural allophane: Effect of iron oxide coating. Geoderma 2018, 319, 70–79. [Google Scholar] [CrossRef]
  8. Asadi, M.S.; Orense, R.P.; Asadi, M.B.; Pender, M.J. Maximum dry density test to quantify pumice content in natural soils. Soils Found. 2019, 59, 532–543. [Google Scholar] [CrossRef]
  9. Agustian, Y.; Goto, S. Strength and deformation characteristics of scoria in triaxial compression at low confining stress. Soils Found. 2008, 48, 27–39. [Google Scholar] [CrossRef] [Green Version]
  10. Ishikawa, T.; Miura, S. Influence of Freeze-Thaw Action on Deformation-Strength Characteristics and Particle Crushability of Volcanic Coarse-Grained Soils. Soils Found. 2011, 51, 785–799. [Google Scholar] [CrossRef] [Green Version]
  11. Hardin, B.O. Crushing of soil particles. J. Geotech. Eng. 1985, 111, 1177–1192. [Google Scholar] [CrossRef]
  12. Yamamuro, J.A.; Bopp, P.A.; Lade, P.V. One-Dimensional Compression of Sands at High Pressures. J. Geotech. Eng. 1996, 122, 147–155. [Google Scholar] [CrossRef]
  13. Varadarajan, A.; Sharma, K.G.; Abbas, S.M.; Dhawan, A.K. Constitutive Model for Rockfill Materials and Determination of Material Constants. Int. J. Geomech. 2006, 6, 226–237. [Google Scholar] [CrossRef]
  14. Karatza, Z.; Ando, E.; Papanicolopulos, S.A.; Viggiani, G.; Ooi, J.Y. Effect of particle morphology and contacts on particle breakage in a granular assembly studied using X-ray tomography. Granul. Matter 2019, 21, 44. [Google Scholar] [CrossRef] [Green Version]
  15. Xiao, Y.; Long, L.; Evans, T.M.; Zhou, H.; Liu, H.; Stuedlein, A.W. Effect of Particle Shape on Stress-Dilatancy Responses of Medium-Dense Sands. J. Geotech. Geoenvironmental Eng. 2019, 145. [Google Scholar] [CrossRef]
  16. Cavarretta, I.; O’Sullivan, C.; Coop, M.R. The relevance of roundness to the crushing strength of granular materials. Geotechnique 2017, 67, 301–312. [Google Scholar] [CrossRef] [Green Version]
  17. Mcdowell, G.R.; Amon, A. The application of weibull statistics to the fracture of soil particles. J. Jpn. Geotech. Soc. 2000, 40, 133–141. [Google Scholar] [CrossRef] [Green Version]
  18. Ovalle, C.; Frossard, E.; Dano, C.; Hu, W.; Maiolino, S.; Hicher, P.Y. The effect of size on the strength of coarse rock aggregates and large rockfill samples through experimental data. Acta Mech. 2014, 225, 2199–2216. [Google Scholar] [CrossRef] [Green Version]
  19. Zhou, W.; Yang, L.; Ma, G.; Chang, X.; Lai, Z.; Xu, K. DEM analysis of the size effects on the behavior of crushable granular materials. Granul. Matter 2016, 18, 64. [Google Scholar] [CrossRef]
  20. Shahnazari, H.; Rezvani, R. Effective parameters for the particle breakage of calcareous sands: An experimental study. Eng. Geol. 2013, 159, 98–105. [Google Scholar] [CrossRef]
  21. Wu, Y.; Li, N.; Wang, X.; Cui, J.; Chen, Y.; Wu, Y.; Yamamoto, H. Experimental investigation on mechanical behavior and particle crushing of calcareous sand retrieved from South China Sea. Eng. Geol. 2021, 280, 105932. [Google Scholar] [CrossRef]
  22. Casini, F.; Viggiani, G.; Springman, S.M. Breakage of an artificial crushable material under loading. Granul. Matter 2013, 15, 661–673. [Google Scholar] [CrossRef] [Green Version]
  23. Jia, Y.; Xu, B.; Chi, S.; Xiang, B.; Xiao, D.; Zhou, Y. Particle breakage of rockfill material during triaxial tests under complex stress paths. Int. J. Geomech. 2019, 19, 04019124. [Google Scholar] [CrossRef]
  24. Kikkawa, N.; Pender, M.J.; Orense, R.P.; StGeorge, J.D.; Matsushita, E. K-0 Compression and Stress Relaxation of Pumice Sand. J. Geotech. Geoenvironmental Eng. 2012, 138, 625–628. [Google Scholar] [CrossRef]
  25. Galvis-Castro, A.C.; Colmenares, J.E.; Garcia-Leal, J.C. Primary and Secondary Compression of a Colombian Volcanic Ash Soil. Geotech. Geol. Eng. 2021, 40, 1485–1497. [Google Scholar] [CrossRef]
  26. Asadi, M.B.; Asadi, M.S.; Orense, R.P.; Pender, M.J. Small-Strain Stiffness of Natural Pumiceous Sand. J. Geotech. Geoenvironmental Eng. 2020, 146, 06020006. [Google Scholar] [CrossRef]
  27. Salman, M.S.; Hasan, M.N.; Kubra, K.T.; Hasan, M.M. Optical detection and recovery of Yb(III) from waste sample using novel sensor ensemble nanomaterials. Microchem. J. 2021, 162, 105868. [Google Scholar] [CrossRef]
  28. Liu, H.L.; Wang, C.M.; Liu, X.Y.; Wu, D.; Yang, H.R.; Zhang, Z.M.; Khan, K.U.J. Deformation characteristics and prediction of unbound volcanic ash pavement based on the mechanistic-empirical design guide. Constr. Build. Mater. 2022, 327, 126975. [Google Scholar] [CrossRef]
  29. Li, G.; Zhang, B.; Yu, Y. Soil Mechanics, 2nd ed.; Tsinghua University Press: Beijing, China, 2013. [Google Scholar]
  30. GB/T50123-2019. Standard for Soil Test Method.; Chinese Ministry of Water Resources: Beijing, China, 2019. (In Chinese)
  31. Rifa’i, A.; Yasufuku, N. Utilization of bantak and merapi volcanic ash for porous paving block as drainage control in the prambanan temple yard. Int. J. Geomate 2017, 12, 141–146. [Google Scholar] [CrossRef]
  32. Wang, X.; Wang, X.; Shen, J.; Zhu, C. Particle size and confining-pressure effects of shear characteristics of coral sand: An experimental study. Bull. Eng. Geol. Environ. 2022, 81, 1–25. [Google Scholar] [CrossRef]
  33. Yan, C.P.; Long, Z.L.; Zhou, Y.C.; Kuang, D.M.; Chen, J.M. Investigation on the effects of confining pressure and particle size of shear characteristics of calcareous sand. Rock Soil Mech. 2020, 41, 581–591. [Google Scholar] [CrossRef]
  34. Zhang, J. Study on the Fundamental Mechanical Characteristics of Calcareous Sand the Influence of Particle Breakage. Ph.D. Thesis, Chinese Academy of Sciences (Wuhan Institute of Geotechnical Mechanics), Wuhan, China, 2004. [Google Scholar]
  35. Lee, K.L.; Farhoomand, I. Compressibility and Crushing of Granular Soil in Anisotropic Triaxial Compression. Can. Geotech. J. 1967, 4, 68–86. [Google Scholar] [CrossRef]
  36. Zhang, J.; Hua, C.; Luo, M.; Zhang, B. Behavior of particle breakage in calcareous sand duing drained triaxial shearing. Chin. J. Geotech. Eng. 2020, 42, 1593–1602. [Google Scholar]
  37. Wang, X.; Liu, J.-Q.; Cui, J.; Wang, X.-Z.; Shen, J.-H.; Zhu, C.-Q. Particle breakage characteristics of a foundation filling material on island-reefs in the South China Sea. Constr. Build. Mater. 2021, 306, 124690. [Google Scholar] [CrossRef]
  38. Altuhafi, F.N.; Coop, M.R. Changes to particle characteristics associated with the compression of sands. Geotechnique 2011, 61, 459–471. [Google Scholar] [CrossRef]
  39. Coop, M.; Sorensen, K.; Bodas Freitas, T.; Georgoutsos, G. Particle breakage during shearing of a carbonate sand. Géotechnique 2004, 54, 157–163. [Google Scholar] [CrossRef]
  40. Yu, F. Particle breakage in triaxial shear of a coral sand. Soils Found. 2018, 58, 866–880. [Google Scholar] [CrossRef]
  41. Bideau, D. Du Sac de Billes au Tas de Sable (From a Bag of Marbles to a Pile of Sand). Powder Technol. 1995, 82, 211. [Google Scholar] [CrossRef]
  42. Dong, Z.; Tong, C.; Zhang, S.; Sheng, D. Study on breakage transition matrix of granular soils. Chin. J. Rock Mech. Eng. 2021, 40, 1504–1512. [Google Scholar] [CrossRef]
  43. Aghajani, H.F.; Salehzadeh, H.; Rezvani, R. Energy Equilibrium during Crushing of Sandy Soils under Isotropic Compression. Arab. J. Sci. Eng. 2016, 41, 1531–1542. [Google Scholar] [CrossRef]
  44. Wu, Y.; Wang, X.; Shen, J.-H.; Cui, J.; Zhu, C.-Q.; Wang, X.-Z. Experimental Study on the Impact of Water Content on the Strength Parameters of Coral Gravelly Sand. J. Mar. Sci. Eng. 2020, 8, 634. [Google Scholar] [CrossRef]
Figure 1. Sampling location map. (a) Location map; (b) Artificial slope.
Materials 15 05423 g001
Figure 2. SEM of volcanic soil particle.
Materials 15 05423 g002
Figure 3. Determination sieving test time and corresponding particle size distribution curve: (a) sieving test time; (b) particle size distribution curve.
Materials 15 05423 g003
Figure 4. Diagram of four particle size of volcanic soil.
Materials 15 05423 g004
Figure 5. Deviator stress–axial strain–volumetric strain curves of volcanic soil with different relative density (Dr) and confining pressure(σ3): (a) 2–5 mm particle group; (b) 0.5–2 mm particle group; (c) 0.25–0.5 mm particle group; (d) 0.075–0.25 mm particle group.
Materials 15 05423 g005aMaterials 15 05423 g005b
Figure 6. Maximum volumetric contraction strain of volcanic soil with different relative density and confining pressure in four particle size groups.
Materials 15 05423 g006
Figure 7. Shear strength envelopes of 2–5 mm particle groups volcanic soil with different relative density (Dr) under the peak state: (a) Dr = 0.3, (b) Dr = 0.5, (c) Dr = 0.7.
Materials 15 05423 g007
Figure 8. Shear strength envelopes of 0.5–2 mm particle groups volcanic soil with different relative density (Dr) under the peak state: (a) Dr = 0.3, (b) Dr = 0.5, (c) Dr = 0.7.
Materials 15 05423 g008
Figure 9. Shear strength envelopes of 0.25–0.5 mm particle groups volcanic soil with different relative density (Dr) under the peak state:(a) Dr = 0.3, (b) Dr = 0.5, (c) Dr = 0.7.
Materials 15 05423 g009
Figure 10. Shear strength envelopes of 0.075–0.25 mm particle groups volcanic soil with different relative density (Dr) under the peak state: (a) Dr = 0.3, (b) Dr = 0.5, (c) Dr = 0.7.
Materials 15 05423 g010
Figure 11. Peak internal friction angle of volcanic soil with different relative density (Dr) and confining pressure(σ3) in four particle size groups.
Materials 15 05423 g011
Figure 12. Critical state lines of volcanic soil with different particle sizes on deviator stress and mean stress plane.
Materials 15 05423 g012
Figure 13. Evolutions of particle size distribution curves of volcanic soil with different relative density (Dr) and confining pressure(σ3): (a) 2–5 mm particle groups; (b) 0.5–2 mm particle groups.
Materials 15 05423 g013
Figure 14. Defining of the relative breakage rate.
Materials 15 05423 g014
Figure 15. Variations in relative breakage rate (Br) with different relative density (Dr) and confining pressure(σ3): (a) 2–5 mm particle groups; (b) 0.5–2 mm particle groups.
Materials 15 05423 g015
Figure 16. Variations in fractal dimension (D) with different relative density (Dr) and confining pressure(σ3): (a) 2–5 mm particle groups; (b) 0.5–2 mm particle groups.
Materials 15 05423 g016
Figure 17. Variations in Fractal dimension (D) with relative breakage rate (Br).
Materials 15 05423 g017
Figure 18. Variation of Hill probability density function f with different relative density (Dr) and confining pressure (σ3): (a) 2–5 mm particle groups; (b) 0.5–2 mm particle groups.
Materials 15 05423 g018
Figure 19. Photos of volcanic soil after shear test: (a) 2–5 mm-0.7–400 kPa test sample; (b) 0.5–2 mm–0.7–400 kPa test sample.
Materials 15 05423 g019
Figure 20. Variations in relative breakage rate with plastic work: (a) 2–5 mm particle groups; (b) 0.5–2 mm particle groups.
Materials 15 05423 g020
Table 1. Proportions of primary minerals and major oxides for samples.
Test itemComponentPercentage (%)Test ItemComponentPercentage (%)
XRD mineral phaseQuartz20.5XRF major elementSiO250.18
Al2O316.95
Potassium feldspar20.6Fe2O310.48
FeO0.77
Plagioclase48.9MgO2.27
CaO4.39
Hematite8.5Na2O4.13
K2O3.87
Clay minerals1.5MnO0.18
P2O51.23
TiO21.75
Loss on ignition3.53
Table 2. Physical parameters of volcanic soil.
Soil Group (mm)Soil NameGsρdmin (g/cm3)ρdmax (g/cm3)emaxemin
2–5Fine gravel2.6150.5971.2773.3801.048
0.5–2Coarse sand0.7291.2622.5871.072
0.25–0.5Medium sand0.8751.3611.9890.921
0.075–0.25Fine sand0.9301.3911.8110.879
Table 3. Triaxial shear test scheme for four particle size group.
Type of TestSoil Group (mm)Dr (Relative Density)Confining
Pressure (kPa)
Total
Number of Samples
CD Test2–50.3 (loose), 0.5 (medium), 0.7 (dense)100, 200, 40036
0.5–2
0.25–0.5
0.075–0.25
Table 4. Table of correlation coefficients and plastic work for large particle size group.
Sieving Test
Sample
BrDR2 (Fractal)abR2 (HILL)Wp (kPa)
2-5-0.3-1000.1511.8980.9583.1730.8120.98878.599
2-5-0.3-2000.2292.1250.9692.2750.6580.982165.014
2-5-0.3-4000.2832.2570.9711.4560.6420.980264.891
2-5-0.5-1000.1742.0570.9293.9020.6560.99089.152
2-5-0.5-2000.2552.1950.9701.6740.6770.978169.370
2-5-0.5-4000.3122.2780.9771.0710.6770.970290.556
2-5-0.7-1000.2752.2290.9711.4420.6710.973102.541
2-5-0.7-2000.3082.2770.9781.1530.6640.978191.436
2-5-0.7-4000.3822.3660.9880.6810.6970.983307.688
0.5-2-0.3-1000.1281.7740.9882.0150.9840.99177.369
0.5-2-0.3-2000.1961.9650.9961.1740.9790.991153.606
0.5-2-0.3-4000.2412.0690.9961.1460.9720.989250.489
0.5-2-0.5-1000.1331.8290.9812.2740.9050.98484.601
0.5-2-0.5-2000.2082.0120.9961.1720.9310.990166.295
0.5-2-0.5-4000.2542.0910.9950.8220.9700.989261.325
0.5-2-0.7-1000.1521.8980.9851.9740.8830.988102.395
0.5-2-0.7-2000.2192.0280.9971.0480.9520.992167.419
0.5-2-0.7-4000.2722.1040.9950.7241.0050.992279.888
Publisher’s Note: MDPI stays neutral with regard to jurisdictional claims in published maps and institutional affiliations.

