3.4.1. Comparative Studies of the Dispersion of GO and PSG in Different Solution Systems
Figure 10a–d shows the effect of GO dispersion and PSG dispersion in different systems, namely (water (W), Ca(OH)
2 solution (CHS), Ca(NO
3)
2 solution (CAS), and NaOH solution (NHS). The results showed that GO-W and PSG-W mixed with distilled water did not exhibit significantly different appearances: both remained black translucent homogeneous dispersions (
Figure 10a). In the samples mixed with the Ca(OH)
2 solution, GO-CHS showed obvious agglomeration, and GO quickly separated from the water and settled to the bottom of the sample bottle. However, there was no obvious agglomeration in PSG-CHS, which remained a black translucent homogeneous dispersion similar to PSG-W (
Figure 10b). PSG-CAS also showed no visible agglomeration when dosed with an equivalent Ca
2+ concentration of CAS solution (
Figure 10c). However, agglomeration was still observed in GO-CAS, although the agglomerates visually appeared to be less dense than those in GO-CHS. In the samples doped with NHS solution, no macroscopic segregation was observed in either GO-NHS or PSG-NHS (
Figure 10d).
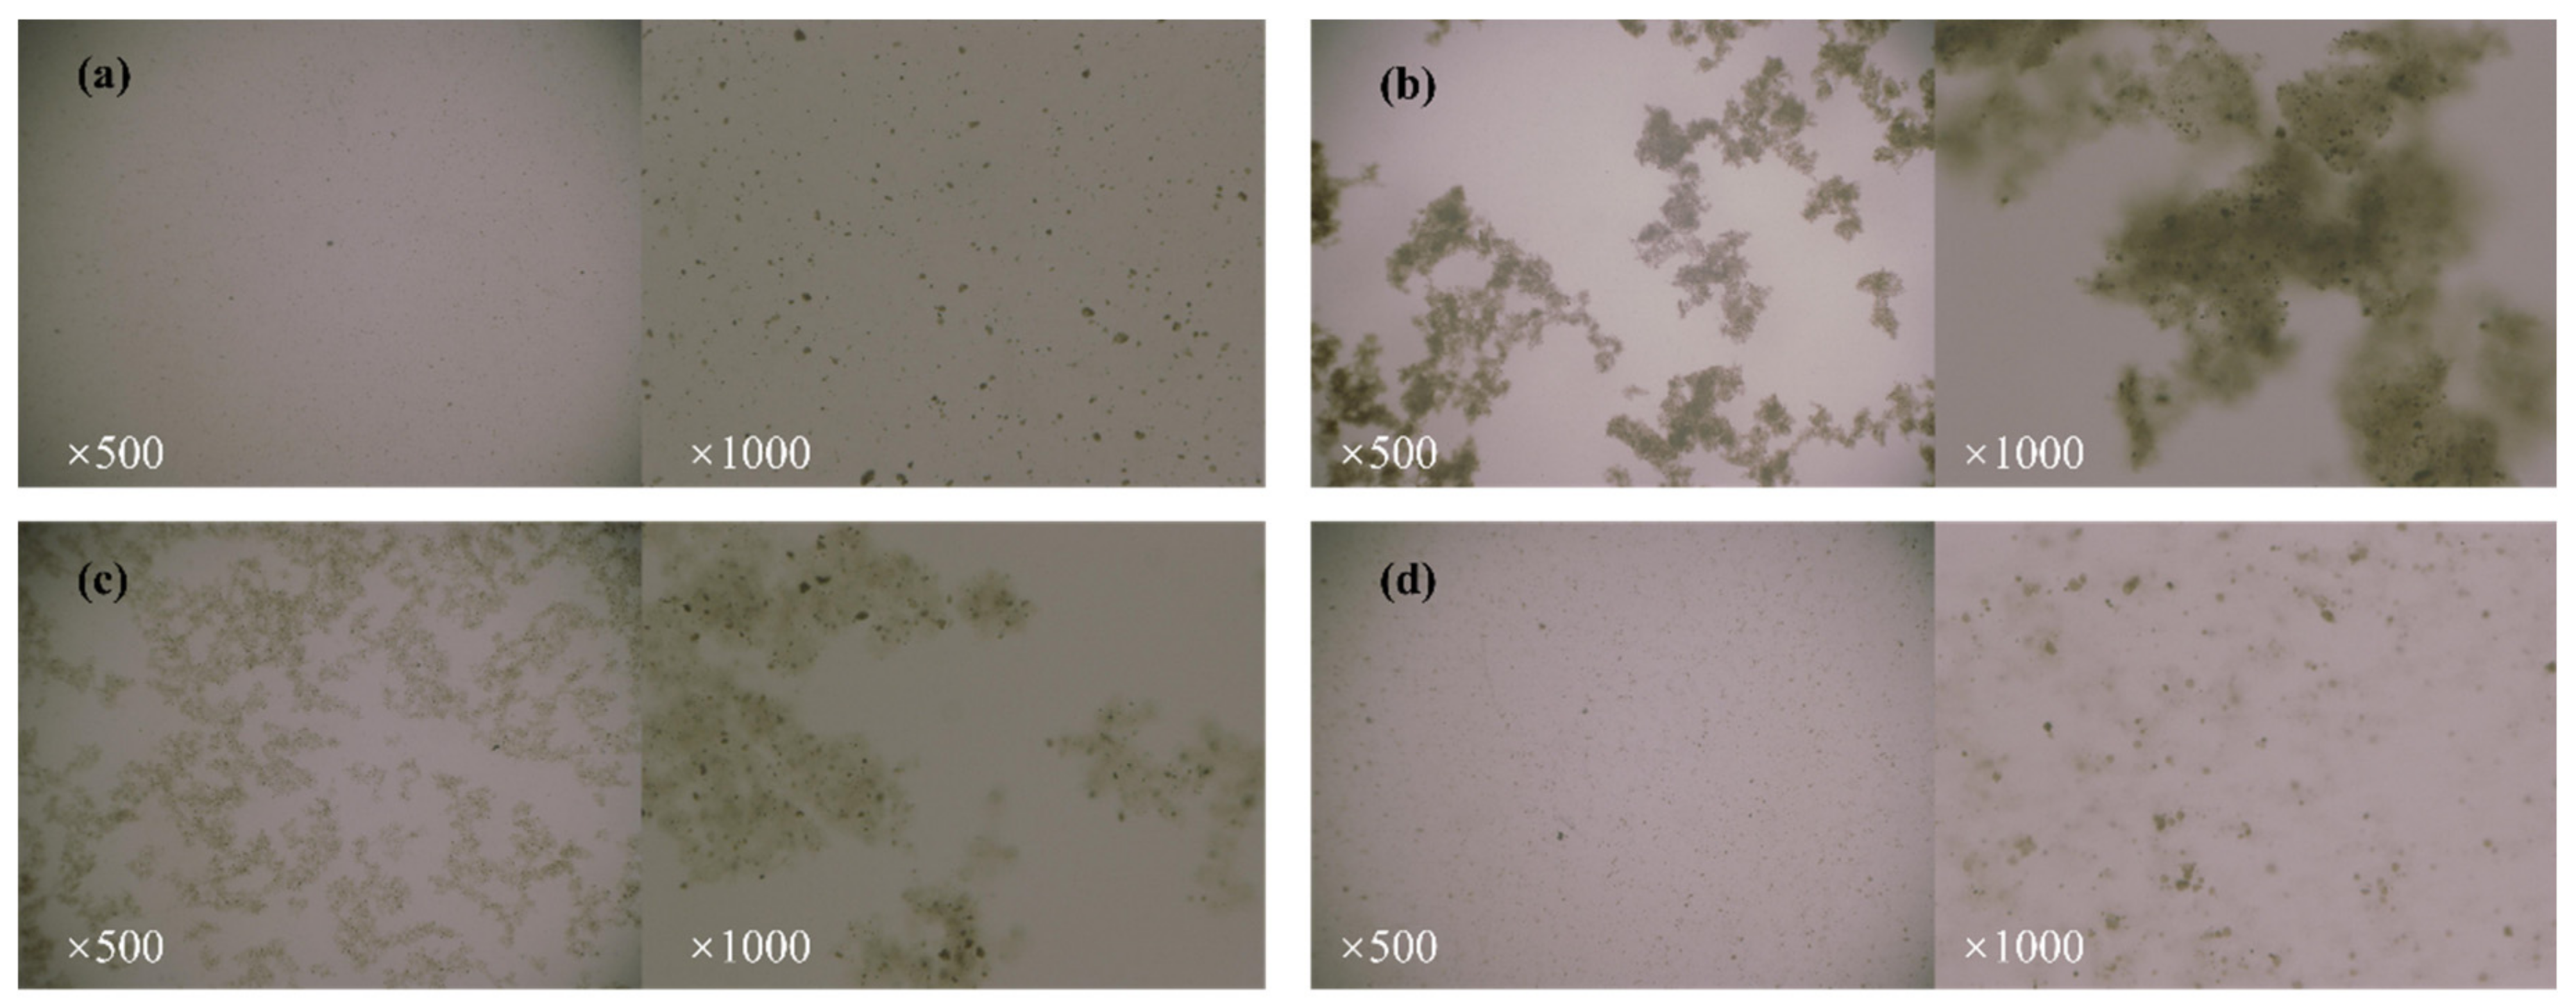
To further understand the morphological changes of GO and PSG in different systems, ultra-depth microscopy was used to observe their morphology.
Figure 11a–d and
Figure 12a–d are ultra-depth microscopic images of GO and PSG in different systems, respectively. It can be seen from
Figure 11a–d that the particle morphology of GO varied in different solvents, i.e., distilled water, Ca(OH)
2 solution, calcium nitrate solution, and sodium hydroxide solution. For example,
Figure 11a, shows GO suspended in distilled water, and it can be seen that the black slice layer was difficult to recognize at 500× magnification, but could be more clearly recognized at 1000× magnification.
When GO was mixed with CHS solution, as shown in
Figure 4,
Figure 5 and
Figure 6b, large, dense GO agglomerates were formed in the aqueous phase at 500× magnification. The pronounced internal structure of these agglomerates can be observed at 1000× magnification, notably showing many dense black punctiform particles (an observation also mentioned by Chuah et al. [
18]). However, when GO was mixed in a CAS solution of an equivalent Ca
2+ concentration, the resulting agglomerates (
Figure 12c) were slightly smaller and less dense than those in the CHS solution, and although the same punctiform particles were visible, their number was significantly reduced. When GO was mixed with an NHS solution of equal OH
− concentration, as shown in
Figure 11d, its state was similar to that in the distilled water sample at 500× magnification, whereas at a 1000× magnification there were some relatively diffuse, amorphous agglomerates.
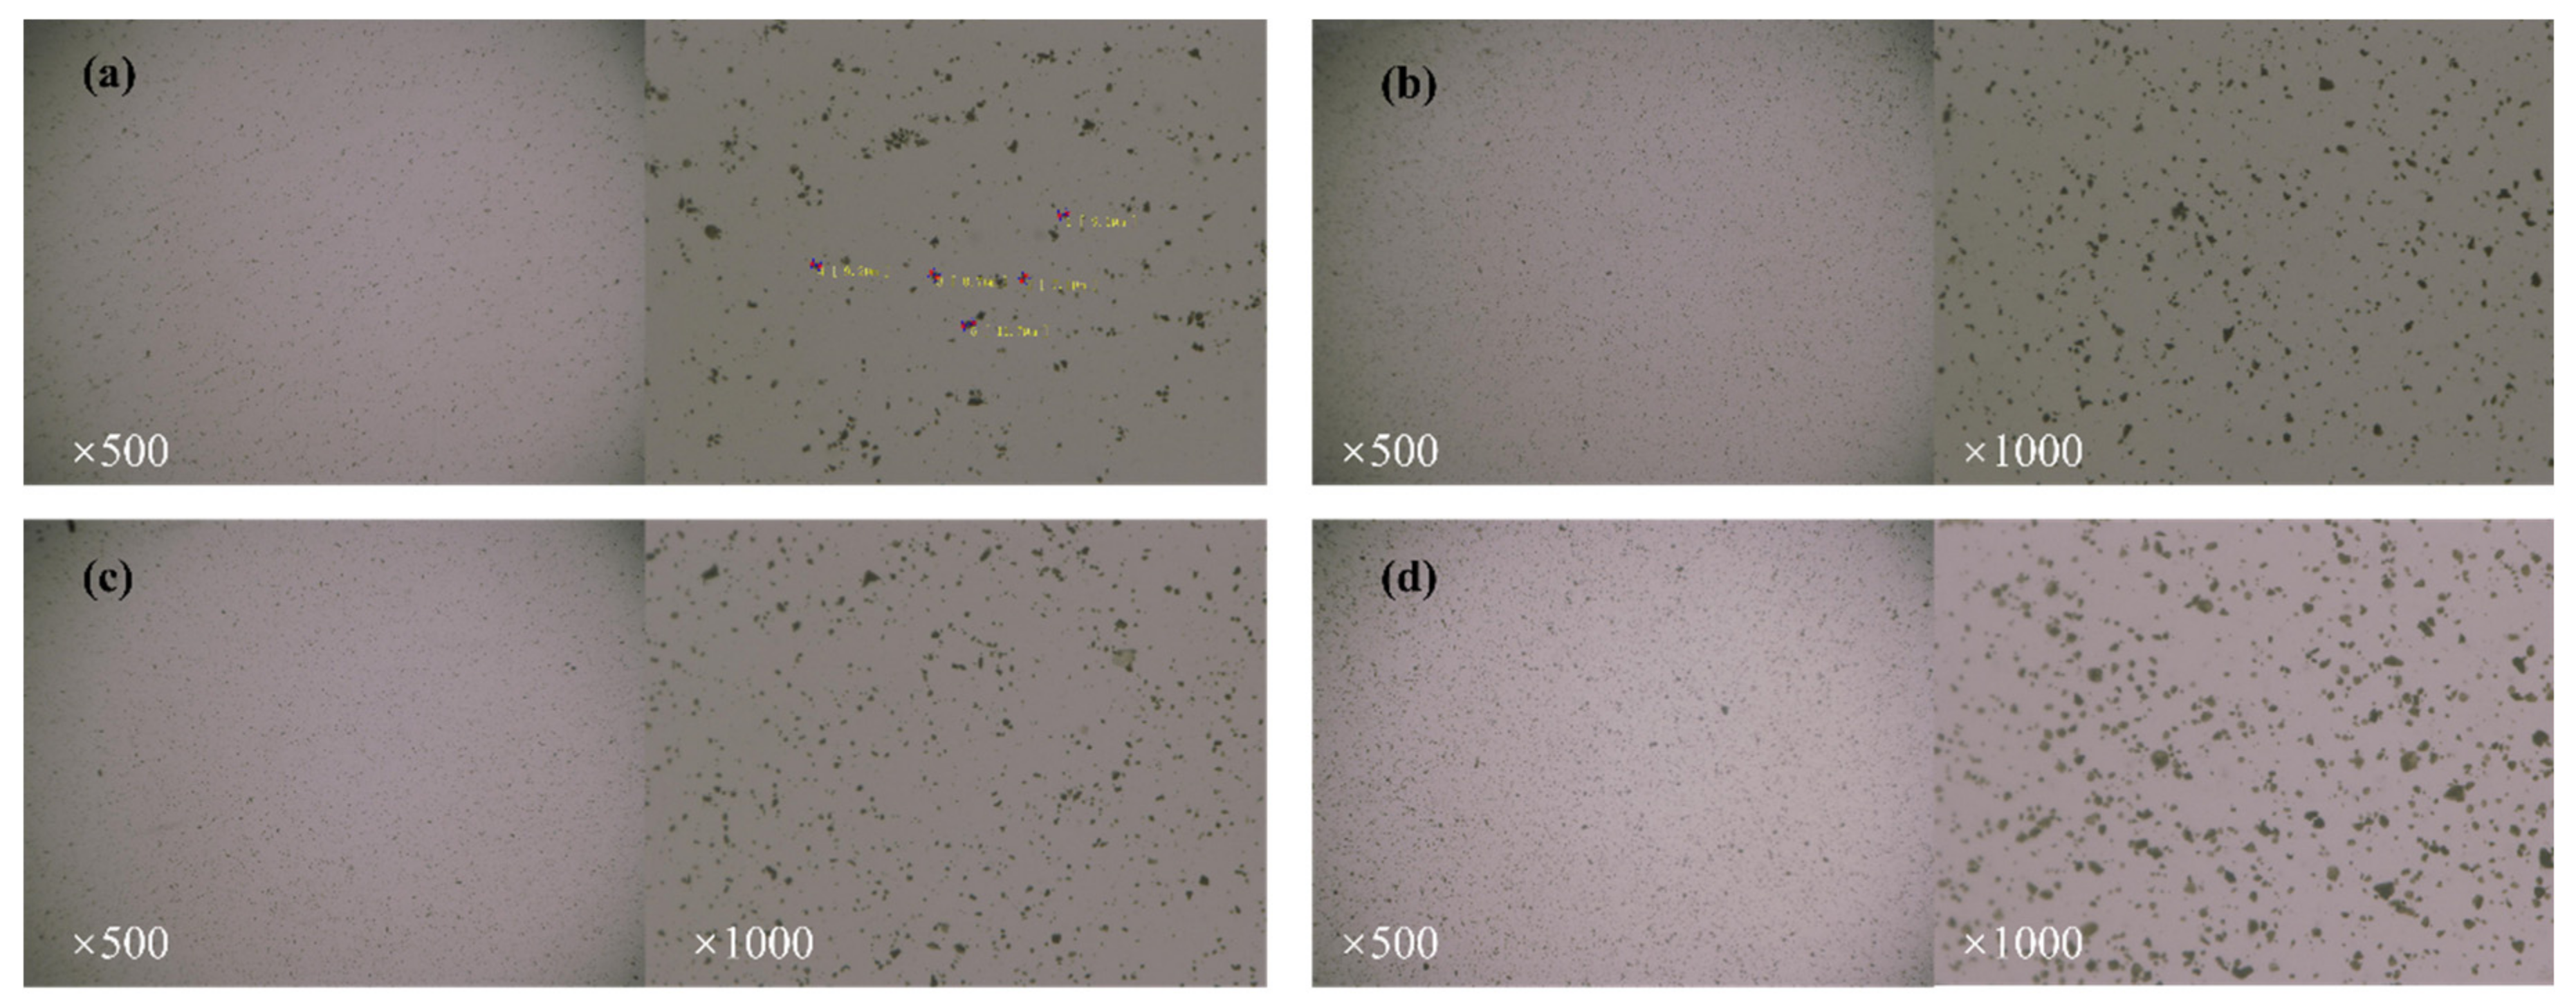
Comparing
Figure 12a,b, we can see that there was minimal overall variation in the appearance of PSG in the four systems. Thus, when PSG was mixed with distilled water (
Figure 12a), the resulting mixture was substantially similar to that of the GO–distilled water mixture in
Figure 11a, although some large agglomerates were visible at 1000× magnification. When PSG was mixed in a CHS solution and a CAS solution of an equivalent Ca
2+ ion concentration, the agglomerates that were seen in the analogously doped GO mixture were not observed (compare
Figure 12b,c with
Figure 11b,c): in fact, the dispersions were largely the same in appearance as in
Figure 12a. When PSG was mixed with an NHS solution of an equal OH
− concentration, no significant agglomeration was observed at either magnification. Overall, these data showed that PSG did not react with Ca
2+ or OH
−, either alone or together, to produce aggregates in the aqueous phase.
3.4.2. Comparison of Zeta Potential between GO and PSG in Cement Solution
From the above results, it can be seen that GO exhibited distinctly different effects when interacting with the four solvent systems, whereas PSG did not (at the macroscopic to mesoscopic scale). However, both GO and PSG formed a homogeneous colloidal solution once in aqueous dispersion, so the surface of the particles in these dispersions should exhibit electrical properties. Specifically, the interaction of these different particles with various systems and electrolytes caused changes in the surface electrical properties of the particles, resulting in a change in the state of the colloids.
It can be seen from
Figure 13 that the zeta potentials of both the GO and PSG dispersed in distilled water were negative, indicating that the surfaces of GO and PSG particles were negatively charged. In addition, the zeta potential of PSG was significantly higher than that of GO, indicating that PSG was more stable than GO in the aqueous phase.
Figure 14a shows that, after the GO was dispersed into the CHS solution, the zeta potential changed from a negative to a positive value with respect to GO-W, indicating that the surface electrical properties of the particles became positive. When the PSG dispersion was mixed into the CHS solution, the zeta potential decreased from −70 mV to −30 mV compared to PSG-W, showing that the particles still existed in a stable dispersion state [
19,
20]. The main cause of the above changes was the complexation of the -COOH groups on the surface of GO and PSG with Ca
2+ in the system; this is discussed in
Section 3.4.4.
The change in the zeta potential of GO and PSG in a Ca(NO
3)
2 solution (CAS) of equal Ca
2+ concentration is shown in
Figure 13b. The zeta potential of GO and PSG dispersed in the CAS solution was similar to that in
Figure 13a, but the relative value changed less than that in the simulated pore (CHS, Ca(OH)
2) solution. Compared with GO-W, GO-CAS had a positive zeta potential of approximately +15 mV, which was slightly less than the +25 mV of GO-CHS. In the PSG-CAS, the zeta potential decreased from −70 mV to −38 mV, and the amplitude was also slightly smaller than the zeta potential in PSG-CHS.
Figure 13c shows the zeta potential of GO and PSG in an NHS (NaOH) solution with equal OH
− concentration. Compared with GO-W and PSG-W, the zeta potentials of GO-NHS and PSG-NHS decreased significantly and, although both were negative, they were greater (more positive) than −25 mV. In addition, the zeta potential of PSG-NHS was slightly greater than that of GO-NHS.
3.4.3. Effect of GO and PSG on the Ion Concentrations of Cement Solution
To better study the interaction between GO and PSG and ions in the system, the effects of varied ion concentrations in different systems were tested.
Figure 14a,b shows the effect of GO and PSG on the concentration of Ca
2+ and OH
− in a simulated pore (CHS) solution. As can be seen from
Figure 14, the Ca
2+ and OH
− concentration in GO-CHS and PSG-CHS decreased significantly compared to the control group, and these decreases were significantly greater than those in the GO-CHS group. These results showed that both GO and PSG can interact with the CHS solution by adsorbing significant concentrations of Ca
2+ and OH
−. Notably, when Ca
2+ and OH
− were both present, PSG absorbed more Ca
2+ and OH
− than GO.
To investigate whether there was a synergistic effect between Ca
2+ and OH
−, the ion concentrations in the two systems when each ion was present separately were also tested.
Figure 15 shows the interaction of GO and PSG with Ca
2+ in Ca(NO
3)
2 solution with a Ca
2+ concentration equivalent to that in Ca(OH)
2 (simulated pore) solution. It can be seen from
Figure 15 that the Ca
2+ concentrations in the GO-CAS and the PSG-CAS samples were both less than that in the control, which was similar to the results in the Ca(OH)
2 solution shown in
Figure 14. While this decrease of Ca
2+ concentration in the two sample types was significantly lower than that in the Ca(OH)
2 solution, the decrease in Ca
2+ concentration in the GO-CAS sample was significantly less than that in the PSG-CAS sample.
The effect of GO and PSG on the OH
− concentration in sodium hydroxide (NHS) solution (with an equal OH
− concentration to the CHS solution) is shown in Figure 17. It can be seen from
Figure 16 that the OH
− concentration in the GO-NHS group and the PSG-NHS group were both less than in the control; this trend was similar to that in
Figure 15, although the magnitude of the decrease was substantially less than that in the CHS solution. The results shown in
Figure 15,
Figure 16 and
Figure 17 indicated that there may be a synergetic interaction between the complexation-driven adsorption of Ca
2+ and OH
− on the surface of GO and PSG, related to the respective agglomeration properties of the GO and PSG sheets. The relationship between the complexation of Ca
2+ by GO and PSG, the change in ion concentration, and the zeta potential is discussed in
Section 3.4.4.
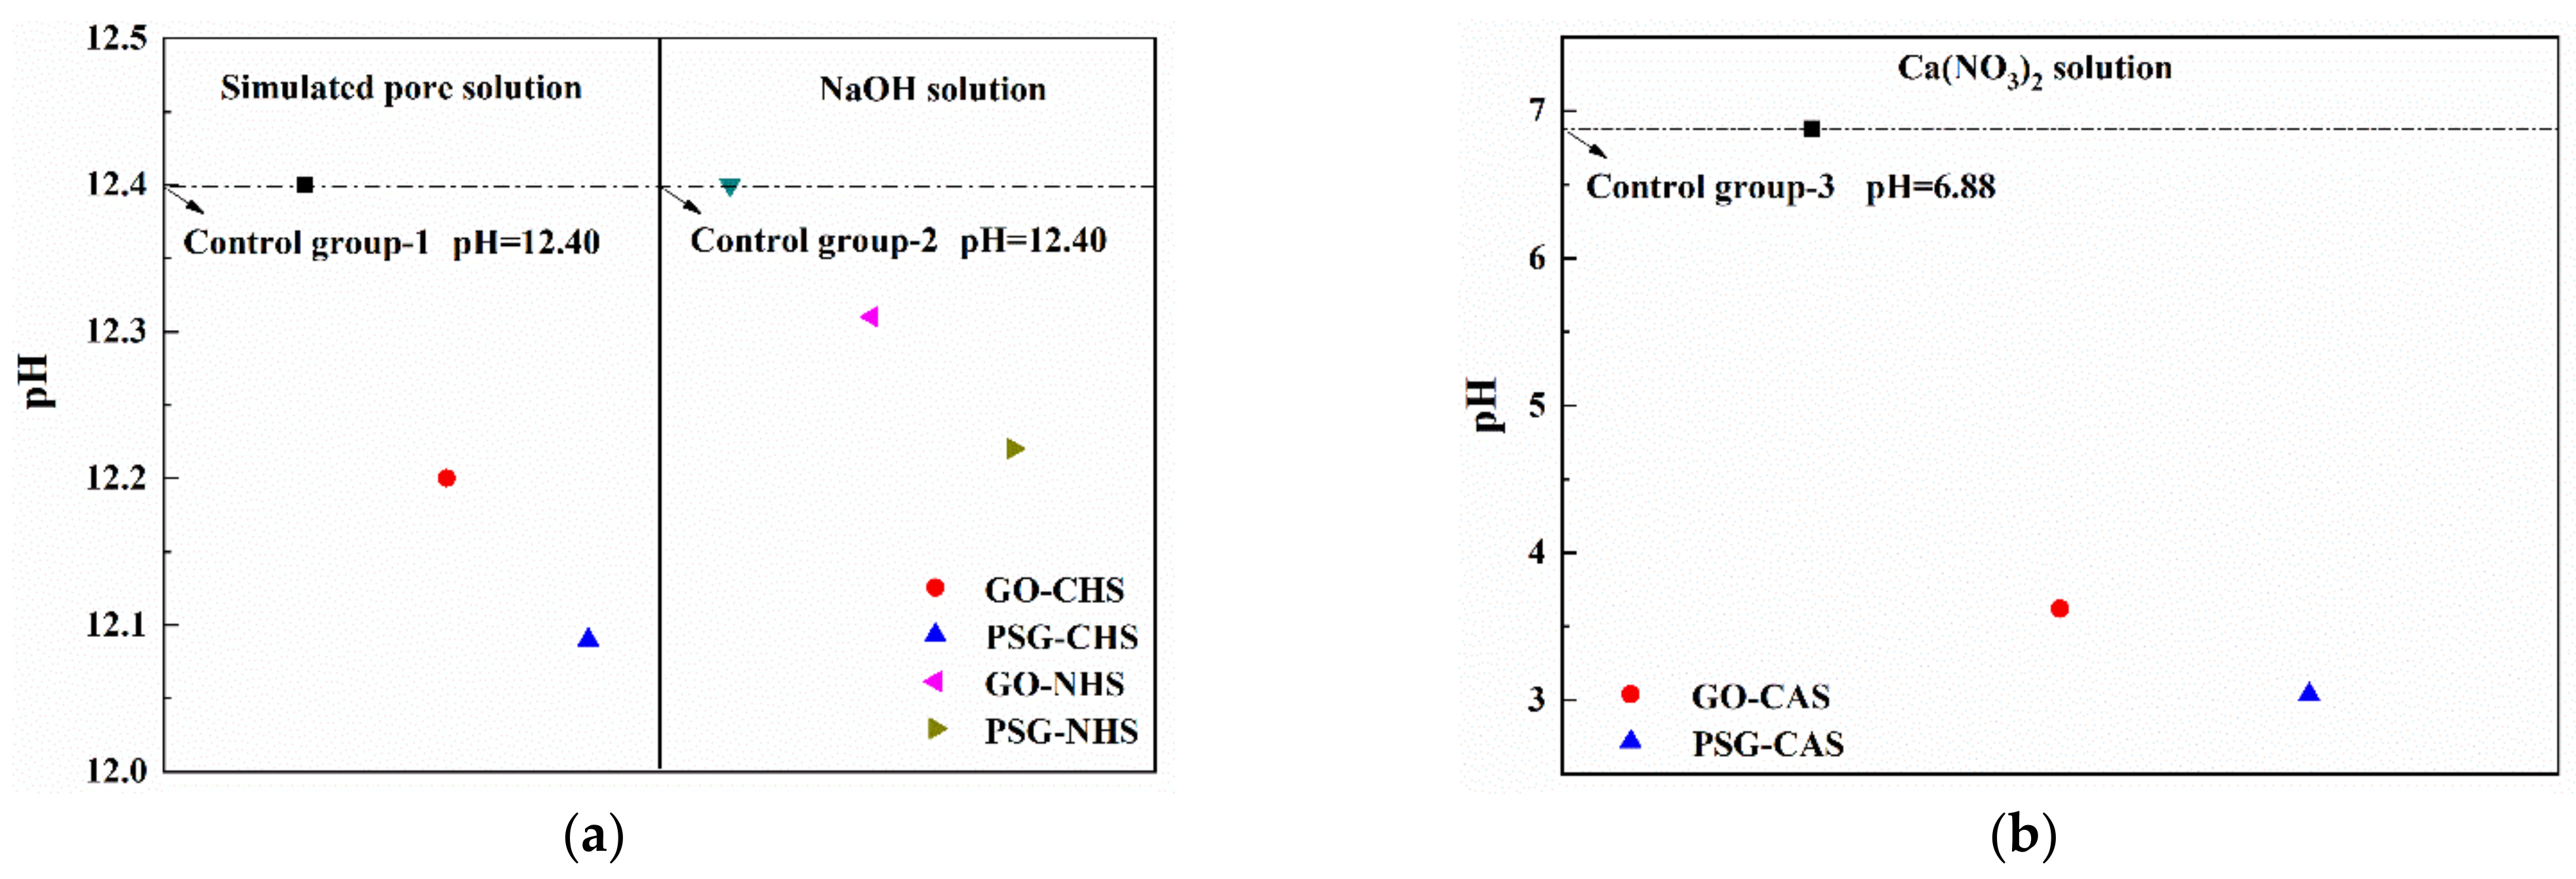
Figure 17 shows the pH changes of GO and PSG in these three systems. It can be seen from
Figure 17 that the decrease of the pH value in the Ca(OH)
2 solution with simultaneous presence of Ca
2+ and OH
− was significantly higher than that in the NaOH solution with an equilibrium OH
− concentration, and that these results were consistent with those shown in
Figure 14 and
Figure 16.
3.4.4. Holistic Analysis
The results in
Figure 10 show that GO was prone to forming macroscopic aggregates in the simulated pore (Ca(OH)
2) solutions and in the Ca(NO
3)
2 solutions with equivalent Ca
2+ concentrations, and that the agglomerates formed in the Ca(OH)
2 solution were larger and denser. In contrast, in the sodium hydroxide (NHS) solution with an equivalent OH
− concentration to the other solutions, GO did not form macroscopic agglomerates. The morphology of PSG did not change significantly in any of these systems. Thus, the presence of Ca
2+ was a key factor in the agglomeration of GO in the cement paste, and OH
− synergized with Ca
2+ to enhance agglomeration.
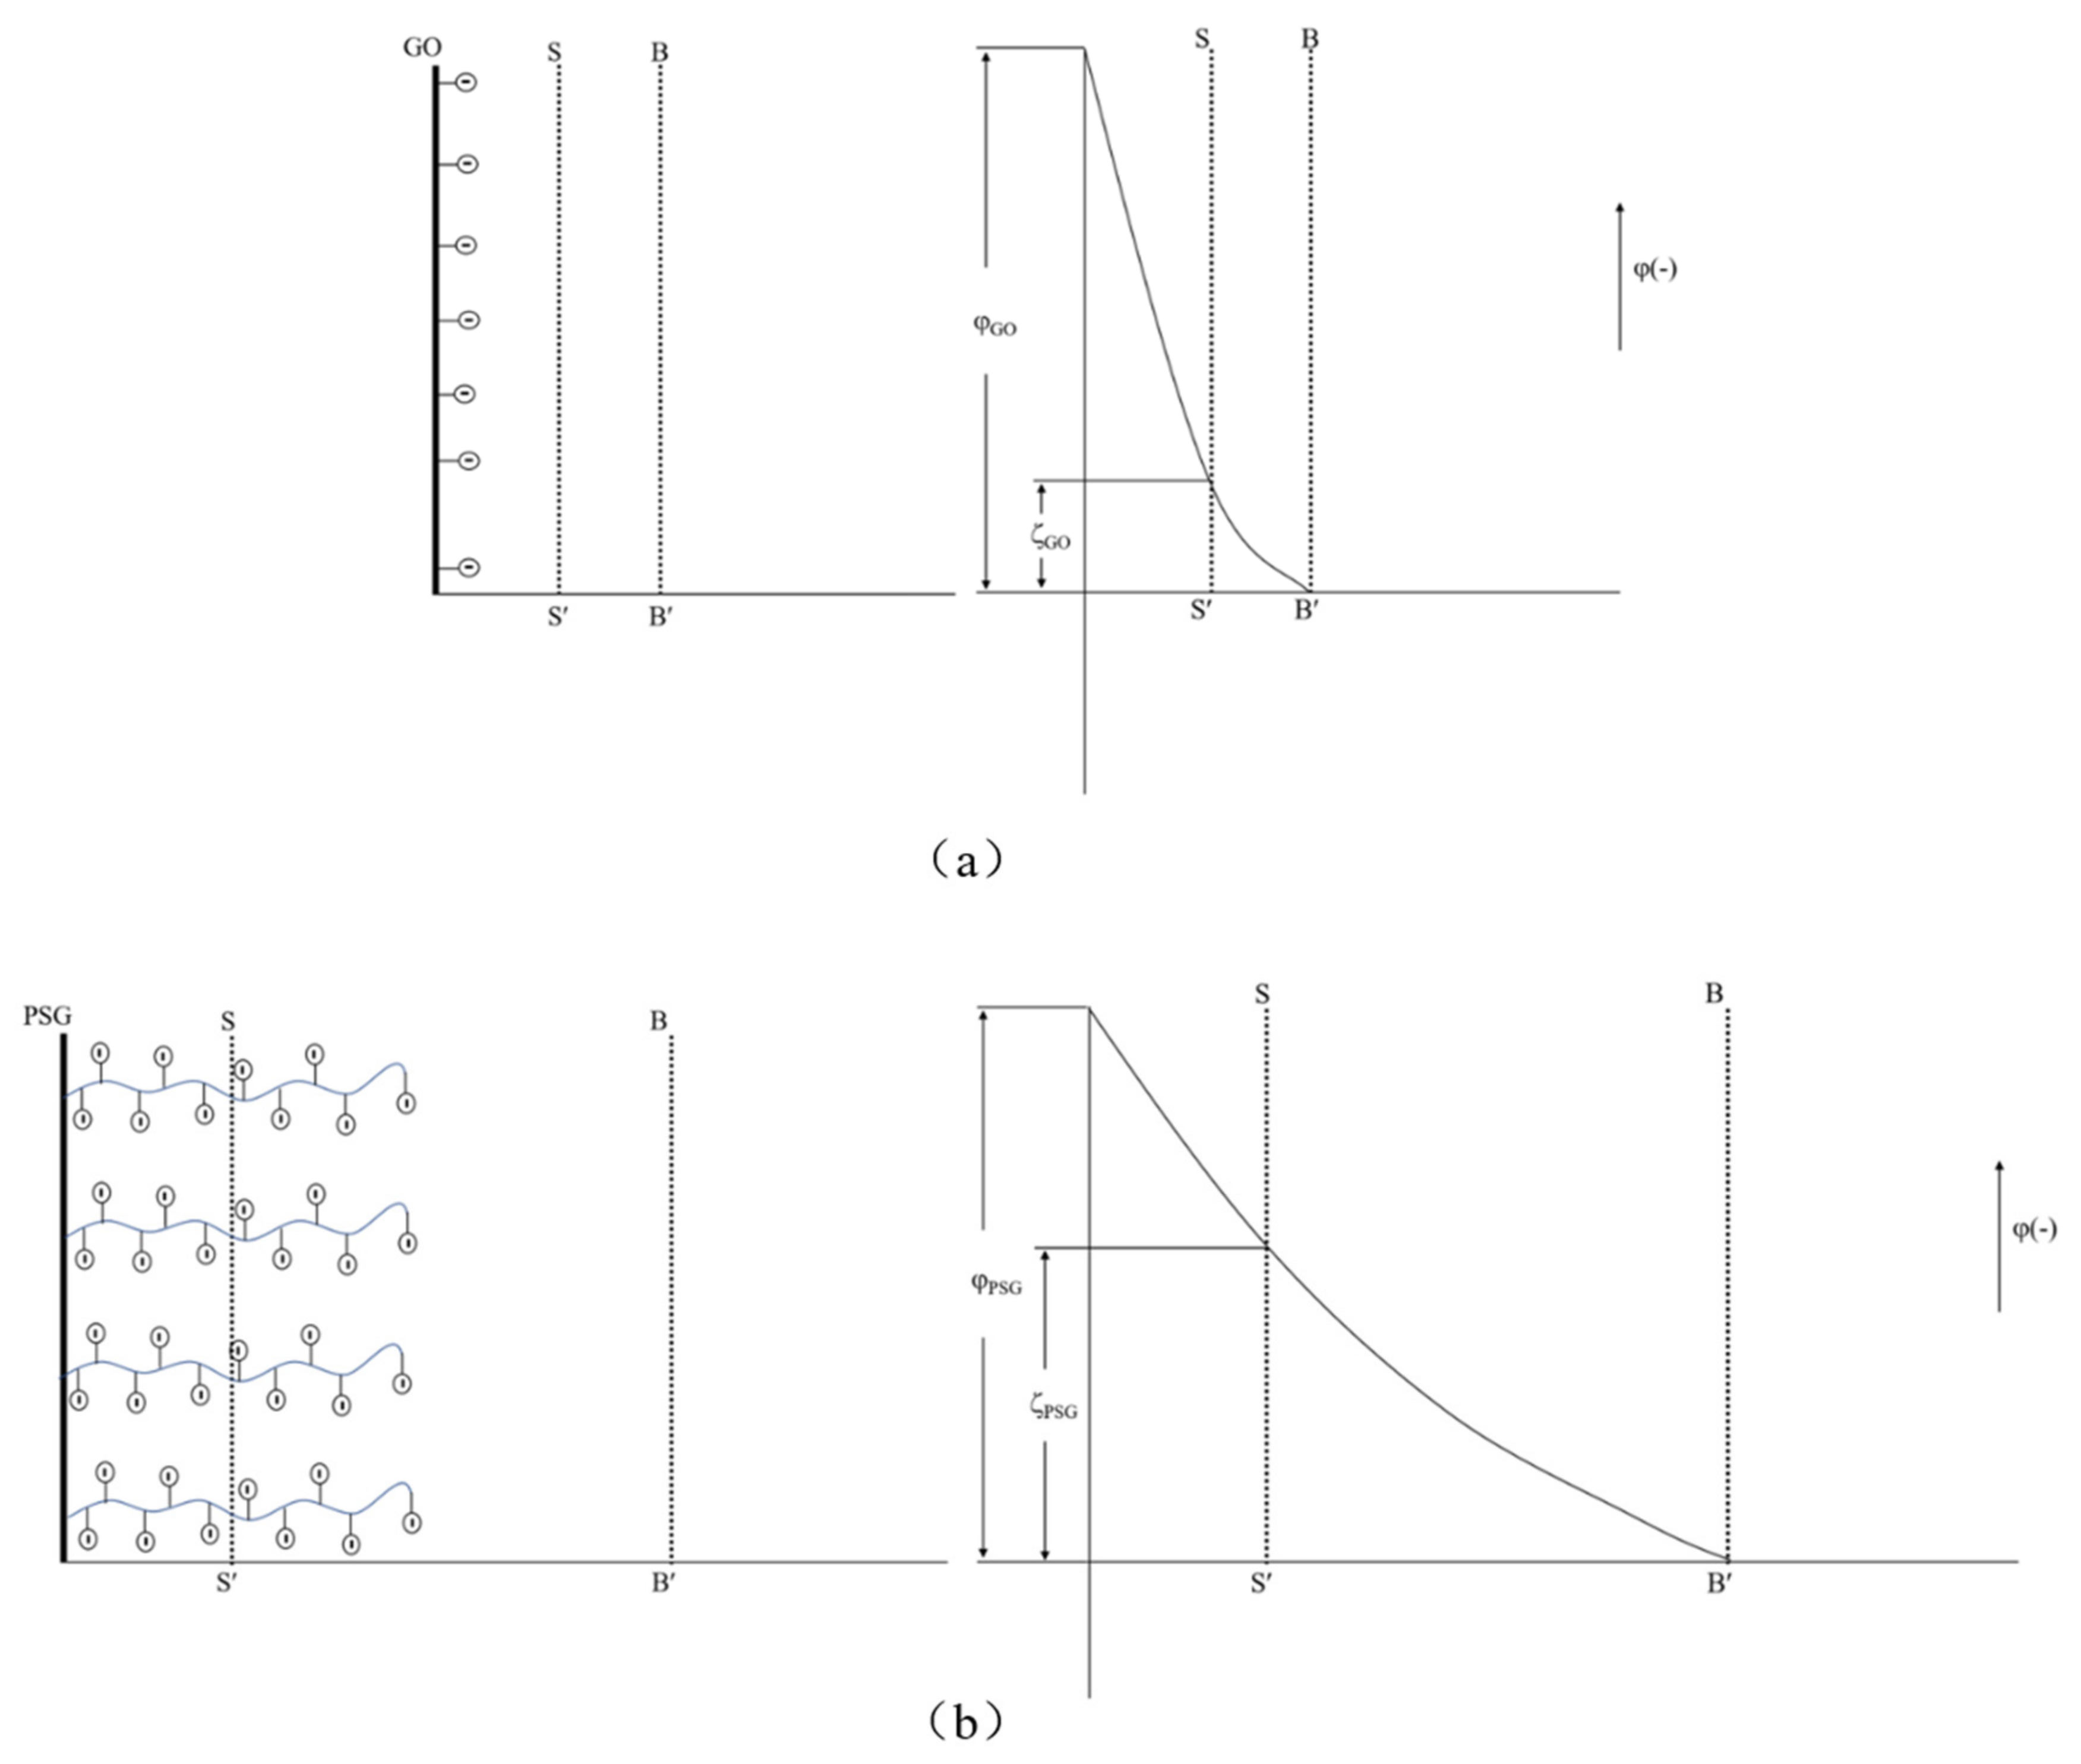
The zeta potential analysis results are shown in
Figure 13. As can be seen, the aqueous dispersion of PSG was more stable than the aqueous dispersion of GO. This is in line with Gouy–Chapman electric double layer theory [
21,
22]. As shown in
Figure 18a, the -COOH group contained on the surface of the GO was partially ionized in the aqueous phase system so that its surface was negatively charged, and thus the zeta potential at the sliding surface SS′ was ζ
GO (ζ
GO < 0). As shown in
Figure 18b, the surface of PSG was modified with a certain proportion of polycarboxylate molecular chains; these chains contained a large number of -COOH groups, which, due to polymerization, generated more negative charge than GO. The carboxylic acid molecular chain extended outward so that the dense layer and the diffusion layer were epitaxial, and the rate of potential drop therefore decreased; thus, the zeta potential of the PSG at the sliding surface SS′ was ζ
PSG (ζ
PSG < 0). In the case of equal-sized sheets, |ζ
GO| was less than |ζ
PSG|, which is consistent with the actual situation in the analysis, as shown in
Figure 14a.
When GO and PSG were doped into a system containing Ca
2+, the COO
− groups contained on the surface of these materials complexed Ca
2+ [
23,
24,
25], thereby absorbing Ca
2+ on the surface of the sheets. This complexation interaction affected the surface potential. The ion-concentration analysis results given in
Section 3.4.4 also prove that GO and PSG complexed Ca
2+.
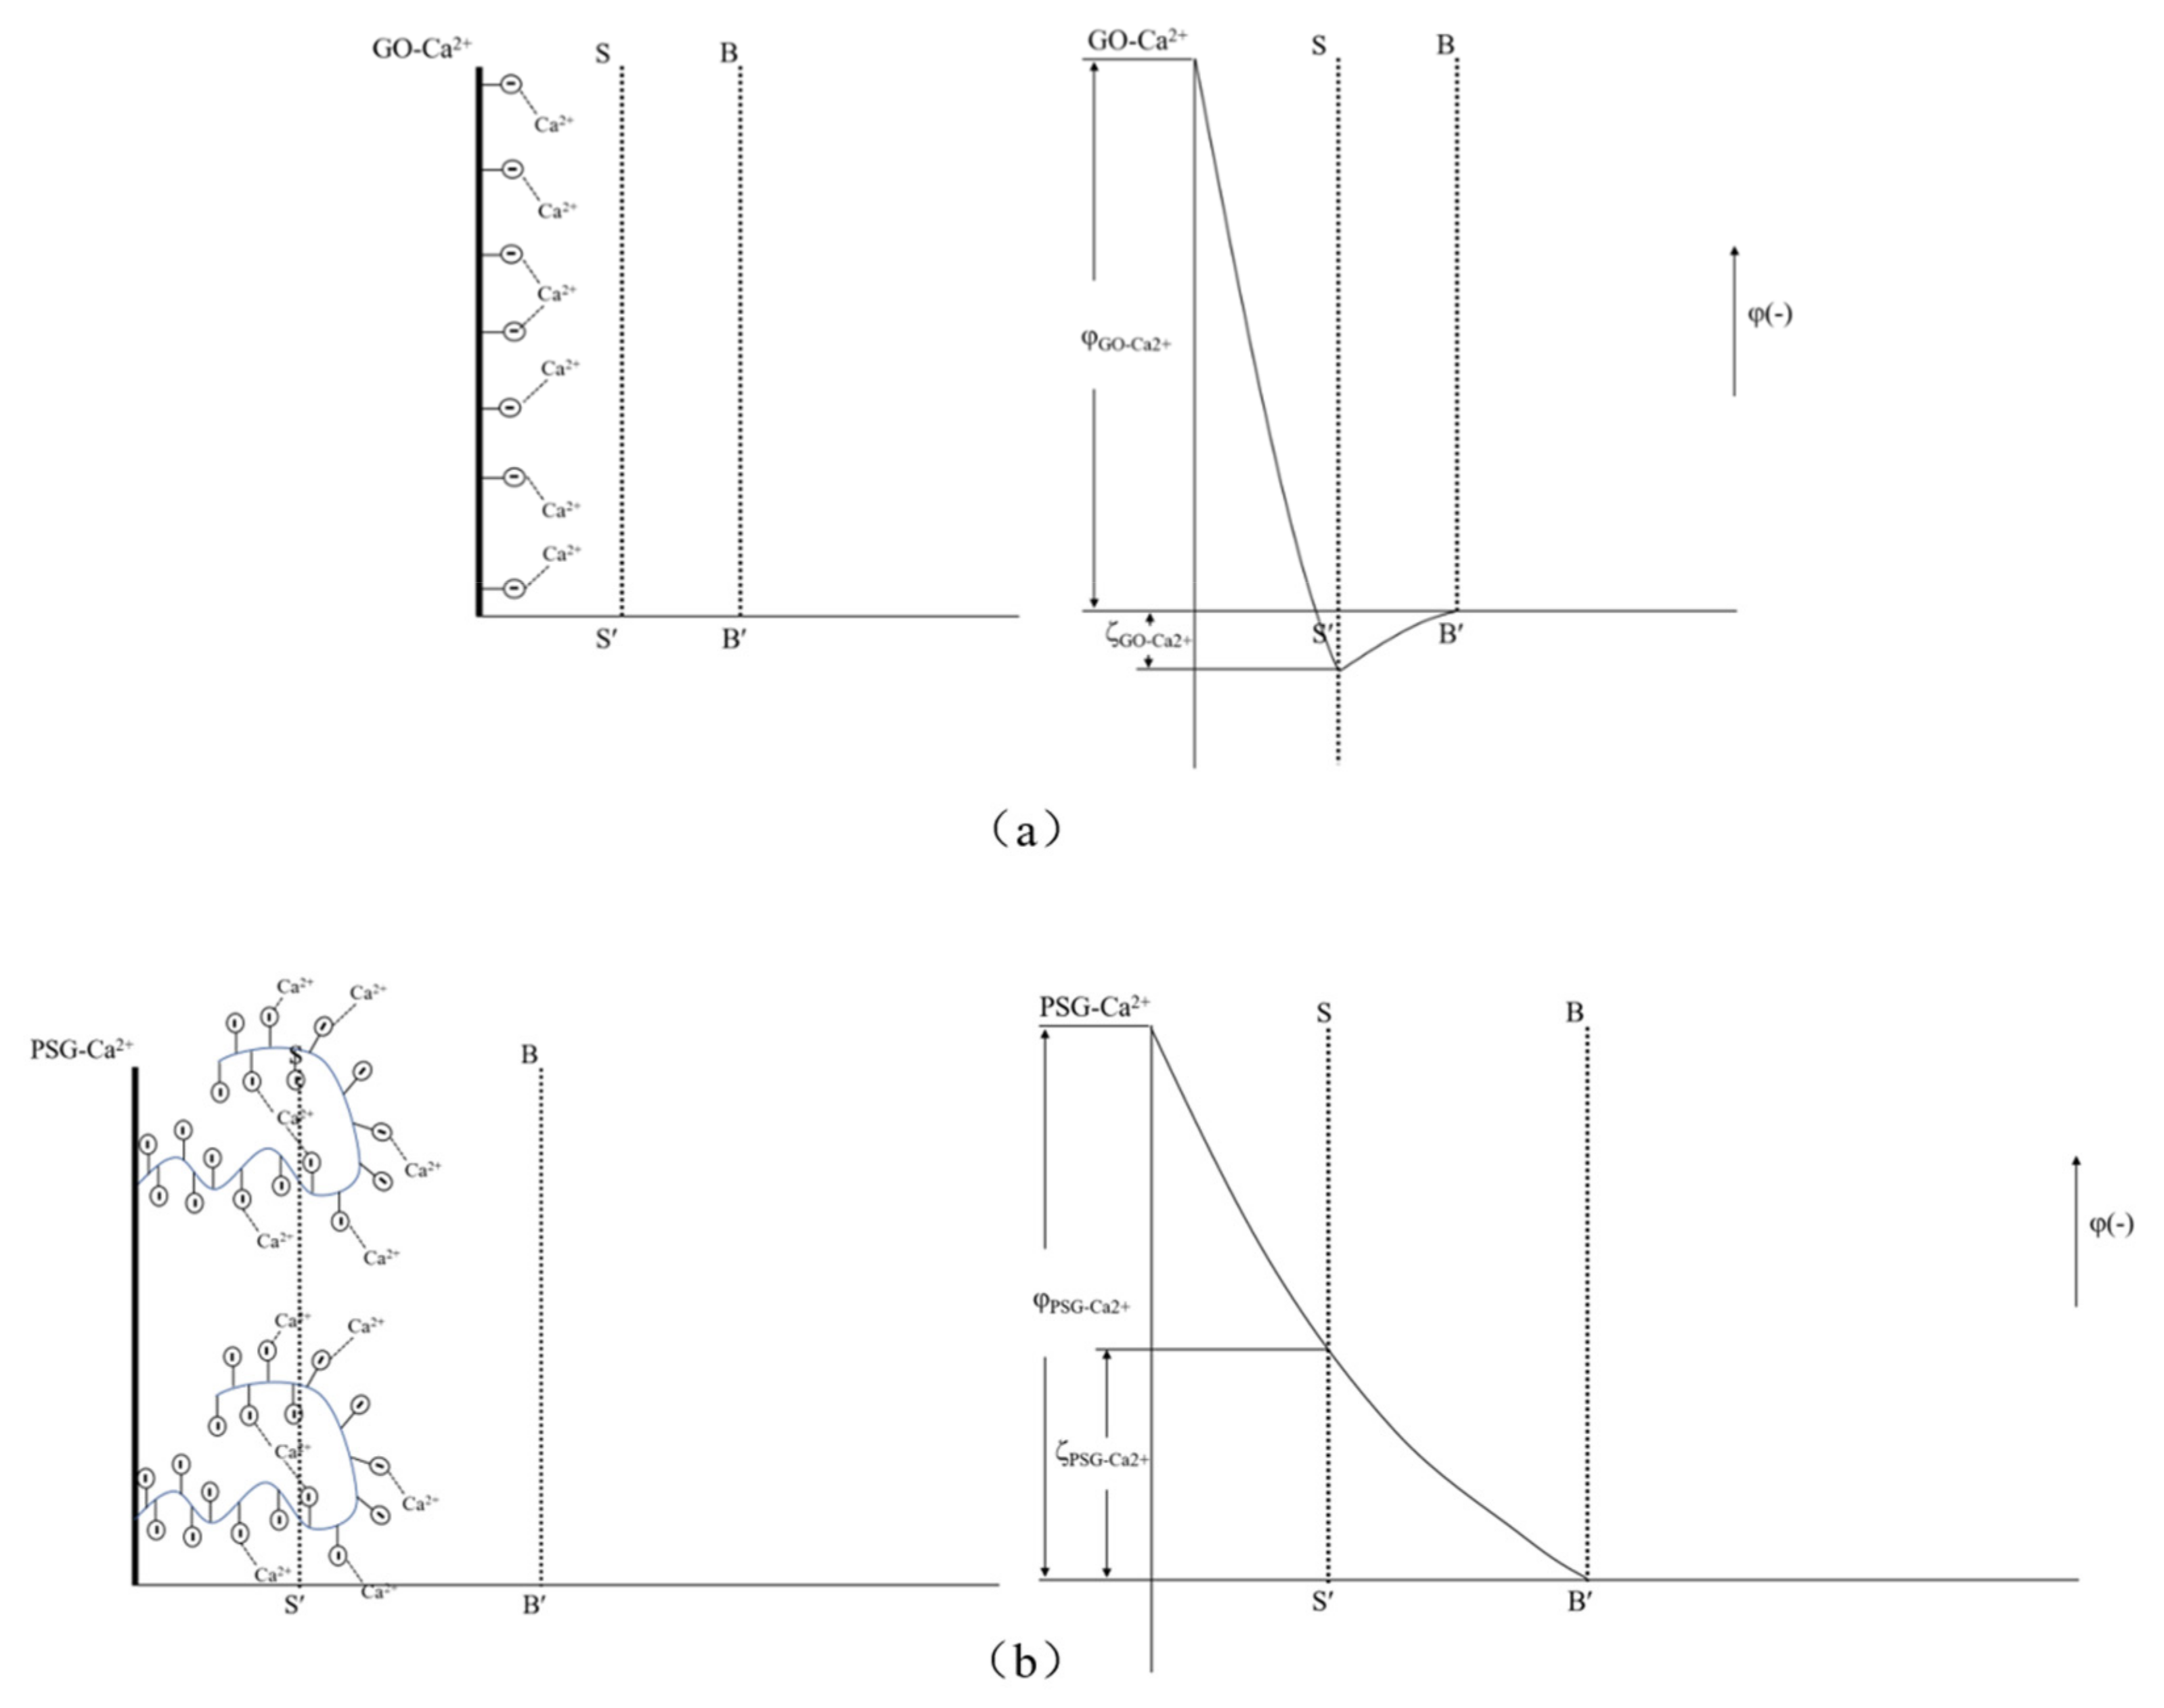
As shown in
Figure 19a, Ca
2+ was complexed and adsorbed on the COO- group of the GO surface. As there were only a few COO- groups on the GO surface, most were complexed with Ca
2+, resulting in the potential of the GO surface becoming positive. However, due to the small size of Ca
2+, the dense layer and the diffusion layer were not significantly epitaxial, that is, the positions of the SS surface and the BB surface were not substantially changed. Consequently, the positive potential caused by the complexation of Ca
2+ caused the SS surface to gradually decrease until, like the BB surface, it was close to 0, and the potential at the BB surface was ζ
GO-Ca2+ (ζ
GO-Ca2+ > 0). These zeta potential results were consistent with those in
Figure 14a,b. In addition, the fact that the potential of |ζ
GO-Ca2+| was less than 25 mV showed that GO in this state could not stably exist in this dispersion system, which was consistent with its macroscopic agglomeration behavior.
In a PSG system containing Ca
2+, as shown in
Figure 19b, the -COO- group on the surface of the polycarboxylate molecular chain also complexed with Ca
2+, increasing the rate of negative potential drop on the PSG surface. Under the action of Ca
2+, a certain degree of involution of the molecular chain occurred, such that the dense layer and the diffusion layer moved back to the surface of the sheet [
26]; this resulted in the potential at the SS surface being ζ
PSG-Ca2+ (ζ
PSG-Ca2+ < 0), and |ζ
PSG-Ca2+| >25 mV, indicating that PSG was stable in this dispersion system.
When GO and PSG were incorporated into a system containing OH
−, as shown in
Figure 17a, OH
− deprotonated the -COOH group to -COO
−, which exposed more negative charge. This phenomenon was illustrated by the negative potential shown in
Figure 13c. Due to a certain amount of Na
+ in the NaOH solutions, the negative potential of GO and PSG in this system still decreased somewhat. In addition, Na
+ was more likely to be adsorbed onto a PSG sheet with more exposed COO
− groups, resulting in a greater potential drop in the PSG. Overall, the fact that the absolute values of both zeta potentials were greater than 25 mV showed that GO and PSG were stable in the NaOH solution.
The above results and analysis showed that the surface electrical properties of GO and PSG under the action of Ca
2+ and OH
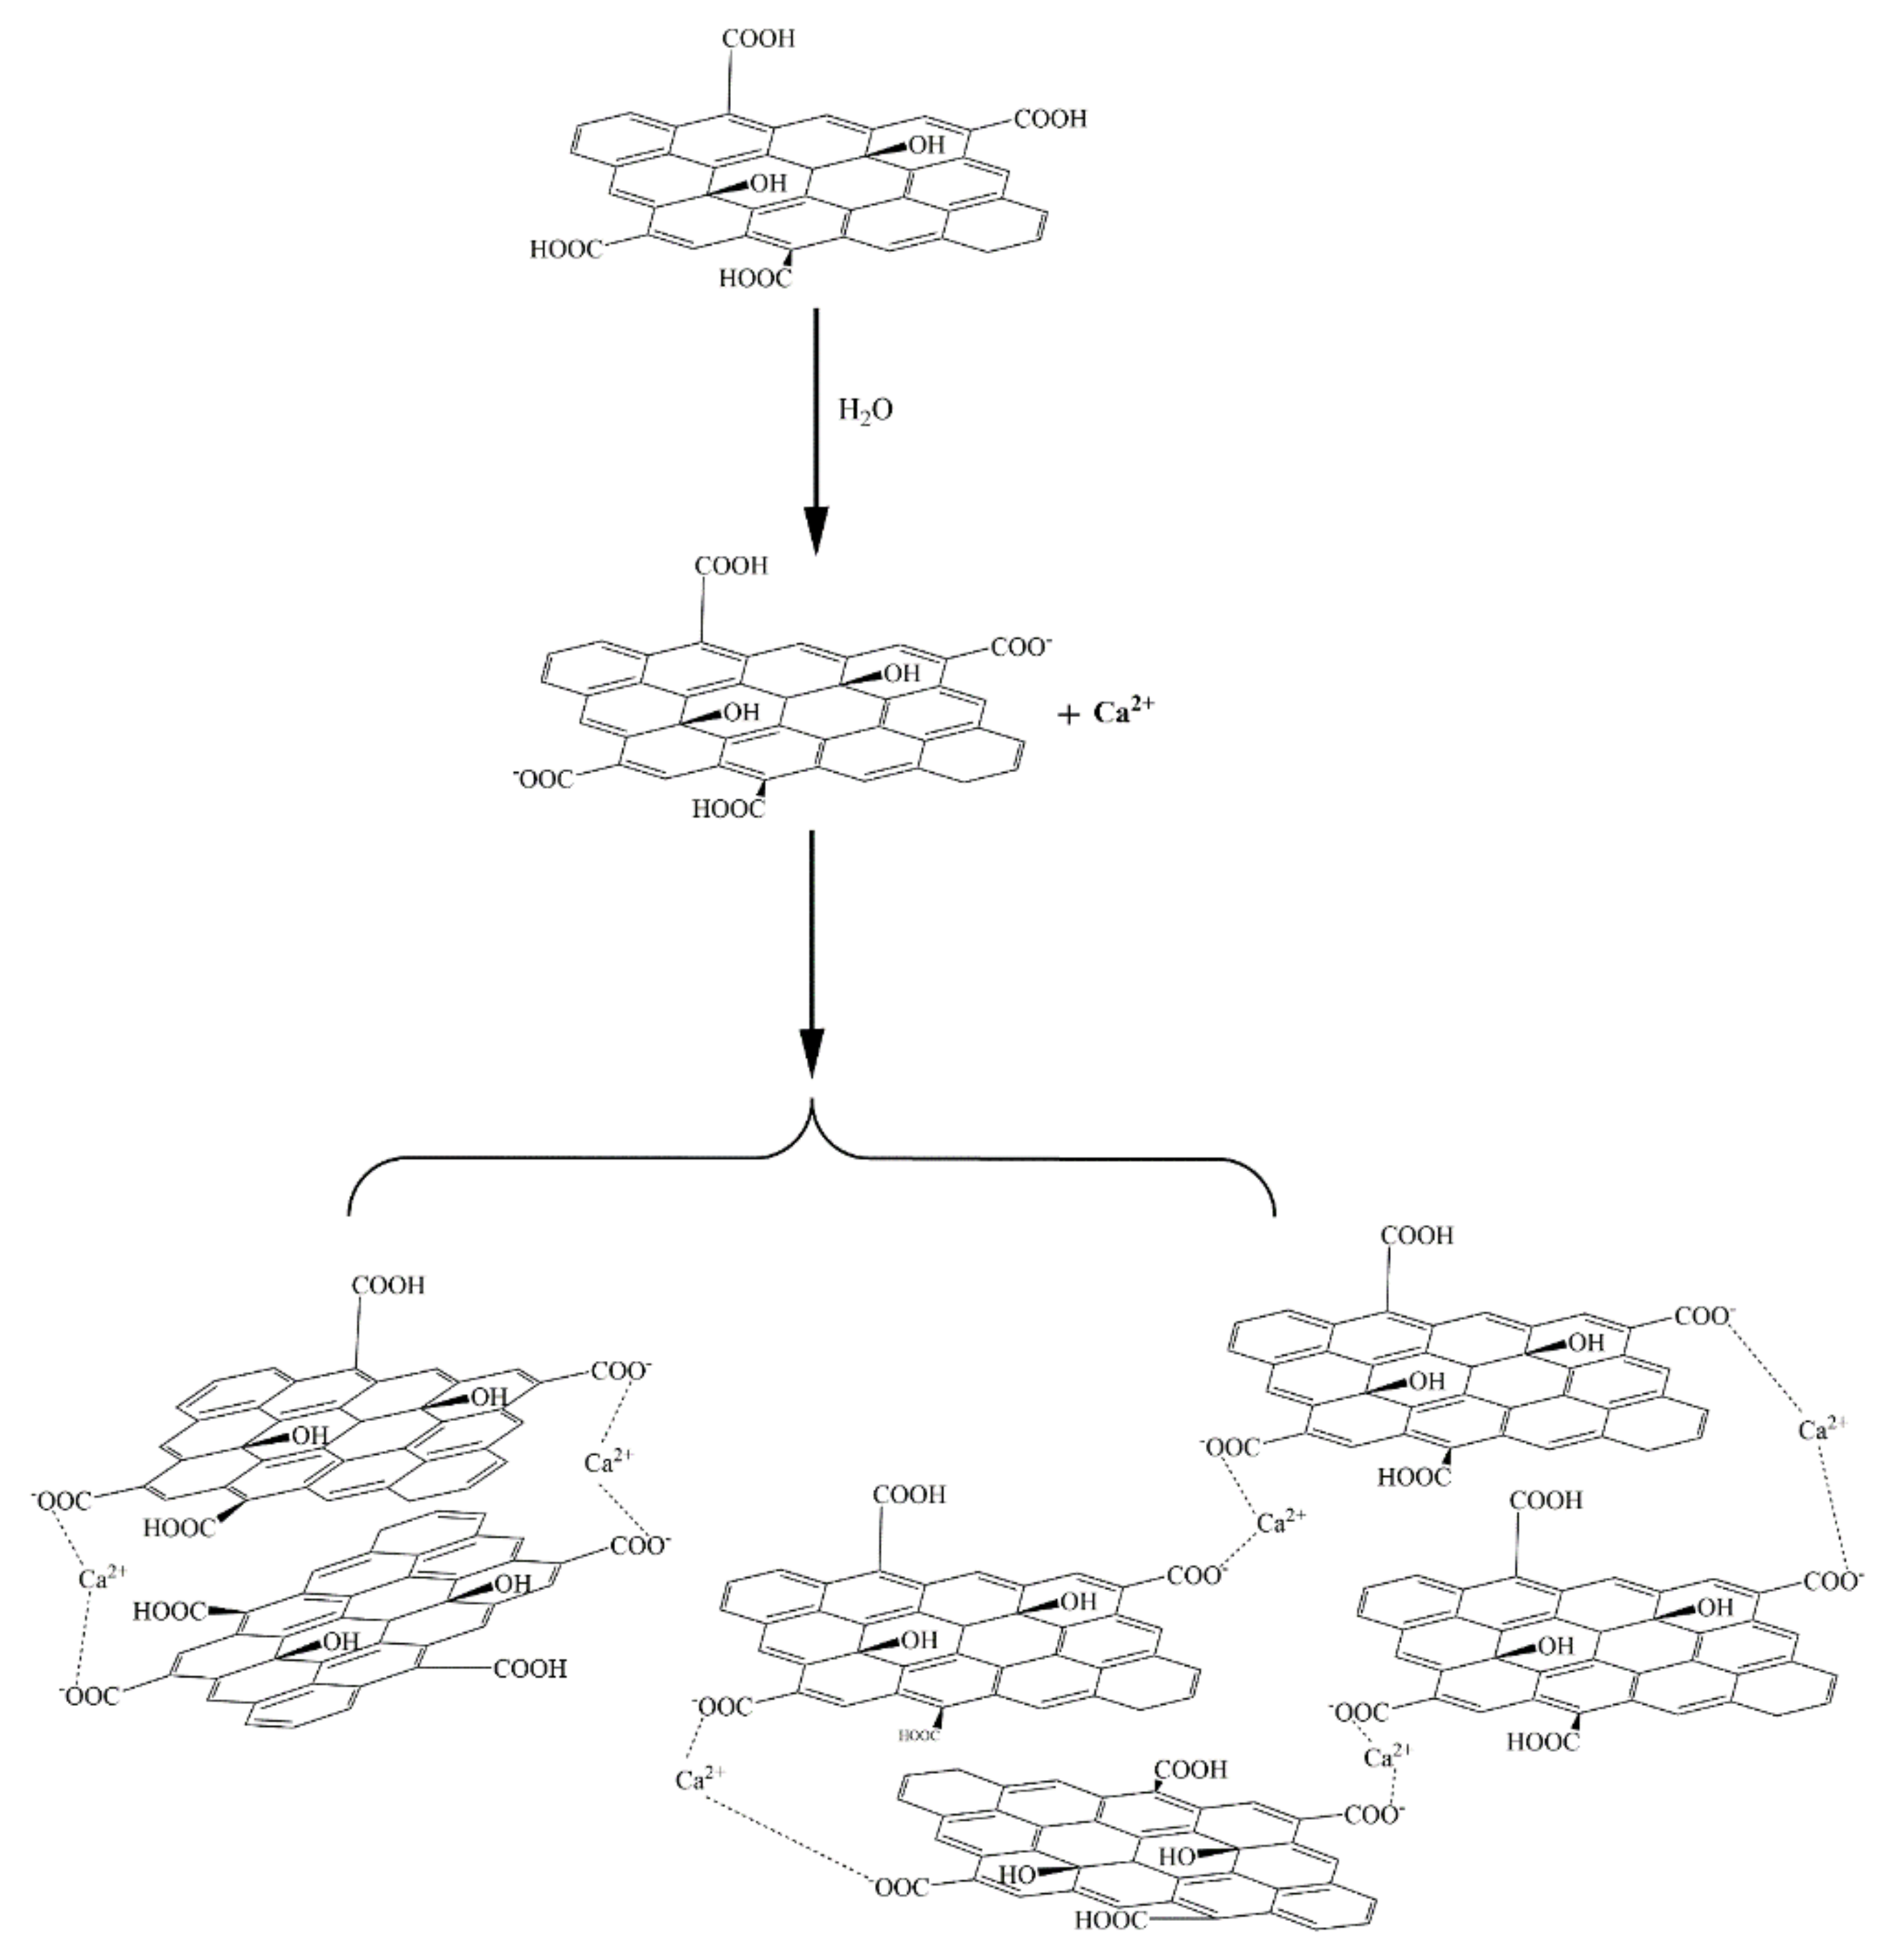
− were significantly different, and that this was directly related to the promotion of GO agglomeration and the inhibition of PSG agglomeration. As shown in
Figure 20, the -COOH group on the GO surface was ionized to -COO
− in water, and as Ca
2+ is a divalent metal ion, it complexed with two -COO
− groups, resulting in the agglomeration of positively charged GO sheets.
Zhao et al. [
27] also suggested that the formation of GO agglomerates was related to the ability of Ca
2+ to “bridge” GO sheets. Thus, it can be inferred that the black dot-like particles in the GO agglomerate in the ultra-depth microscope images (
Figure 11) represent such Ca
2+-bridging complexation. It can be seen that the number of these particles in the simulated pore ((Ca(OH)
2; CHS) solution was significantly greater than in the Ca(NO
3)
2 solution with an equivalent concentration of Ca
2+.
Due to the presence of both Ca
2+ and OH
− in the Ca(OH)
2 solution, some-COOH groups (which were otherwise not ionized on the GO surface) were deprotonated to COO-, as shown in
Figure 21, which promoted the complexation of COO
− with Ca
2+ and further increased the bridging effect of Ca
2+. In addition, the OH
− formed a hydrogen bond with the -OH of the GO surface [
28,
29], further narrowing the distance between the sheets, such that the GO in the Ca(OH)
2 solution formed a larger and denser agglomerate. However, the hydrogen bond did not play a dominant role due to the weakness of the hydrogen-bonding force, so the agglomeration phenomenon seen in
Figure 11d was very weak. The OH
− also promoted the formation of hydrogen bonds between the -OH and water molecules on the GO surface, thereby synergistically affecting the fluidity and rheological properties of the cement slurry.
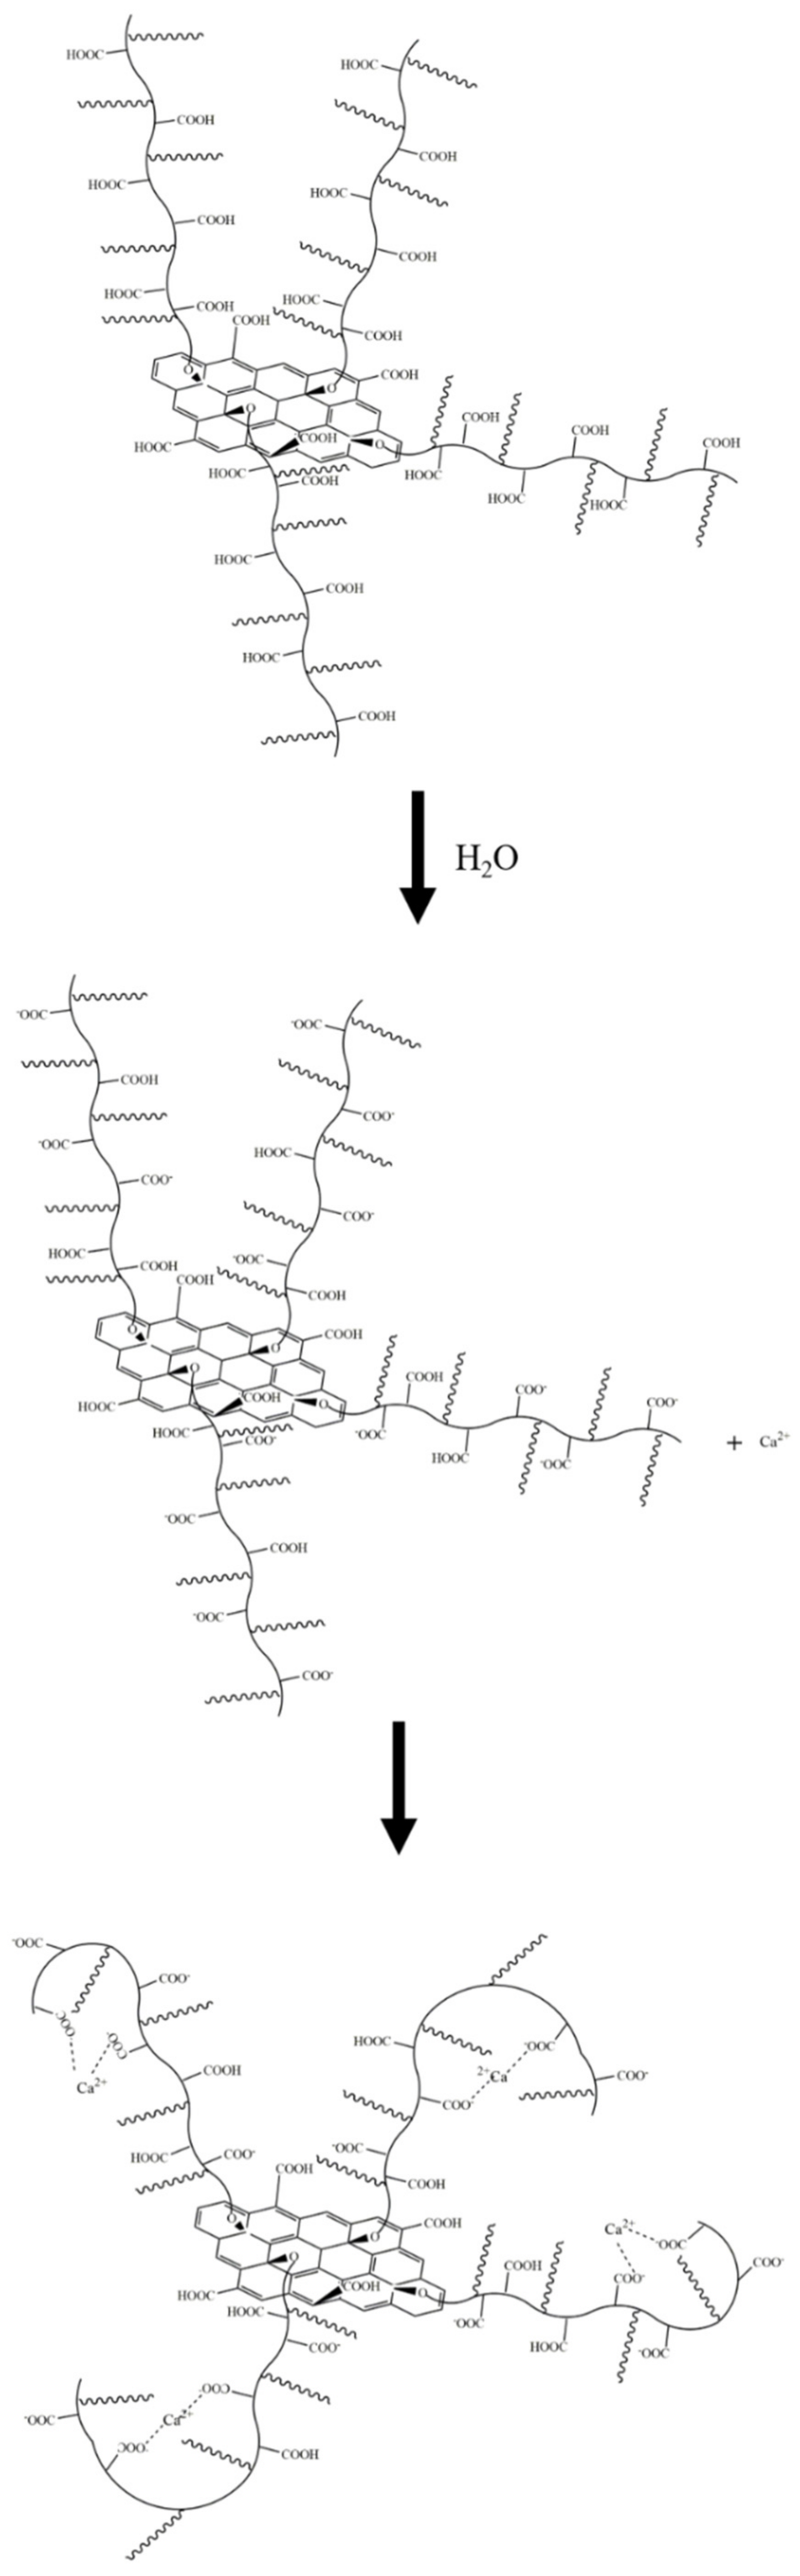
There was a larger number of -COO- groups on the polycarboxylate molecular chain on the PSG sheet than on the GO sheet, and these were available to complex with Ca
2+, as shown in
Figure 22. In this scenario, the binding of Ca
2+ with the COO
− group of the long polycarboxylic chain of PSG caused the molecular chain to curl, thus destroying the Ca
2+-bridge between the PSG layers. In addition, the carboxylic chains occupied the position of the OH on the GO surface, thus destroying the hydrogen bond between OH
− and water molecules. Together, these factors prevented the formation of agglomerates.
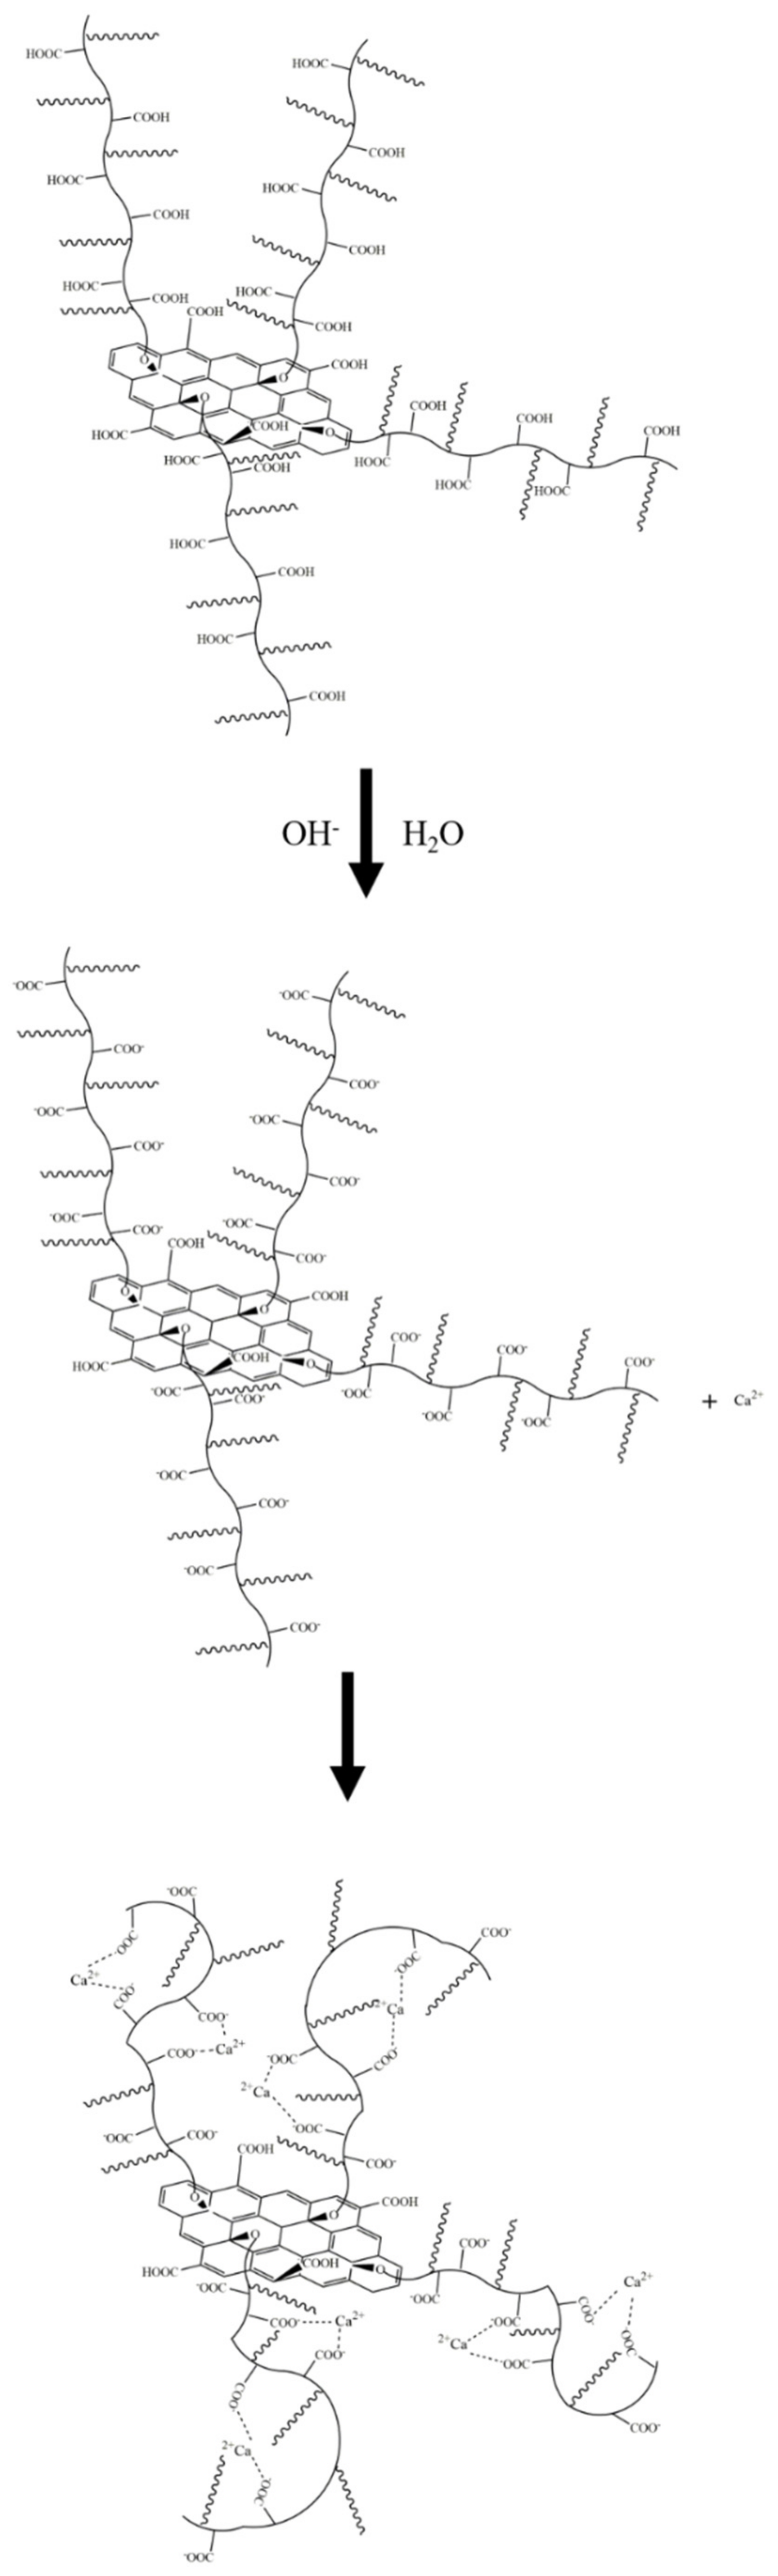
In the Ca(OH)
2 solution in which Ca
2+ ions and OH
− ions were both present, shown in
Figure 23, the OH
− ion also captured the H
+ of the -COOH group in the polycarboxylate molecules in the PSG, so that more COO
− groups were exposed and thus able to complex and adsorb more Ca
2+. However, this Ca
2+ was preferentially captured by the greater number of COO
− groups along the polycarboxylate molecular chains, thus preventing the bridging of layers by Ca
2+, and inhibiting the formation of agglomerates.
The above analysis shows that there were obvious differences in the behavior of GO and PSG in cement paste, consistent with their different effects on the slurry. As shown in
Figure 24a, in the initial stage of cement-slurry mixing, GO rapidly reacted with Ca
2+ and OH
− to form a large and dense agglomerate containing a certain amount of mixing water. Consequently, there was less free water in the slurry, and thus the fluidity of the slurry decreased. At the same time, the large specific surface area and positive surface charge of the agglomerates enabled them to adsorb some of the polycarboxylate superplasticizer, which resulted in an overall reduction in the superplasticizer. In addition, the agglomerates also interacted with cement particles via Ca
2+ to form recombinant flocculation structures, thereby further affecting the fluidity and rheological parameters of the cement slurry.
When PSG was incorporated into a cement slurry, the internal complexation mentioned earlier, and the inhibition of agglomeration by the intramolecular chain, meant that agglomerates were not formed in the slurry aqueous phase, as shown in
Figure 24b. The polycarboxylate molecular chains grafted on the surface of the PSG played a key role, by virtue of their electrostatic repulsion and steric hindrance, thereby preventing the adsorption of free polycarboxylate superplasticizer molecules on the surface of the sheet [
30]. This enabled the superplasticizer to exert its normal dispersive effects, thus maintaining the fluidity of the slurry and generating rheological behavior comparable to that of the undoped slurry.


