
Enhancing Free Cyanide Photocatalytic Oxidation by rGO/TiO2 P25 Composites

 , and
, and 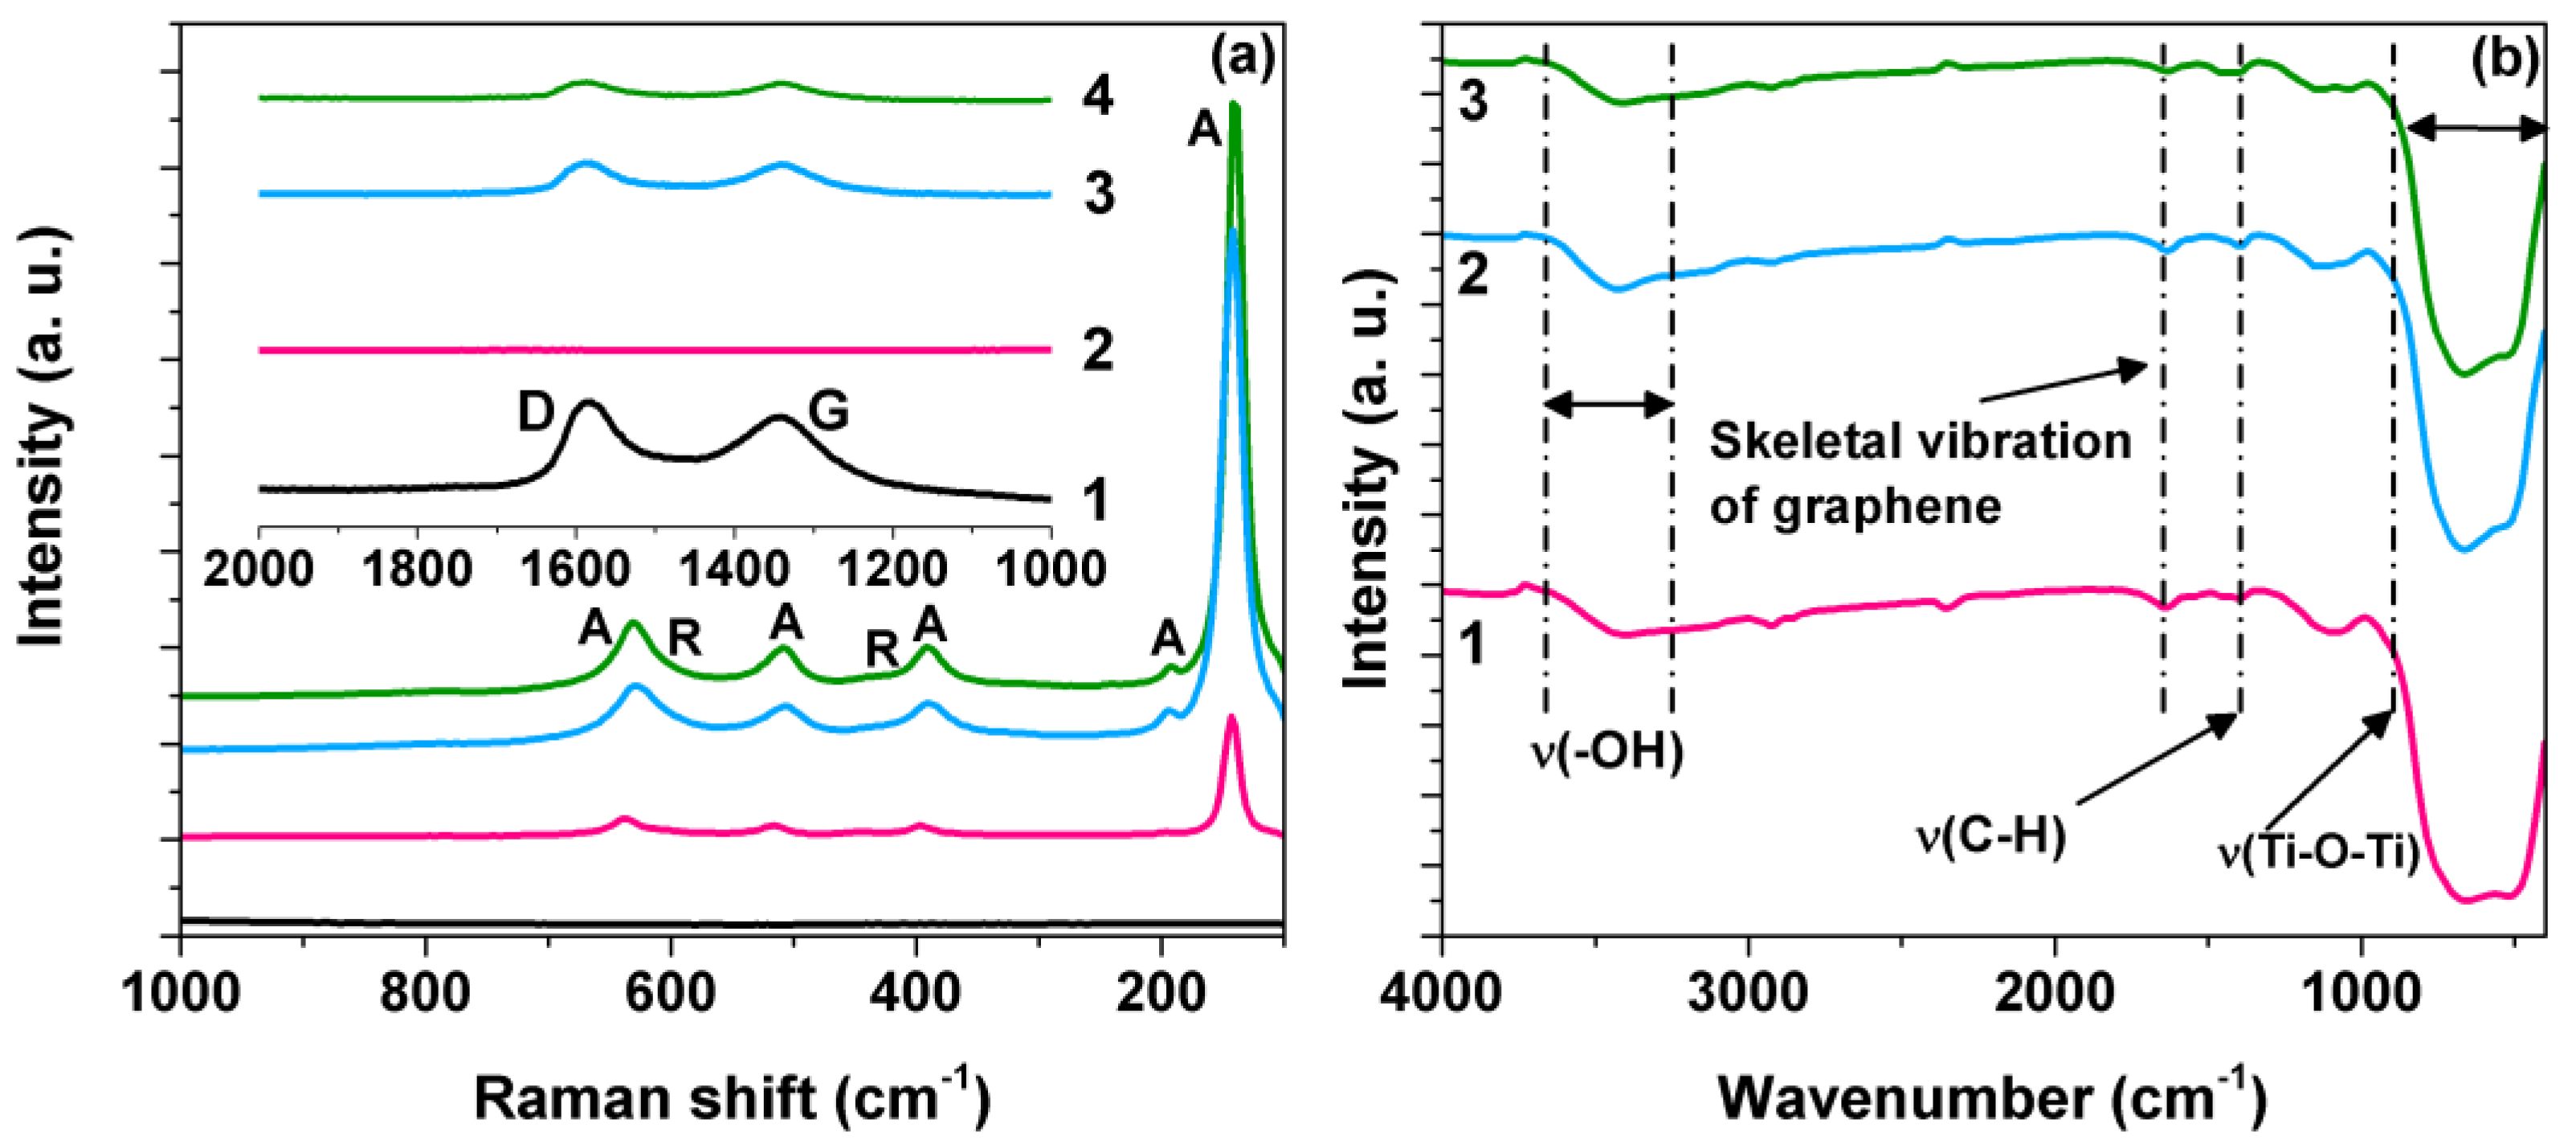
Abstract
:1. Introduction
2. Materials and Methods
2.1. Materials
2.2. Preparation of rGO/TiO2 Composites
2.3. Characterization
2.4. Photocatalytic Evaluation
3. Results and Discussion
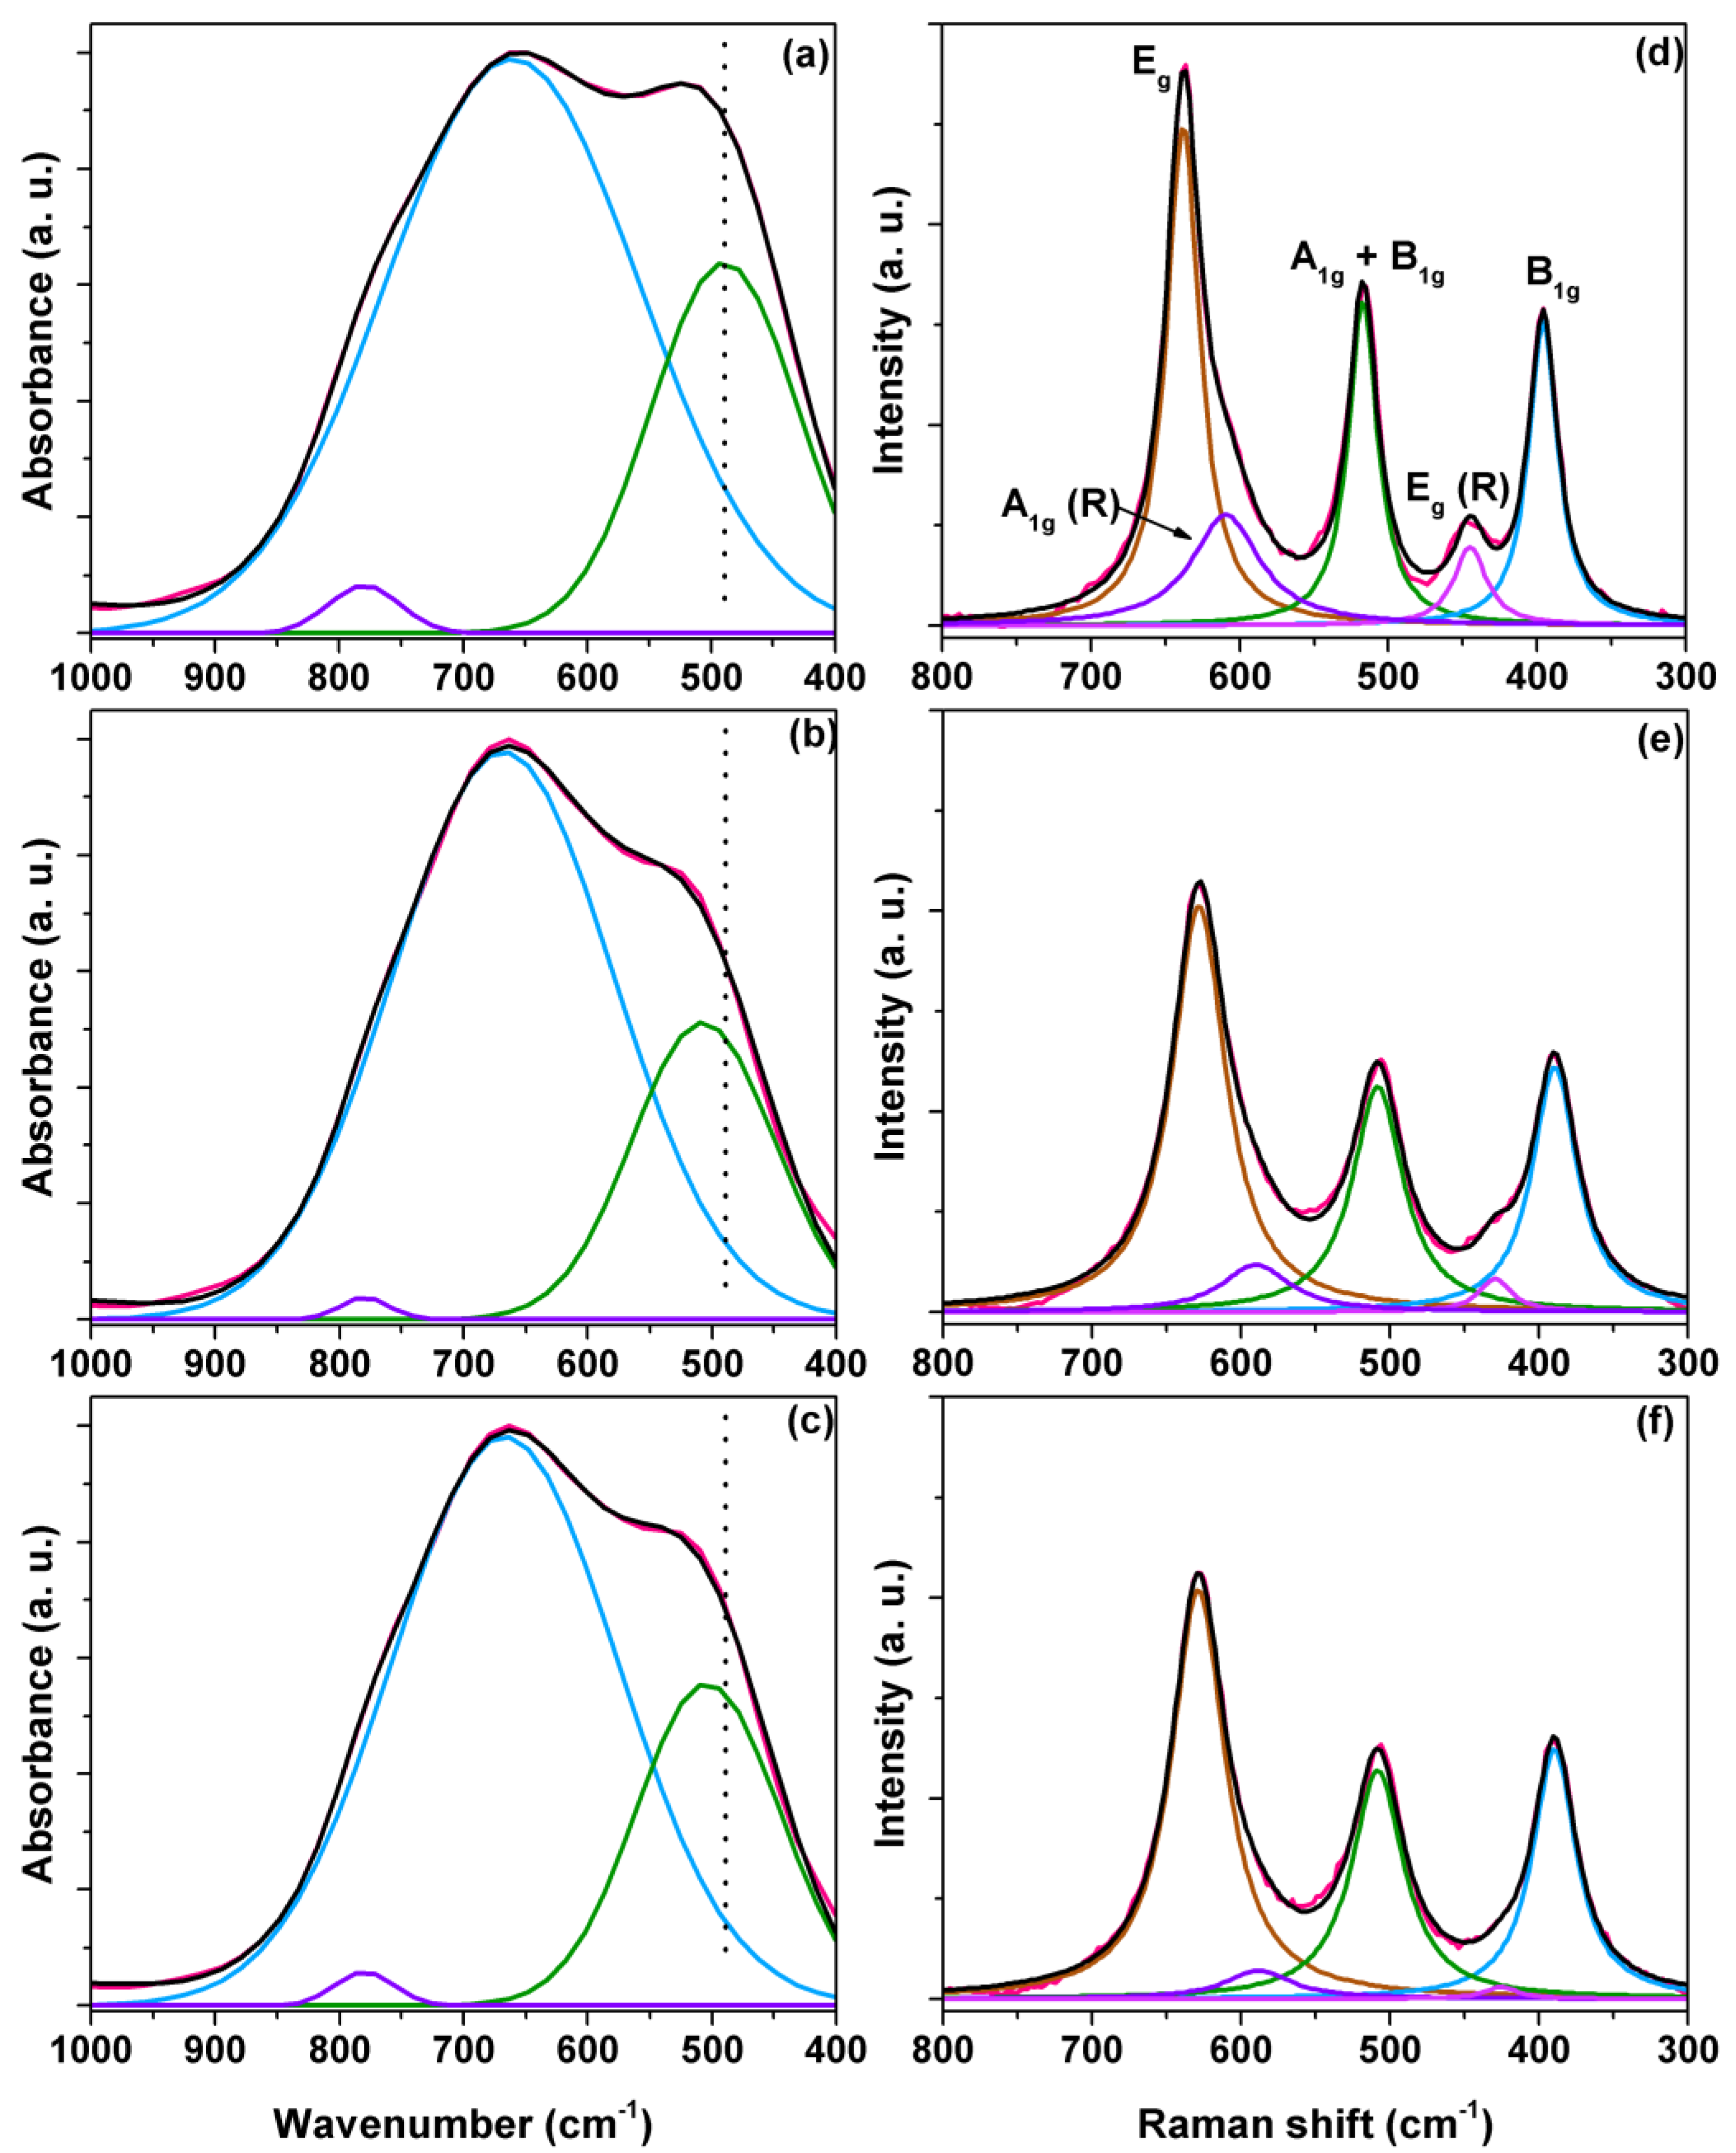
3.1. Characterization
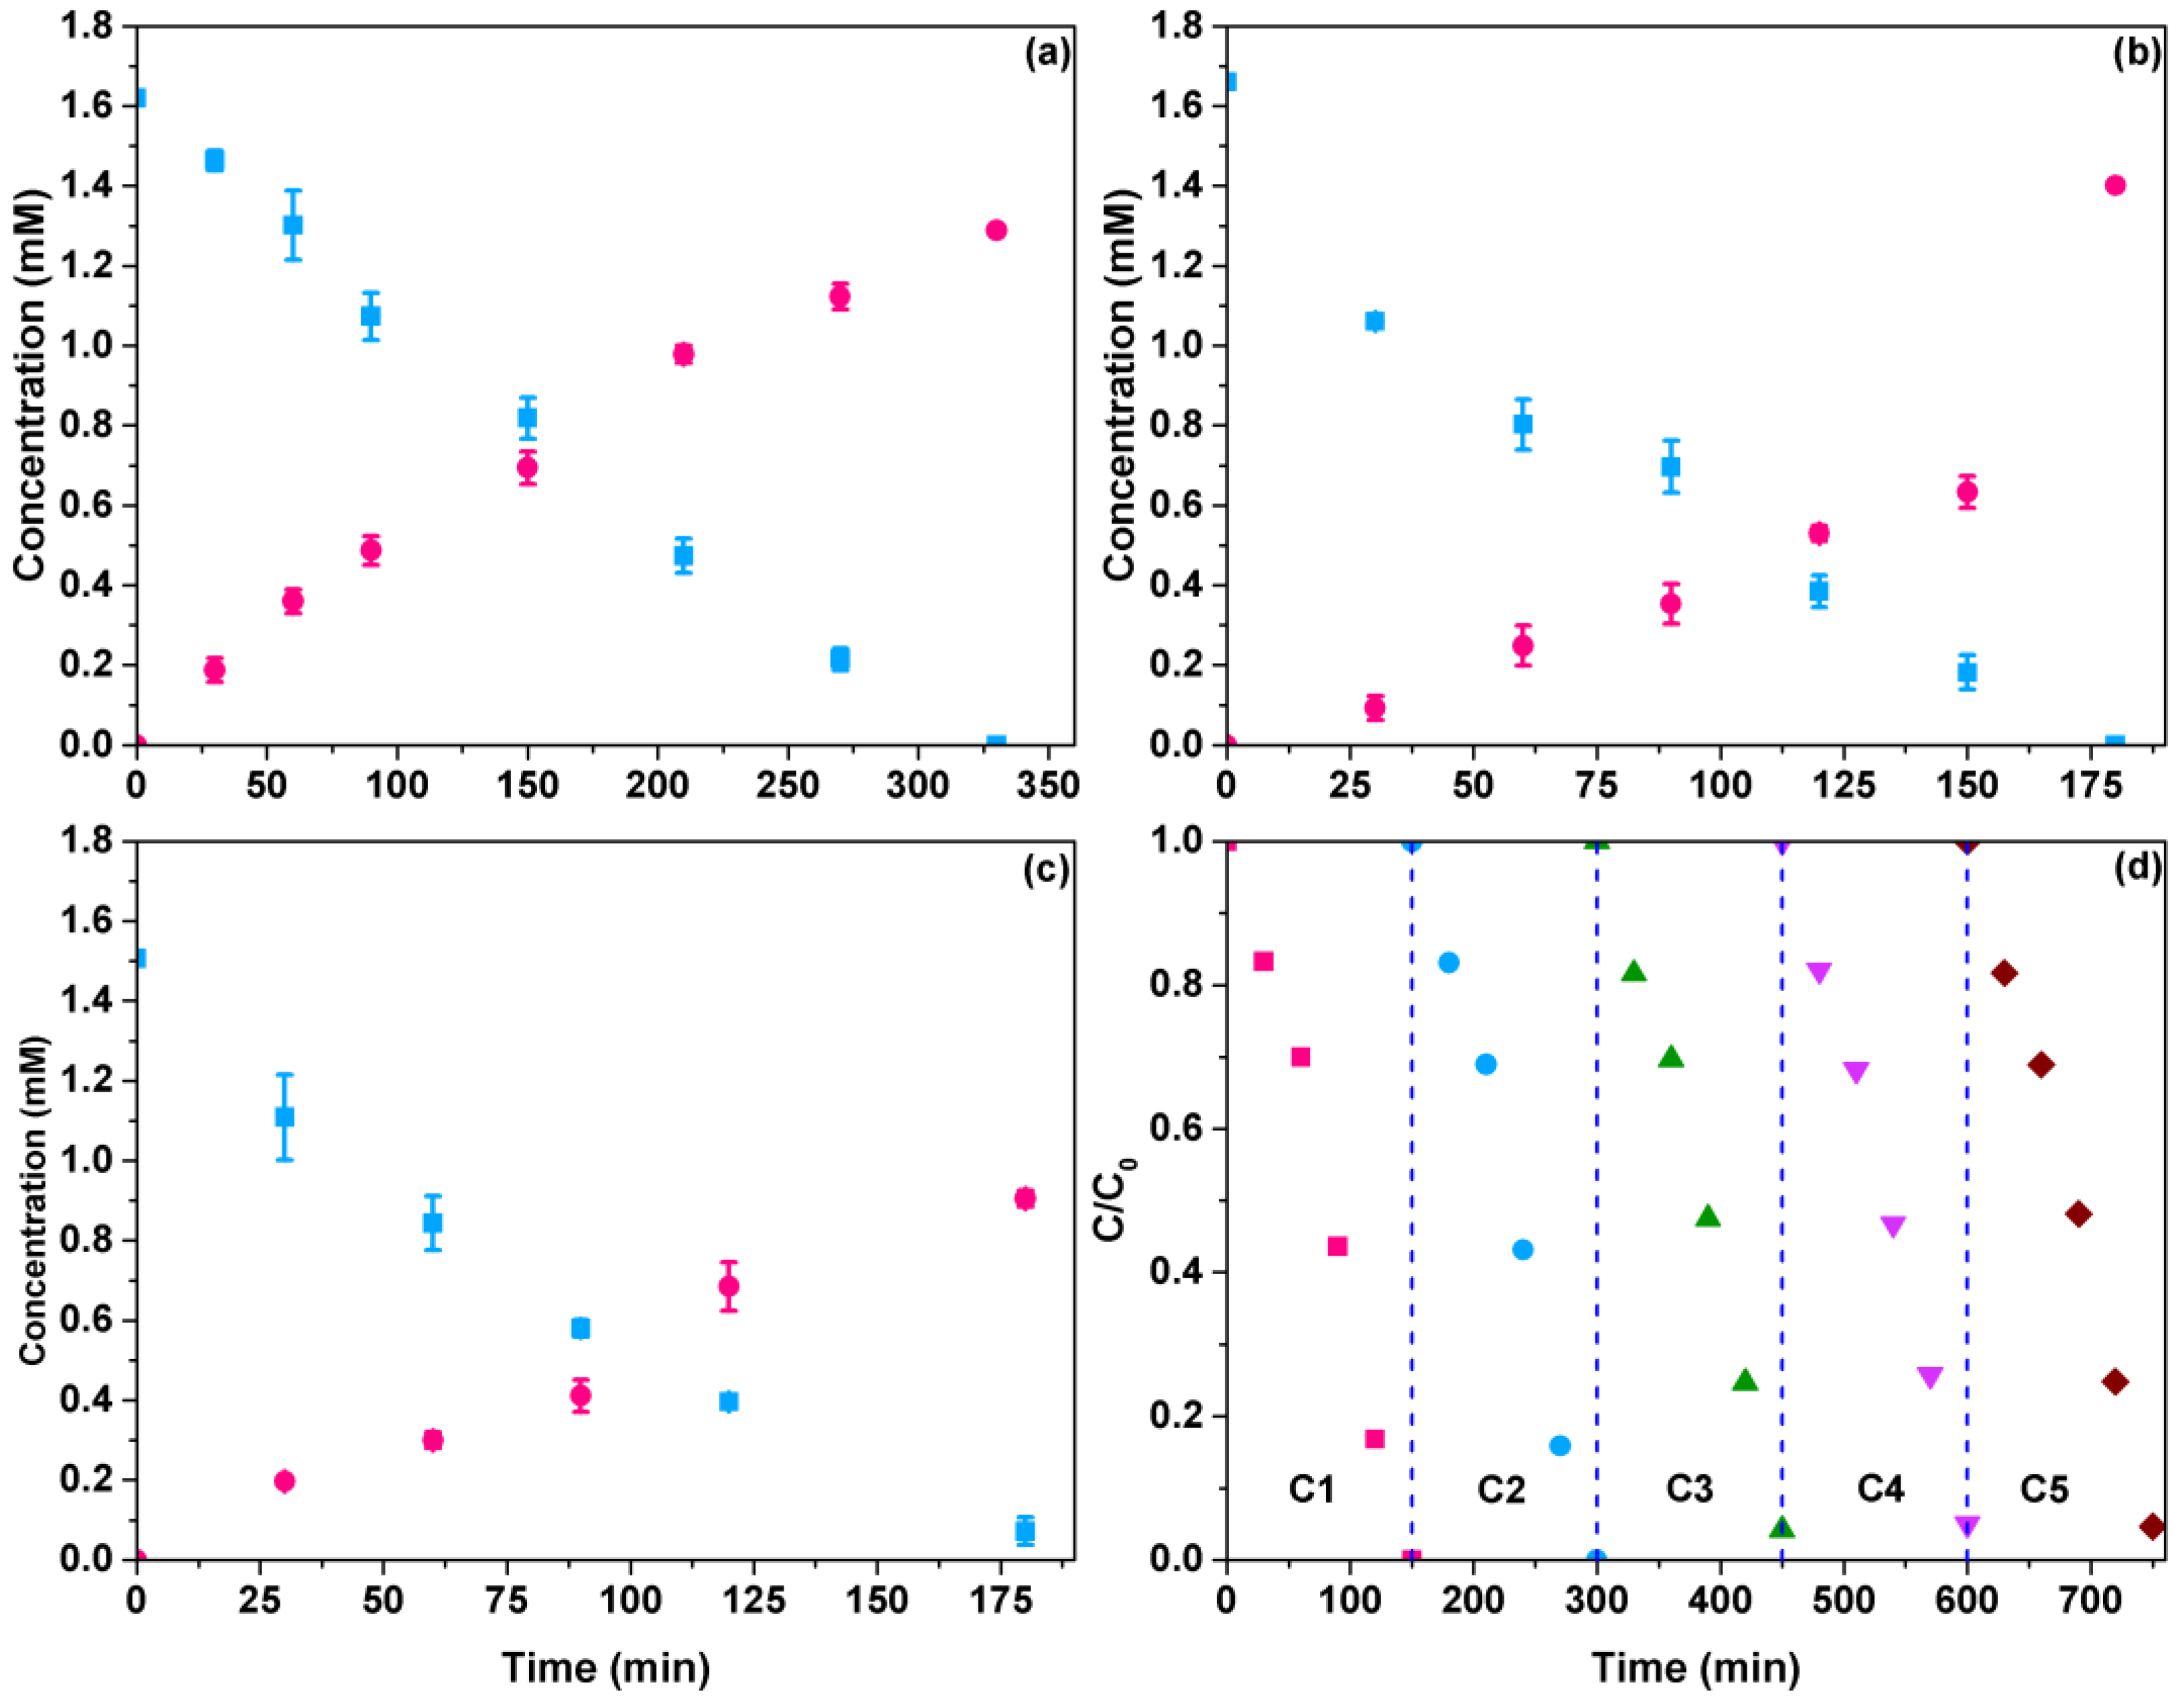
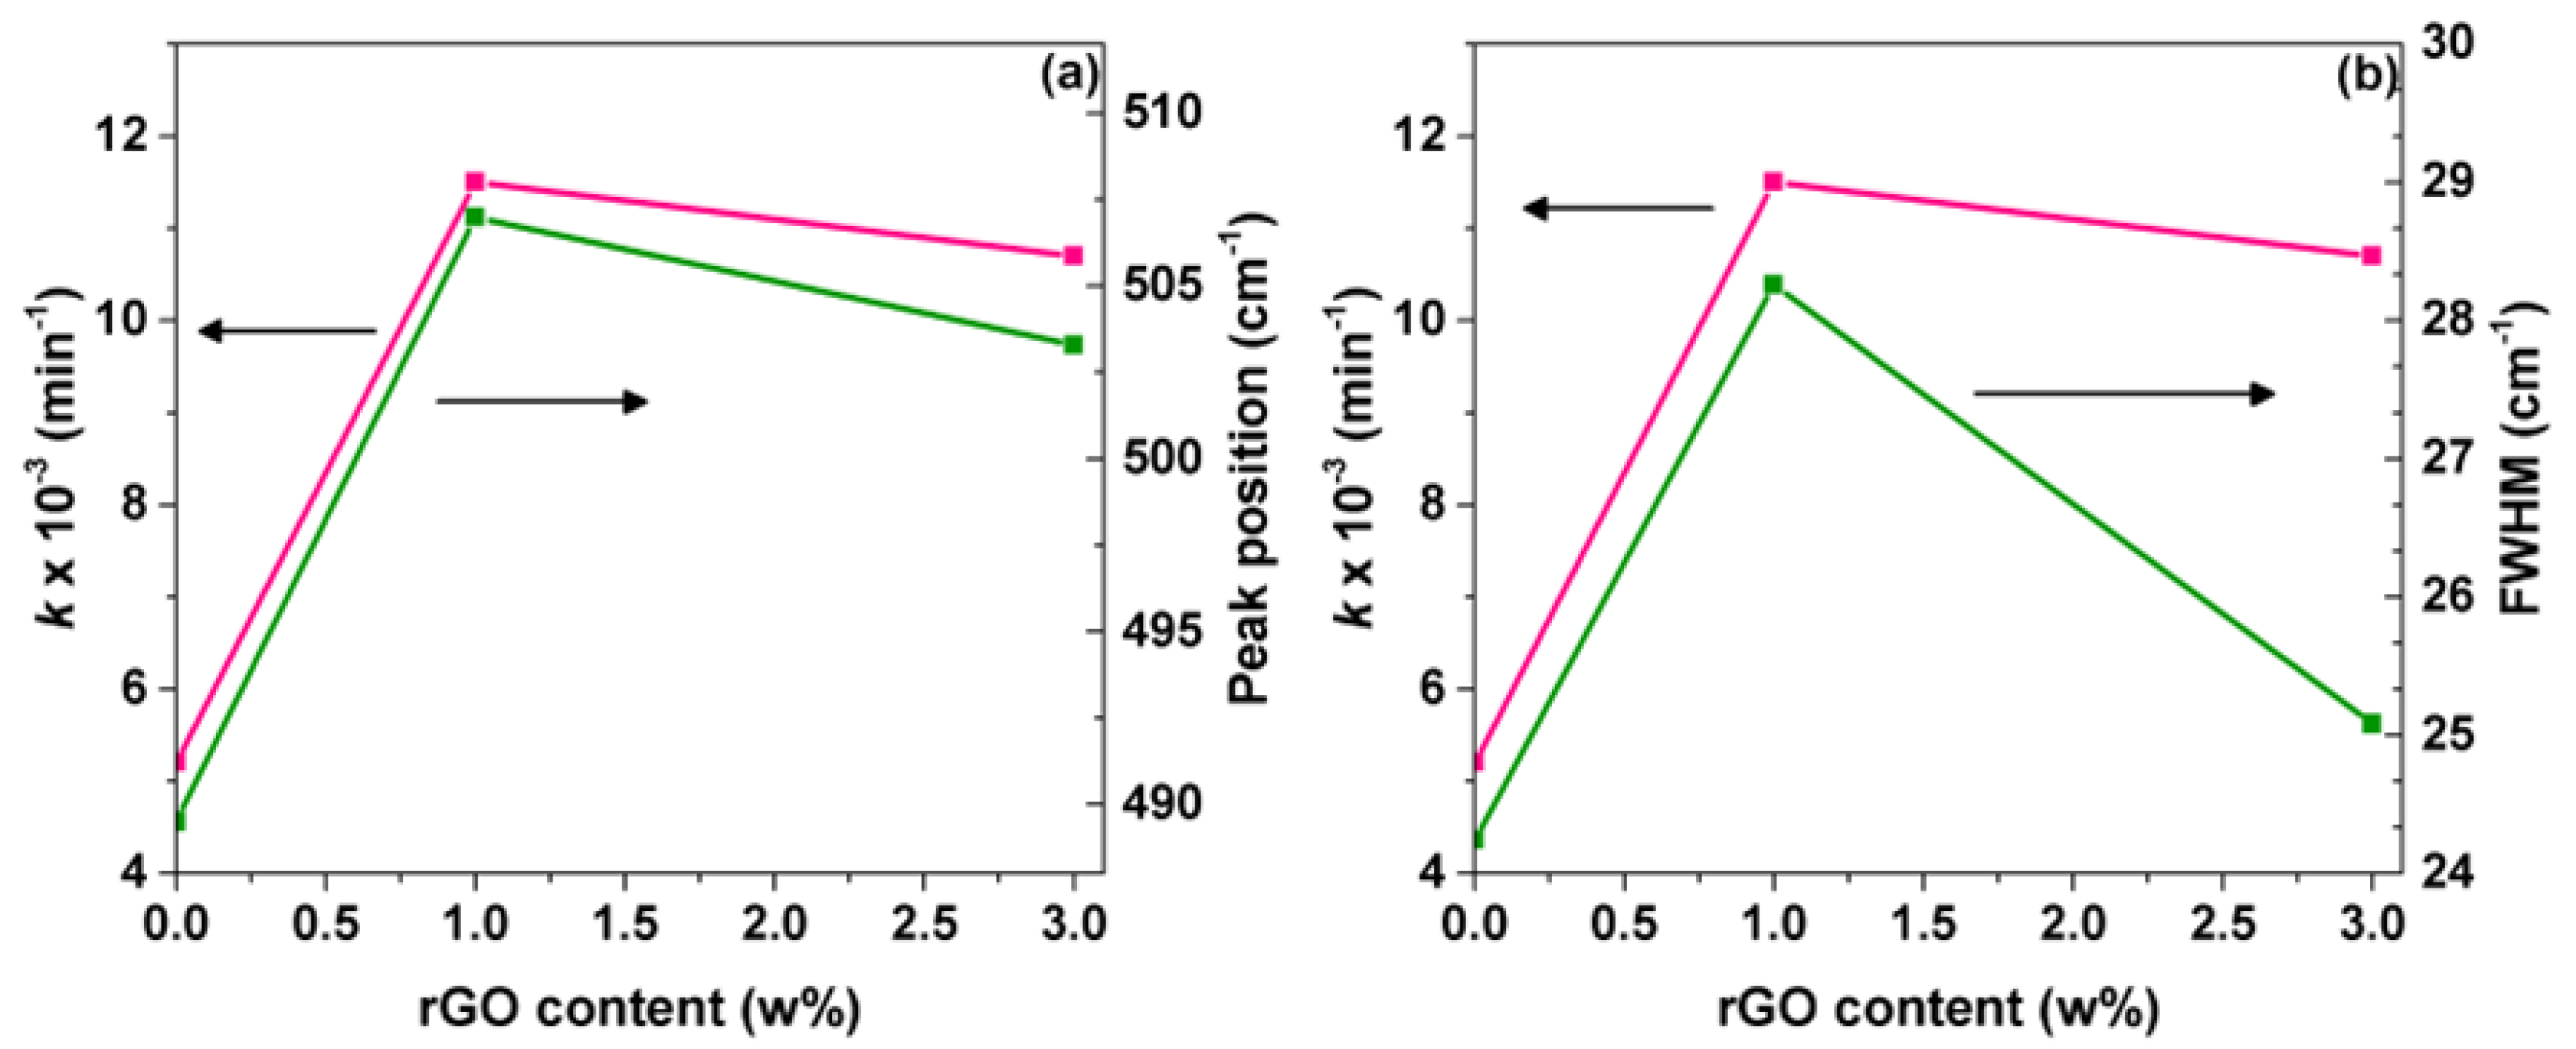
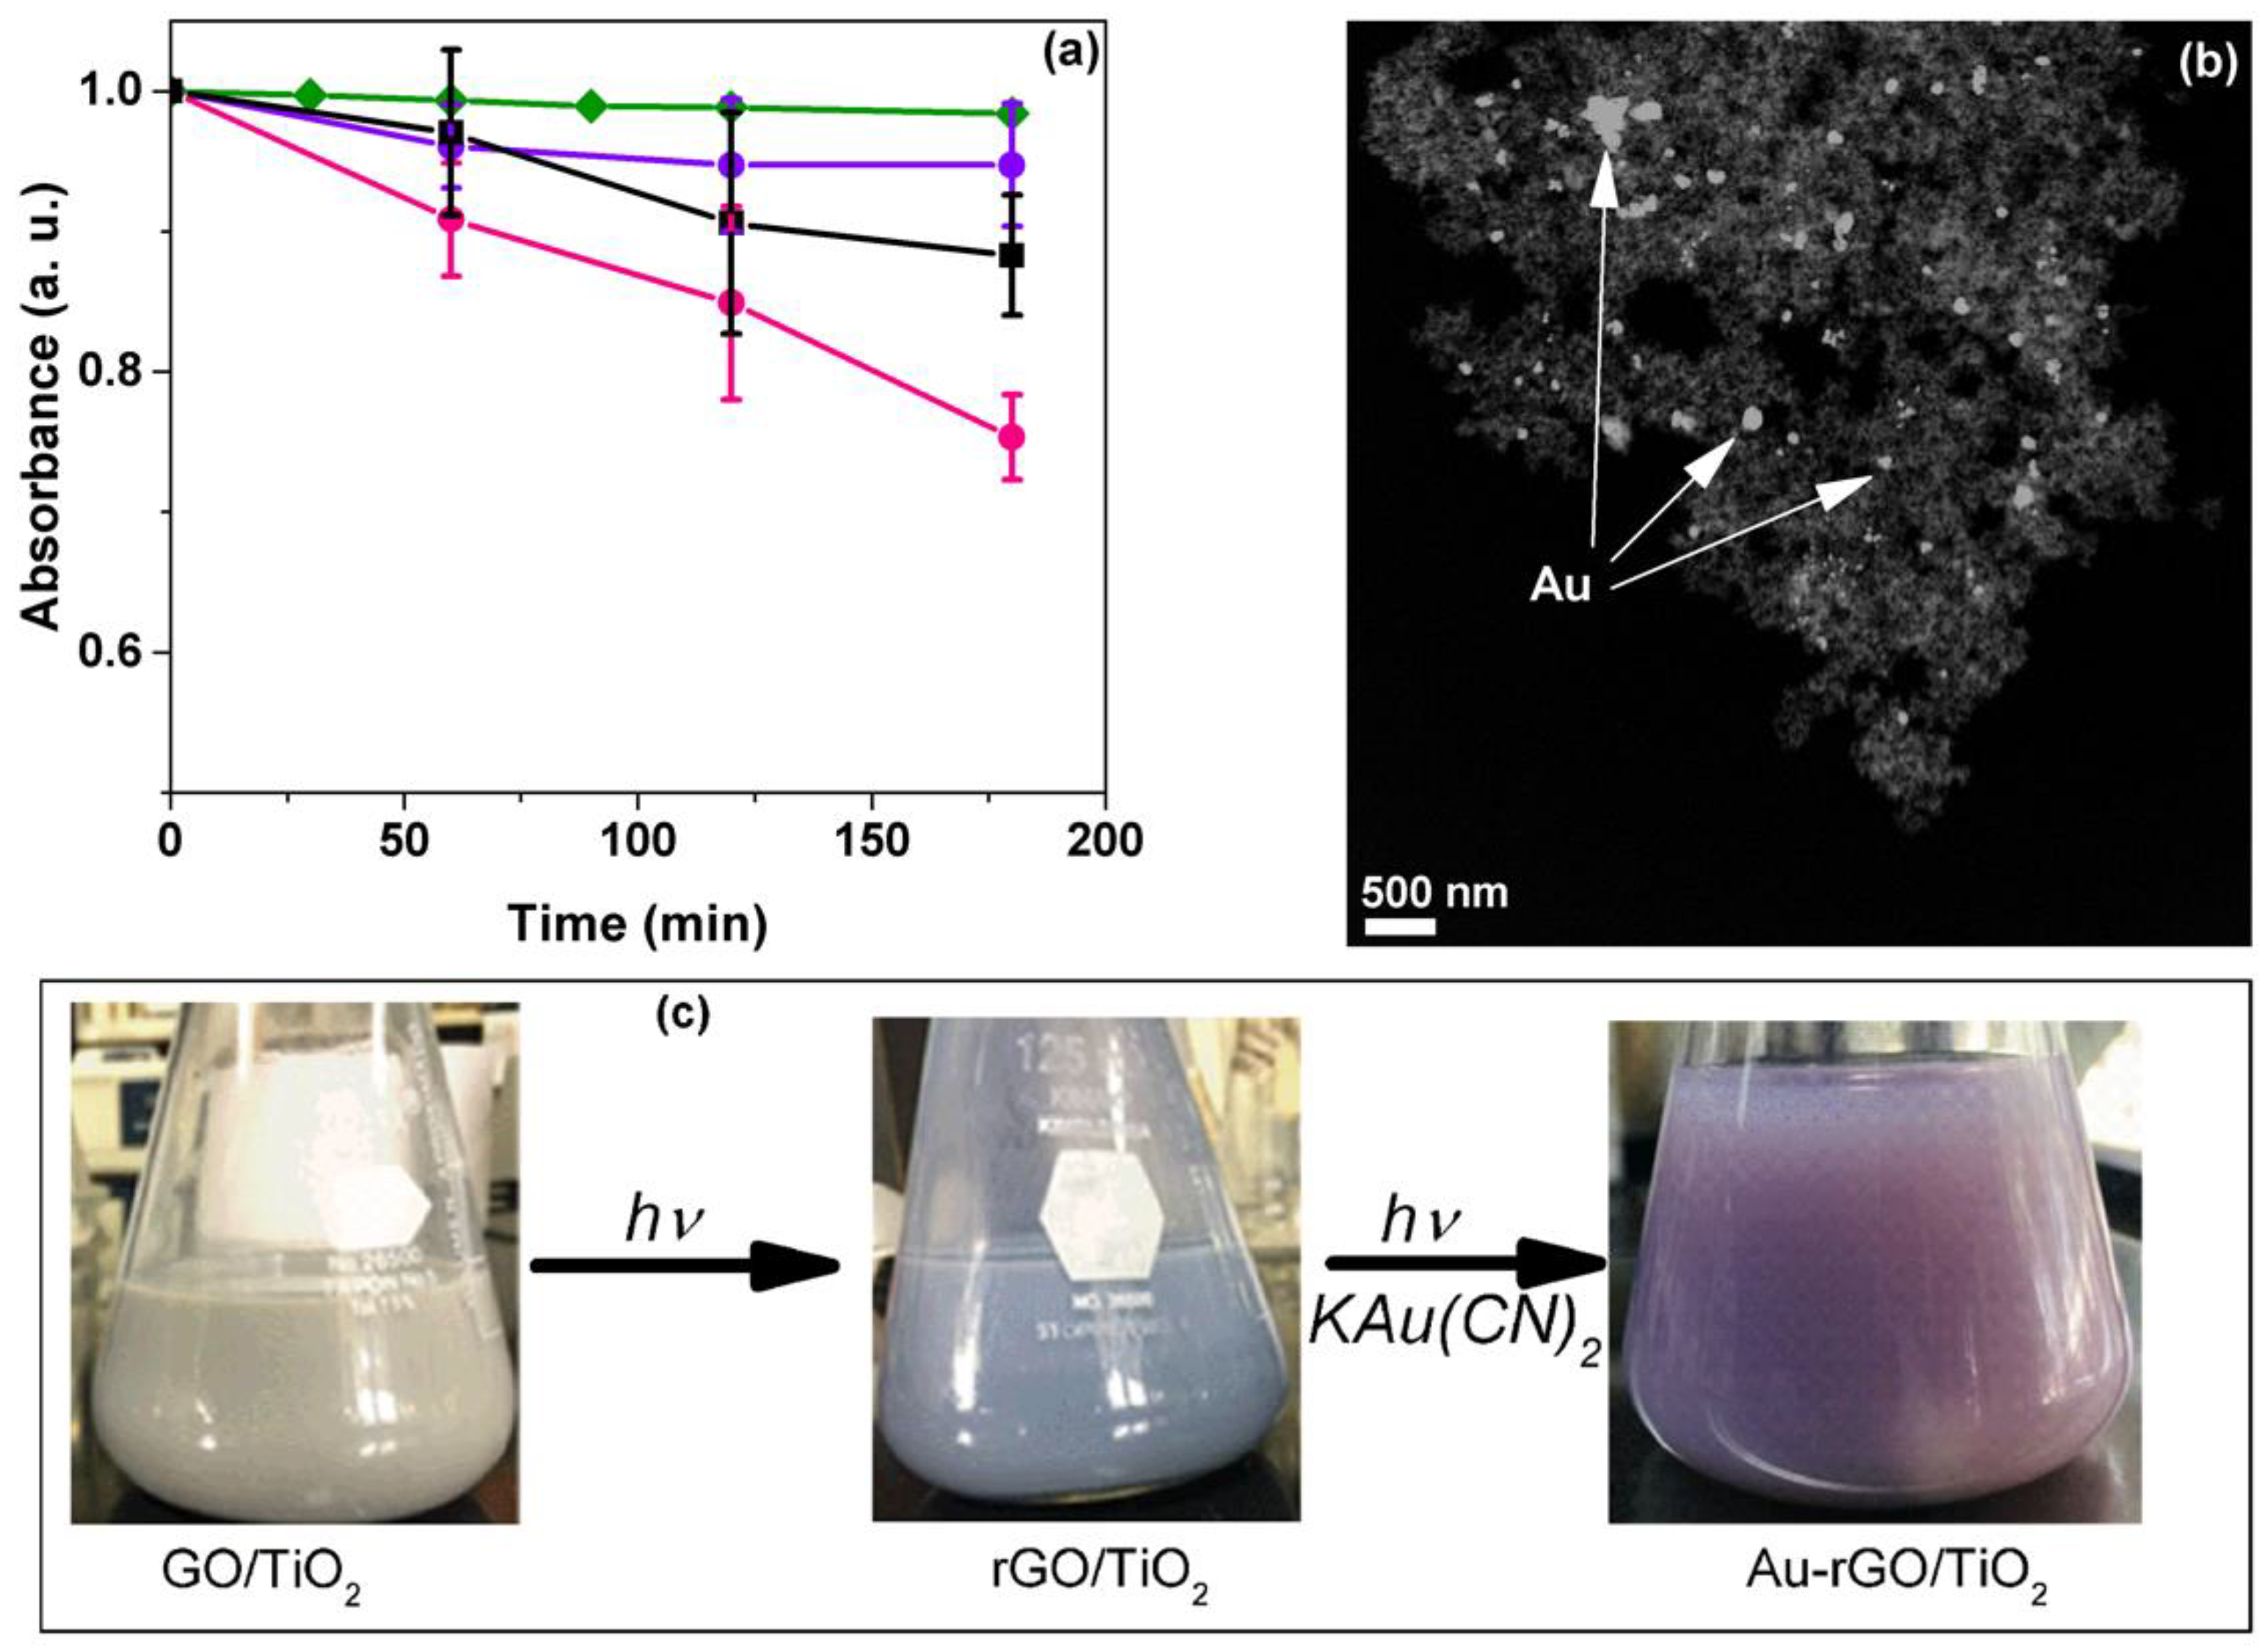
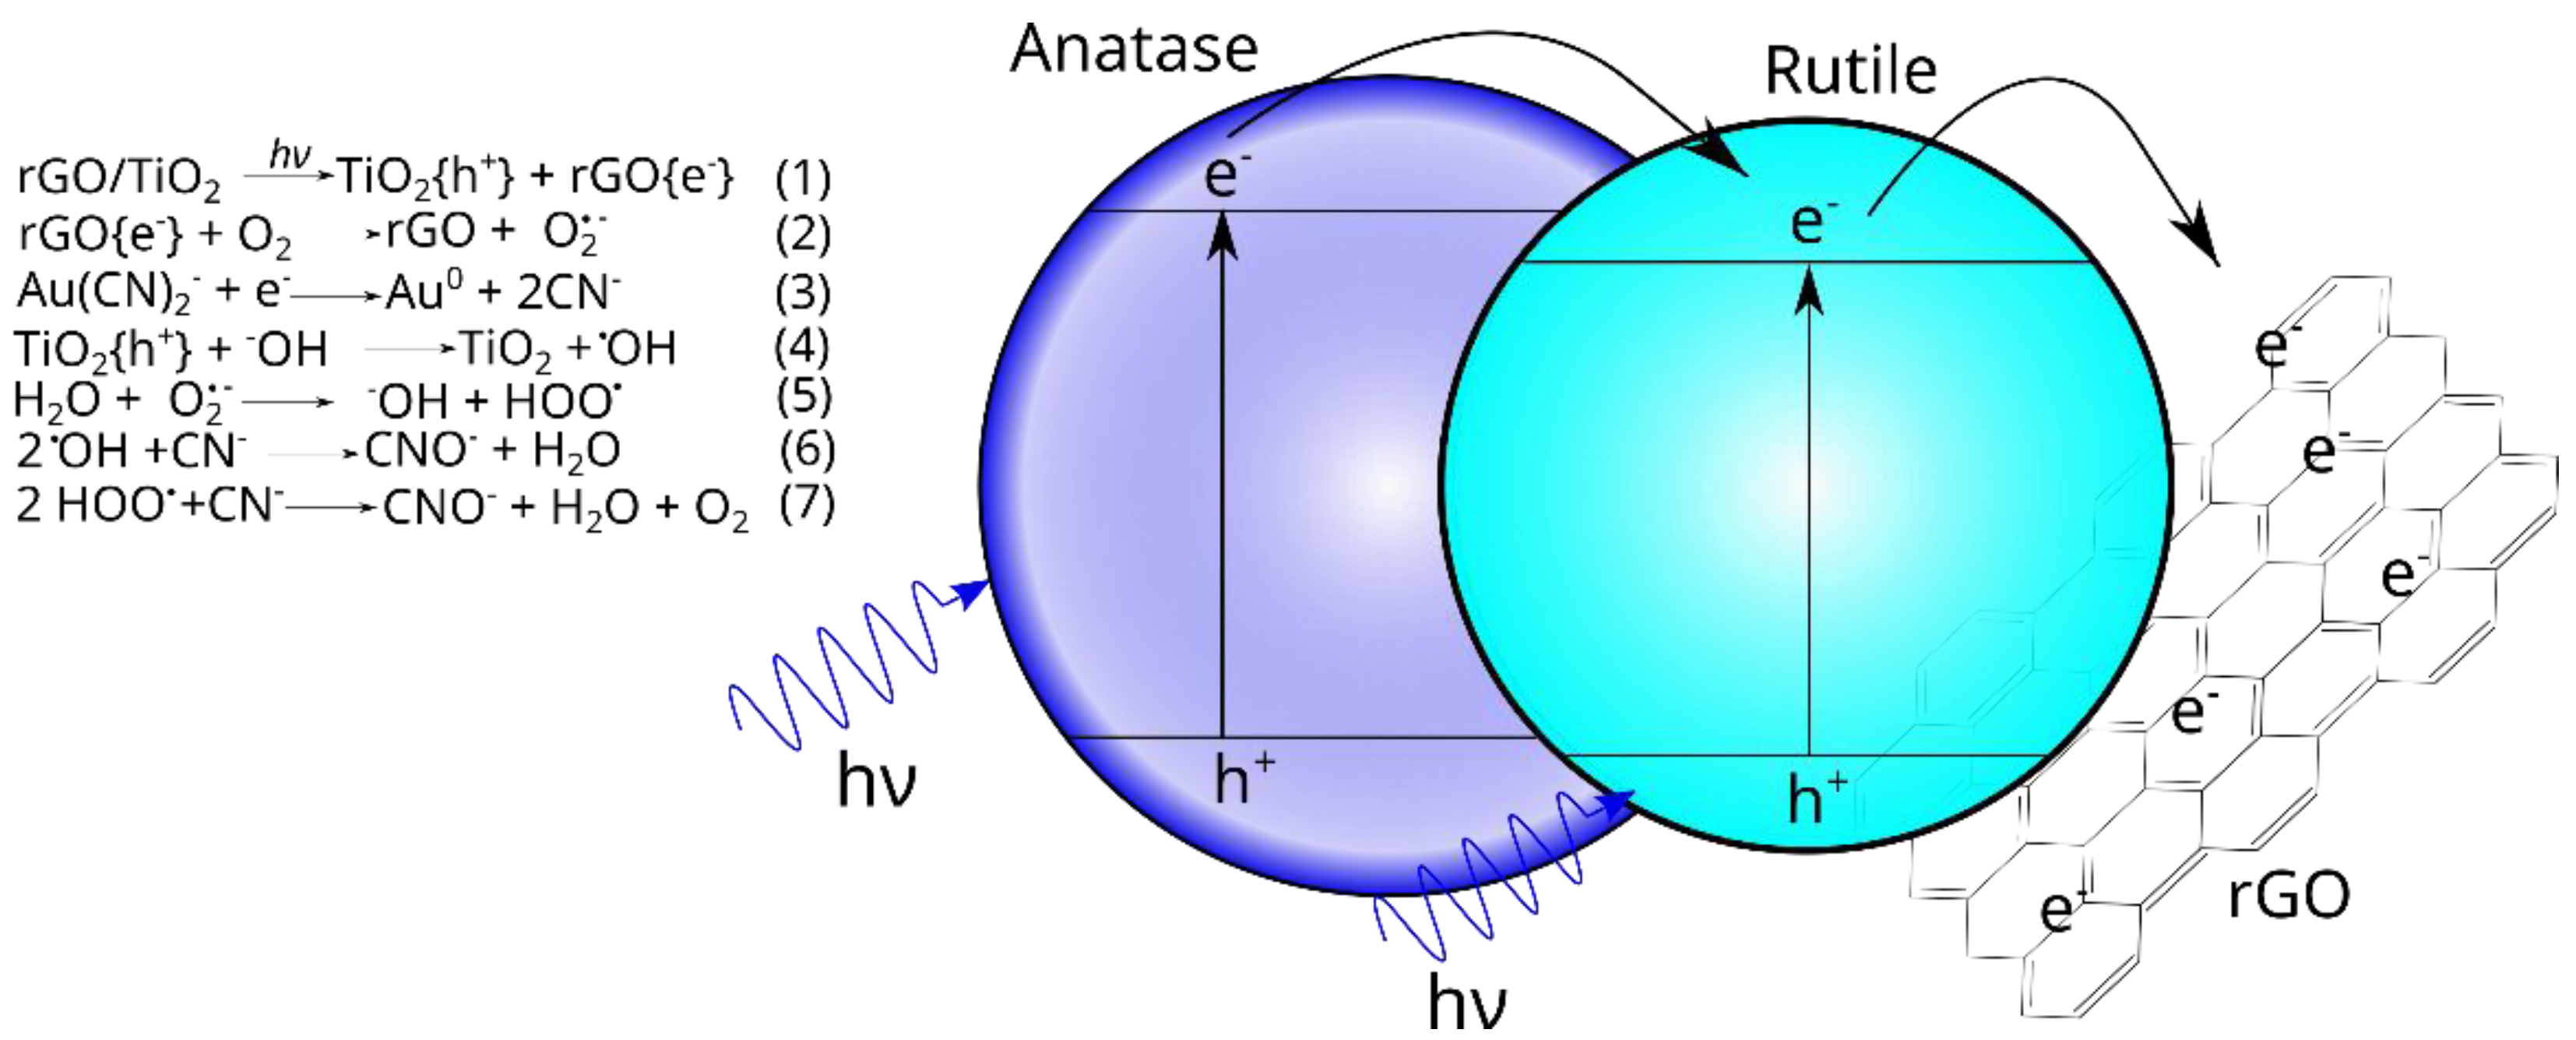
3.2. Photocatalytic Activity
4. Conclusions
Supplementary Materials
Author Contributions
Funding
Acknowledgments
Conflicts of Interest
References
- Xu, X.; Gao, B.; Jin, B.; Yue, Q. Removal of Anionic Pollutants from Liquids by Biomass Materials: A Review. J. Mol. Liq. 2016, 215, 565–595. [Google Scholar] [CrossRef]
- Dash, R.R.; Gaur, A.; Balomajumder, C. Cyanide in Industrial Wastewaters and Its Removal: A Review on Biotreatment. J. Hazard. Mater. 2009, 163, 1–11. [Google Scholar] [CrossRef] [PubMed]
- Johnson, C.A. The Fate of Cyanide in Leach Wastes at Gold Mines: An Environmental Perspective. Appl. Geochem. 2015, 57, 194–205. [Google Scholar] [CrossRef]
- Jaszczak, E.; Polkowska, Ż.; Narkowicz, S.; Namieśnik, J. Cyanides in the Environment—Analysis—Problems and Challenges. Environ. Sci. Pollut. Res. 2017, 24, 15929–15948. [Google Scholar] [CrossRef] [PubMed] [Green Version]
- Kjeldsen, P. Behaviour of Cyanides in Soil and Groundwater: A Review. Water. Air. Soil Pollut. 1999, 115, 279–308. [Google Scholar] [CrossRef] [Green Version]
- Sharma, M.; Akhter, Y.; Chatterjee, S. A Review on Remediation of Cyanide Containing Industrial Wastes Using Biological Systems with Special Reference to Enzymatic Degradation. World J. Microbiol. Biotechnol. 2019, 35, 70. [Google Scholar] [CrossRef] [PubMed]
- Baral, A.; Das, D.P.; Minakshi, M.; Ghosh, M.K.; Padhi, D.K. Probing Environmental Remediation of RhB Organic Dye Using α-MnO2 under Visible- Light Irradiation: Structural, Photocatalytic and Mineralization Studies. ChemistrySelect 2016, 1, 4277–4285. [Google Scholar] [CrossRef]
- Baral, A.B.; Dash, B.; Ghosh, M.K.; Subbaiah, T.; Minakshi, M. Pathway of Sucrose Oxidation in Manganese (Pyrolusite) Nodule. Ind. Eng. Chem. Res. 2015, 54, 12233–12241. [Google Scholar] [CrossRef]
- Betancourt-Buitrago, L.A.; Hernandez-Ramirez, A.; Colina-Marquez, J.A.; Bustillo-Lecompte, C.F.; Rehmann, L.; Machuca-Martinez, F. Recent Developments in the Photocatalytic Treatment of Cyanide Wastewater: An Approach to Remediation and Recovery of Metals. Processes 2019, 7, 225. [Google Scholar] [CrossRef] [Green Version]
- Bouras, D.; Mecif, A.; Barillé, R.; Harabi, A.; Rasheed, M.; Mahdjoub, A.; Zaabat, M. Cu:ZnO Deposited on Porous Ceramic Substrates by a Simple Thermal Method for Photocatalytic Application. Ceram. Int. 2018, 44, 21546–21555. [Google Scholar] [CrossRef] [Green Version]
- Chen, D.; Cheng, Y.; Zhou, N.; Chen, P.; Wang, Y.; Li, K.; Huo, S.; Cheng, P.; Peng, P.; Zhang, R.; et al. Photocatalytic Degradation of Organic Pollutants Using TiO2-Based Photocatalysts: A Review. J. Clean. Prod. 2020, 268, 121725. [Google Scholar] [CrossRef]
- Leary, R.; Westwood, A. Carbonaceous Nanomaterials for the Enhancement of TiO2 Photocatalysis. Carbon 2011, 49, 741–772. [Google Scholar] [CrossRef]
- Kusiak-Nejman, E.; Morawski, A.W. TiO2/Graphene-Based Nanocomposites for Water Treatment: A Brief Overview of Charge Carrier Transfer, Antimicrobial and Photocatalytic Performance. Appl. Catal. B Environ. 2019, 253, 179–186. [Google Scholar] [CrossRef]
- Morales-Torres, S.; Pastrana-Martínez, L.M.; Figueiredo, J.L.; Faria, J.L.; Silva, A.M.T. Design of Graphene-Based TiO2 Photocatalysts—a Review. Environ. Sci. Pollut. Res. 2012, 19, 3676–3687. [Google Scholar] [CrossRef] [PubMed]
- Mohamed, H.H.; Alsanea, A.A. TiO2/Carbon Dots Decorated Reduced Graphene Oxide Composites from Waste Car Bumper and TiO2 Nanoparticles for Photocatalytic Applications. Arab. J. Chem. 2020, 13, 3082–3091. [Google Scholar] [CrossRef]
- Manickam, M.; Singh, P.; Issa, T.B.; Thurgate, S. Electrochemical Behavior of Anatase TiO2 in Aqueous Lithium Hydroxide Electrolyte. J. Appl. Electrochem. 2006, 36, 599–602. [Google Scholar] [CrossRef]
- Zhang, N.; Xu, Y.-J. The Endeavour to Advance Graphene–Semiconductor Composite-Based Photocatalysis. CrystEngComm 2015, 18, 24–37. [Google Scholar] [CrossRef]
- Mamba, G.; Gangashe, G.; Moss, L.; Hariganesh, S.; Thakur, S.; Vadivel, S.; Mishra, A.K.; Vilakati, G.D.; Muthuraj, V.; Nkambule, T.T.I. State of the Art on the Photocatalytic Applications of Graphene Based Nanostructures: From Elimination of Hazardous Pollutants to Disinfection and Fuel Generation. J. Environ. Chem. Eng. 2020, 8, 103505. [Google Scholar] [CrossRef]
- Rasheed, M.; Shihab, S.; Sabah, O.W. An Investigation of the Structural, Electrical and Optical Properties of Graphene-Oxide Thin Films Using Different Solvents. J. Phys. Conf. Ser. 2021, 1795, 012052. [Google Scholar] [CrossRef]
- Singh, P.; Shandilya, P.; Raizada, P.; Sudhaik, A.; Rahmani-Sani, A.; Hosseini-Bandegharaei, A. Review on Various Strategies for Enhancing Photocatalytic Activity of Graphene Based Nanocomposites for Water Purification. Arab. J. Chem. 2020, 13, 3498–3520. [Google Scholar] [CrossRef]
- Thakur, K.; Kandasubramanian, B. Graphene and Graphene Oxide-Based Composites for Removal of Organic Pollutants: A Review. J. Chem. Eng. Data 2019, 64, 833–867. [Google Scholar] [CrossRef]
- Zhang, Y.; Zhang, Y.; Huang, Y.; Chen, X.; Cui, H.; Wang, M. Enhanced Photocatalytic Reaction and Mechanism for Treating Cyanide-Containing Wastewater by Silicon-Based Nano-Titania. Hydrometallurgy 2020, 198, 105512. [Google Scholar] [CrossRef]
- Barrera-Andrade, J.M.; Rojas-García, E.; García-Valdés, J.; Valenzuela, M.A.; Albiter, E. Incorporation of Amide Functional Groups to Graphene Oxide during the Photocatalytic Degradation of Free Cyanide. Mater. Lett. 2020, 280, 128538. [Google Scholar] [CrossRef]
- Yang, L.; Jia, F.; Yang, B.; Song, S. Efficient Adsorption of Au(CN)2− from Gold Cyanidation with Graphene Oxide-Polyethylenimine Hydrogel as Adsorbent. Results Phys. 2017, 7, 4089–4095. [Google Scholar] [CrossRef]
- Hummers, W.S.; Offeman, R.E. Preparation of Graphitic Oxide. J. Am. Chem. Soc. 1958, 80, 1339. [Google Scholar] [CrossRef]
- Liang, D.; Cui, C.; Hu, H.; Wang, Y.; Xu, S.; Ying, B.; Li, P.; Lu, B.; Shen, H. One-Step Hydrothermal Synthesis of Anatase TiO2/Reduced Graphene Oxide Nanocomposites with Enhanced Photocatalytic Activity. J. Alloys Compd. 2014, 582, 236–240. [Google Scholar] [CrossRef]
- Kudin, K.N.; Ozbas, B.; Schniepp, H.C.; Prud’homme, R.K.; Aksay, I.A.; Car, R. Raman Spectra of Graphite Oxide and Functionalized Graphene Sheets. Nano Lett. 2008, 8, 36–41. [Google Scholar] [CrossRef] [PubMed]
- Tolosana-Moranchel, A.; Casas, J.A.; Bahamonde, A.; Pascual, L.; Granone, L.I.; Schneider, J.; Dillert, R.; Bahnemann, D.W. Nature and Photoreactivity of TiO2-RGO Nanocomposites in Aqueous Suspensions under UV-A Irradiation. Appl. Catal. B Environ. 2019, 241, 375–384. [Google Scholar] [CrossRef]
- Shen, J.; Yan, B.; Shi, M.; Ma, H.; Li, N.; Ye, M. One Step Hydrothermal Synthesis of TiO2-Reduced Graphene Oxide Sheets. J. Mater. Chem. 2011, 21, 3415–3421. [Google Scholar] [CrossRef]
- Chen, Y.; Gao, H.; Xiang, J.; Dong, X.; Cao, Y. Enhanced Photocatalytic Activities of TiO2-Reduced Graphene Oxide Nanocomposites Controlled by TiOC Interfacial Chemical Bond. Mater. Res. Bull. 2018, 99, 29–36. [Google Scholar] [CrossRef]
- Khamboonrueang, D.; Srirattanapibul, S.; Tang, I.-M.; Thongmee, S. TiO2∙rGO Nanocomposite as a Photo Catalyst for the Reduction of Cr6+. Mater. Res. Bull. 2018, 107, 236–241. [Google Scholar] [CrossRef]
- Gillespie, P.N.O.; Martsinovich, N. Origin of Charge Trapping in TiO2/Reduced Graphene Oxide Photocatalytic Composites: Insights from Theory. ACS Appl. Mater. Interfaces 2019, 11, 31909–31922. [Google Scholar] [CrossRef] [PubMed] [Green Version]
- Zhang, Y.; Pan, C. TiO2/Graphene Composite from Thermal Reaction of Graphene Oxide and Its Photocatalytic Activity in Visible Light. J. Mater. Sci. 2011, 46, 2622–2626. [Google Scholar] [CrossRef]
- Zhang, Y.; Hou, X.; Sun, T.; Zhao, X. Calcination of Reduced Graphene Oxide Decorated TiO2 Composites for Recovery and Reuse in Photocatalytic Applications. Ceram. Int. 2017, 43, 1150–1159. [Google Scholar] [CrossRef]
- Ruidíaz-Martínez, M.; Álvarez, M.A.; López-Ramón, M.V.; Cruz-Quesada, G.; Rivera-Utrilla, J.; Sánchez-Polo, M. Hydrothermal Synthesis of RGO-TiO2 Composites as High-Performance UV Photocatalysts for Ethylparaben Degradation. Catalysts 2020, 10, 520. [Google Scholar] [CrossRef]
- Li, W.; Liu, X.; Li, H. Hydrothermal Synthesis of Graphene/Fe3+-Doped TiO2 Nanowire Composites with Highly Enhanced Photocatalytic Activity under Visible Light Irradiation. J. Mater. Chem. A 2015, 3, 15214–15224. [Google Scholar] [CrossRef]
- Shahbazi, R.; Payan, A.; Fattahi, M. Preparation, Evaluations and Operating Conditions Optimization of Nano TiO2 over Graphene Based Materials as the Photocatalyst for Degradation of Phenol. J. Photochem. Photobiol. Chem. 2018, 364, 564–576. [Google Scholar] [CrossRef]
- Tauc, J.; Menth, A. States in the Gap. J. Non-Cryst. Solids 1972, 8–10, 569–585. [Google Scholar] [CrossRef]
- Sui, X.; Li, X.; Ni, T.; Lin, F.; Li, G. Carbonaceous–TiO2 Materials: Unique Morphologies for Photocatalytic Applications. J. Mater. Sci. 2020, 55, 2725–2740. [Google Scholar] [CrossRef]
- Liu, B.; Zhao, X.; Wen, L. The Structural and Photoluminescence Studies Related to the Surface of the TiO2 Sol Prepared by Wet Chemical Method. Mater. Sci. Eng. B 2006, 134, 27–31. [Google Scholar] [CrossRef]
- Biswas, S.; Kar, A.K. Photocatalytic Performance of Hydrothermal Temperature Dependent Dip Coated TiO2 Thin Films. J. Sol-Gel Sci. Technol. 2022, 102, 649–664. [Google Scholar] [CrossRef]
- Kim, S.H.; Lee, S.W.; Lee, G.M.; Lee, B.-T.; Yun, S.-T.; Kim, S.-O. Monitoring of TiO2-Catalytic UV-LED Photo-Oxidation of Cyanide Contained in Mine Wastewater and Leachate. Chemosphere 2016, 143, 106–114. [Google Scholar] [CrossRef]
- Lv, K.; Fang, S.; Si, L.; Xia, Y.; Ho, W.; Li, M. Fabrication of TiO2 Nanorod Assembly Grafted RGO (RGO@TiO2-NR) Hybridized Flake-like Photocatalyst. Appl. Surf. Sci. 2017, 391, 218–227. [Google Scholar] [CrossRef]
- Liang, X.; Tao, H.; Zhang, Q.; Chang, C.-T. High Performance Photocatalytic Degradation by Graphene/Titanium Nanotubes Under Near Visible Light with Low Energy Irradiation. J. Nanosci. Nanotechnol. 2015, 15, 4887–4894. [Google Scholar] [CrossRef] [PubMed]
- Chiang, K.; Amal, R.; Tran, T. Photocatalytic Oxidation of Cyanide: Kinetic and Mechanistic Studies. J. Mol. Catal. Chem. 2003, 193, 285–297. [Google Scholar] [CrossRef]
- van Grieken, R.; Aguado, J.; López-Muñoz, M.-J.; Marugán, J. Photocatalytic Gold Recovery from Spent Cyanide Plating Bath Solutions. Gold Bull. 2005, 38, 180–187. [Google Scholar] [CrossRef] [Green Version]
- Yang, L.; Jia, F.; Song, S. Recovery of [Au(CN)2]− from Gold Cyanidation with Graphene Oxide as Adsorbent. Sep. Purif. Technol. 2017, 186, 63–69. [Google Scholar] [CrossRef]
- Tsuchida, N.; Muir, D.M. Studies on Role of Oxygen in the Adsorption of Au(CN)2− and Ag(CN)2− onto Activated Carbon. Metall. Trans. B 1986, 17, 529–533. [Google Scholar] [CrossRef]


Publisher’s Note: MDPI stays neutral with regard to jurisdictional claims in published maps and institutional affiliations. |
© 2022 by the authors. Licensee MDPI, Basel, Switzerland. This article is an open access article distributed under the terms and conditions of the Creative Commons Attribution (CC BY) license (https://creativecommons.org/licenses/by/4.0/).
Share and Cite
Albiter, E.; Barrera-Andrade, J.M.; Calzada, L.A.; García-Valdés, J.; Valenzuela, M.A.; Rojas-García, E. Enhancing Free Cyanide Photocatalytic Oxidation by rGO/TiO2 P25 Composites. Materials 2022, 15, 5284. https://doi.org/10.3390/ma15155284
Albiter E, Barrera-Andrade JM, Calzada LA, García-Valdés J, Valenzuela MA, Rojas-García E. Enhancing Free Cyanide Photocatalytic Oxidation by rGO/TiO2 P25 Composites. Materials. 2022; 15(15):5284. https://doi.org/10.3390/ma15155284
Chicago/Turabian StyleAlbiter, Elim, Jose M. Barrera-Andrade, Lina A. Calzada, Jesús García-Valdés, Miguel A. Valenzuela, and Elizabeth Rojas-García. 2022. "Enhancing Free Cyanide Photocatalytic Oxidation by rGO/TiO2 P25 Composites" Materials 15, no. 15: 5284. https://doi.org/10.3390/ma15155284