
Corrosion Resistance of 3D Printed Ti6Al4V Gyroid Lattices with Varying Porosity


Abstract
:1. Introduction
2. Materials and Methods
2.1. Sample Preparation
2.2. Cyclic Potentiodynamic Polarisation (CPP)
2.3. Post Corrosion Analysis
3. Results
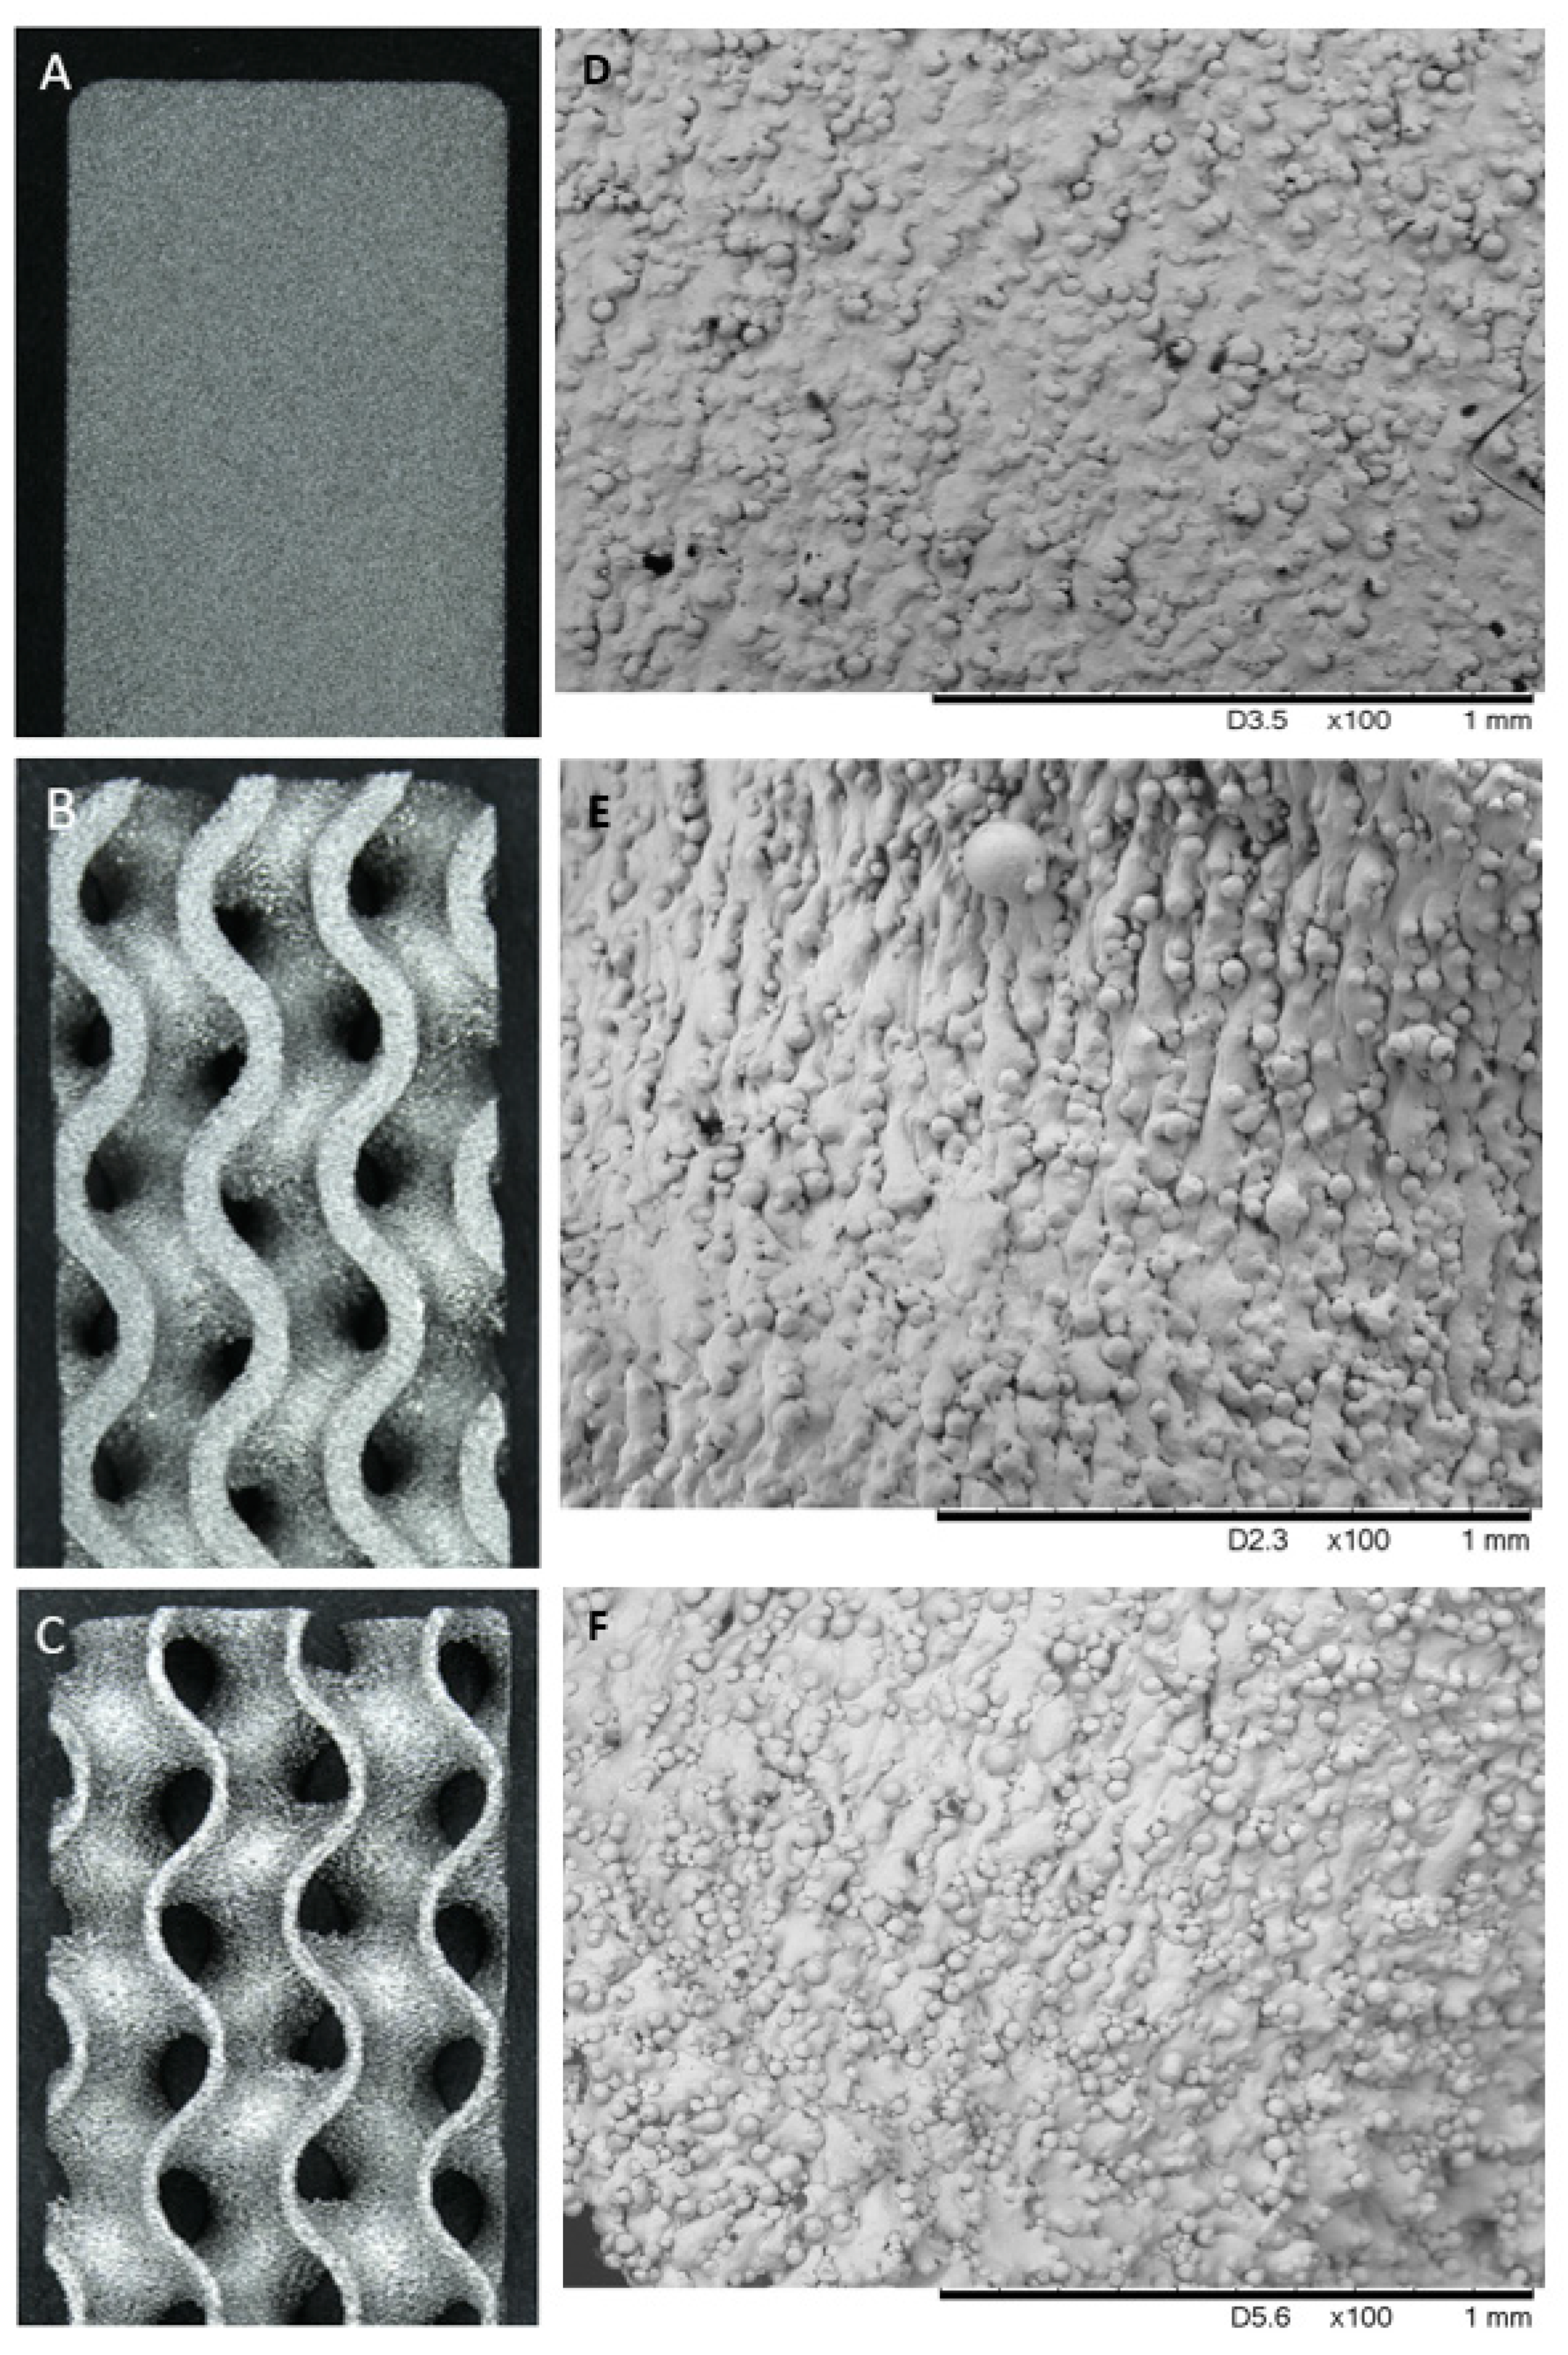
3.1. Pre-Corrosion Analysis
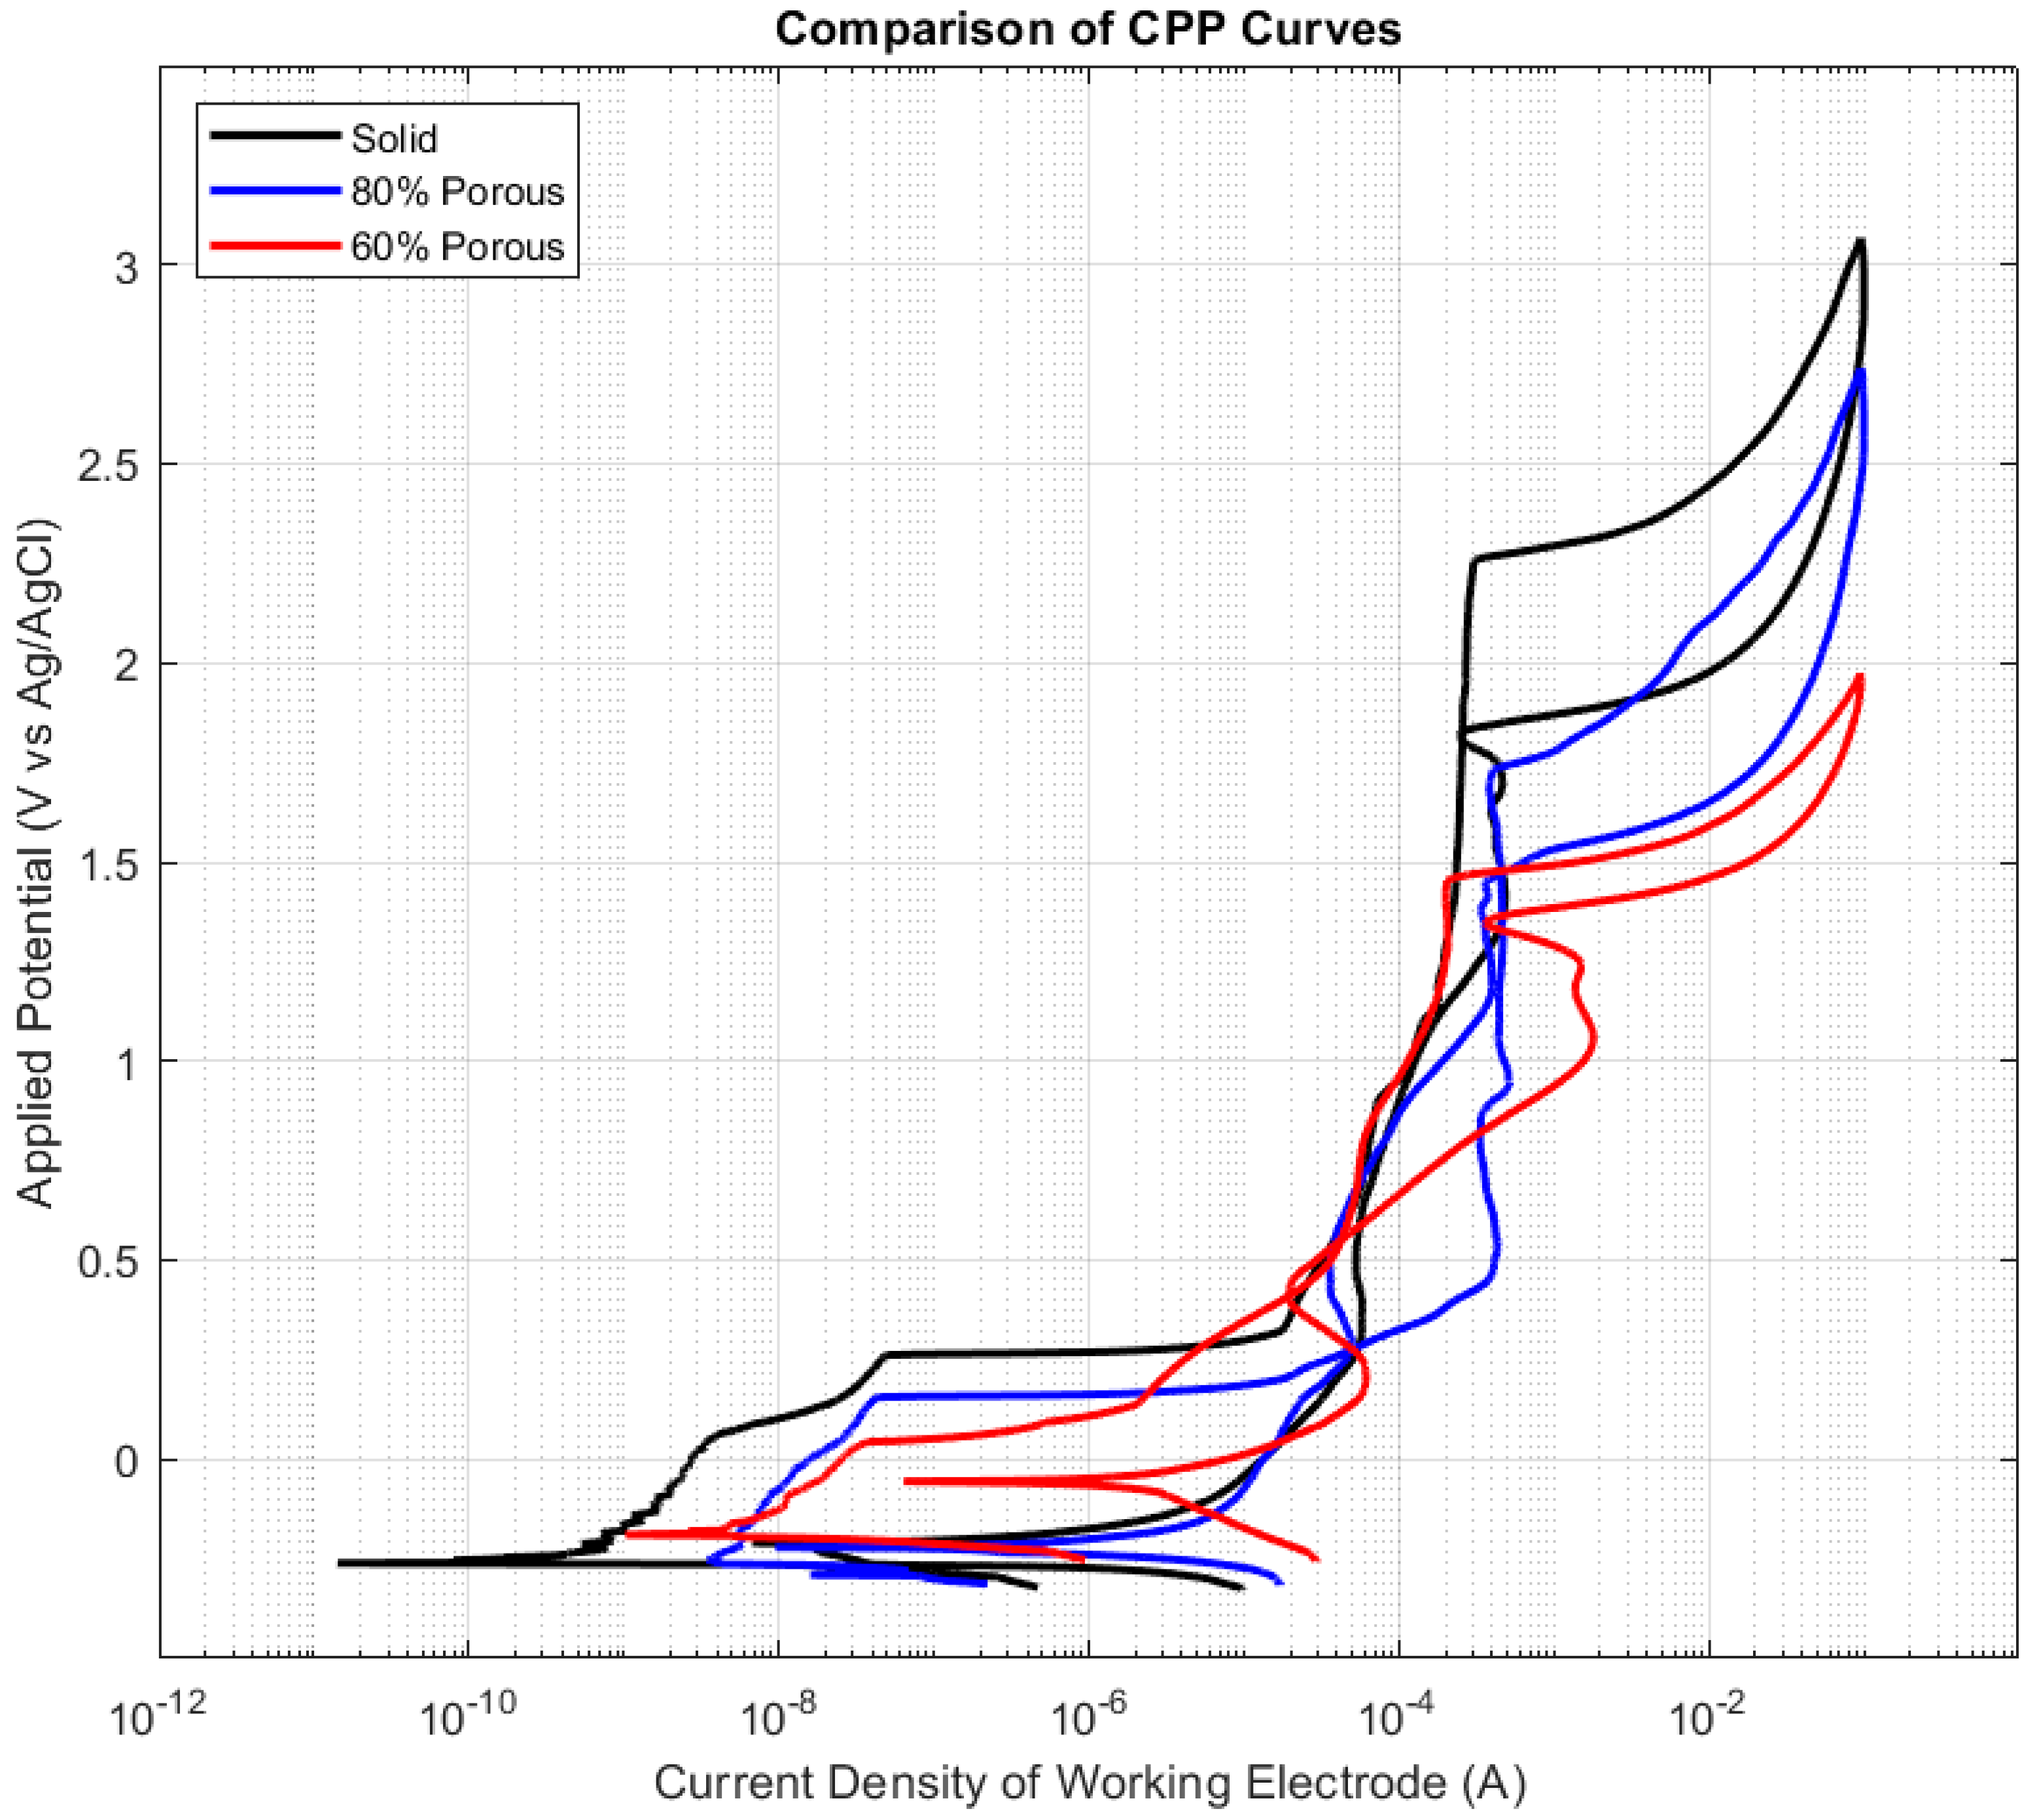
3.2. Polarisation Results
3.3. Tafel Plot Results
3.4. Post Corrosion Analysis
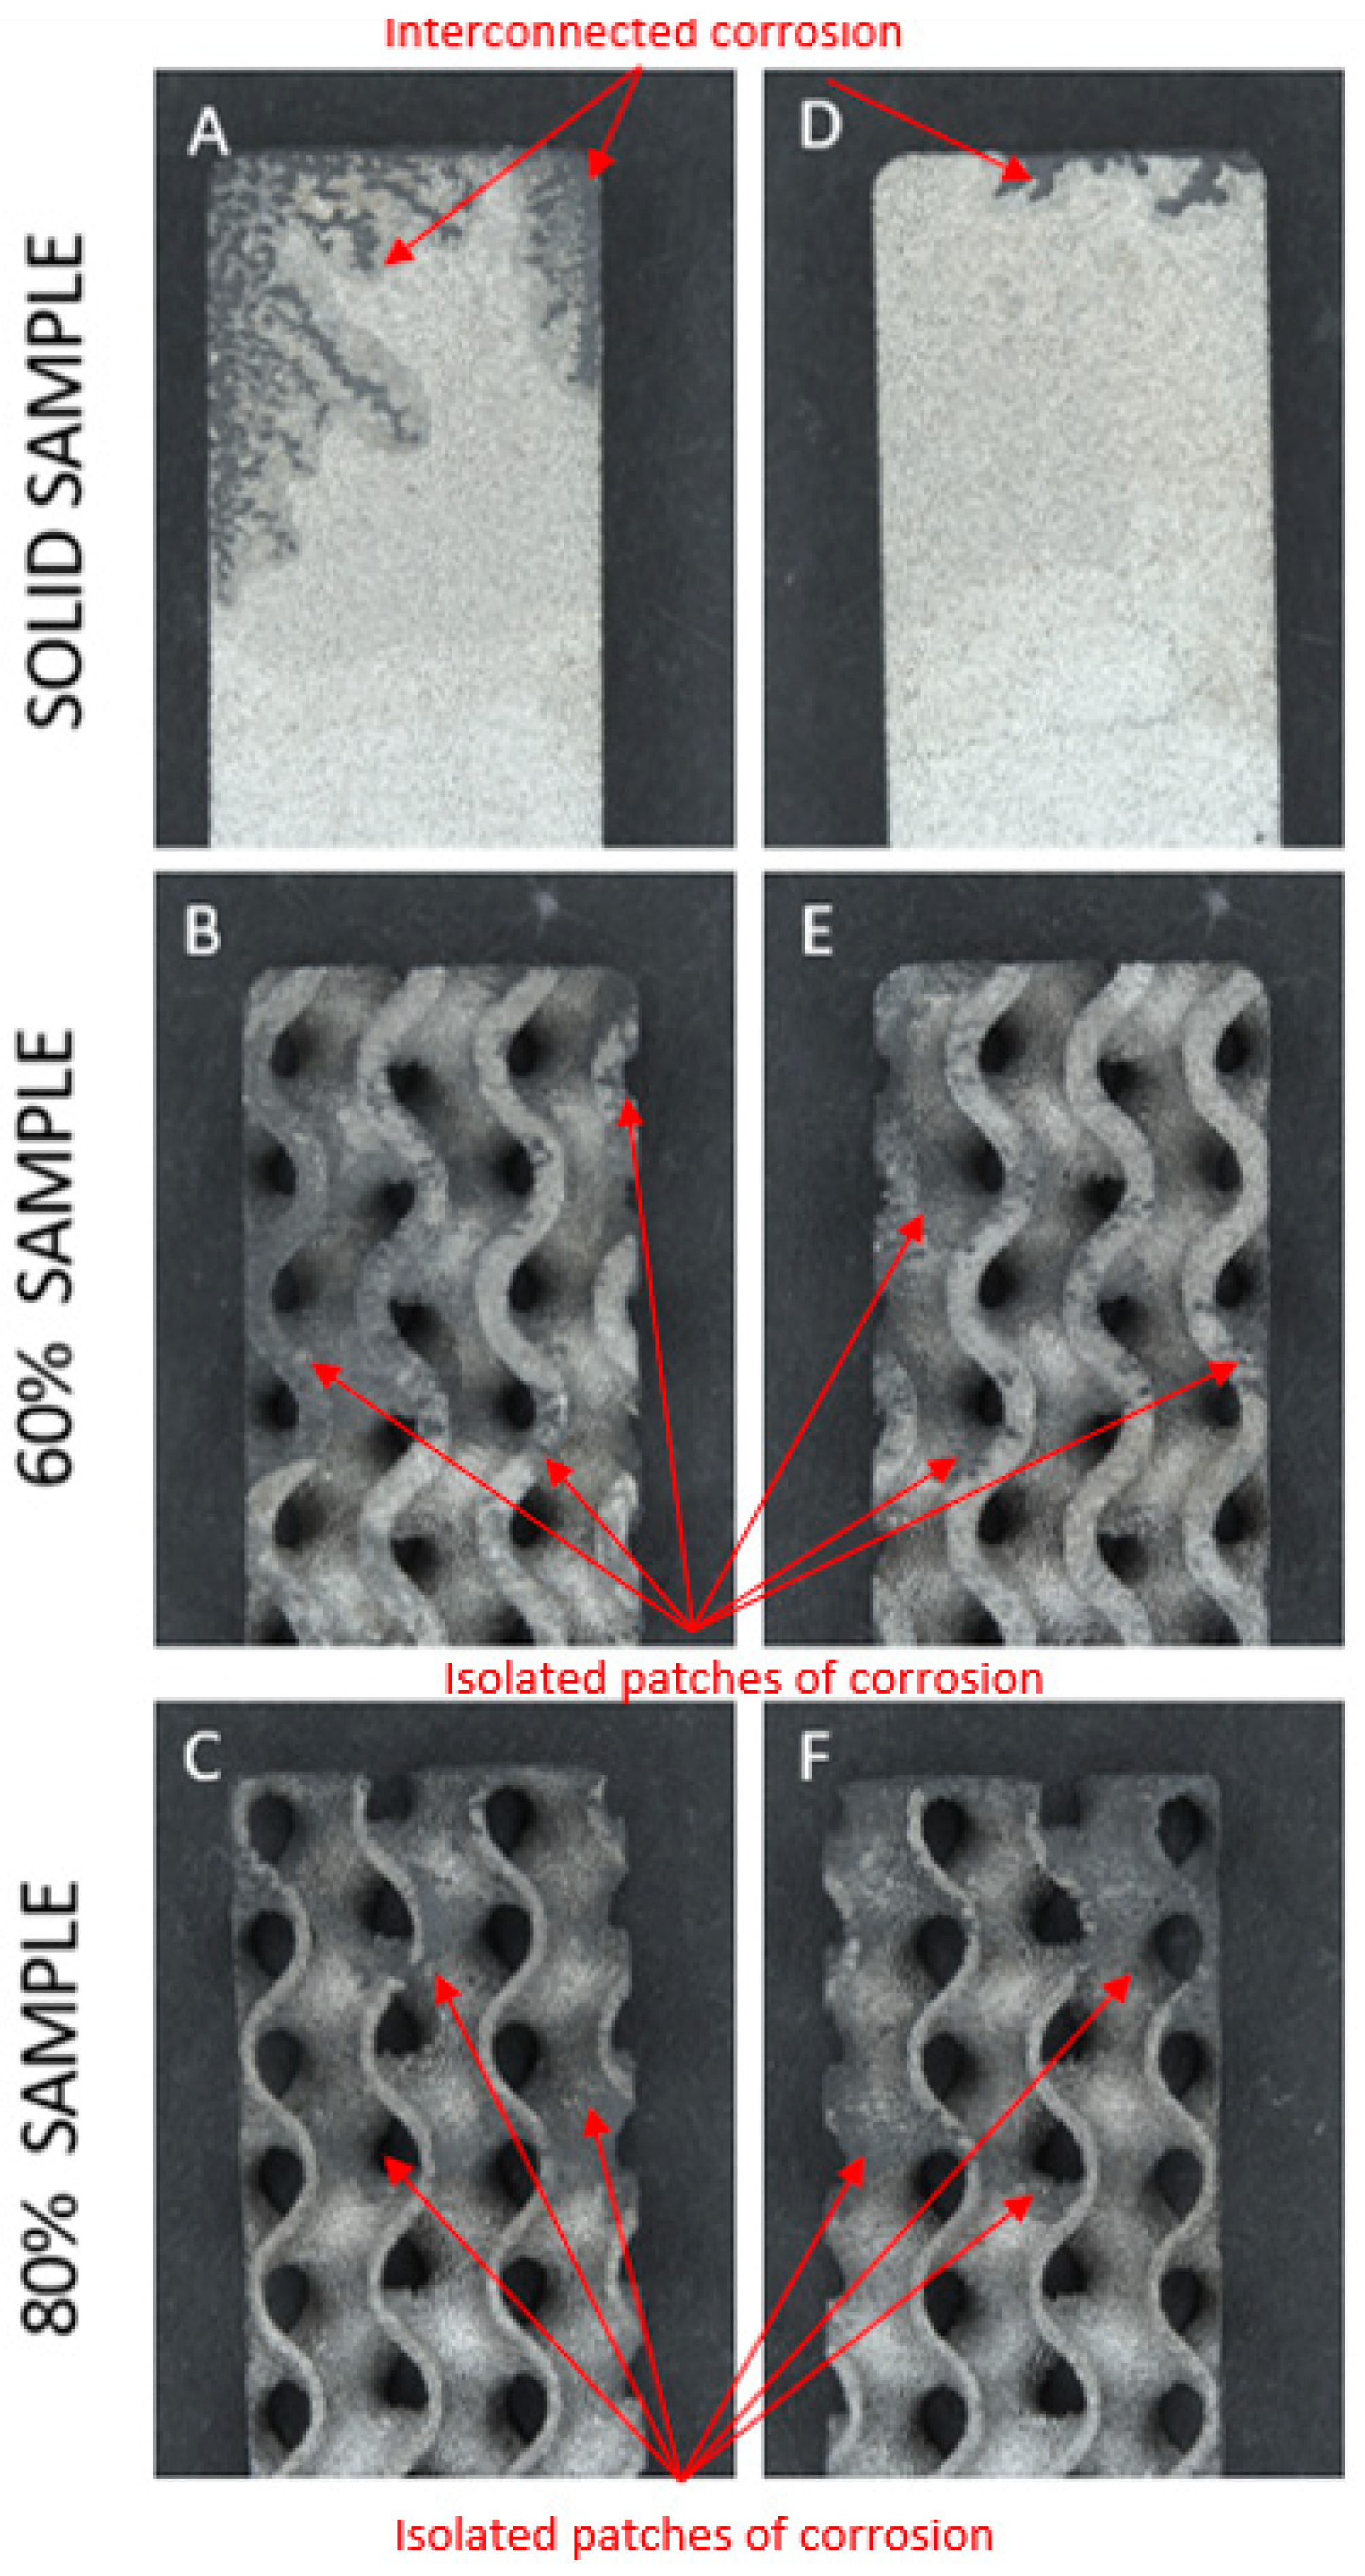
- Within test groups there was a high amount of variability in the extent of corrosion observed;
- Corrosion appeared to initiate and focus on the corners and raised edges of most samples (17/18) as expected. See Figure 5;
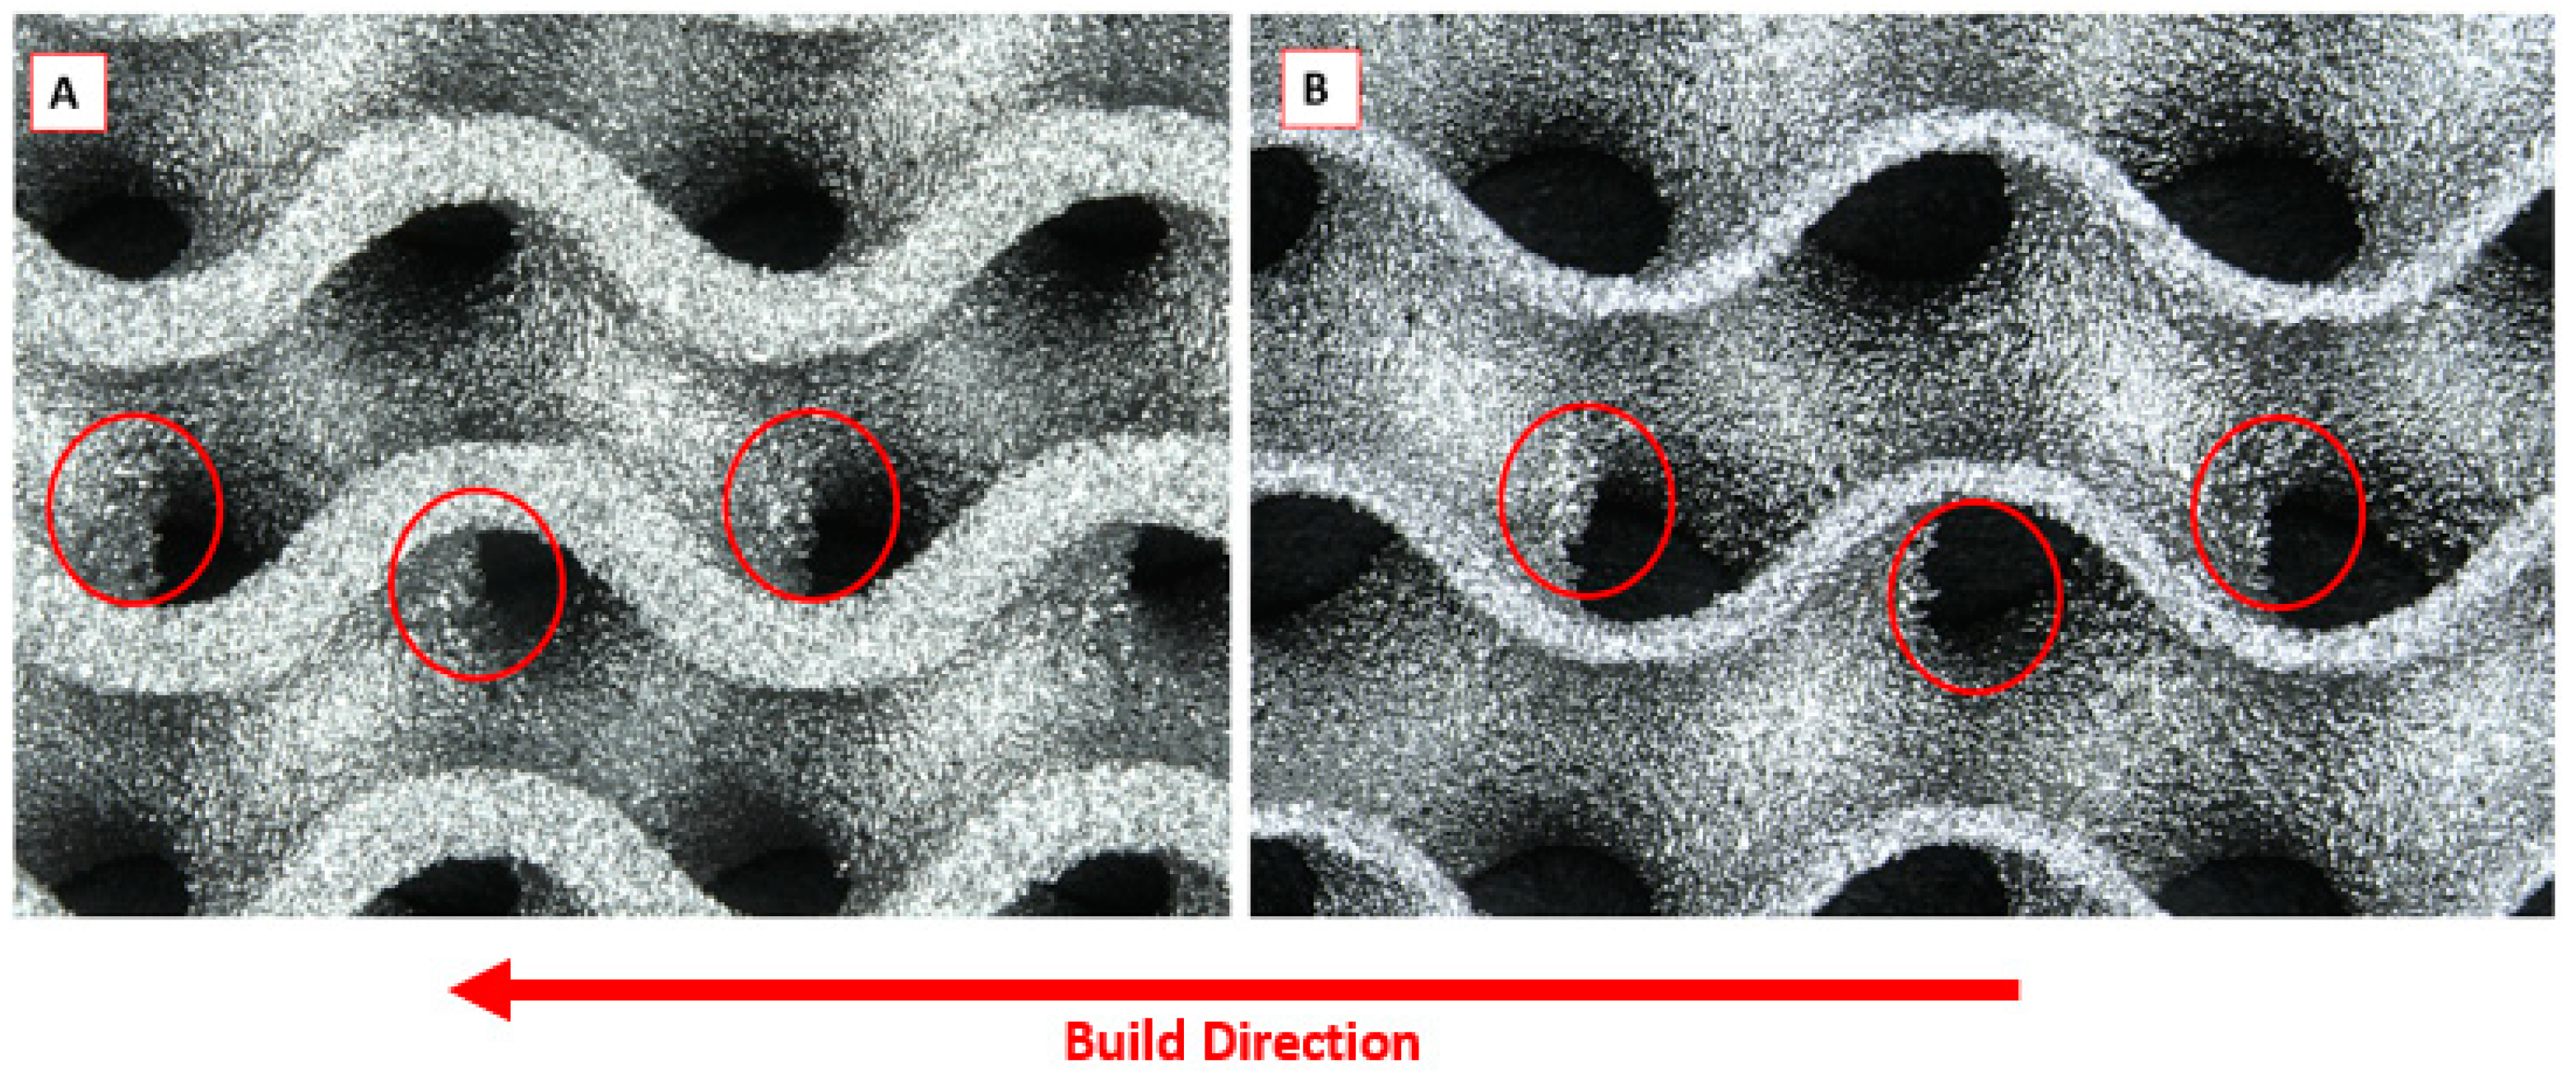
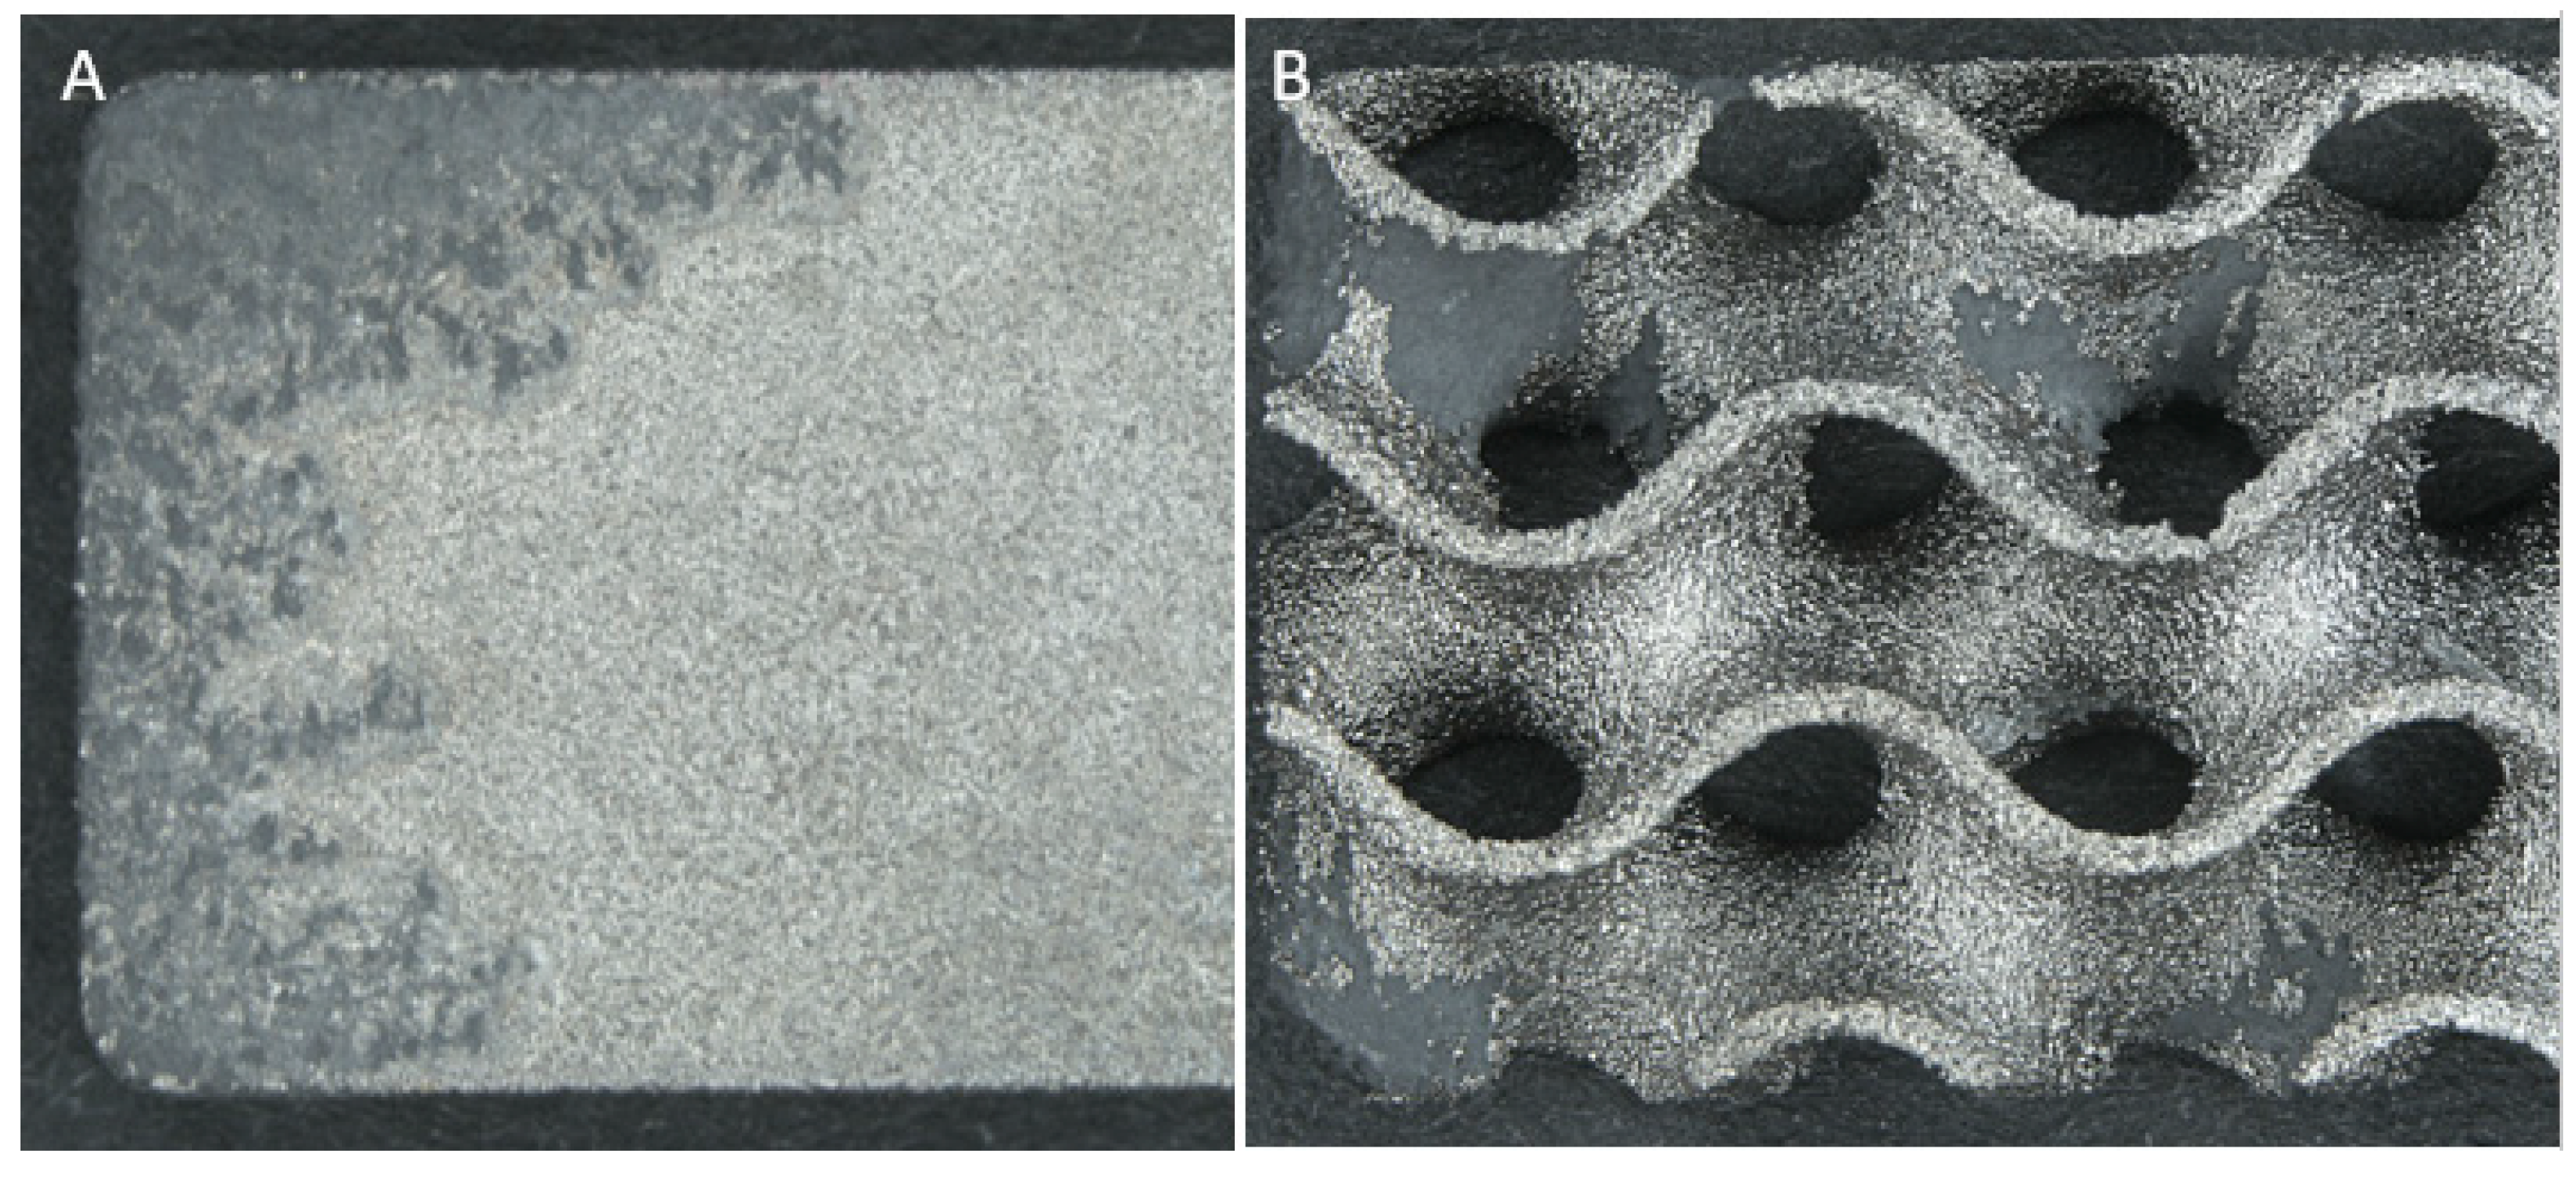
- Corrosion of solid samples was highly interconnected, with finger-like propagations extending from the edges; whereas porous samples featured primarily distinct and isolated patches across the whole surface as shown in Figure 6;
- The dross material observed in porous samples did not directly relate to an increase in corrosion, with many samples’ dross proportions being unaffected by corrosion;
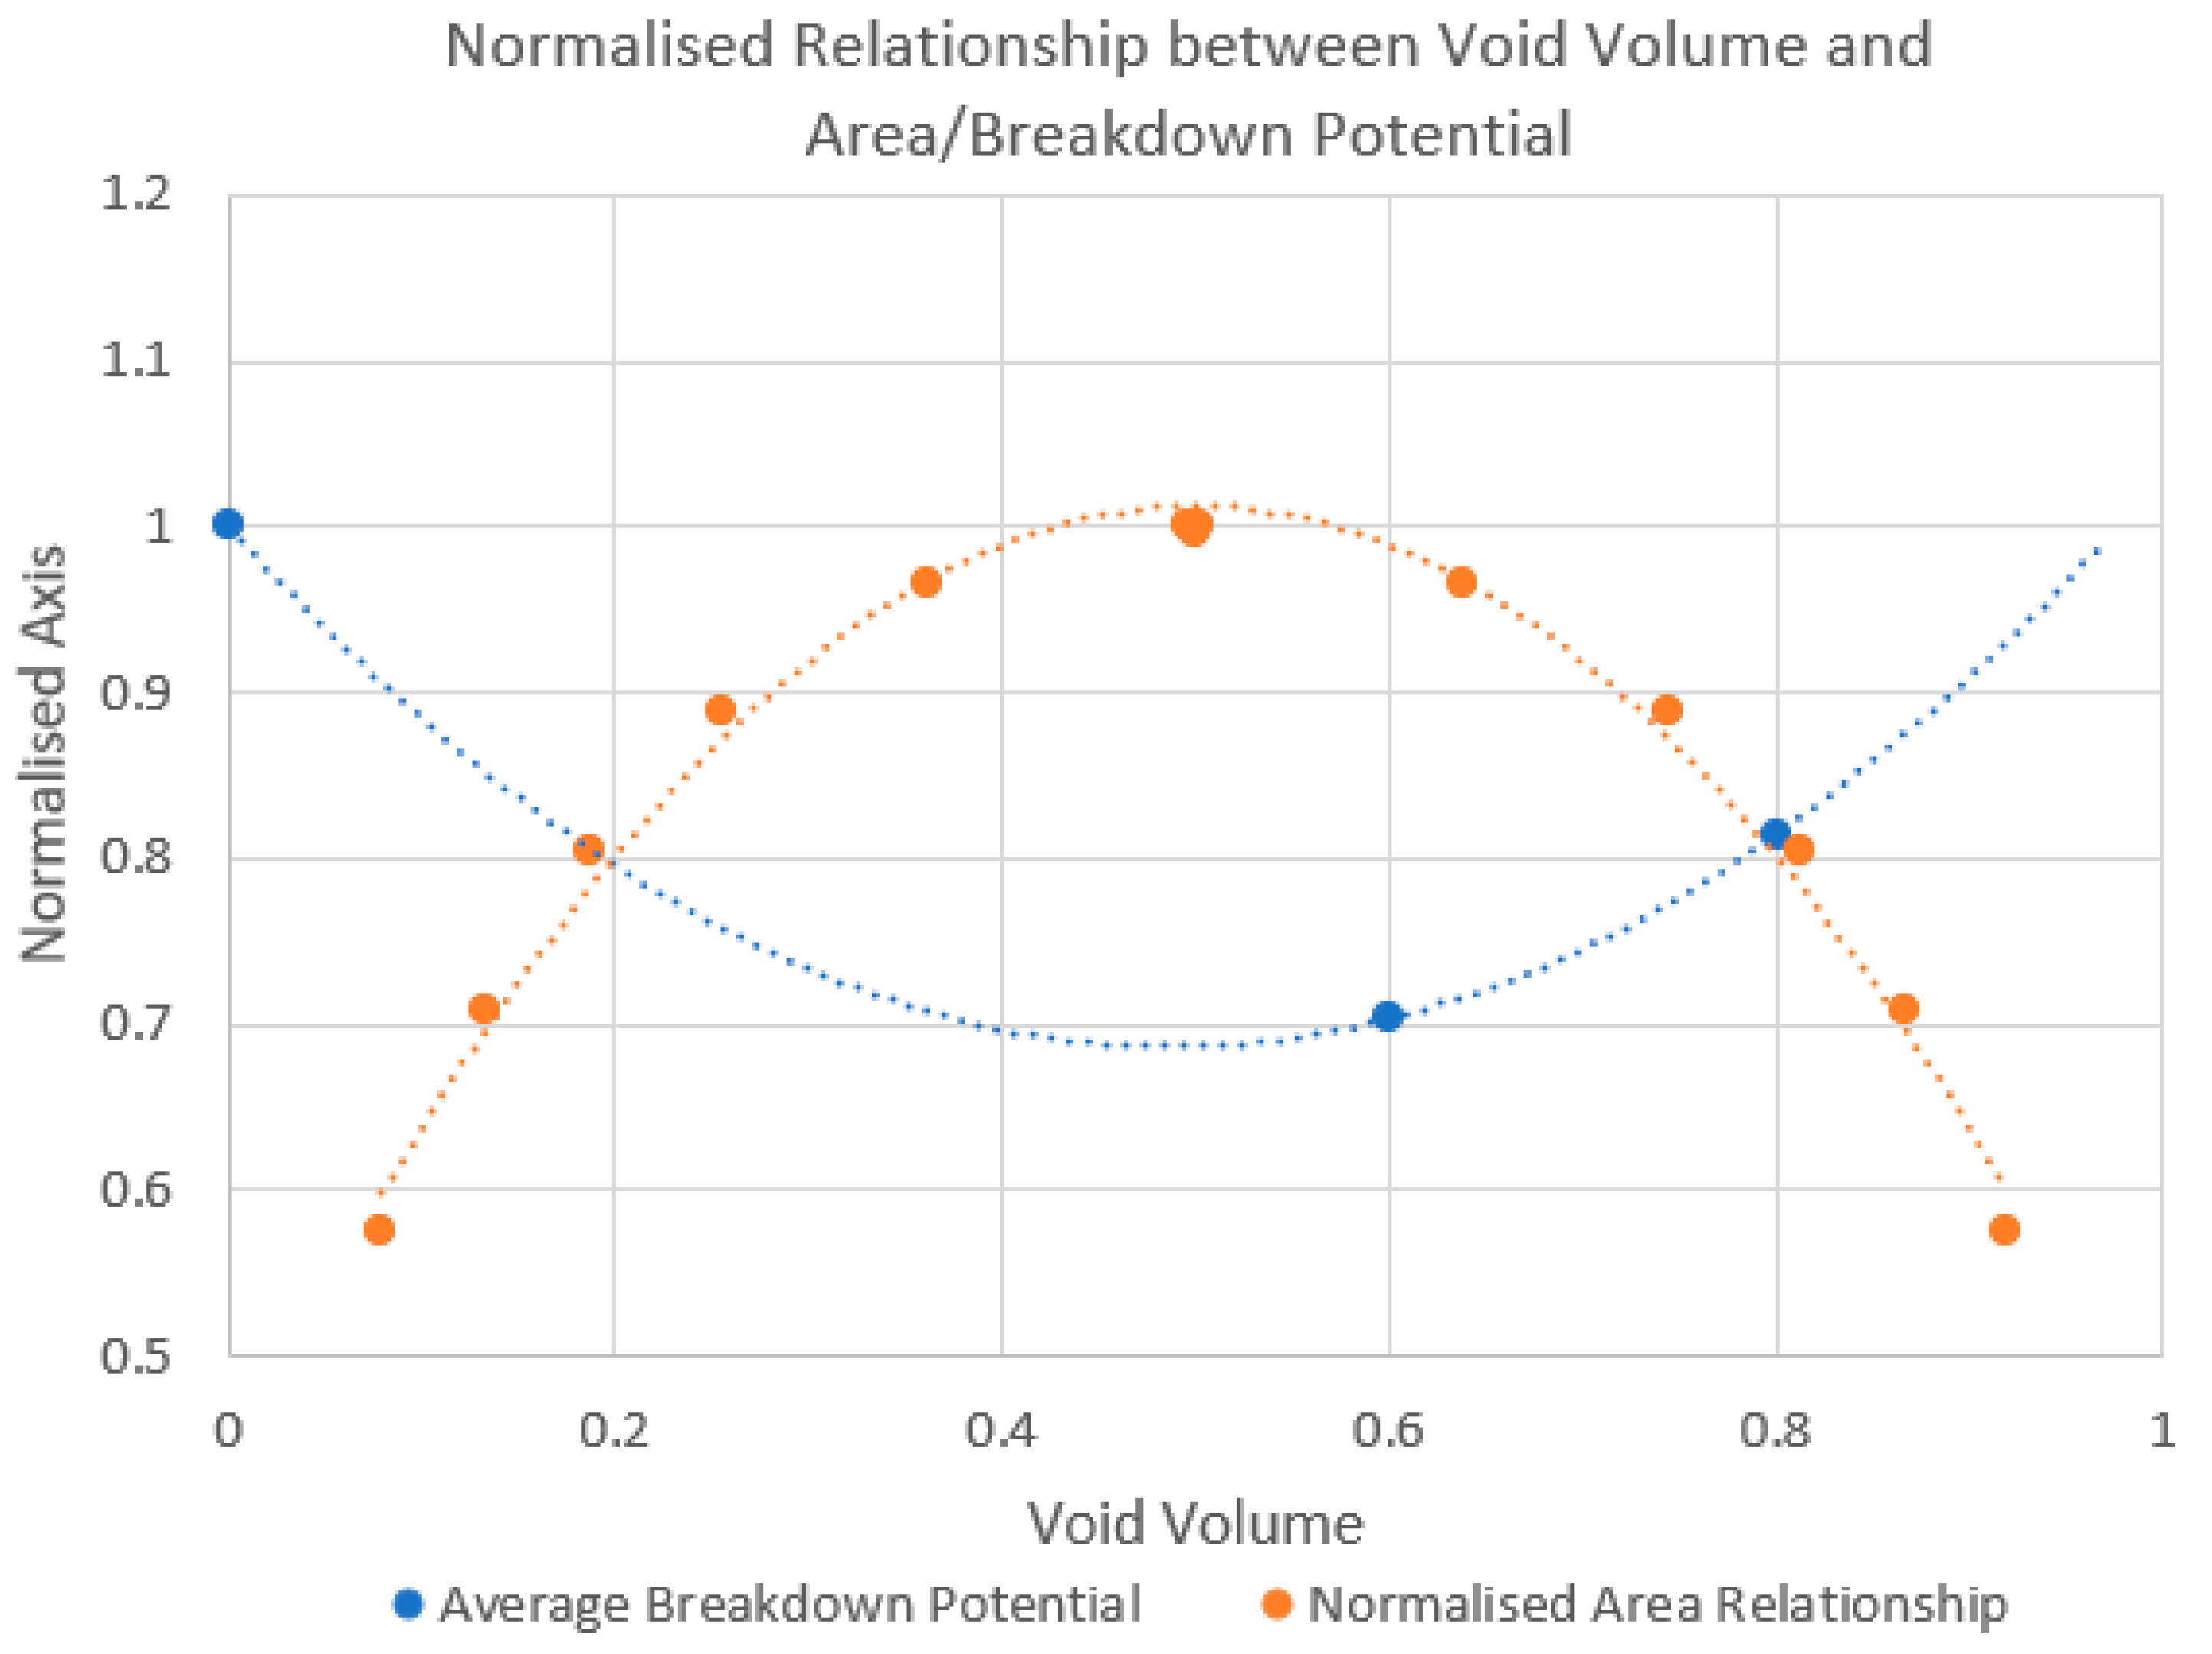
- All samples showed breakdown potentials higher than ASTM F2129′s suggestion of 800 mV for evaluation within the physiological environment.
4. Discussion
5. Limitations
6. Conclusions
Author Contributions
Funding
Institutional Review Board Statement
Informed Consent Statement
Data Availability Statement
Conflicts of Interest
References
- Manivasagam, D.; Dhinasekaran, D.; Rajamanickam, A. Biomedical Implants: Corrosion and its Prevention—A Review. Recent Pat. Corros. Sci. 2010, 2, 40–54. [Google Scholar] [CrossRef] [Green Version]
- Minnath, M.A. 7—Metals and alloys for biomedical applications. In Fundamental Biomaterials: Metals; Woodhead Publishing: Cambridge, UK, 2018; pp. 167–174. [Google Scholar]
- Katti, K.; Verma, D.K.; Katti. Materials for joint replacement. Jt. Replace. Technol. 2008, 81–104. [Google Scholar]
- Saini, M.; Singh, Y.; Arora, P.; Arora, V.; Jain, K. Implant biomaterials: A comprehensive review. World J. Clin. Cases 2015, 3, 52–57. [Google Scholar] [CrossRef]
- Kamachimudali, U.; Sridhar, T.M.; Raj, B. Corrosion of bio implants. Sadhana 2003, 28, 601–637. [Google Scholar] [CrossRef]
- Urban, R.M.; Gilbert, J.L.; Jacobs, J.J. Corrosion of Modular Titanium Alloy Stems in Cementless Hip Replacement. ASTM Int. 2005, 2, 1–10. [Google Scholar] [CrossRef]
- Jacobs, J.J.; Gilbert, J.L.; Urban, R.M. Current Concepts Review—Corrosion of Metal Orthopaedic Implants. J. Bone Jt. Surg. 1998, 80, 268–282. [Google Scholar] [CrossRef] [PubMed]
- Mah, D.; Pelletier, M.H.; Lovric, V.; Walsh, W.R. Corrosion of 3D-Printed Orthopaedic Implant Materials. Ann. Biomed. Eng. 2019, 47, 162–173. [Google Scholar] [CrossRef]
- Gilbert, J.L.; Buckley, C.A.; Jacobs, J.J. In vivo corrosion of modular hip prosthesis components in mixed and similar metal combinations. The effect of crevice, stress, motion, and alloy coupling. J. Biomed. Mater. Res. 1993, 27, 1533–1544. [Google Scholar] [CrossRef]
- Aksakal, B.; Yildirim, Ö.S.; Gul, H. Metallurgical failure analysis of various implant materials used in orthopedic applications. J. Fail. Anal. Prev. 2004, 4, 17–23. [Google Scholar] [CrossRef]
- Davda, K.; Lali, F.; Sampson, B.; Skinner, J.A.; Hart, A.J. An analysis of metal ion levels in the joint fluid of symptomatic patients with metal-on-metal hip replacements. J. Bone Jt. Surg. Br. Vol. 2011, 93, 738–745. [Google Scholar] [CrossRef] [Green Version]
- Bradberry, S.M.; Wilkinson, J.M.; Ferner, R.E. Systemic toxicity related to metal hip prostheses. Clin. Toxicol. 2014, 52, 837–847. [Google Scholar] [CrossRef] [PubMed]
- Antoniou, J.; Zukor, D.J.; Mwale, F.; Minarik, W.; Petit, A.; Huk, O.L. Metal ion levels in the blood of patients after hip resurfacing: A comparison between twenty-eight and thirty-six-millimeter-head metal-on-metal prostheses. J. Bone Jt. Surg. 2008, 90 (Suppl. 3), 142–148. [Google Scholar] [CrossRef] [PubMed]
- Kim, K.T.; Eo, M.Y.; Nguyen, T.T.H.; Kim, S.M. General review of titanium toxicity. Int. J. Implant. Dent. 2019, 5, 10. [Google Scholar] [CrossRef] [Green Version]
- Eliaz, N.J.M. Corrosion of Metallic Biomaterials: A Review. Materials 2019, 12, 407. [Google Scholar] [CrossRef] [PubMed] [Green Version]
- Pina, V.G.; Dalmau, A.; Devesa, F.; Amigó, V.; Muñoz, A.I. Tribocorrosion behavior of beta titanium biomedical alloys in phosphate buffer saline solution. J. Mech. Behav. Biomed. Mater. 2015, 46, 59–68. [Google Scholar] [CrossRef] [PubMed]
- Engh, C.A.; Moore, K.D.; Vinh, T.N.; Engh, G.A. Titanium Prosthetic Wear Debris in Remote Bone Marrow. A Report of Two Cases*. J. Bone Jt. Surg. 1997, 79, 1721–1725. [Google Scholar] [CrossRef] [PubMed]
- Barbieri, M.; Mencio, F.; Papi, P.; Rosella, D.; Di Carlo, S.; Valente, T.; Pompa, G. Corrosion behavior of dental implants immersed into human saliva: Preliminary results of an in vitro study. Eur. Rev. Med. Pharmacol. Sci 2017, 21, 3543–3548. [Google Scholar]
- Furrer, S.; Hofmeier, K.S.; Grize, L.; Bircher, A.J. Metal hypersensitivity in patients with orthopaedic implant complication. A retrospective clinical study. Contact Dermat. 2018, 79, 91–98. [Google Scholar] [CrossRef] [Green Version]
- Haynes, D.R.; Rogers, S.D.; Hay, S.J.; Pearcy, M.J.; Howie, D.W. The differences in toxicity and release of bone-resorbing mediators induced by titanium and cobalt-chromium-alloy wear particles. J. Bone Jt. Surg. 1993, 75, 825–834. [Google Scholar] [CrossRef] [Green Version]
- Rogers, S.D.; Howie, D.W.; Graves, S.E.; Pearcy, M.J.; Haynes, D.R. In Vitro Human Monocyte Response to Wear Particles of Titanium Alloy Containing Vanadium or Niobium. J. Bone Jt. Surg. Br. Vol. 1997, 79, 311–315. [Google Scholar] [CrossRef]
- Safioti, L.; Kotsakis, G.A.; Pozhitkov, A.E.; Chung, W.O.; Daubert, D.M. Increased Levels of Dissolved Titanium Are Associated With Peri-Implantitis—A Cross-Sectional Study. J. Periodontol. 2017, 88, 436–442. [Google Scholar] [CrossRef] [PubMed]
- Berglund, F.; Carlmark, B. Titanium, Sinusitis, and the Yellow Nail Syndrome. Biol. Trace Elem. Res. 2011, 143, 1–7. [Google Scholar] [CrossRef] [PubMed] [Green Version]
- Ford, S.L.N. Additive Manufacturing Technology: Potential Implications for U.S. Manufacturing Competitiveness. J. Int. Commer. Econ. 2014, 6, 40. [Google Scholar]
- Siu, T.L.T.; Rogers, J.M.; Lin, K.; Thompson, R.G.; Owbridge, M. Custom-Made Titanium 3-Dimensional Printed Interbody Cages for Treatment of Osteoporotic Fracture-Related Spinal Deformity. World Neurosurg. 2018, 111, 1–5. [Google Scholar] [CrossRef] [PubMed]
- Vasconcellos, L.M.R.; Leite, D.d.O.; Oliveira, F.N.d.; Carvalho, Y.R.; Cairo, C.A.A. Evaluation of bone ingrowth into porous titanium implant: Histomorphometric analysis in rabbits. Braz. Oral Res. 2010, 24, 399–405. [Google Scholar] [CrossRef] [Green Version]
- Tsai, P.I.; Wu, M.H.; Li, Y.Y.; Lin, T.H.; Tsai, J.; Huang, H.I.; Lai, H.J.; Lee, M.H.; Chen, C.Y. Additive-manufactured Ti-6Al-4 V/Polyetheretherketone composite porous cage for Interbody fusion: Bone growth and biocompatibility evaluation in a porcine model. BMC Musculoskelet. Disord. 2021, 22, 171. [Google Scholar] [CrossRef]
- Park, P.J.; Lehman, R.A. Optimizing the Spinal Interbody Implant: Current Advances in Material Modification and Surface Treatment Technologies. Curr. Rev. Musculoskelet. Med. 2020, 13, 688–695. [Google Scholar] [CrossRef]
- Zhang, L.C.; Chen, L. A Review on Biomedical Titanium Alloys: Recent Progress and Prospect. Adv. Eng. Mater. 2019, 21, 1801215. [Google Scholar] [CrossRef] [Green Version]
- Singh, S.; Ramakrishna, S. Biomedical applications of additive manufacturing: Present and future. Curr. Opin. Biomed. Eng. 2017, 2, 105–115. [Google Scholar] [CrossRef]
- Prasad, K.; Bazaka, O.; Chua, M.; Rochford, M.; Fedrick, L.; Spoor, J.; Symes, R.; Tieppo, M.; Collins, C.; Cao, A.; et al. Metallic Biomaterials: Current Challenges and Opportunities. Materials 2017, 10, 884. [Google Scholar] [CrossRef]
- Maietta, S.; Gloria, A.; Improta, G.; Richetta, M.; de Santis, R.; Martorelli, M. A Further Analysis on Ti6Al4V Lattice Structures Manufactured by Selective Laser Melting. J. Healthc. Eng. 2019, 2019, 3212594. [Google Scholar] [CrossRef] [PubMed]
- Wu, S.-h.; Li, Y.; Zhang, Y.-Q.; Li, X.-K.; Yuan, C.-F.; Hao, Y.-L.; Zhang, Z.-Y.; Guo, Z. Porous titanium-6 aluminum-4 vanadium cage has better osseointegration and less micromotion than a poly-ether-ether-ketone cage in sheep vertebral fusion. Artif. Organs 2013, 37, E191–E201. [Google Scholar] [CrossRef] [PubMed]
- Kelly, C.N.; Francovich, J.; Julmi, S.; Safranski, D.; Guldberg, R.E.; Maier, H.J.; Gall, K. Fatigue behavior of As-built selective laser melted titanium scaffolds with sheet-based gyroid microarchitecture for bone tissue engineering. Acta Biomater. 2019, 94, 610–626. [Google Scholar] [CrossRef] [PubMed]
- Al-Ketan, O.; Rowshan, R.; Abu Al-Rub, R.K. Topology-mechanical property relationship of 3D printed strut, skeletal, and sheet based periodic metallic cellular materials. Addit. Manuf. 2018, 19, 167–183. [Google Scholar] [CrossRef]
- Al-Ketan, O.; Lee, D.W.; Rowshan, R.; Abu Al-Rub, R.K. Functionally graded and multi-morphology sheet TPMS lattices: Design, manufacturing, and mechanical properties. J. Mech. Behav. Biomed. Mater. 2020, 102, 103520. [Google Scholar] [CrossRef]
- Timercan, A.; Sheremetyev, V.; Brailovski, V. Mechanical properties and fluid permeability of gyroid and diamond lattice structures for intervertebral devices: Functional requirements and comparative analysis. Sci. Technol. Adv. Mater. 2021, 22, 285–300. [Google Scholar] [CrossRef]
- Zhao, D.; Liang, H.; Han, C.; Li, J.; Liu, J.; Zhou, K.; Yang, C.; Wei, Q. 3D printing of a titanium-tantalum Gyroid scaffold with superb elastic admissible strain, bioactivity and in-situ bone regeneration capability. Addit. Manuf. 2021, 47, 102223. [Google Scholar] [CrossRef]
- Qin, Y.; Yang, H.; Liu, A.; Dai, J.; Wen, P.; Zheng, Y.; Tian, Y.; Li, S.; Wang, X. Processing optimization, mechanical properties, corrosion behavior and cytocompatibility of additively manufactured Zn-0.7 Li biodegradable metals. Acta Biomater. 2022, 142, 388–401. [Google Scholar] [CrossRef]
- Łosiewicz, B.; Maszybrocka, J.; Kubisztal, J.; Skrabalak, G.; Stwora, A. Corrosion Resistance of the CpTi G2 Cellular Lattice with TPMS Architecture for Gas Diffusion Electrodes. Materials 2021, 14, 81. [Google Scholar] [CrossRef]
- Abdeen, D.H.; Palmer, B.R. Corrosion evaluation of Ti-6Al-4V parts produced with electron beam melting machine. Rapid Prototyp. J. 2016, 22, 322–329. [Google Scholar] [CrossRef]
- Wang, G.; Wan, Y.; Wang, T.; Liu, Z. Corrosion Behavior of Titanium Implant with different Surface Morphologies. Procedia Manuf. 2017, 10, 363–370. [Google Scholar] [CrossRef]
- Kelly, C.N.; Wang, T.; Crowley, J.; Wills, D.; Pelletier, M.H.; Westrick, E.R.; Adams, S.B.; Gall, K.; Walsh, W.R. High-strength, porous additively manufactured implants with optimized mechanical osseointegration. Biomaterials 2021, 279, 121206. [Google Scholar] [CrossRef] [PubMed]
- Munir, S.; Pelletier, M.H.; Walsh, W.R. Potentiodynamic Corrosion Testing. J. Vis. Exp. JoVE 2016, 115, e54351. [Google Scholar] [CrossRef] [PubMed]
- ASTM F2129-19a; Standard Test Method for Conducting Cyclic Potentiodynamic Polarization Measurements to Determine the Corrosion Susceptibility of Small Implant Devices. ASTM International: West Conshohocken, PA, USA, 2019.
- Gunawarman; Giatmana, D.D.; Ilhamdi; Affi, J.; Fonna, S.; Niinomi, M.; Nakai, M. Corrosion resistance of new beta type titanium alloy, Ti-29Nb-13Ta-4.6Zr in artificial saliva solution. IOP Conf. Ser. Mater. Sci. Eng. 2018, 352, 012008. [Google Scholar] [CrossRef]
- ASTM G102-89; Standard Practice for Calculation of Corrosion Rates and Related Information from Electrochemical Measurements. ASTM International: West Conshohocken, PA, USA, 2006; Volume 3.
- ASTM G16; Standard Guide for Applying Statistics to Analysis of Corrosion Data. ASTM International: West Conshohocken, PA, USA, 2019.
- Große-Brauckmann, K. Gyroids of Constant Mean Curvature. Exp. Math. 1997, 6, 33–50. [Google Scholar] [CrossRef]
- Vijayaraghavan, V.; Sabane, A.V.; Tejas, K. Hypersensitivity to Titanium: A Less Explored Area of Research. J. Indian Prosthodont. Soc. 2012, 12, 201–207. [Google Scholar] [CrossRef]
- Almanza, E.; Pérez, M.J.; Rodríguez, N.A.; Murr, L.E. Corrosion resistance of Ti-6Al-4V and ASTM F75 alloys processed by electron beam melting. J. Mater. Res. Technol. 2017, 6, 251–257. [Google Scholar] [CrossRef]
- Souza, J.C.M.; Apaza-Bedoya, K.; Benfatti, C.A.M.; Silva, F.S.; Henriques, B. A Comprehensive Review on the Corrosion Pathways of Titanium Dental Implants and Their Biological Adverse Effects. Metals 2020, 10, 1272. [Google Scholar] [CrossRef]
- Dini, C.; Costa, R.C.; Sukotjo, C.; Takoudis, C.G.; Mathew, M.T.; Barão, V.A.R. Progression of Bio-Tribocorrosion in Implant Dentistry. Front. Mech. Eng. 2020, 6, 1. [Google Scholar] [CrossRef]


| Solid Sample | 60% Sample | 80% Sample | |
|---|---|---|---|
| Test Group Size (n) | 6 | 6 | 6 |
| Porosity (%) | 0 | 60.1 | 80.8 |
| Surface Area (mm2) | 703 | 933 | 824 |
| Volume (mm3) | 747 | 298 | 144 |
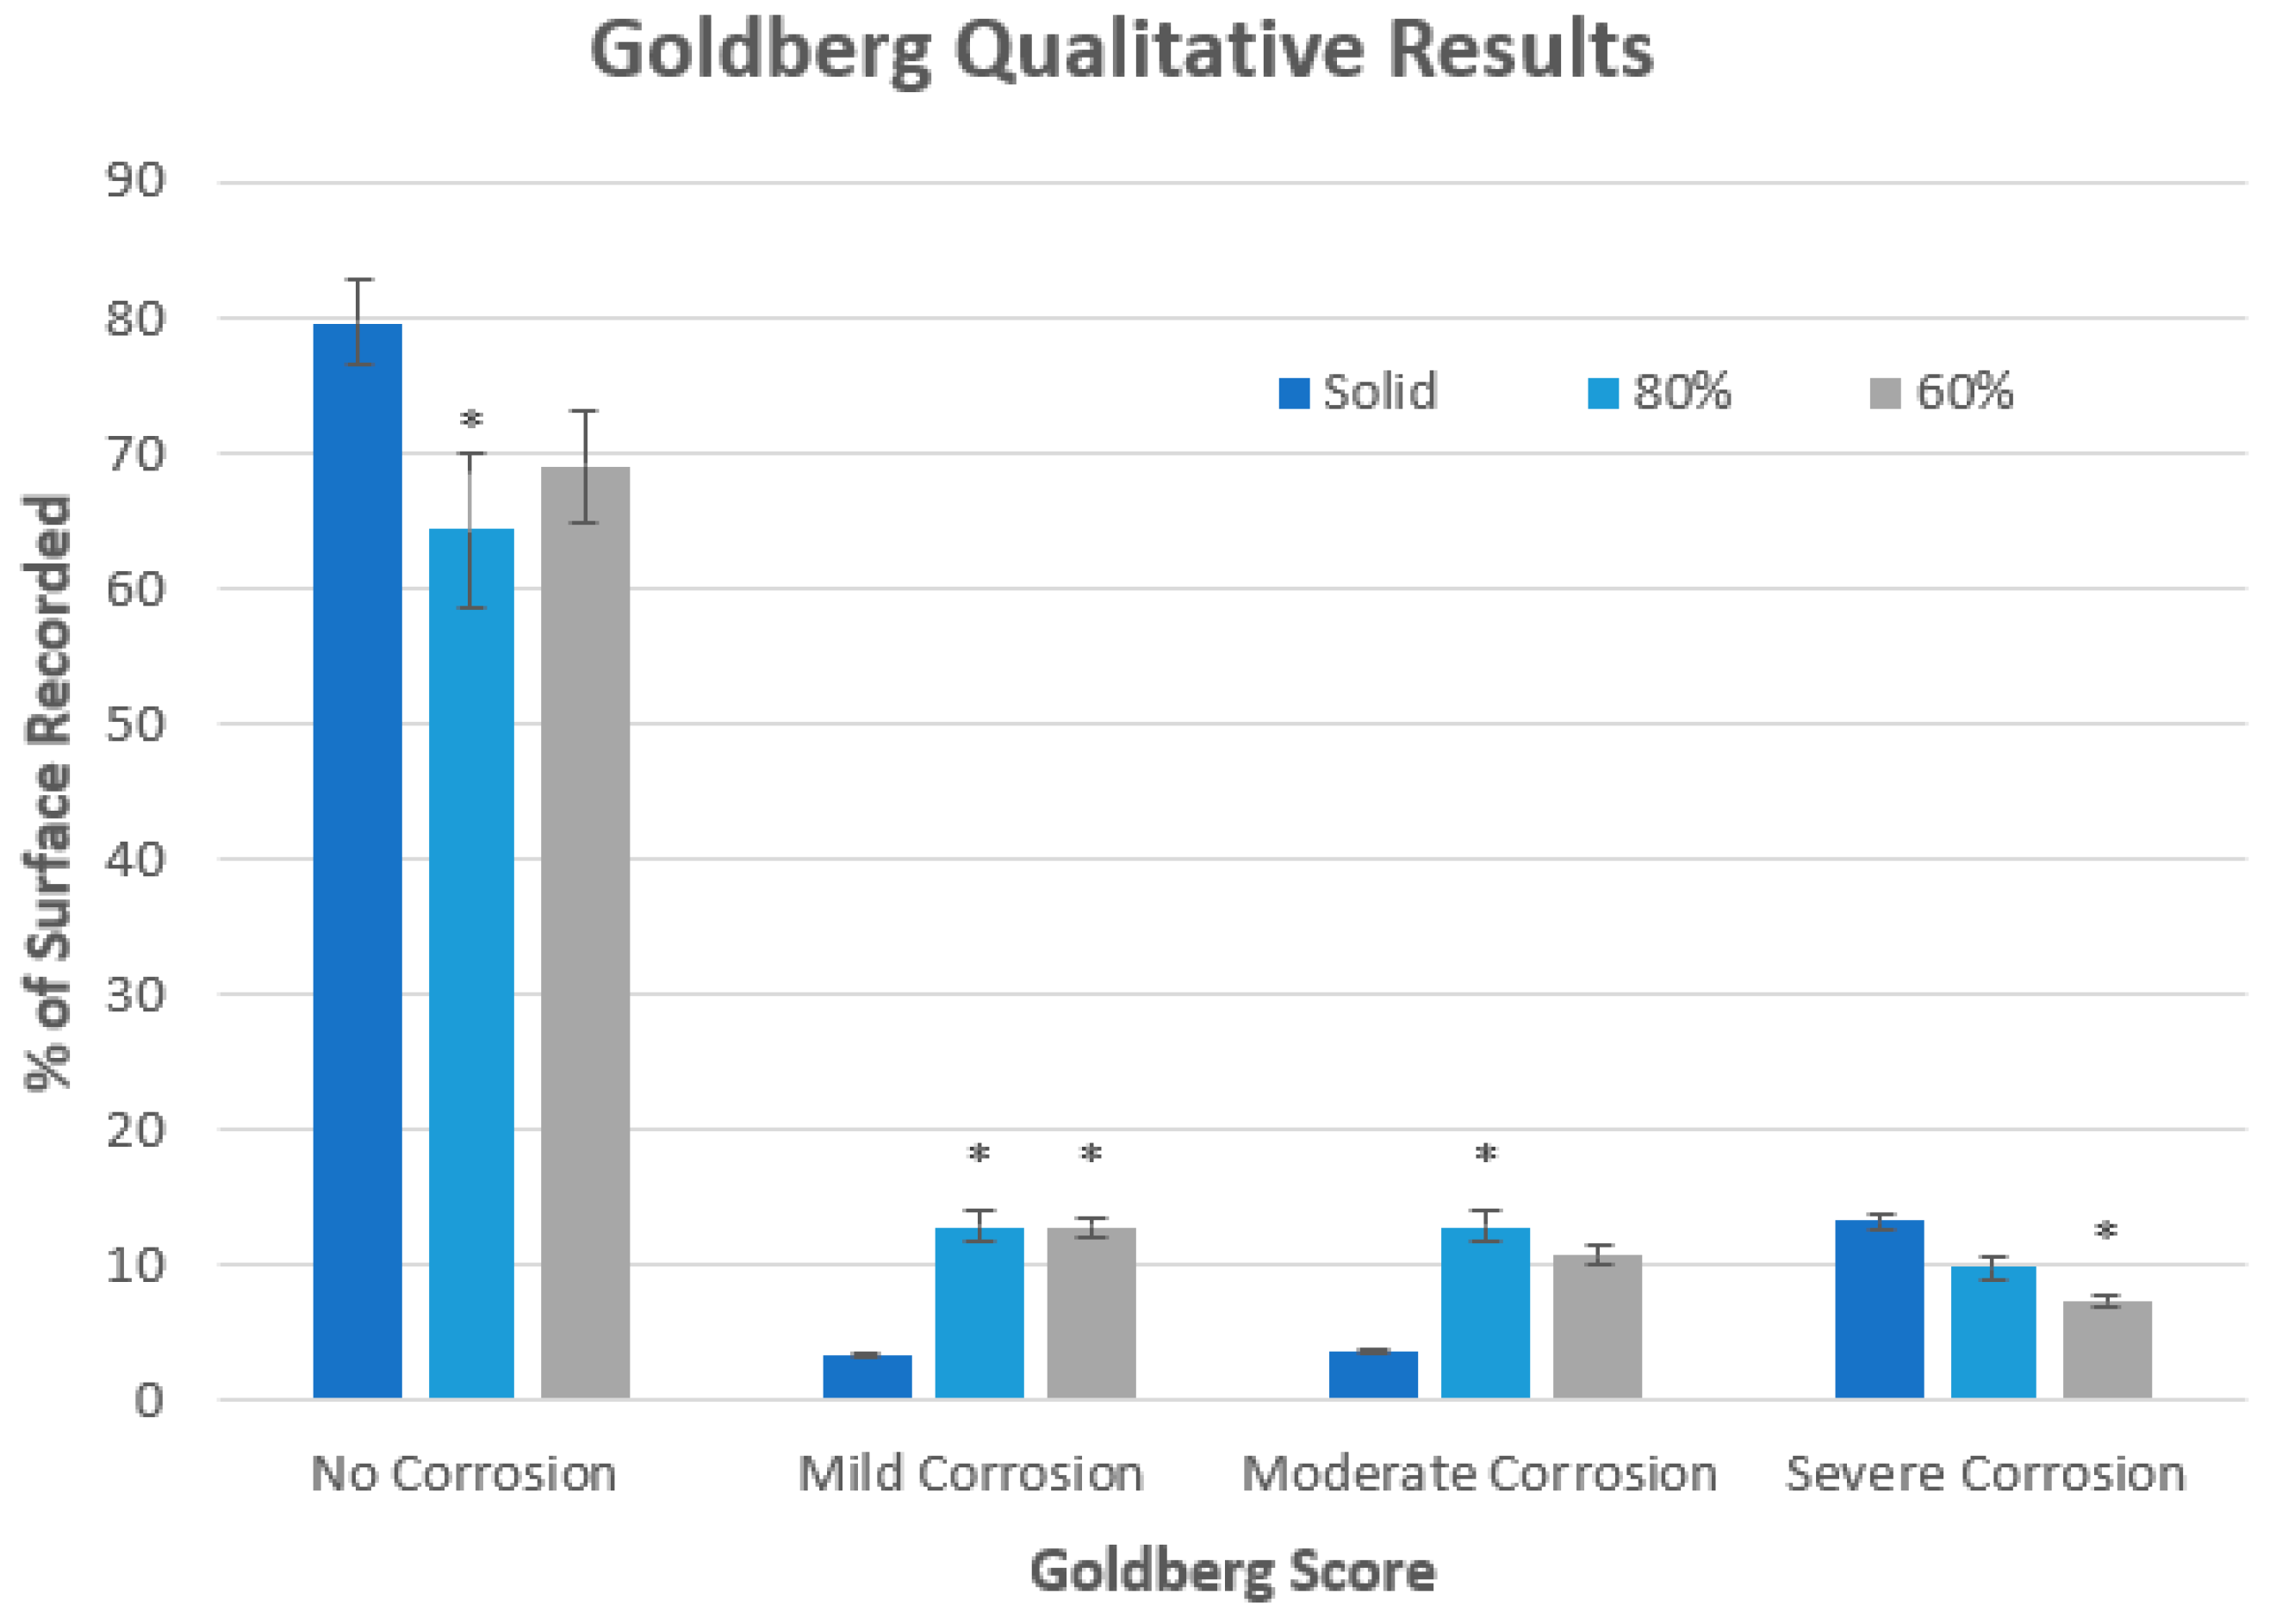
| Score | Severity | Criteria |
|---|---|---|
| 0 | No Corrosion | No visible corrosion |
| 1 | Mild Corrosion | Surface is discolored or dull |
| 2 | Moderate Corrosion | Surface is discolored, features shallow pitting and unclear corrosion boundaries |
| 3 | Severe Corrosion | Deep pitting and loss of surface material. Clear corrosion boundaries |
| Solid Samples | 60% Samples | p Value | |
|---|---|---|---|
| Ra (μm) | 4.25 ± 0.26 | 5.46 ± 0.36 | 0.012 |
| Rz (μm) | 23.55 ± 0.86 | 30.50 ± 1.39 | 0.003 |
| Solid Samples | 60% Samples | 80% Samples | |
|---|---|---|---|
| Resting Potential (Er/OCP) (mV) | −381 ± 110 | −247 ± 45 | −252 ± 129 |
| Breakdown Potential (Eb) (mV) | 2262 ± 245 ** | 1590 ± 135 * | 1842 ± 128 * |
| Near Passivation Potential (Enp) (mV) | 1839 ± 34 ** | 1375 ± 24 ** | 1548 ± 59 ** |
| Vertex Potential (Ev) (mV) | 3061 ± 141 ** | 2137 ± 115 * | 2387 ± 195 * |
| Hysteresis (Eb—Enp) (mV) | 423 ± 220 | 215 ± 122 | 294 ± 131 |
| Solid Sample | 60% Sample | 80% Sample | |
|---|---|---|---|
| Exposed surface area (mm2) | 351.57 | 466.66 | 411.92 |
| Corroded percentage (%) | 14.10 | 29.66 ** | 32.22 ** |
| Corroded surface area (mm2) | 49.57 | 138.40 ** | 132.72 ** |
Publisher’s Note: MDPI stays neutral with regard to jurisdictional claims in published maps and institutional affiliations. |
© 2022 by the authors. Licensee MDPI, Basel, Switzerland. This article is an open access article distributed under the terms and conditions of the Creative Commons Attribution (CC BY) license (https://creativecommons.org/licenses/by/4.0/).
Share and Cite
Sharp, R.; Pelletier, M.H.; Walsh, W.R.; Kelly, C.N.; Gall, K. Corrosion Resistance of 3D Printed Ti6Al4V Gyroid Lattices with Varying Porosity. Materials 2022, 15, 4805. https://doi.org/10.3390/ma15144805
Sharp R, Pelletier MH, Walsh WR, Kelly CN, Gall K. Corrosion Resistance of 3D Printed Ti6Al4V Gyroid Lattices with Varying Porosity. Materials. 2022; 15(14):4805. https://doi.org/10.3390/ma15144805
Chicago/Turabian StyleSharp, Rachael, Matthew H. Pelletier, William R. Walsh, Cambre N. Kelly, and Ken Gall. 2022. "Corrosion Resistance of 3D Printed Ti6Al4V Gyroid Lattices with Varying Porosity" Materials 15, no. 14: 4805. https://doi.org/10.3390/ma15144805