
Investigation of Interlaminar Shear Properties of CFRP Composites at Elevated Temperatures Using the Lempel-Ziv Complexity of Acoustic Emission Signals

 , ,
, ,  and
and
Abstract
:1. Introduction
2. Materials and Methods
2.1. Materials
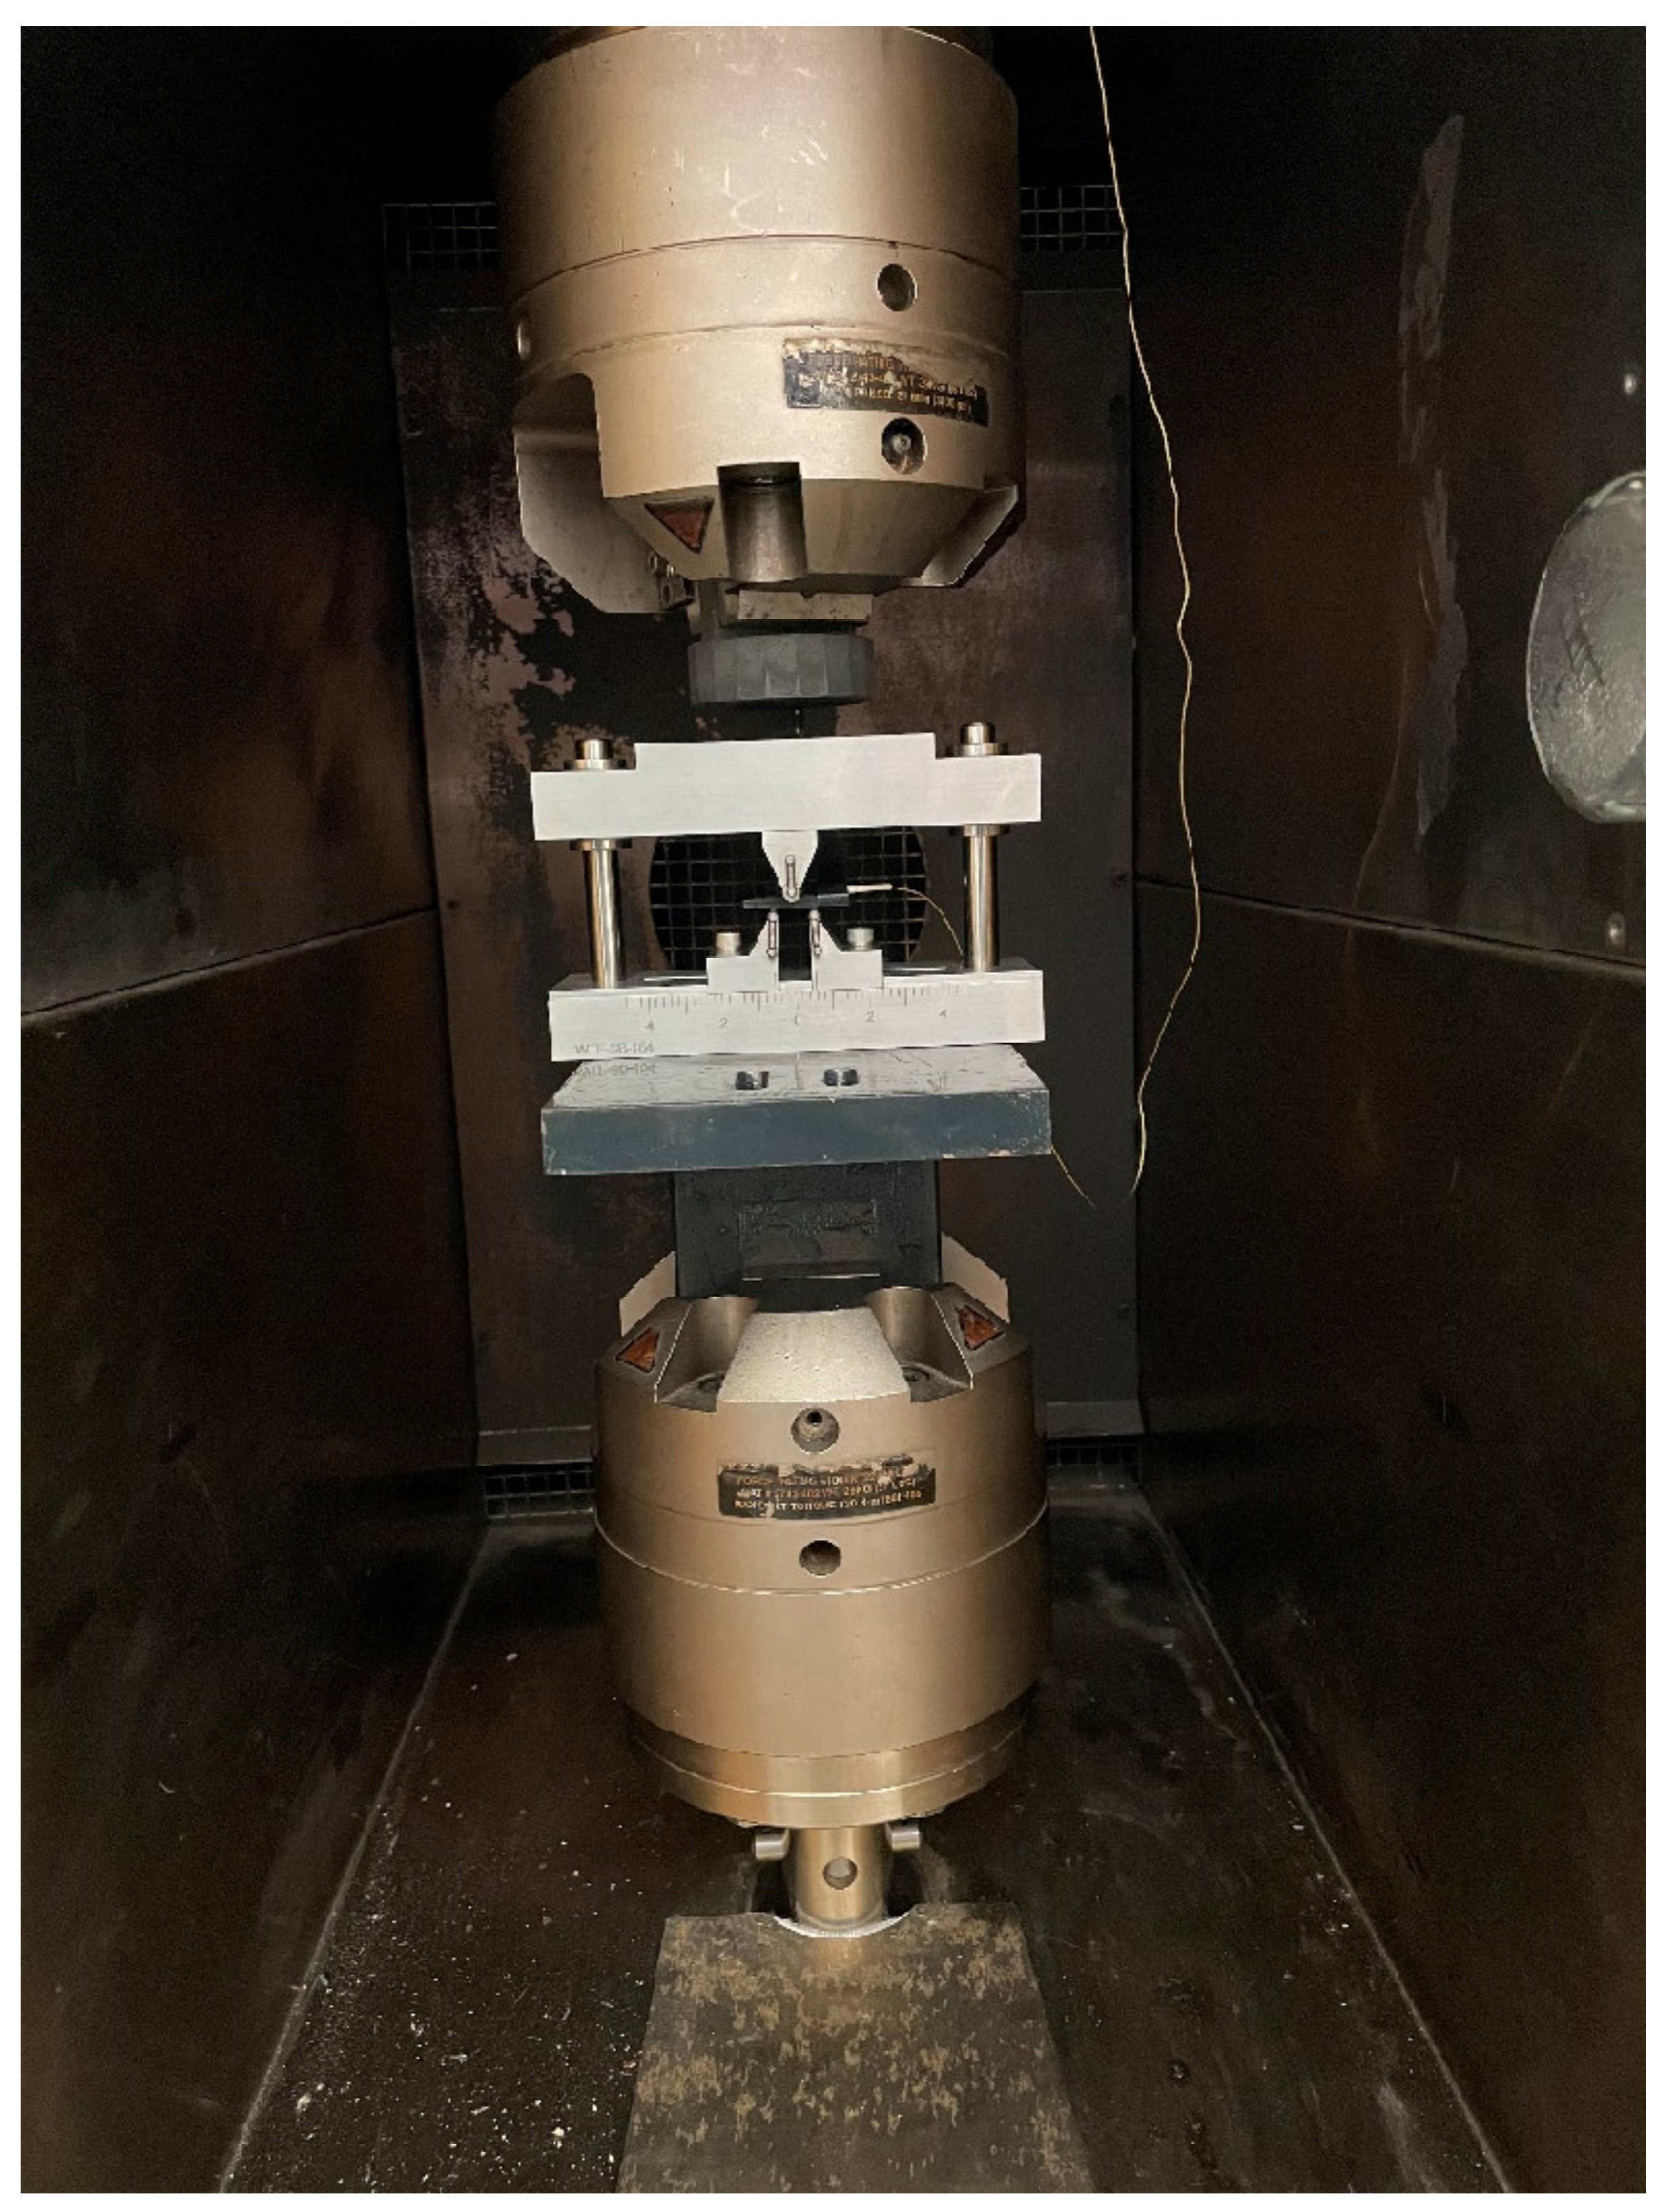
2.2. Test Methods
2.3. Acoustic Emission Analysis
2.4. LZ Complexity
2.5. SEM Analysis
3. Results
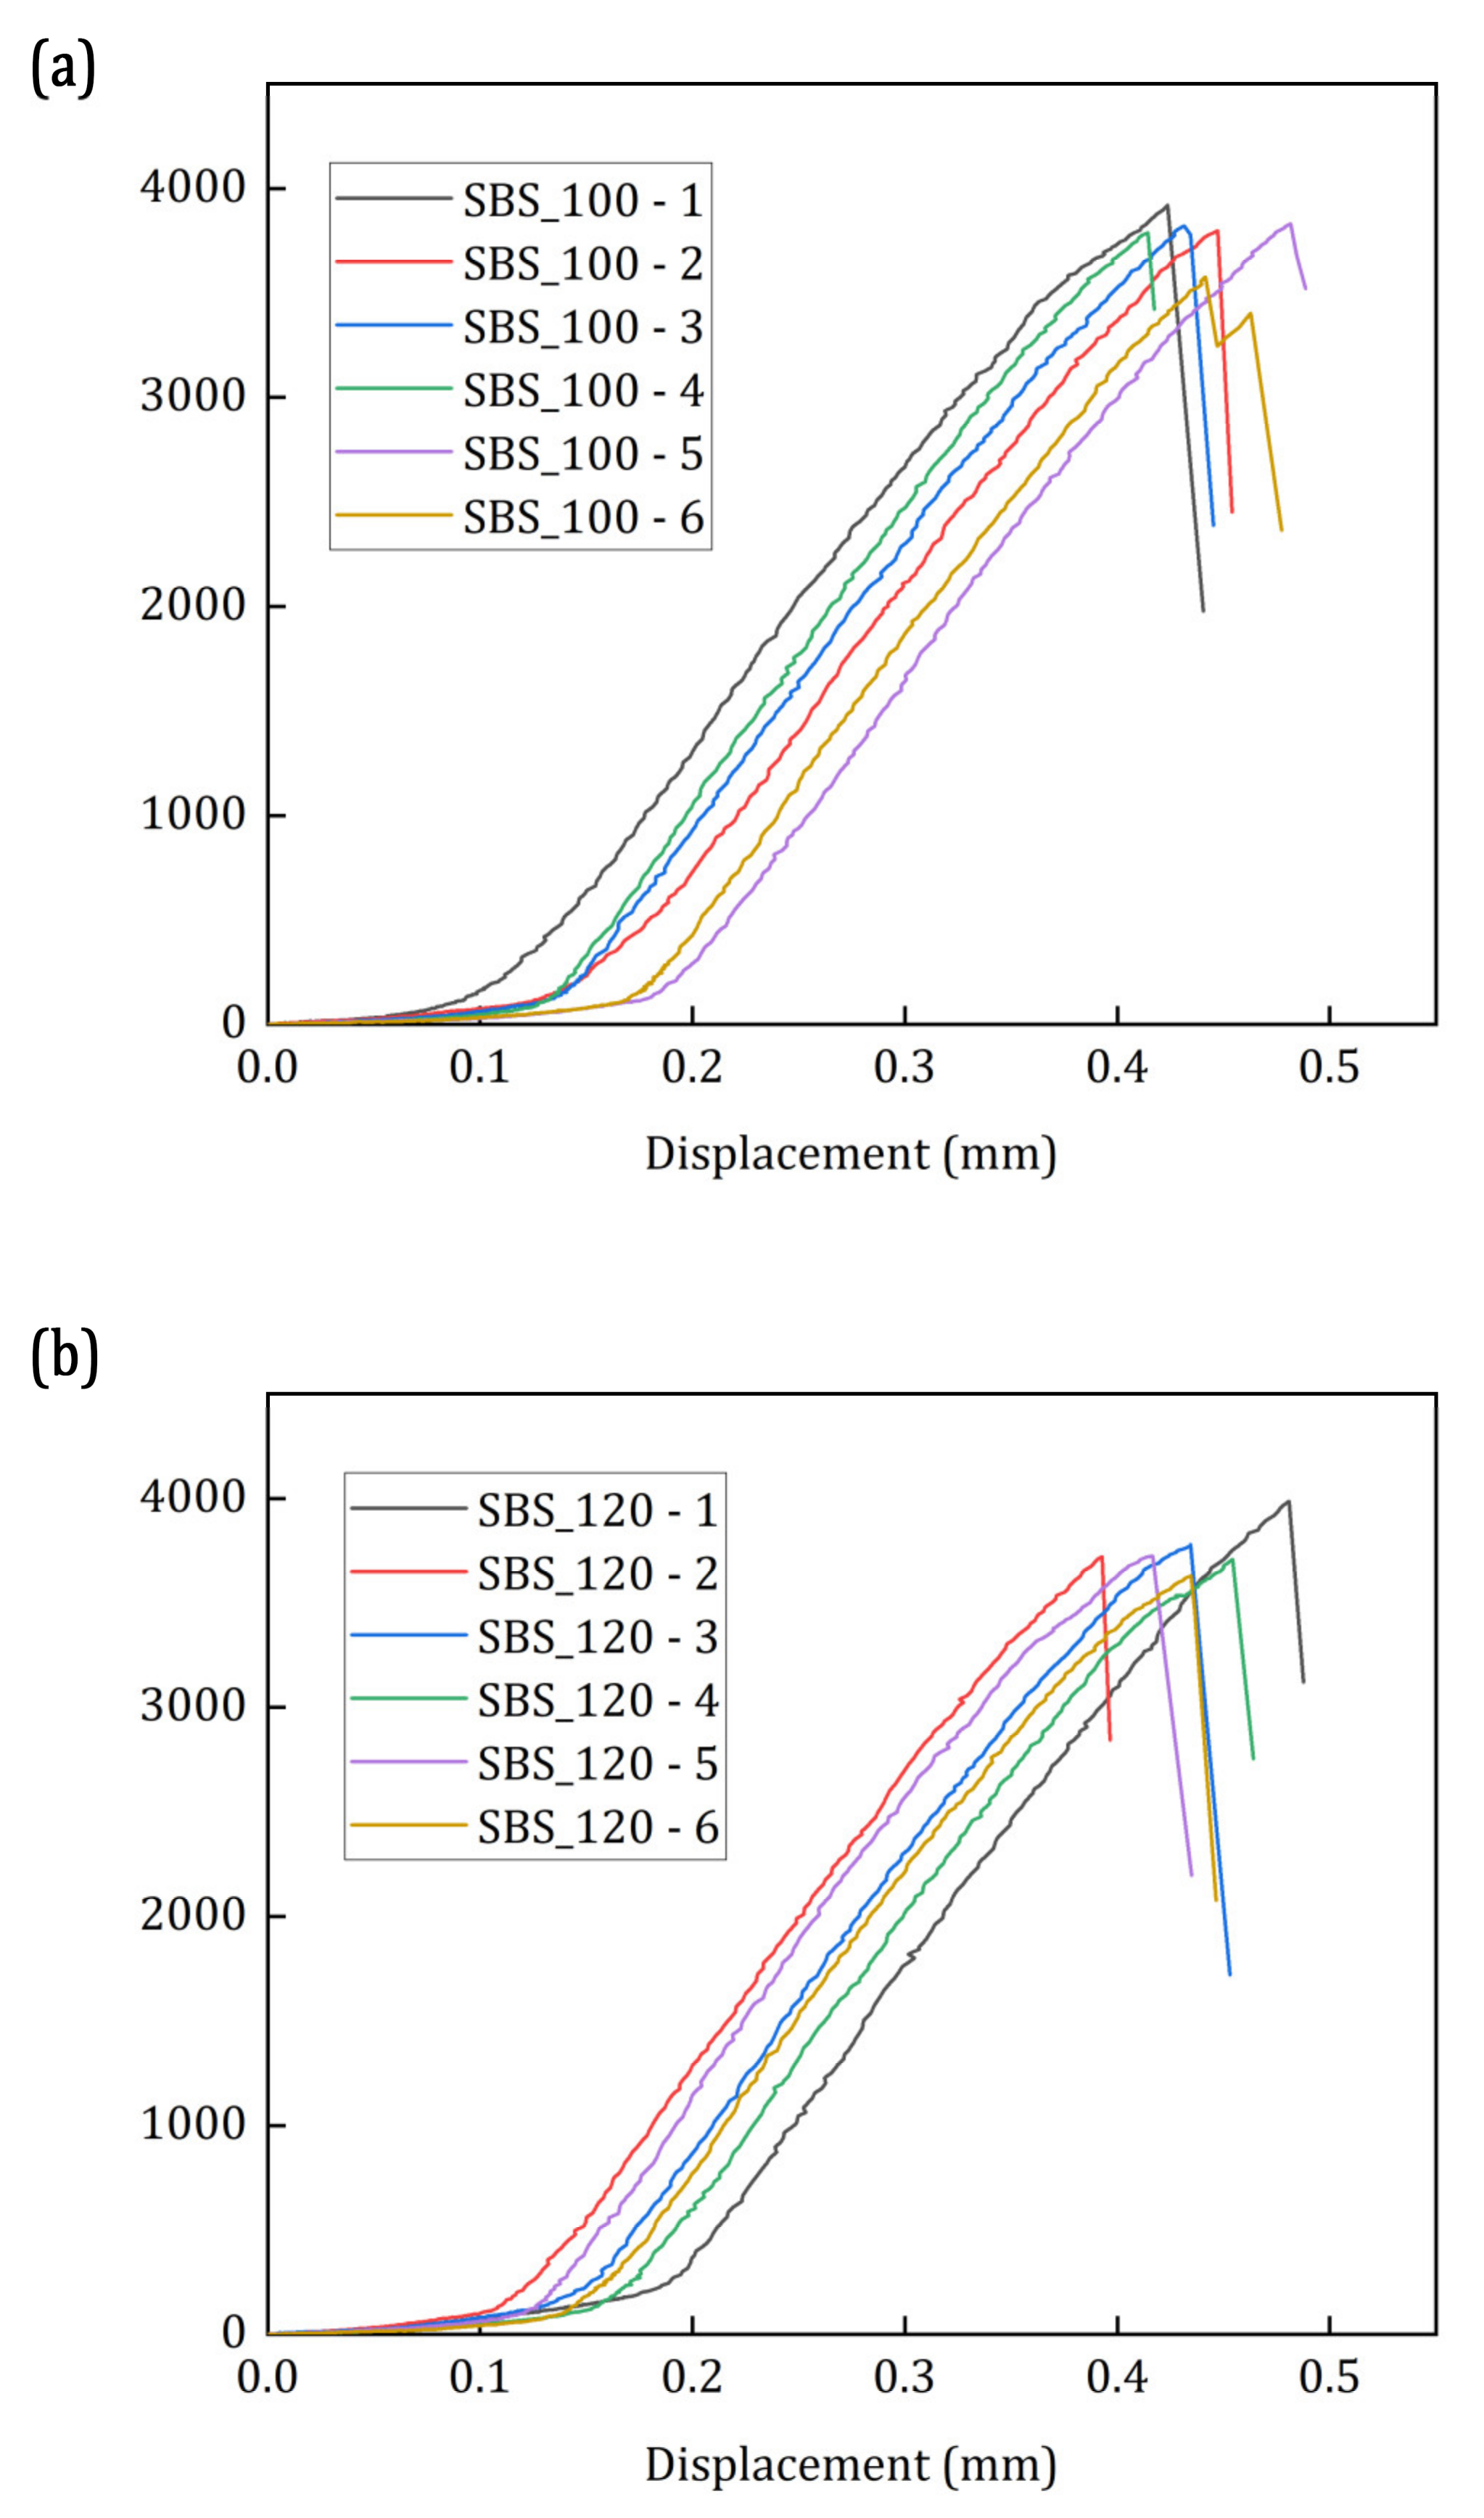
3.1. Interlaminar Shear Strength at Elevated Temperatures
3.2. SEM Analysis
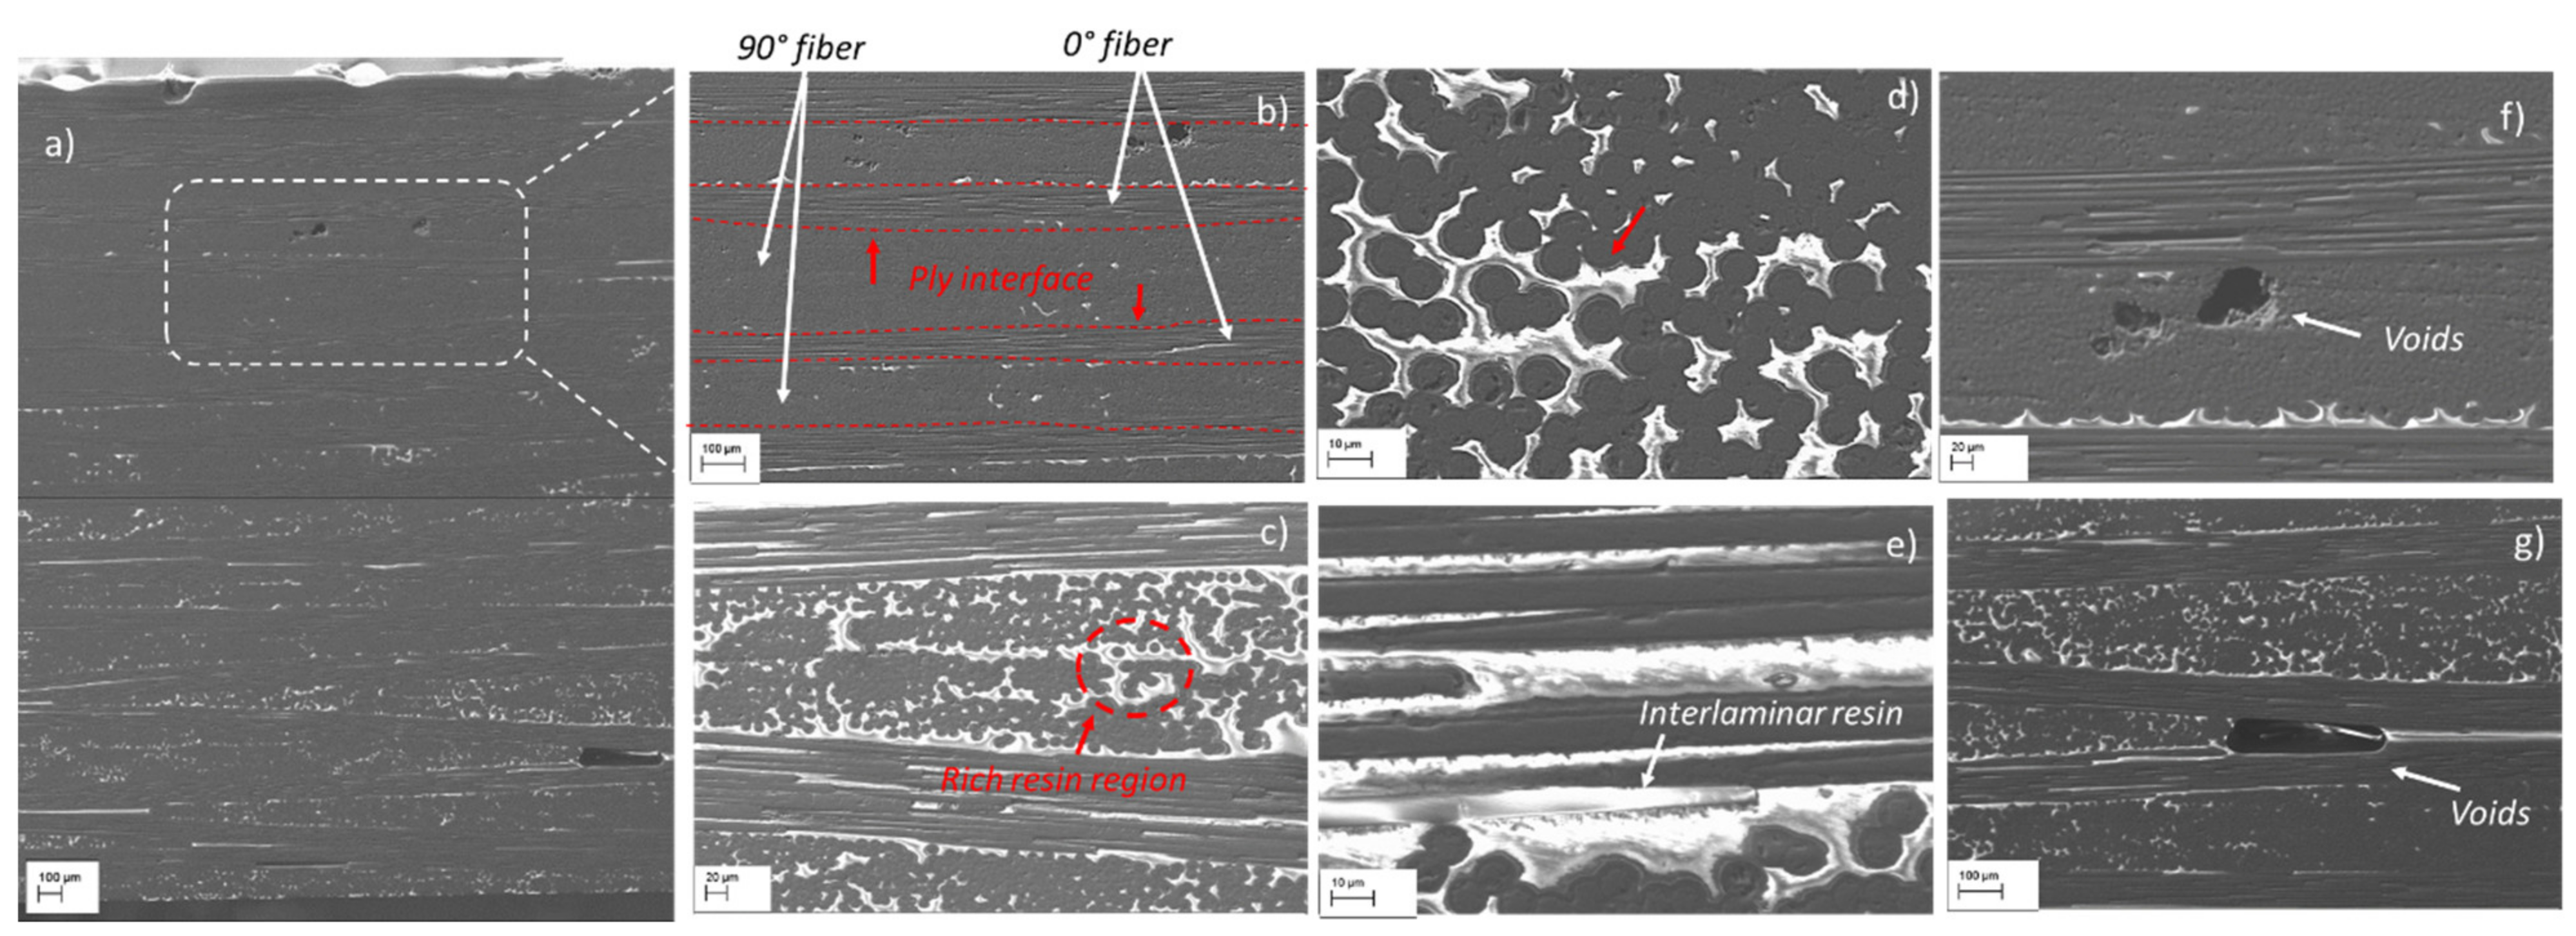
3.2.1. Morphological Characteristics of the SBS Specimens before the Test
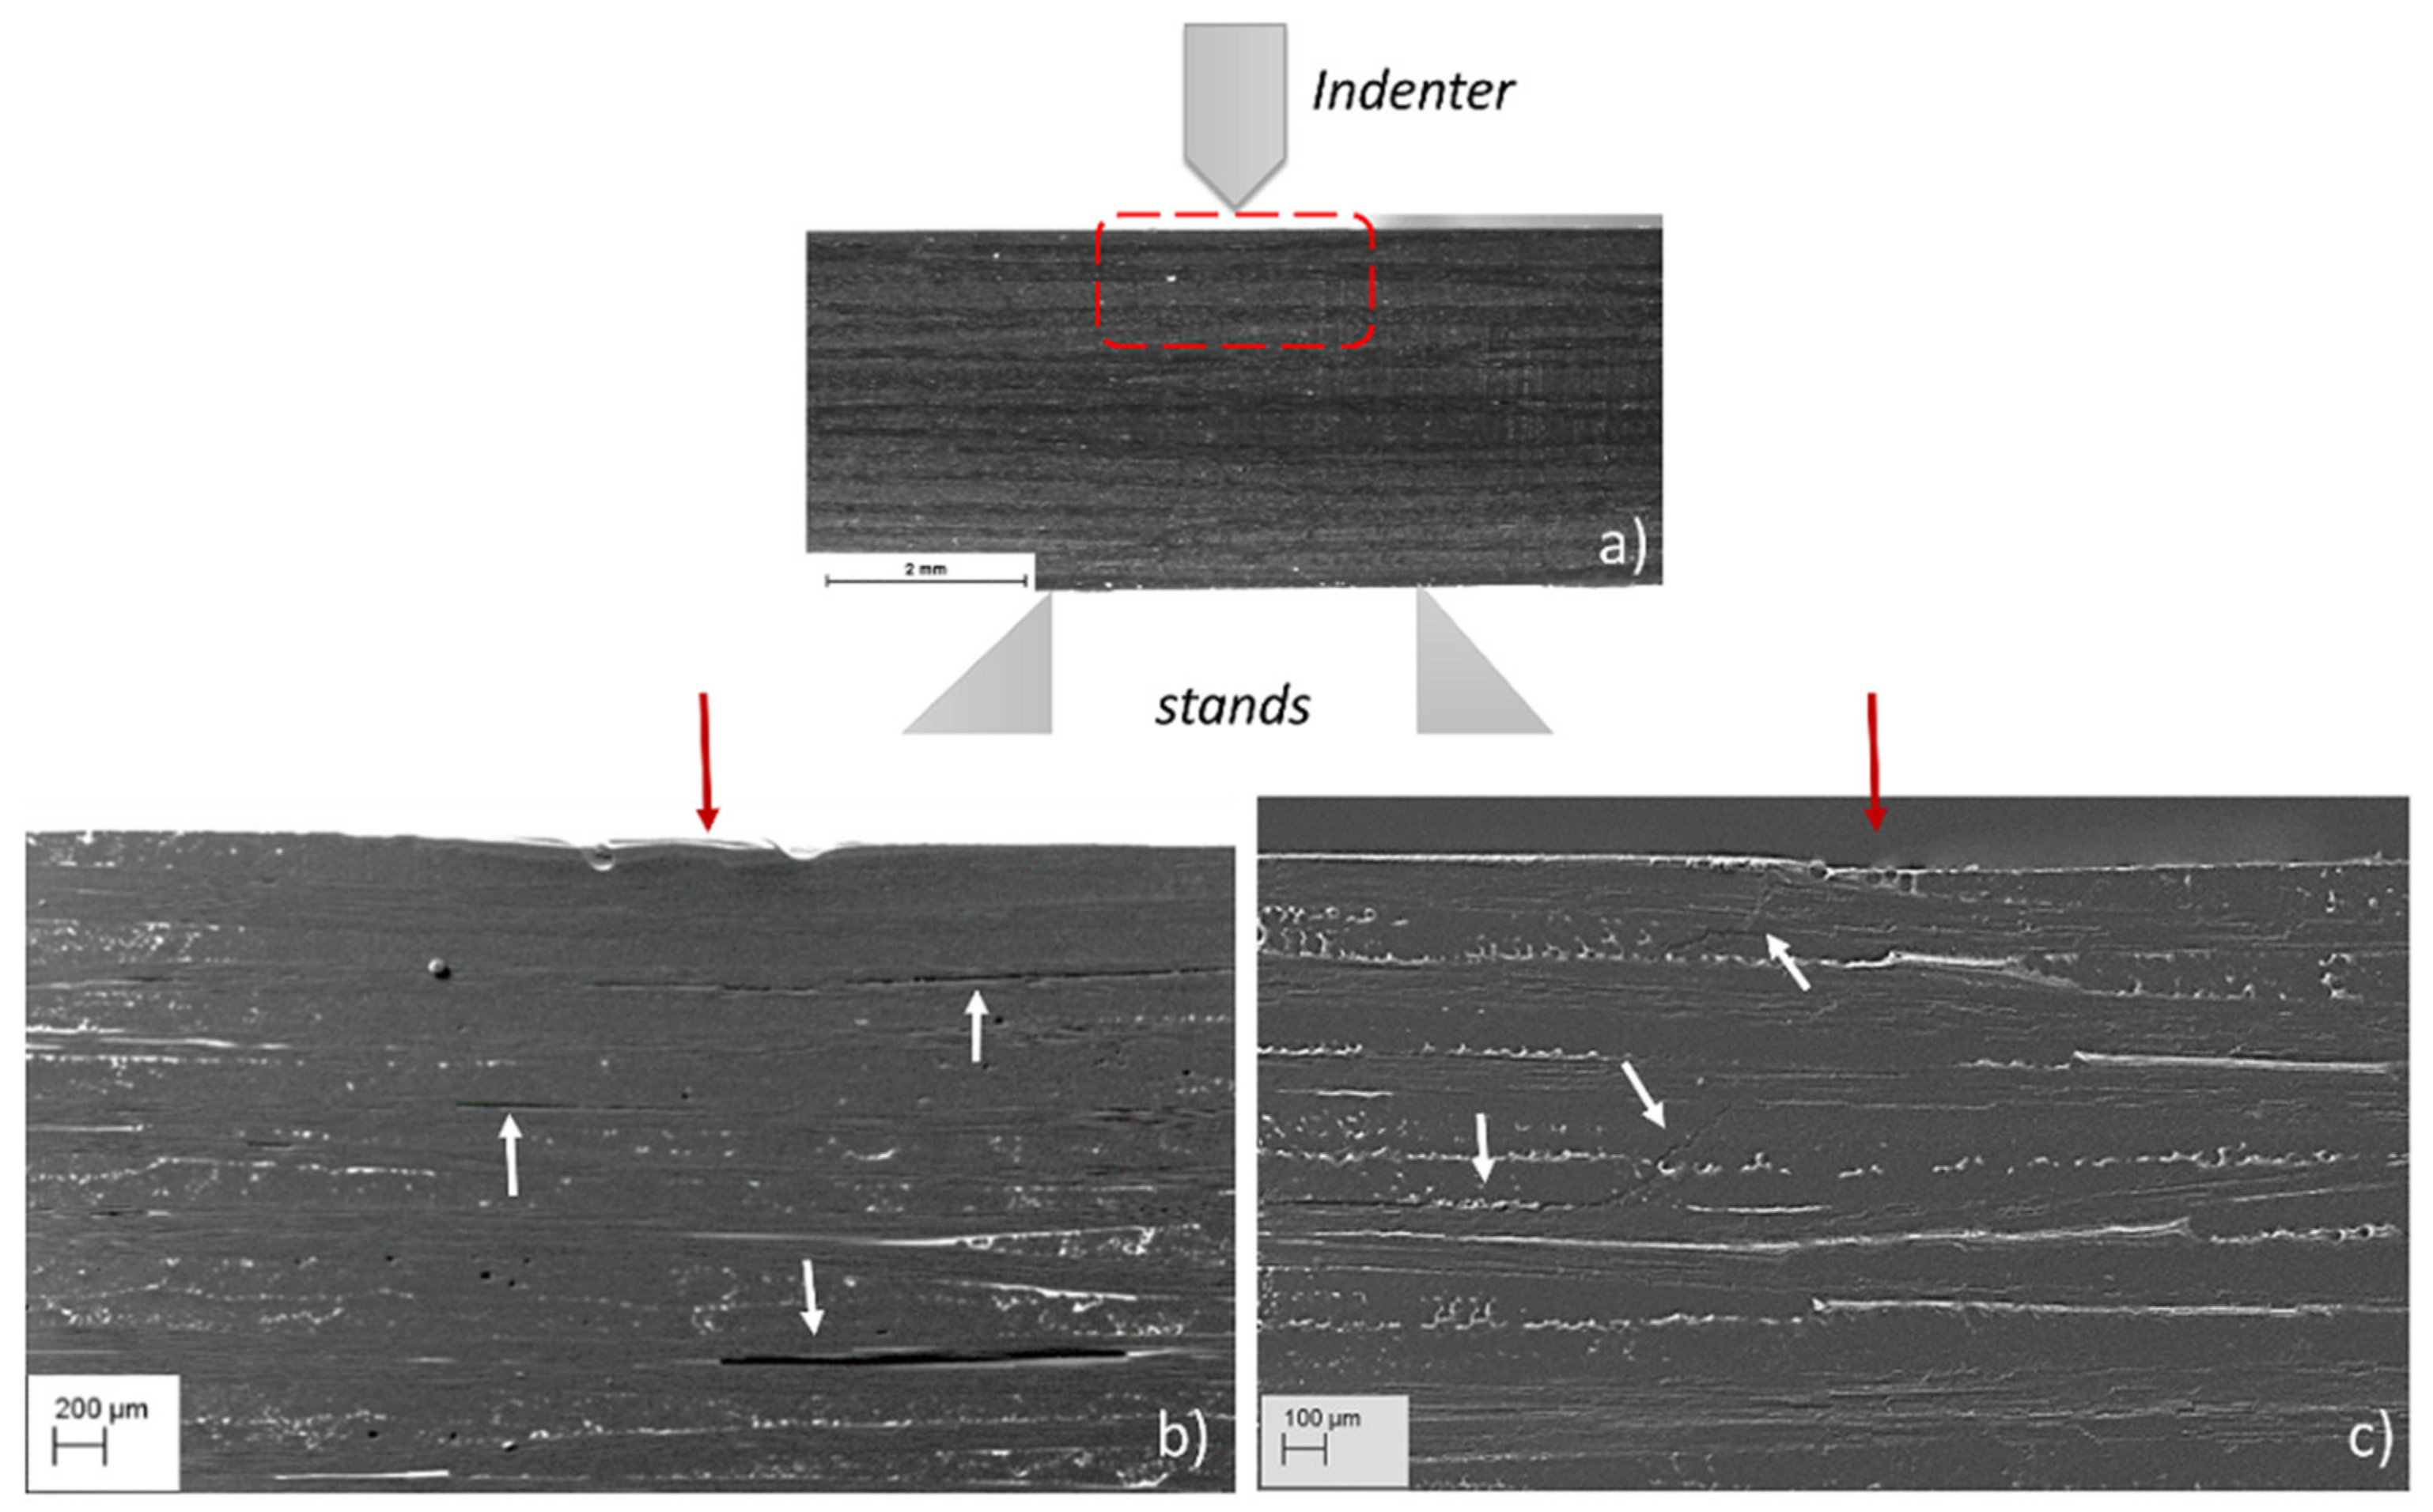
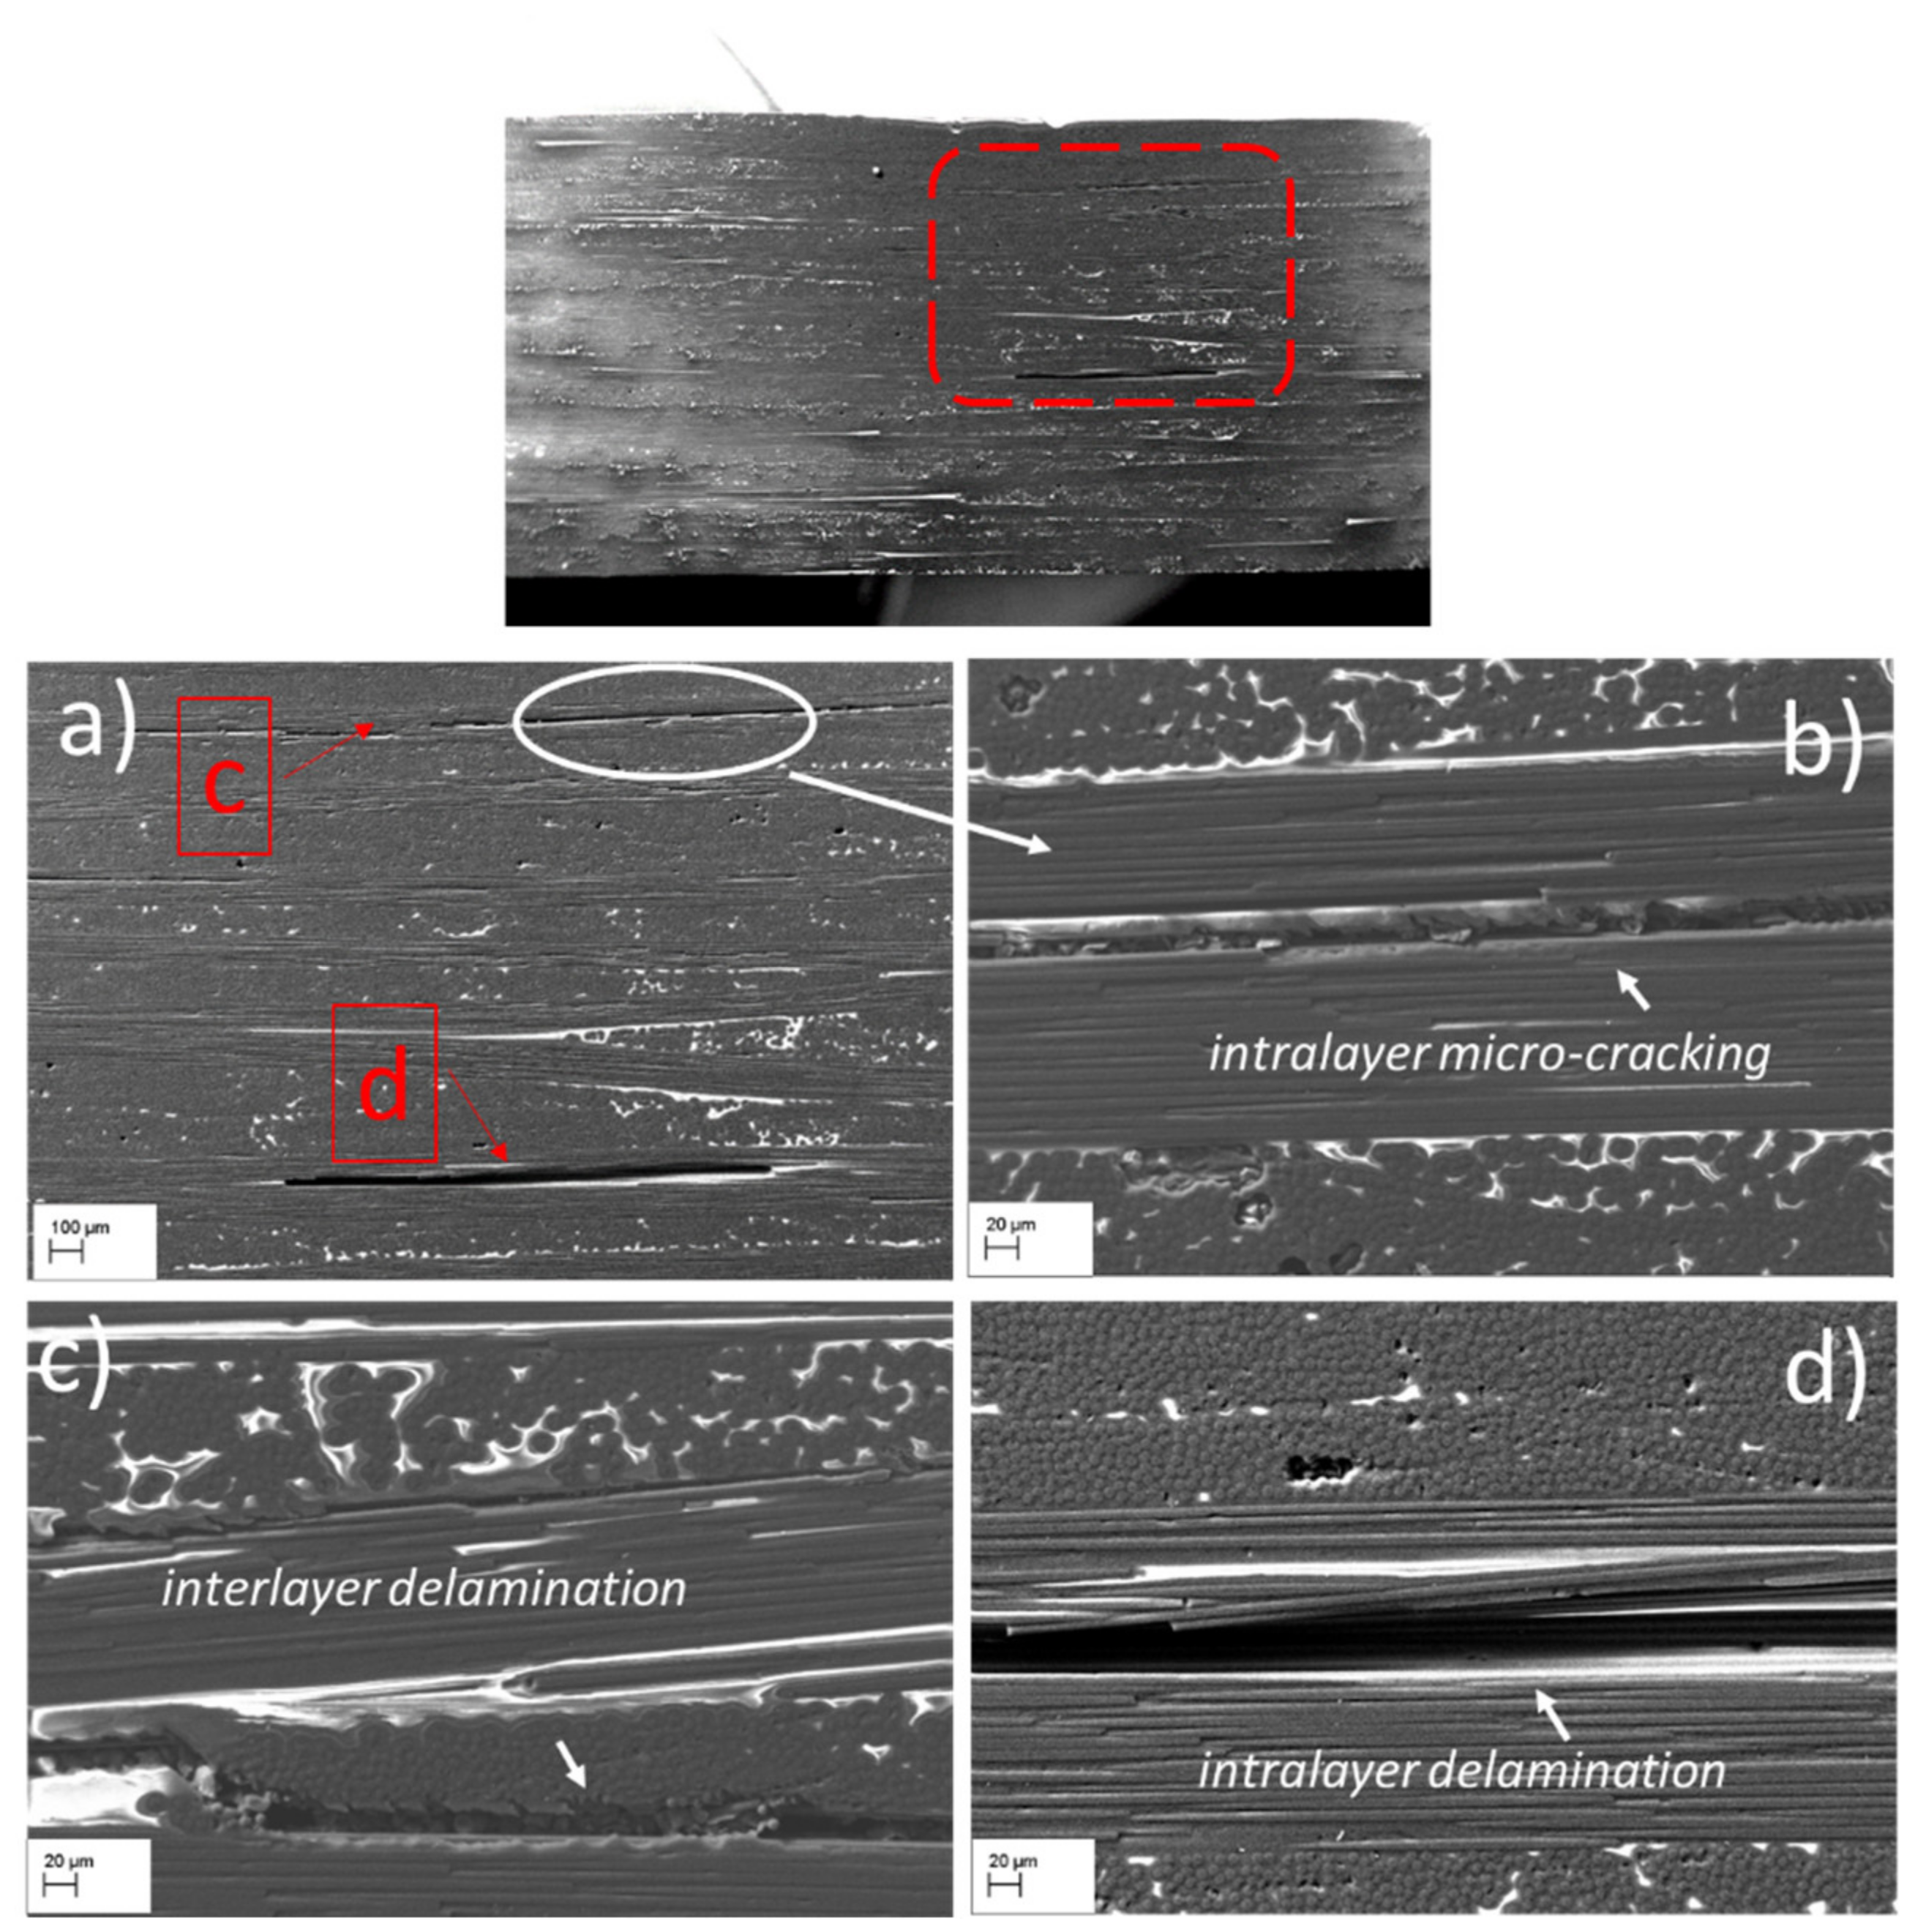
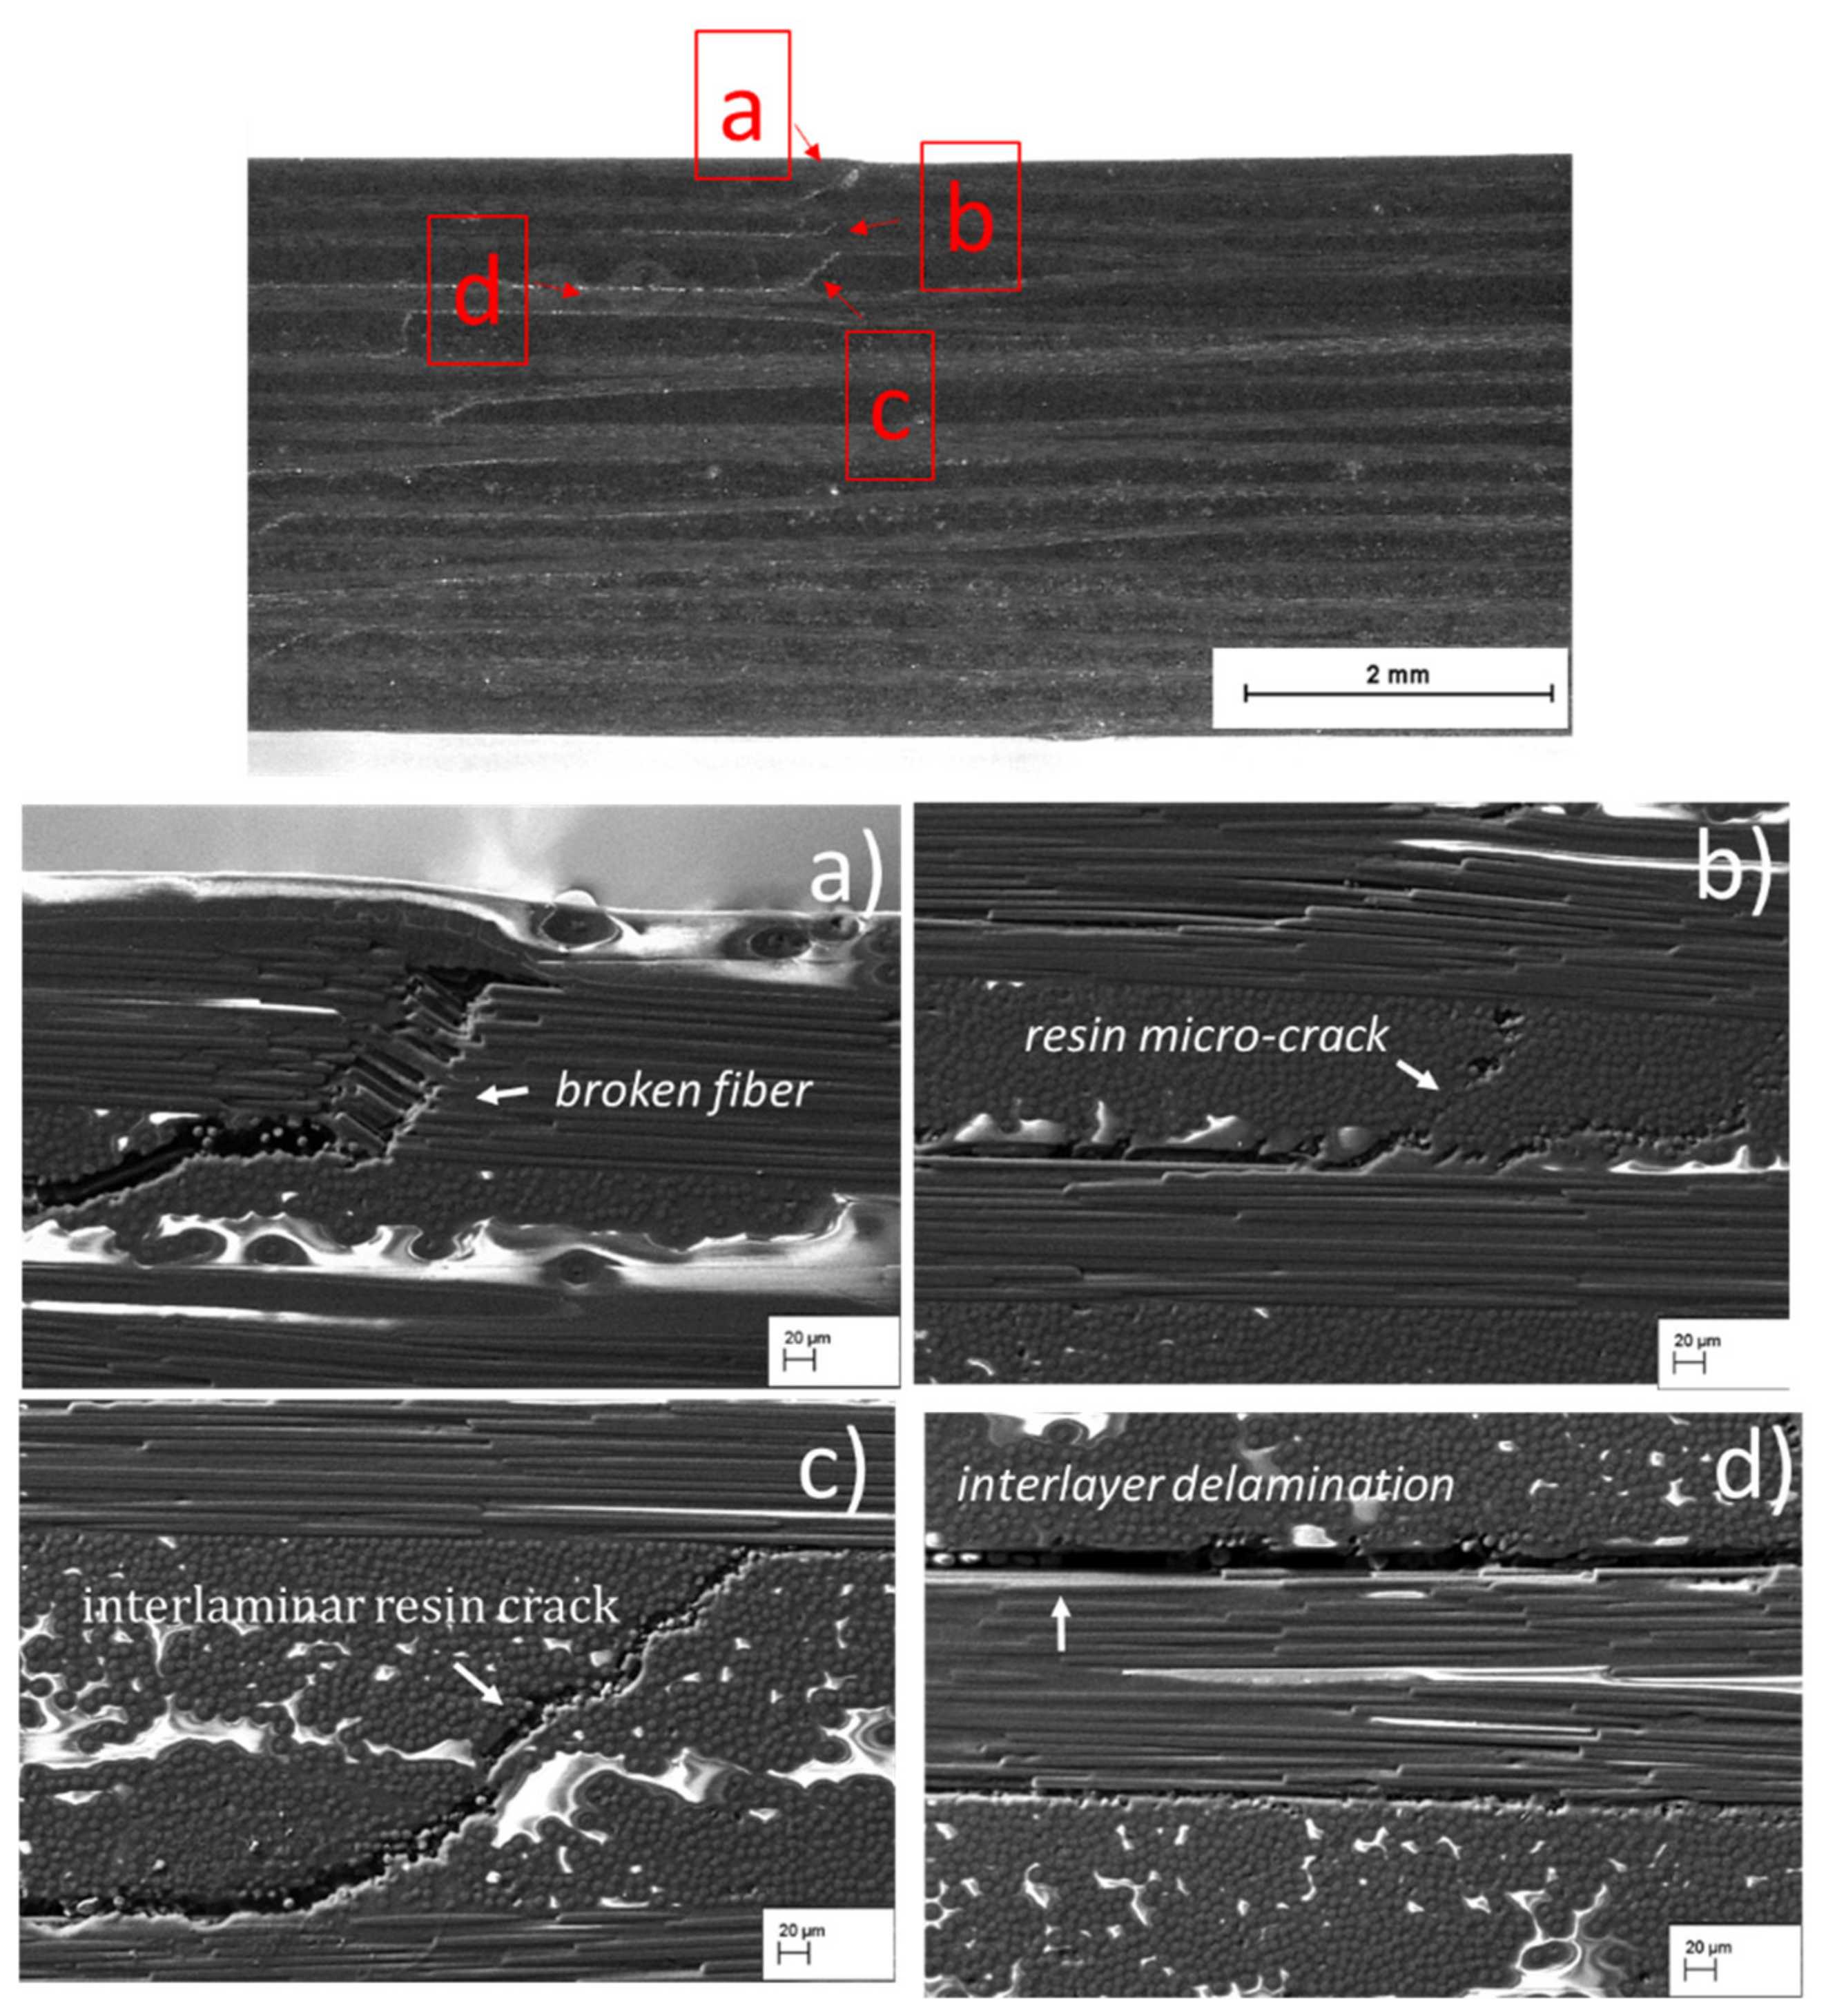
3.2.2. Morphological Characteristics of the SBS Specimens Post Failure: Effects of the Temperature
3.3. Acoustic Emission Analysis
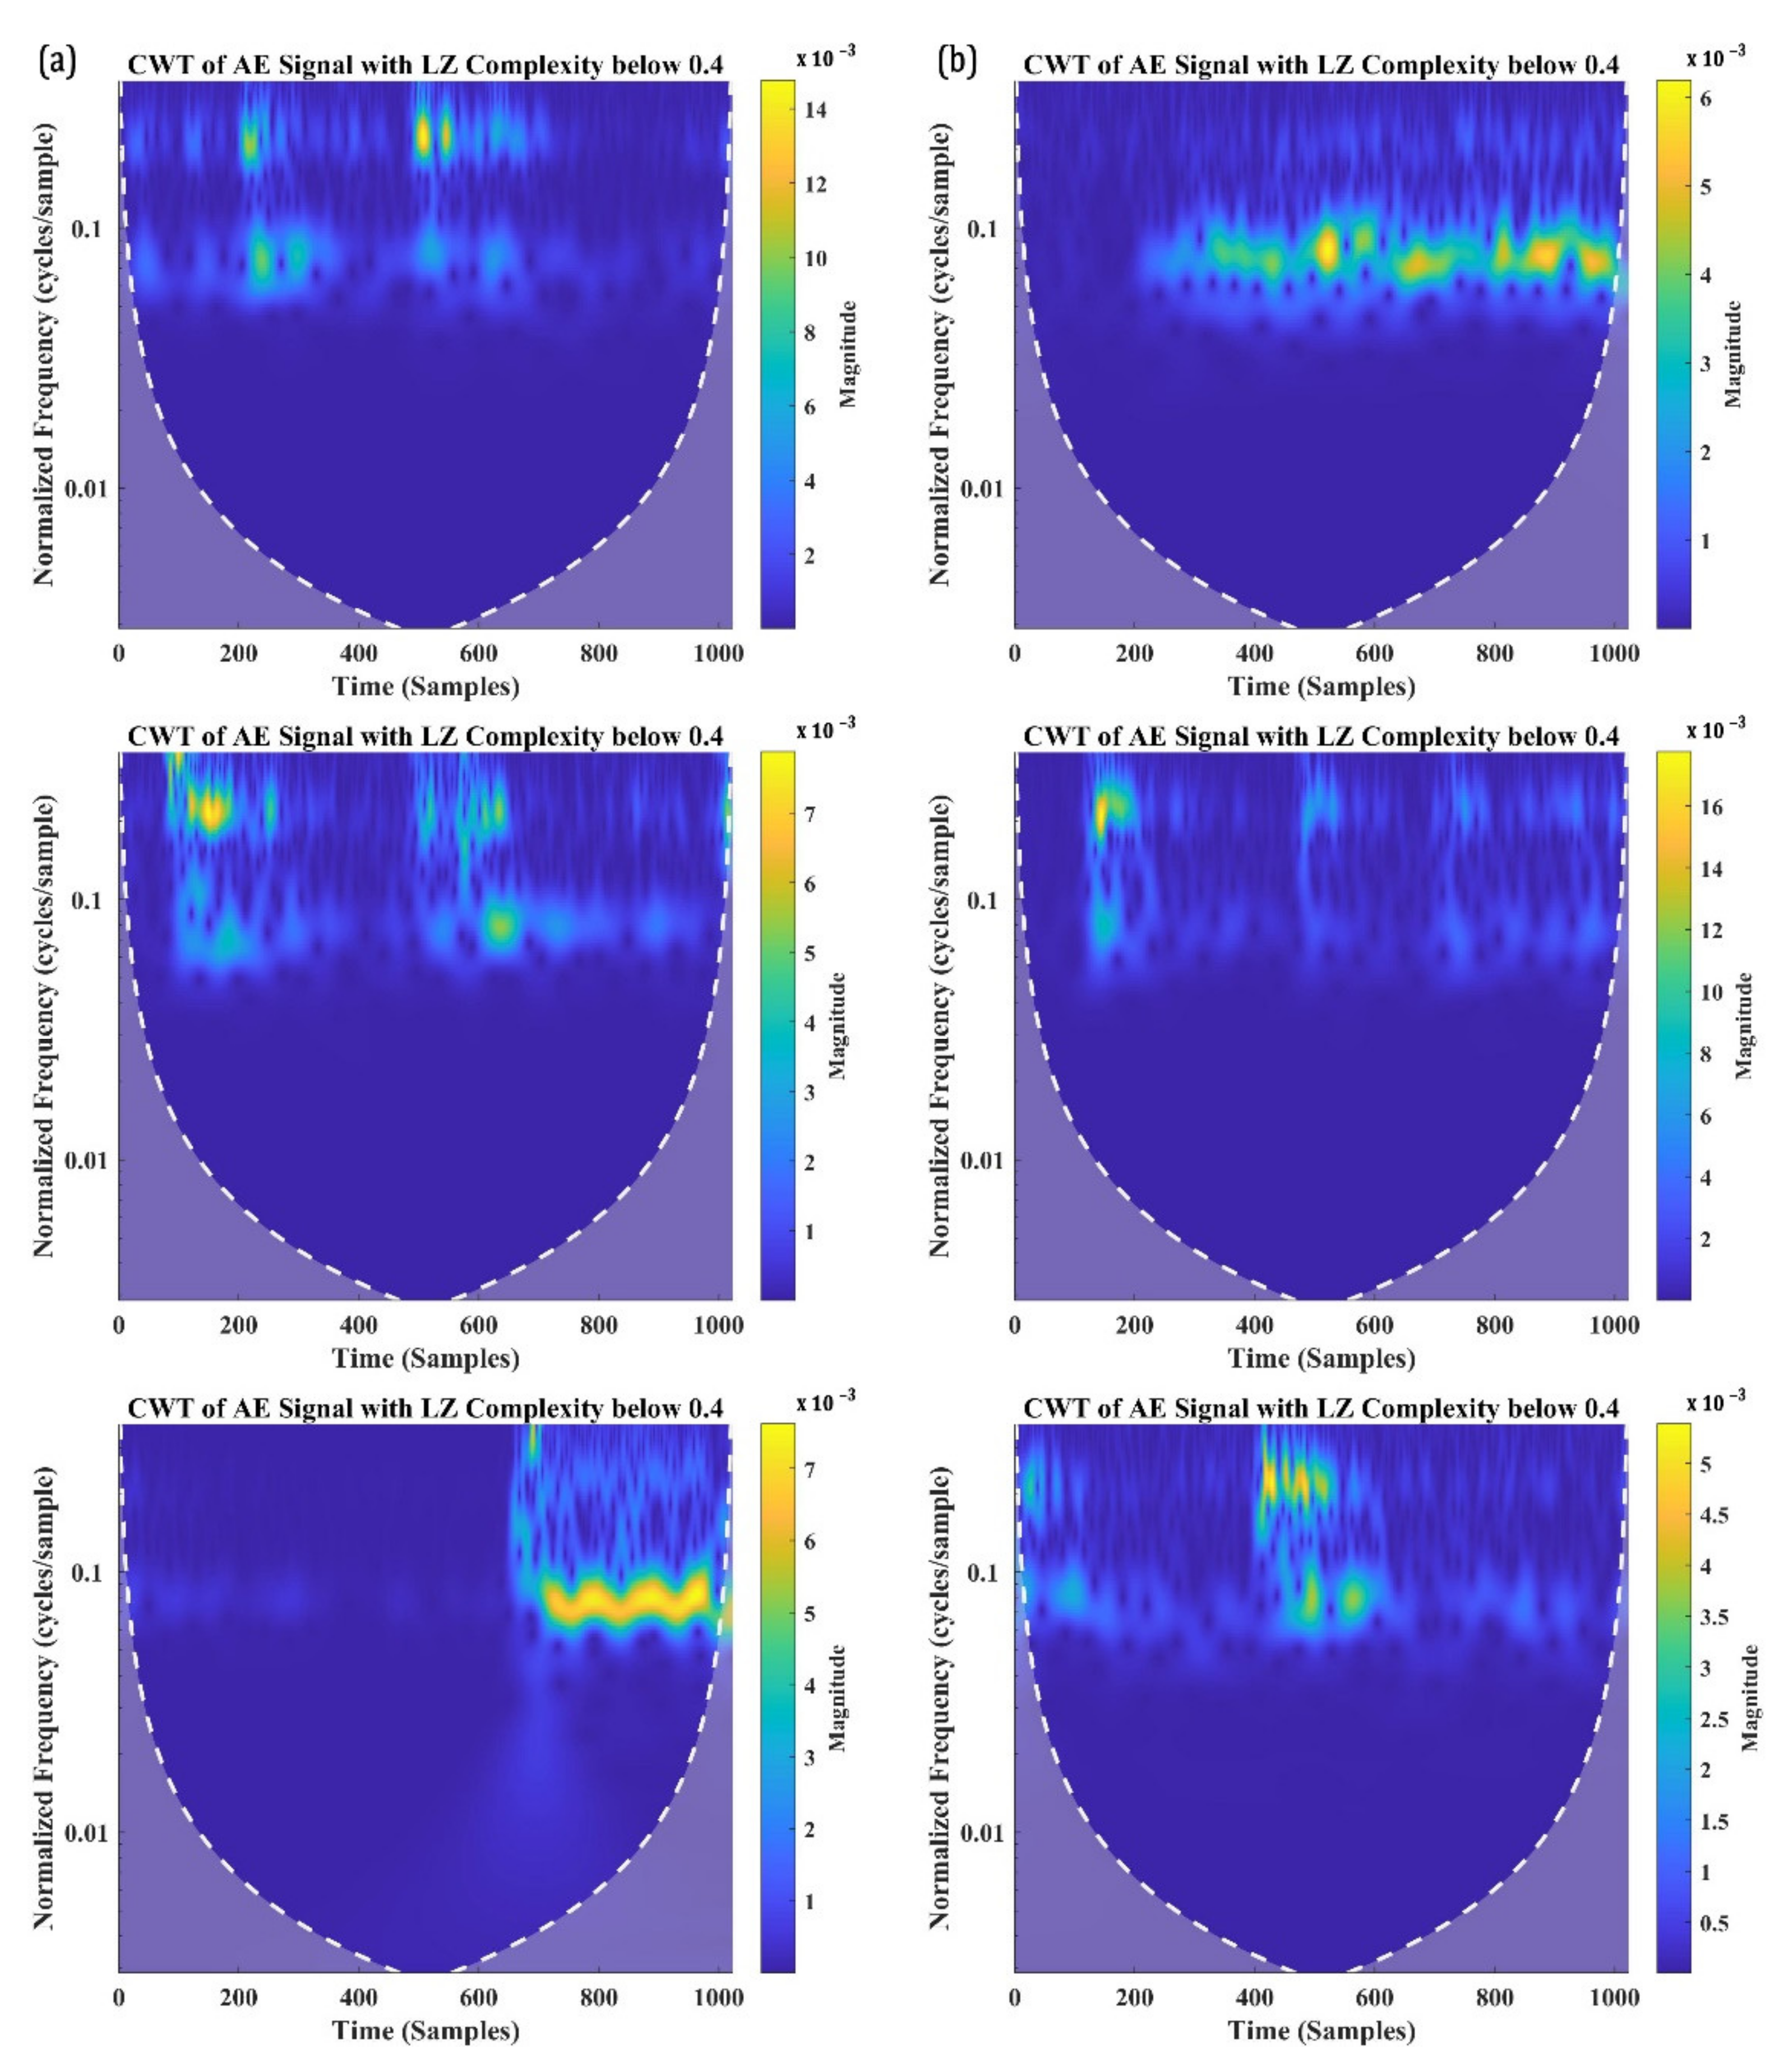
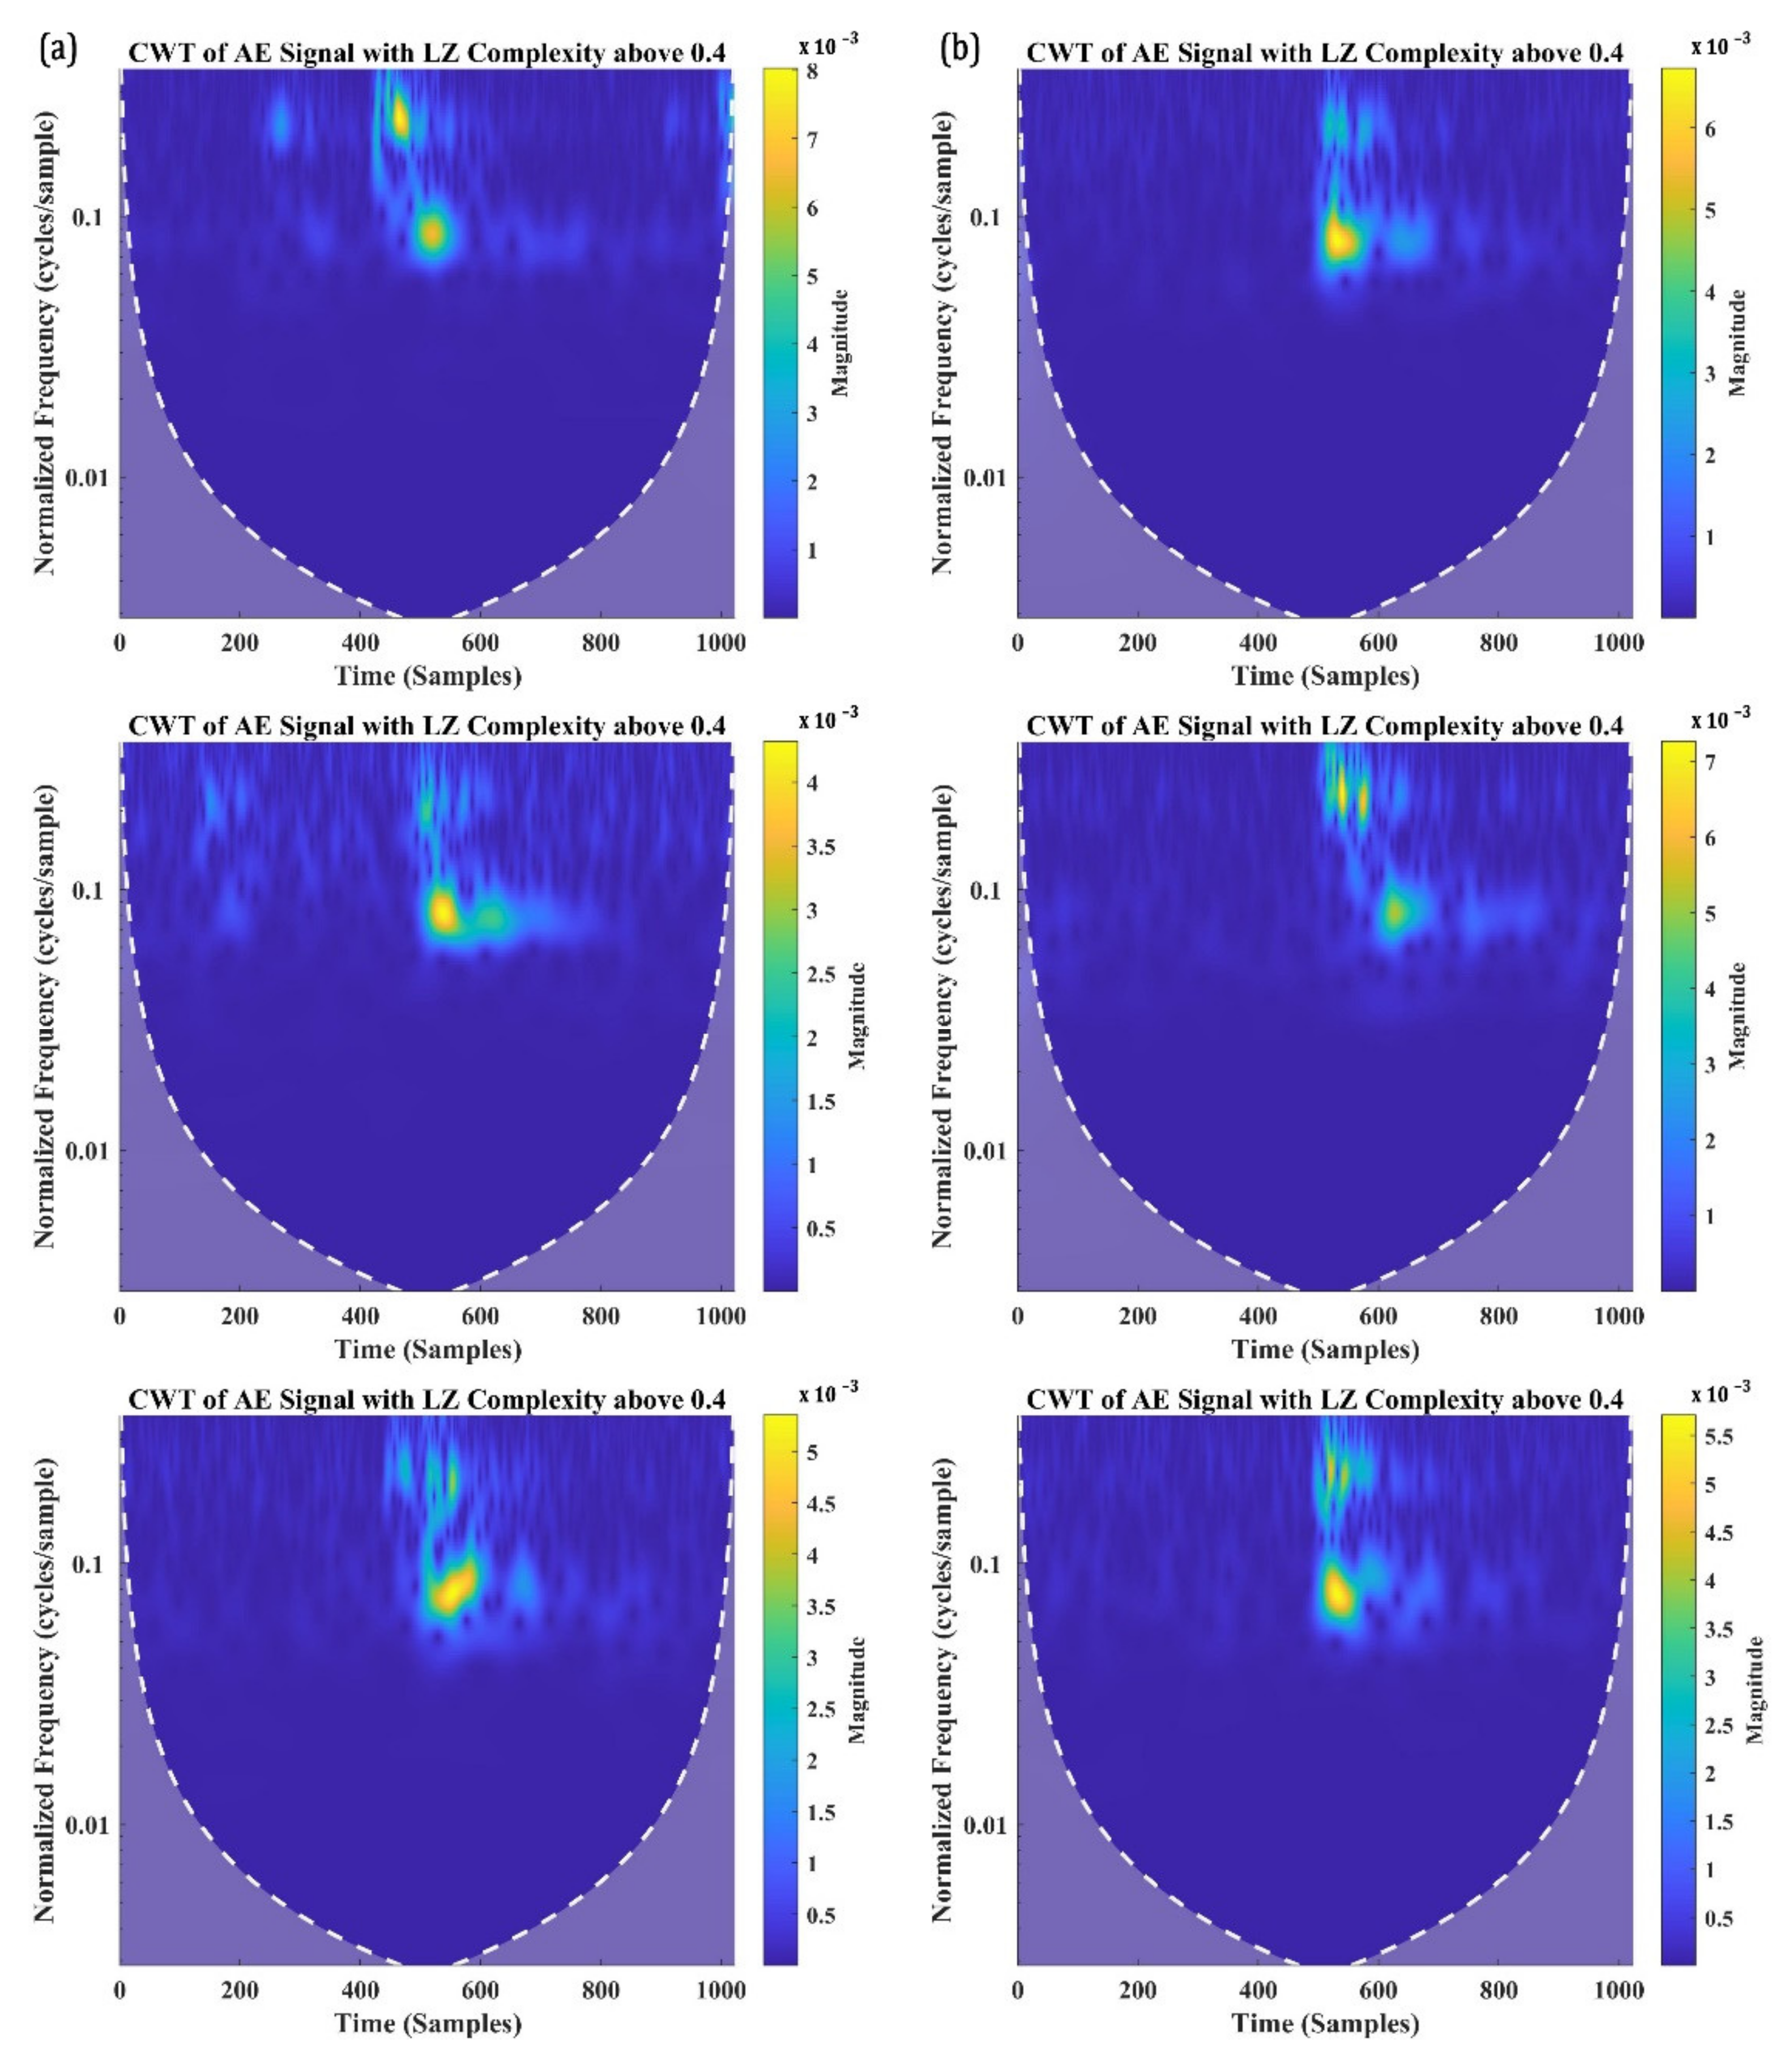
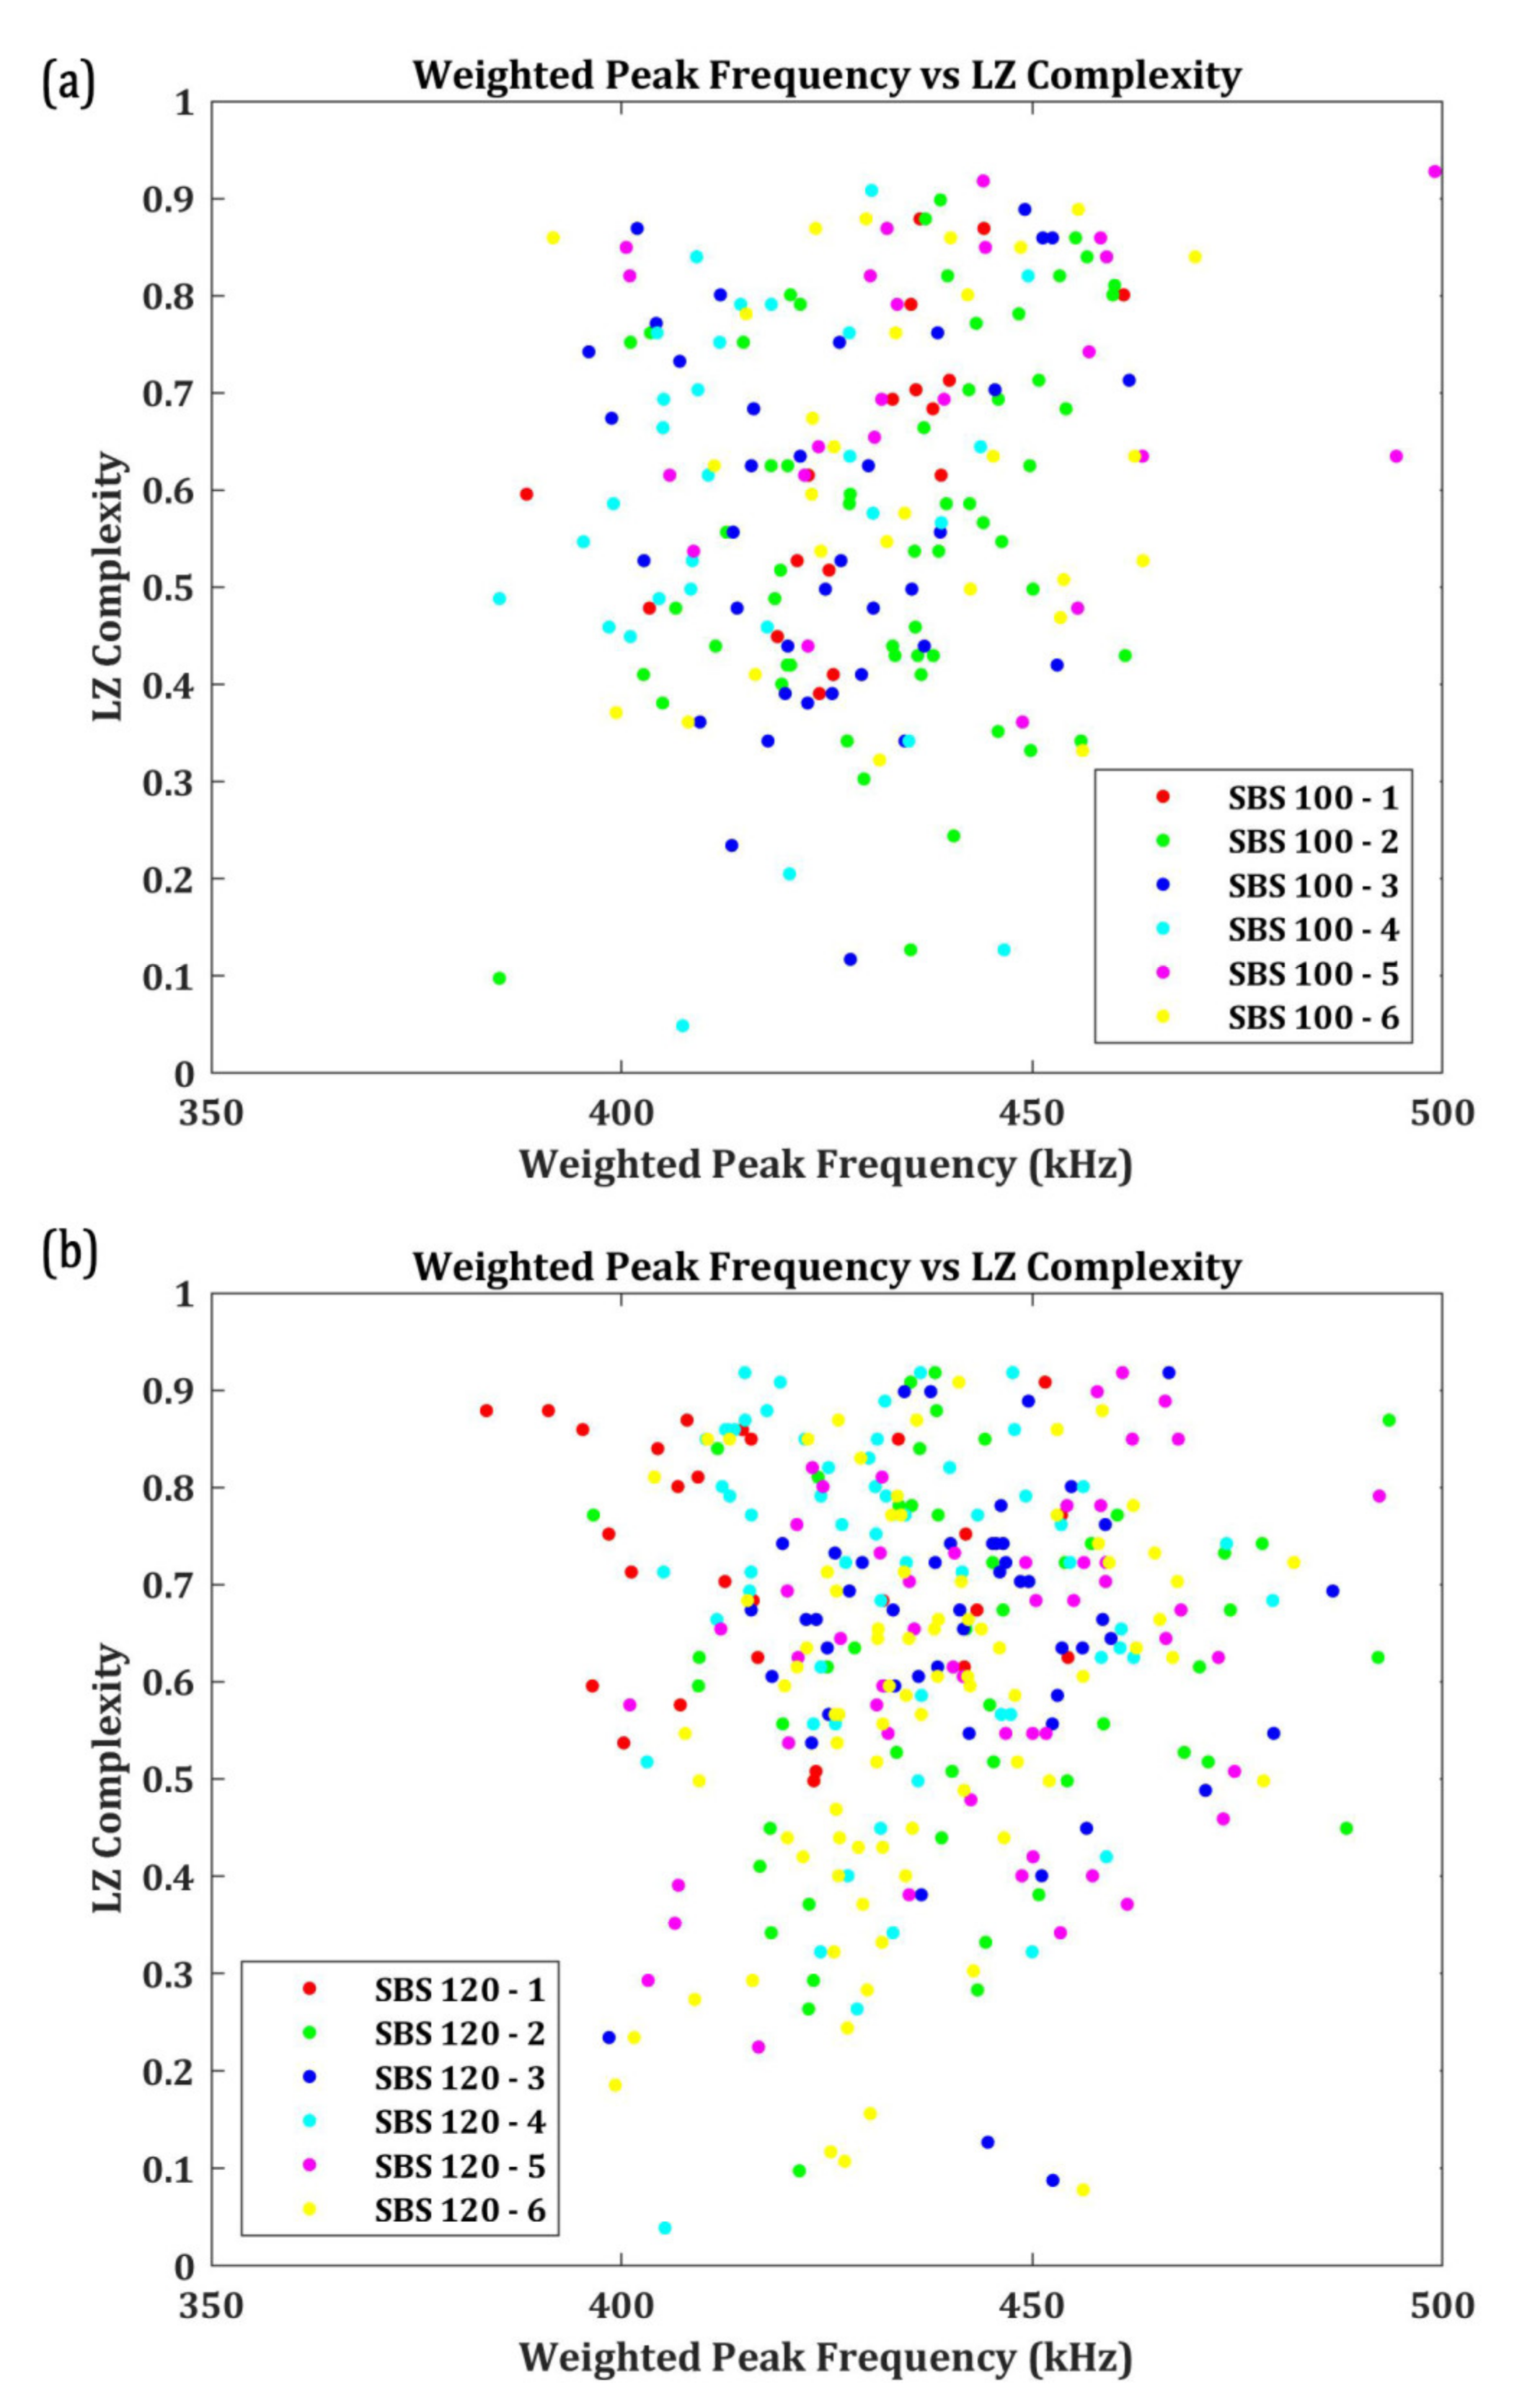
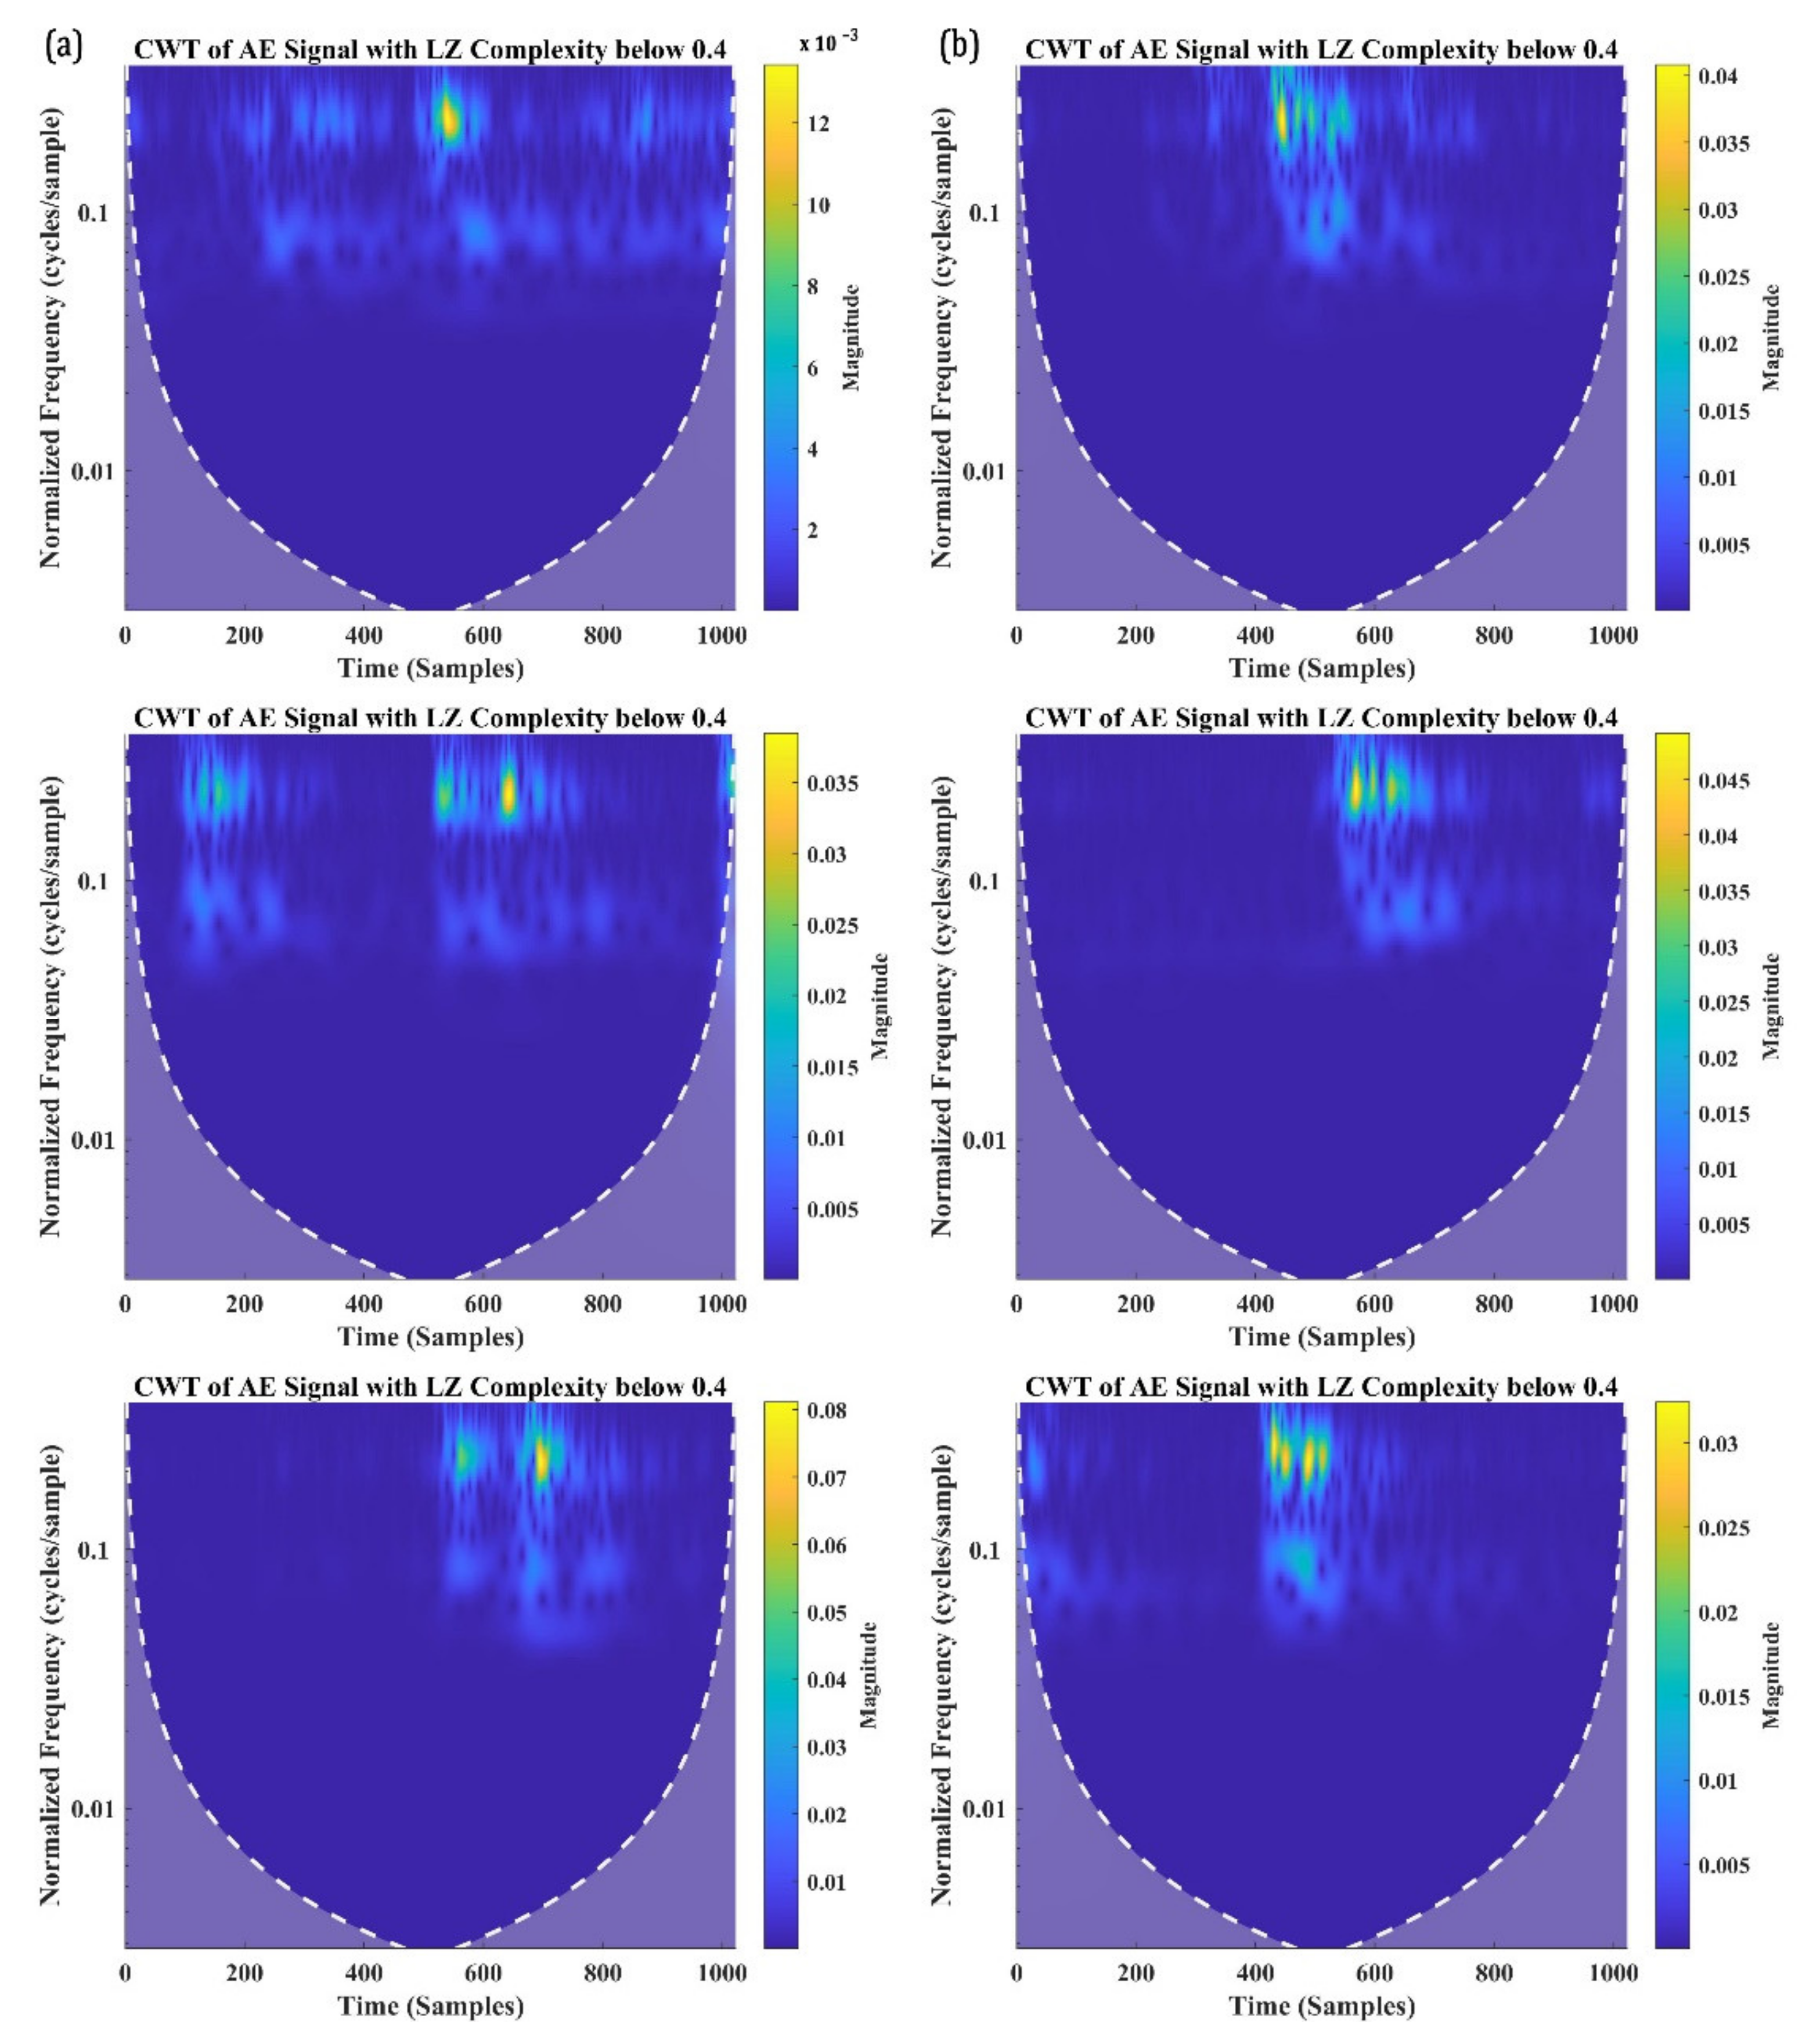
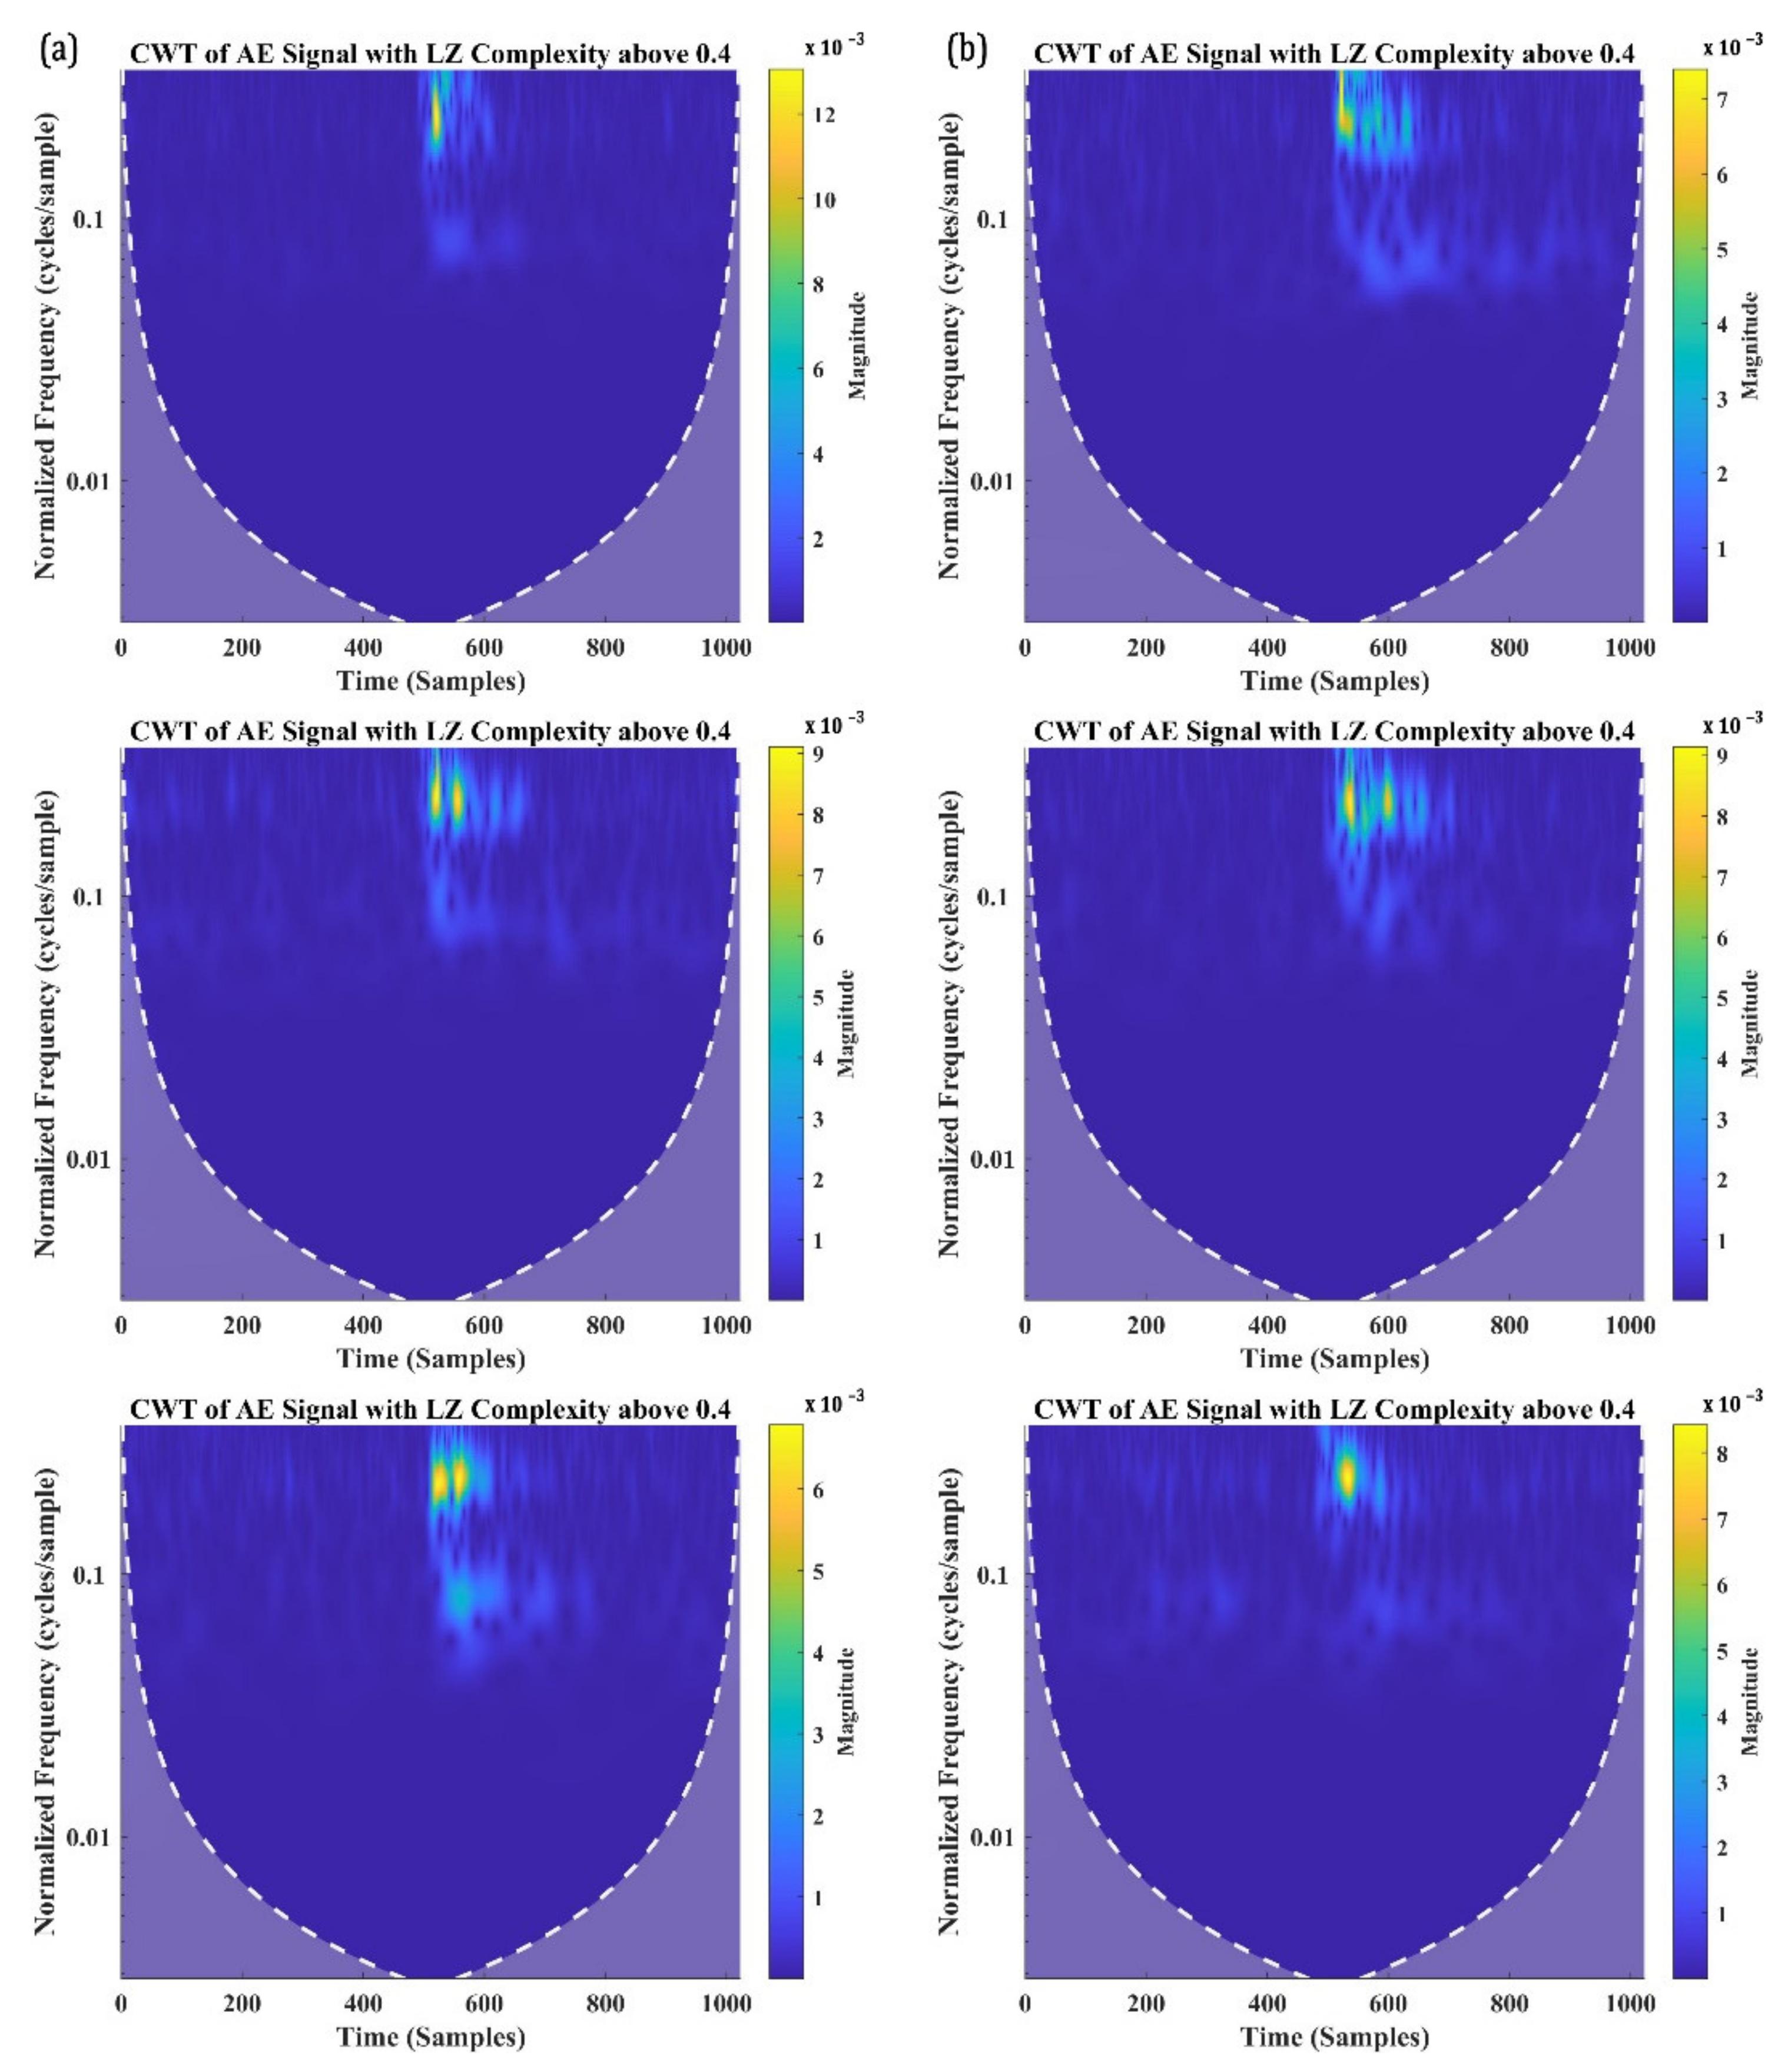
3.4. LZ Complexity and CWT Results of the Acoustic Emission Signals
4. Conclusions
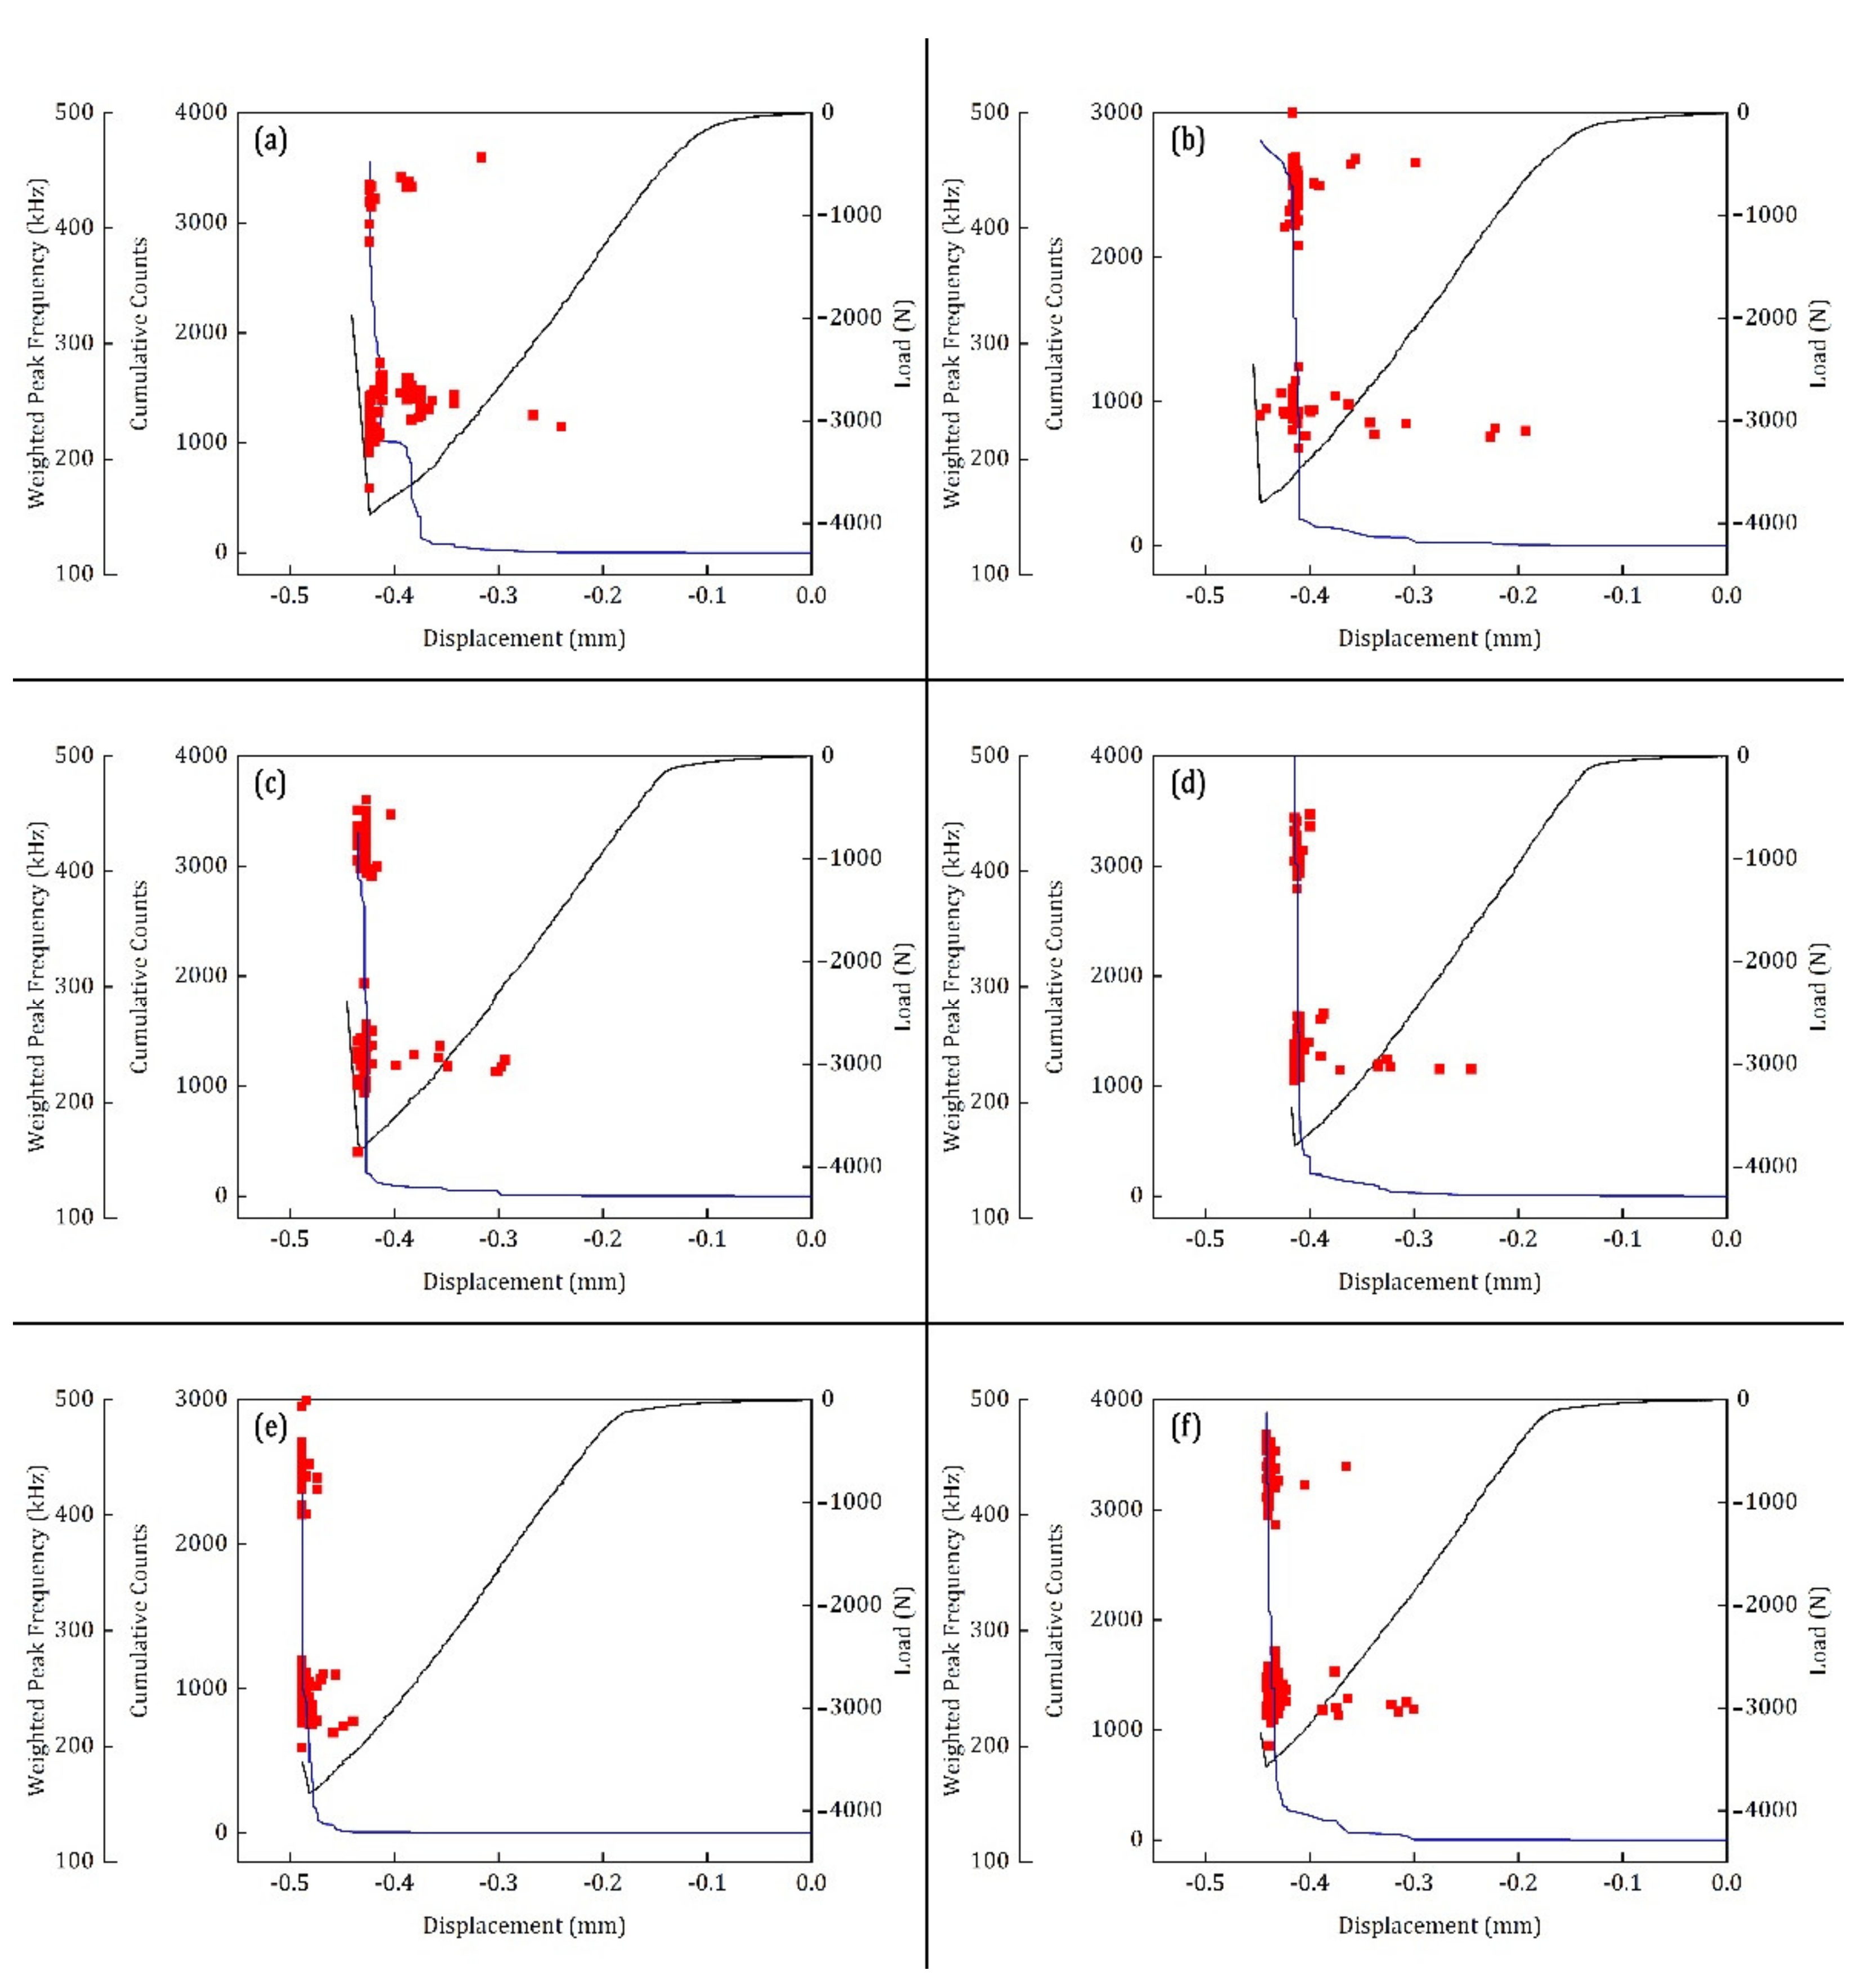
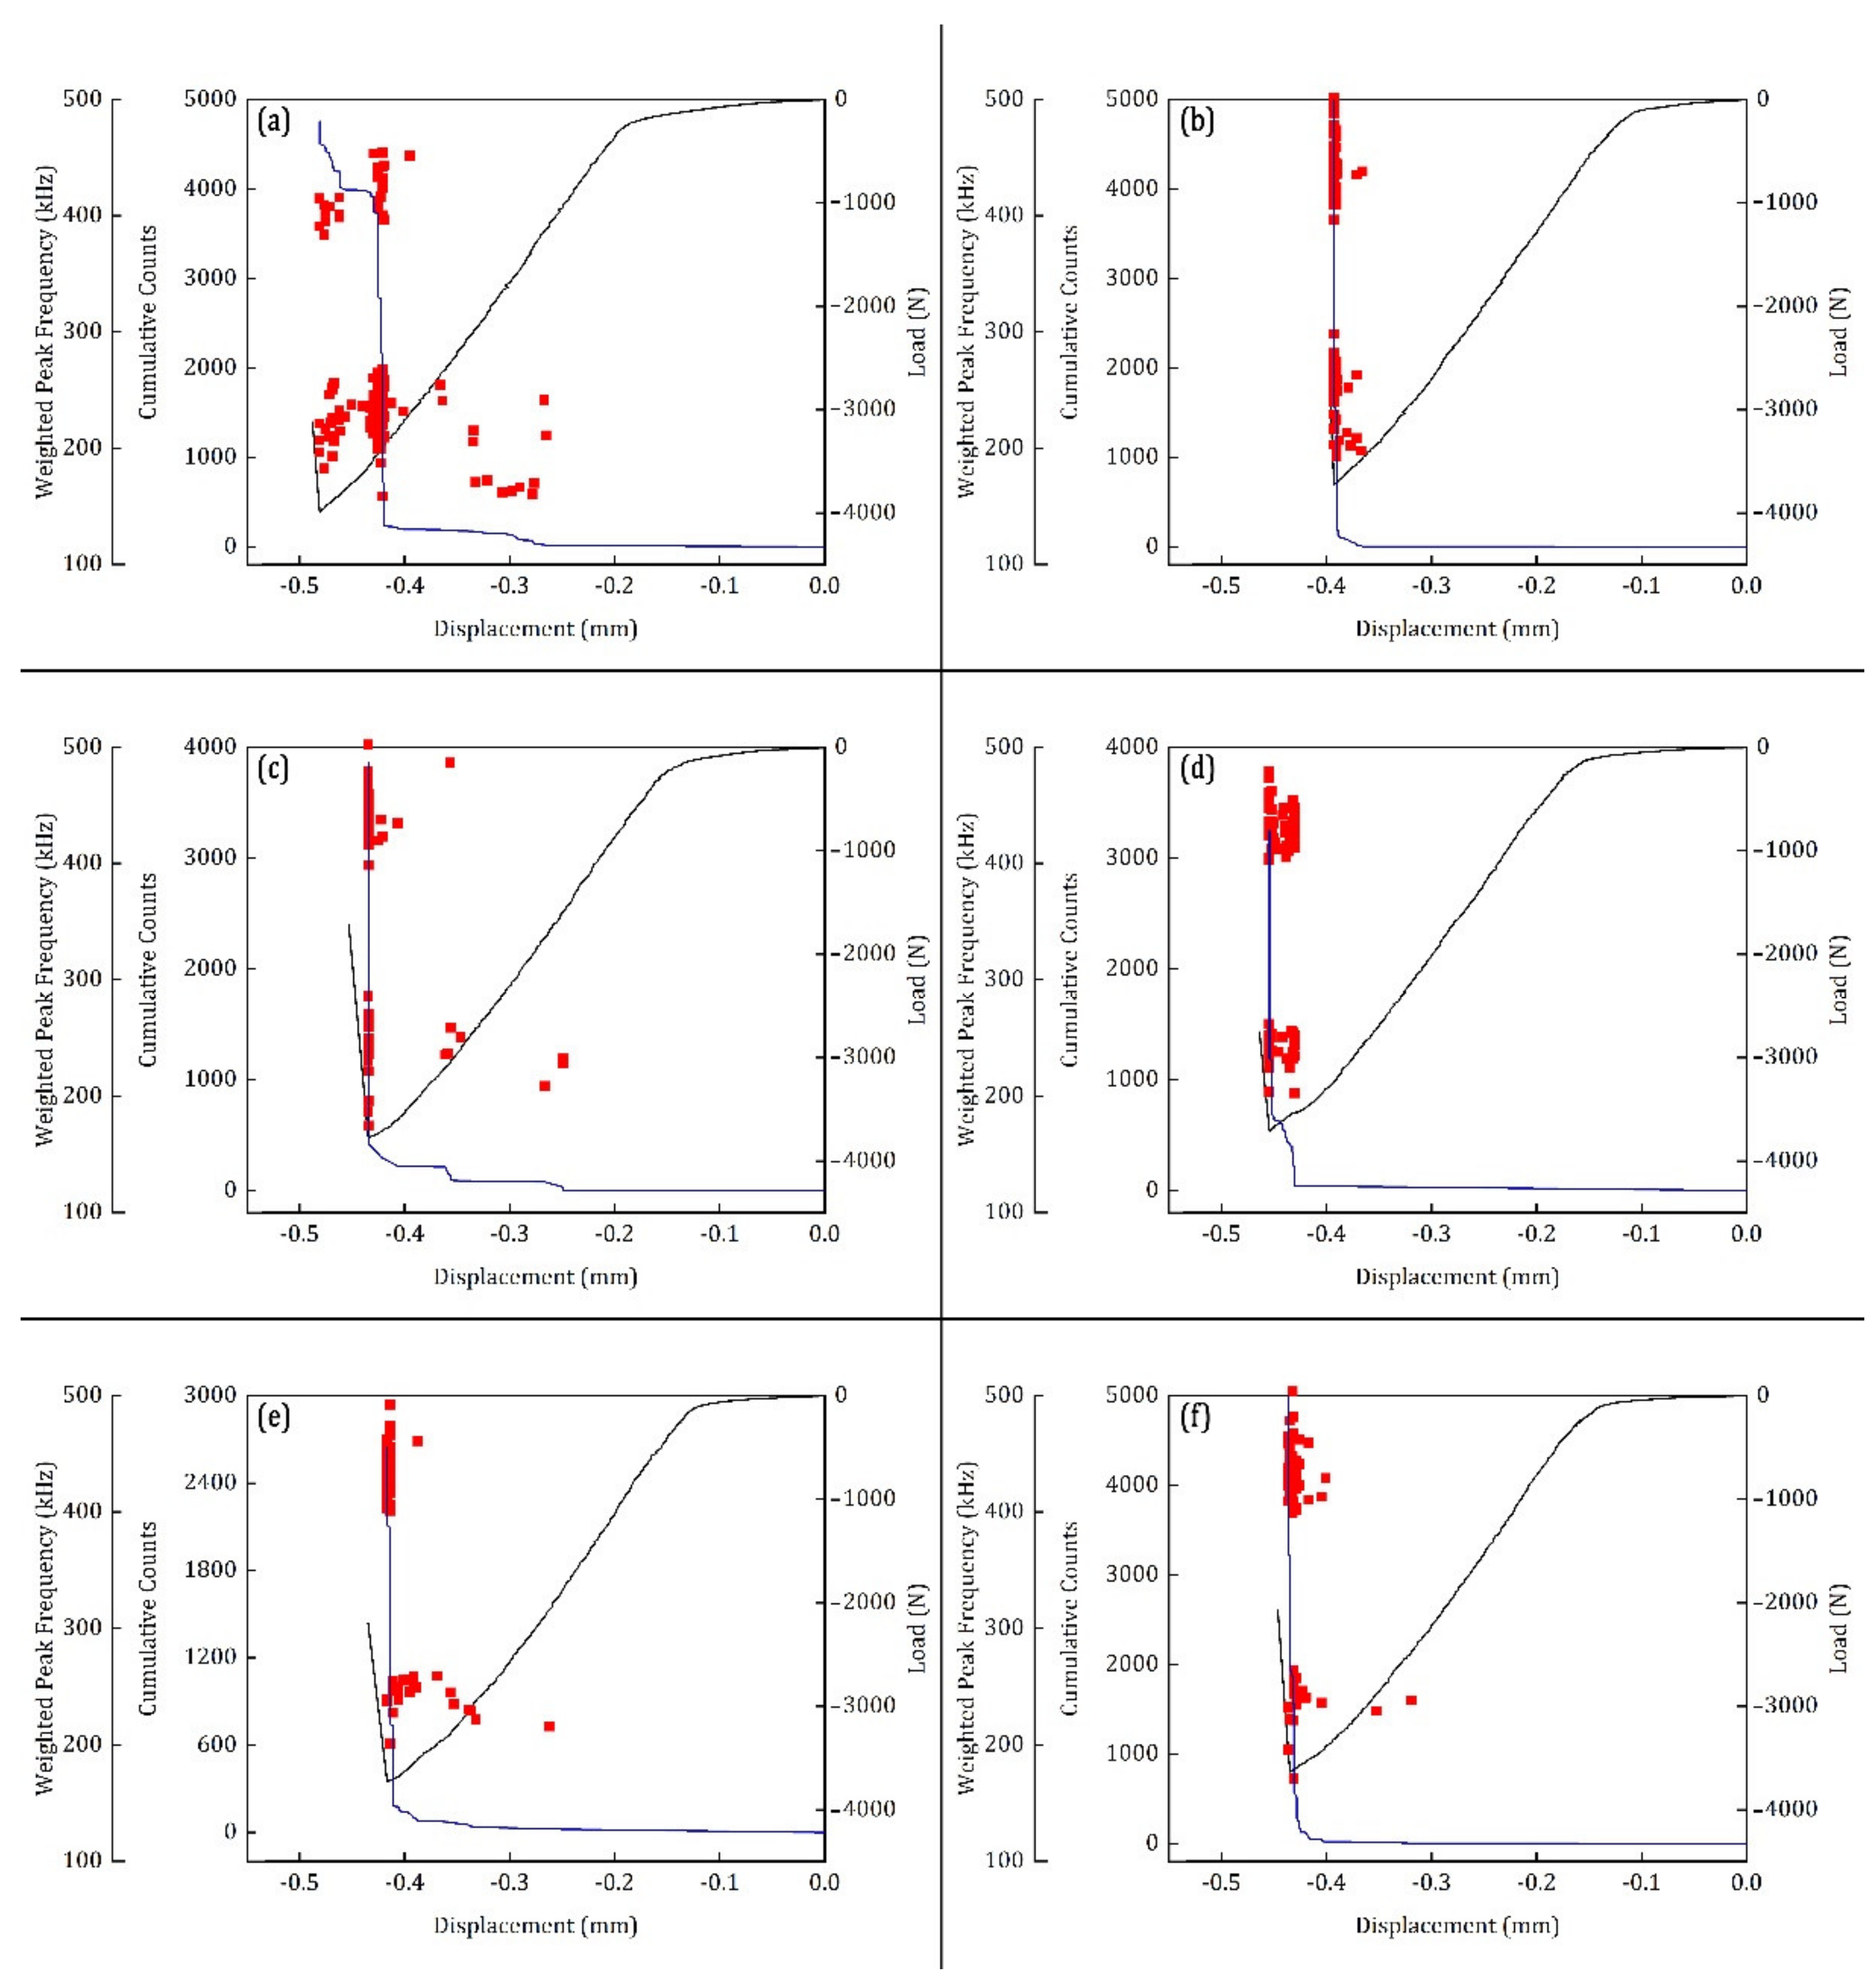
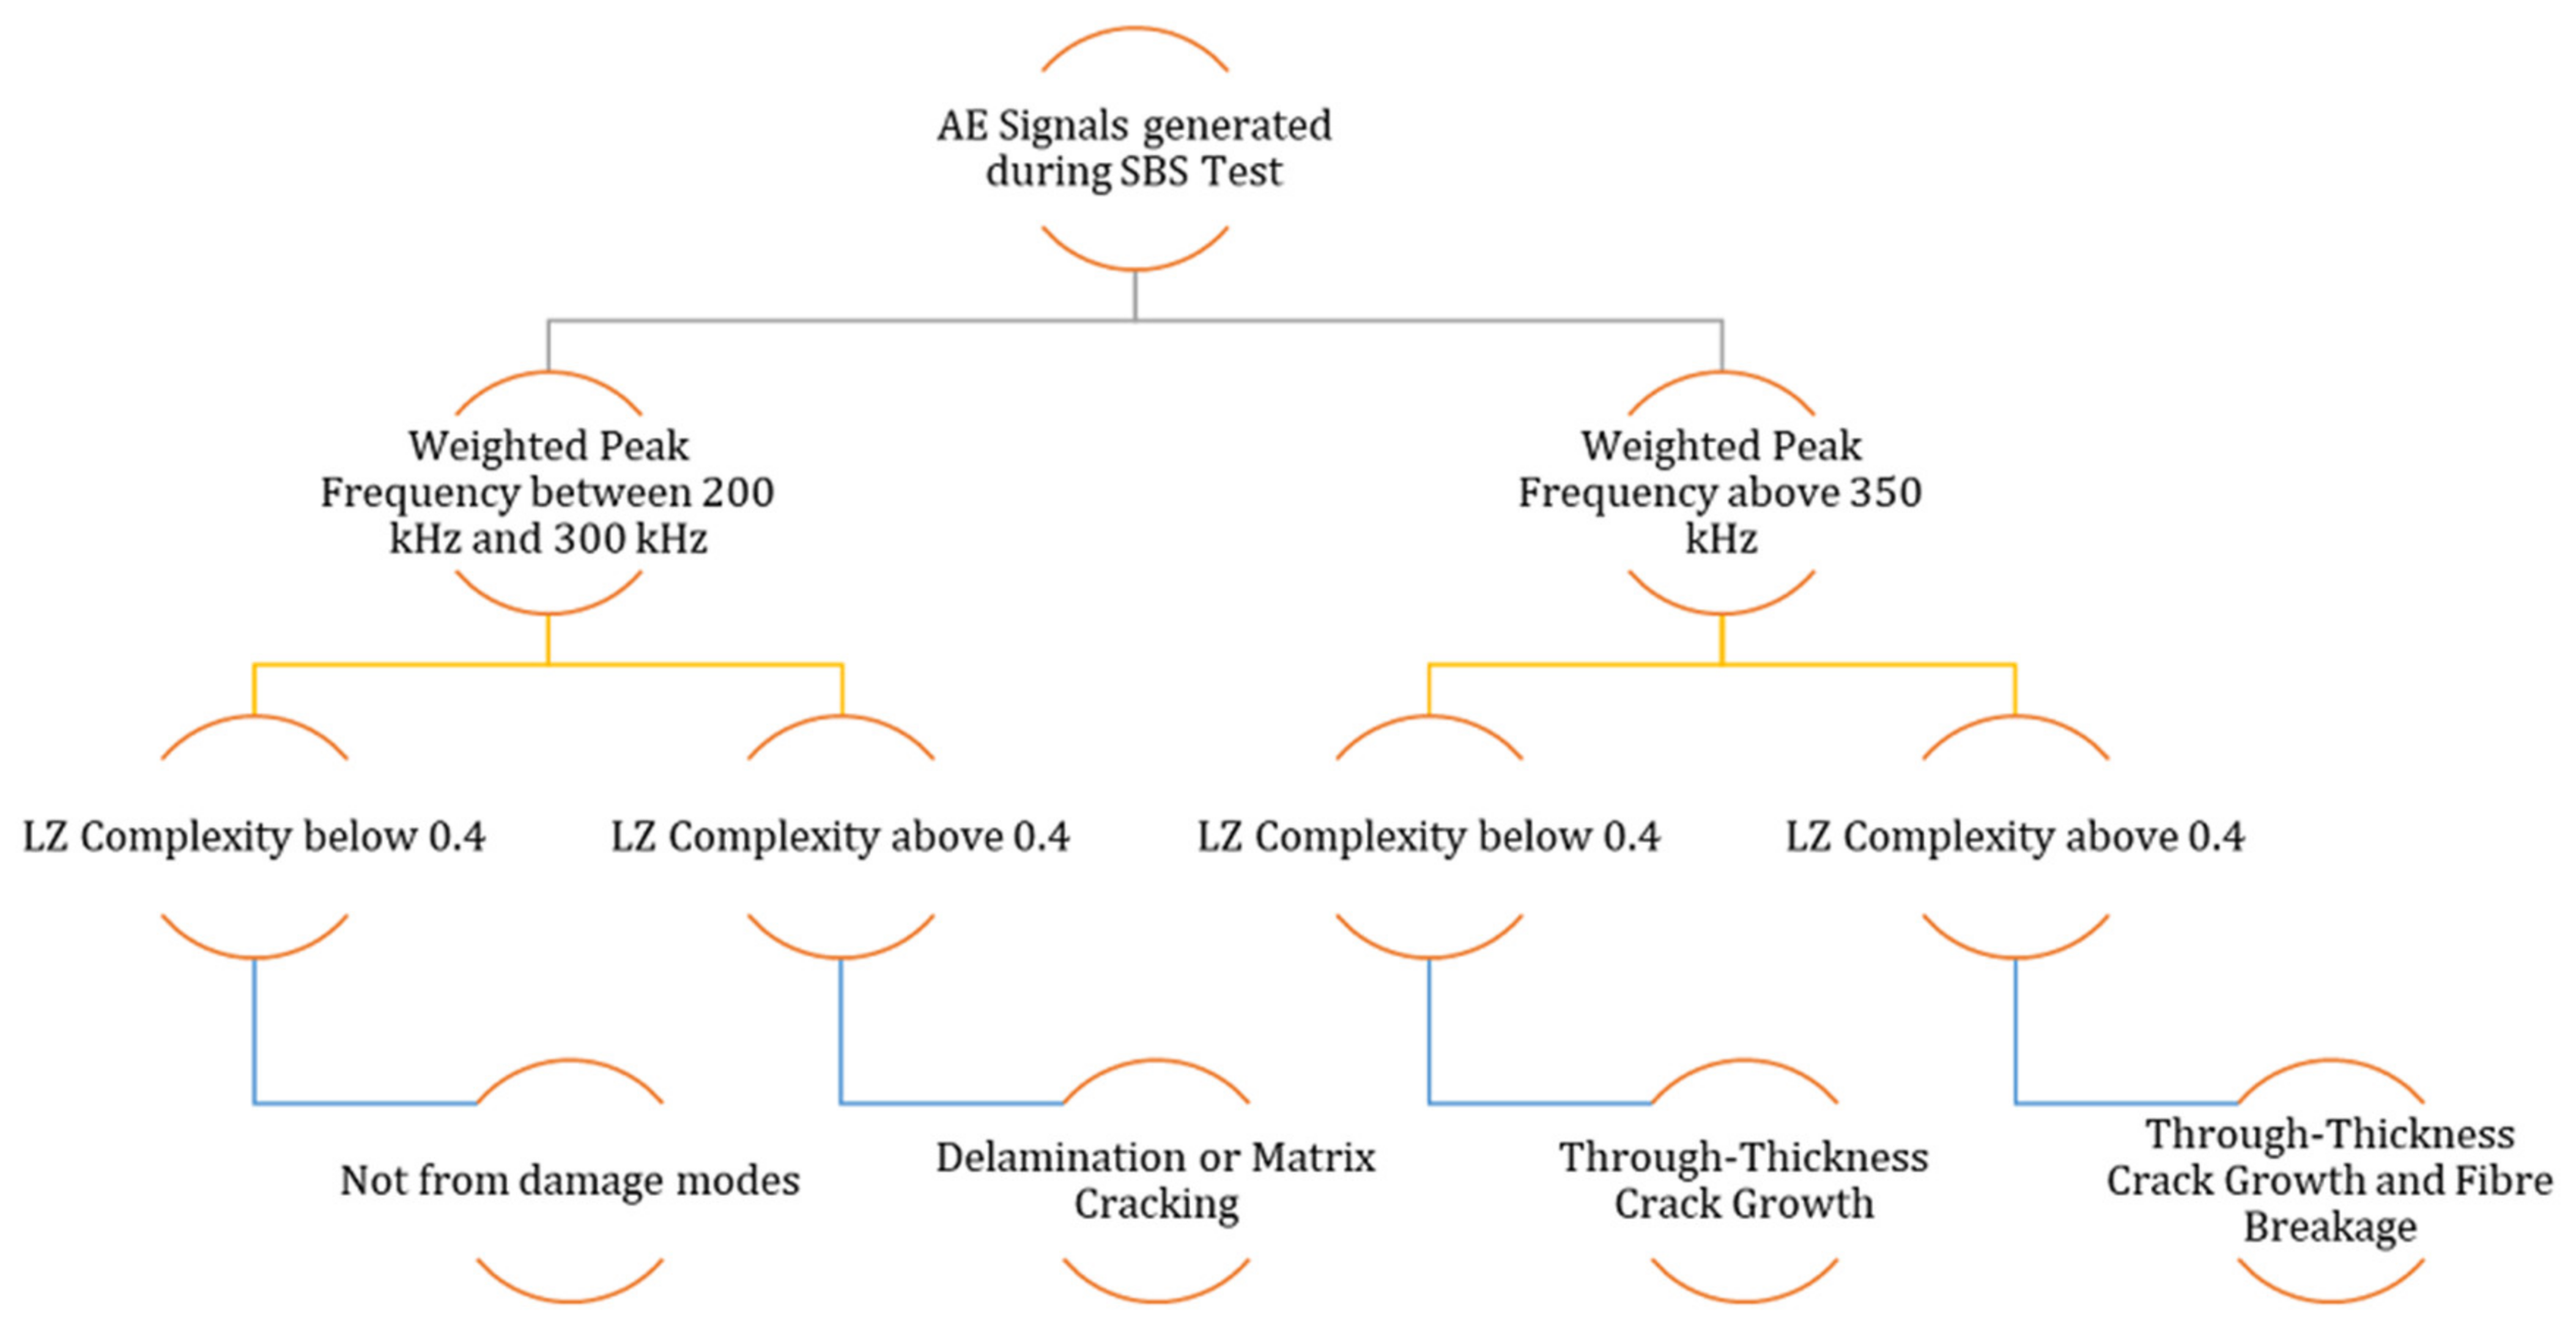
- AE signals with a W.P-Freq between 200 kHz and 300 kHz and LZ complexity below 0.4 are mostly signals from sources other than failure modes such as friction between broken matrix elements
- AE signals with a W.P-Freq between 200 kHz and 300 kHz and LZ complexity greater than 0.4 are predominantly from delamination events and matrix cracking events
- AE signals with a W.P-Freq above 350 kHz and LZ complexity below 0.4 are from through-thickness crack growth
- AE signals with a W.P-Freq above 350 kHz and LZ complexity greater than 0.4 are apparently from through-thickness crack growth and fibre breakage
Author Contributions
Funding
Institutional Review Board Statement
Informed Consent Statement
Data Availability Statement
Conflicts of Interest
Appendix A
References
- Hamstad, M.A. Thirty years of advances and some remaining challenges in the application of acoustic emission to composite materials. Acoust. Emiss. Beyond Millenn. 2000, 77–91. [Google Scholar]
- Hamstad, M.A. A review: Acoustic emission, a tool for composite-materials studies. Exp. Mech. 1986, 26, 7–13. [Google Scholar] [CrossRef]
- Gillis, P.P. Dislocation Motions and Acoustic Emissions; ASTM International: West Conshohocken, PA, USA, 1972. [Google Scholar]
- Aggelis, D.G.; Barkoula, N.-M.; Matikas, T.E.; Paipetis, A.S. Acoustic structural health monitoring of composite materials: Damage identification and evaluation in cross ply laminates using acoustic emission and ultrasonics. Compos. Sci. Technol. 2012, 72, 1127–1133. [Google Scholar] [CrossRef]
- Barile, C.; Casavola, C.; Pappalettera, G.; Kannan, V.P. Application of different acoustic emission descriptors in damage assessment of fiber reinforced plastics: A comprehensive review. Eng. Fract. Mech. 2020, 235, 107083. [Google Scholar] [CrossRef]
- Xu, J.; Wang, W.; Han, Q.; Liu, X. Damage pattern recognition and damage evolution analysis of unidirectional CFRP tendons under tensile loading using acoustic emission technology. Compos. Struct. 2020, 238, 111948. [Google Scholar] [CrossRef]
- Xu, J.; Liu, X.; Han, Q.; Wang, W. A particle swarm optimization–support vector machine hybrid system with acoustic emission on damage degree judgment of carbon fiber reinforced polymer cables. Struct. Health Monit. 2021, 20, 1551–1562. [Google Scholar] [CrossRef]
- Barile, C.; Casavola, C.; Pappalettera, G.; Vimalathithan, P.K. Damage characterization in composite materials using acoustic emission signal-based and parameter-based data. Compos. Part B Eng. 2019, 178, 107469. [Google Scholar] [CrossRef]
- Gusev, V.D.; Nemytikova, L.A.; Chuzhanova, N.A. On the complexity measures of genetic sequences. Bioinformatics 1999, 15, 994–999. [Google Scholar] [CrossRef] [Green Version]
- Abásolo, D.; Hornero, R.; Gómez, C.; García, M.; López, M. Analysis of EEG background activity in alzheimer’s disease patients with Lempel–Ziv complexity and central tendency measure. Med. Eng. Phys. 2006, 28, 315–322. [Google Scholar] [CrossRef] [Green Version]
- Radhakrishnan, N.; Gangadhar, B.N. Estimating regularity in epileptic seizure time-series data. IEEE Eng. Med. Biol. Mag. 1998, 17, 89–94. [Google Scholar] [CrossRef]
- Aboy, M.; Hornero, R.; Abásolo, D.; Álvarez, D. Interpretation of the Lempel-Ziv complexity measure in the context of biomedical signal analysis. IEEE Trans. Biomed. Eng. 2006, 53, 2282–2288. [Google Scholar] [CrossRef] [Green Version]
- Wang, Z.; Wu, X.; Liu, X.; Cao, Y.; Xie, J. Research on feature extraction algorithm of rolling bearing fatigue evolution stage based on acoustic emission. Mech. Syst. Signal Processing 2018, 113, 271–284. [Google Scholar] [CrossRef]
- Li, Y.; Wang, X.; Liu, Z.; Liang, X.; Si, S. The entropy algorithm and its variants in the fault diagnosis of rotating machinery: A review. IEEE Access 2018, 6, 66723–66741. [Google Scholar] [CrossRef]
- Zhang, X.; Feng, N.; Wang, Y.; Shen, Y. Acoustic emission detection of rail defect based on wavelet transform and shannon entropy. J. Sound Vib. 2015, 339, 419–432. [Google Scholar] [CrossRef]
- Fei, C.-W.; Choy, Y.-S.; Bai, G.-C.; Tang, W.-Z. Multi-Feature entropy distance approach with vibration and acoustic emission signals for process feature recognition of rolling element bearing faults. Struct. Health Monit. 2018, 17, 156–168. [Google Scholar] [CrossRef]
- Van Hecke, B.; Yoon, J.; He, D. Low speed bearing fault diagnosis using acoustic emission sensors. Appl. Acoust. 2016, 105, 35–44. [Google Scholar] [CrossRef]
- Li, C.; Guo, R.; Xian, G.; Li, H. Innovative compound-type anchorage system for a large-diameter pultruded carbon/glass hybrid rod for bridge cable. Mater. Struct. 2020, 53, 1–15. [Google Scholar] [CrossRef]
- Guo, R.; Xian, G.; Li, F.; Li, C.; Hong, B. Hygrothermal resistance of pultruded carbon, glass and carbon/glass hybrid fiber reinforced epoxy composites. Constr. Build. Mater. 2022, 315, 125710. [Google Scholar] [CrossRef]
- Hegde, S.; Shenoy, B.S.; Chethan, K.N. Review on carbon fiber reinforced polymer (CFRP) and their mechanical performance. Mater. Today: Proc. 2019, 19, 658–662. [Google Scholar] [CrossRef]
- Wisnom, M.R.; Jones, M.I. A Comparison between interlaminar and in-plane shear strength of unidirectional glass fibre-epoxy. Adv. Compos. Lett. 1994, 3, 096369359400300205. [Google Scholar] [CrossRef] [Green Version]
- Tessema, A.; Mitchell, W.; Koohbor, B.; Ravindran, S.; van Tooren, M.; Kidane, A. The effect of nano-fillers on the in-plane and interlaminar shear properties of carbon fiber reinforced composite. J. Dyn. Behav. Mater. 2018, 4, 296–307. [Google Scholar] [CrossRef]
- Lu, Z.; Xian, G.; Li, H. Effects of elevated temperatures on the mechanical properties of basalt fibers and BFRP plates. Constr. Build. Mater. 2016, 127, 1029–1036. [Google Scholar] [CrossRef]
- Shekarchi, M.; Farahani, E.M.; Yekrangnia, M.; Ozbakkaloglu, T. Mechanical strength of CFRP and GFRP composites filled with APP fire retardant powder exposed to elevated temperature. Fire Saf. J. 2020, 115, 103178. [Google Scholar] [CrossRef]
- Bazli, M.; Ashrafi, H.; Jafari, A.; Zhao, X.-L.; Gholipour, H.; Oskouei, A.V. Effect of thickness and reinforcement configuration on flexural and impact behaviour of GFRP laminates after exposure to elevated temperatures. Compos. Part B Eng. 2019, 157, 76–99. [Google Scholar] [CrossRef]
- Ningyun, W.; Evans, J.T. Collapse of continuous fibre composite beams at elevated temperatures. Composites 1995, 26, 56–61. [Google Scholar] [CrossRef]
- Manalo, A.; Surendar, S.; van Erp, G.; Benmokrane, B. Flexural behavior of an FRP sandwich system with glass-fiber skins and a phenolic core at elevated in-service temperature. Compos. Struct. 2016, 152, 96–105. [Google Scholar] [CrossRef]
- Vieira, P.S.C.; de Souza, F.S.; Cardoso, D.C.T.; Vieira, J.D.; de Andrade Silva, F. Influence of moderate/high temperatures on the residual flexural behavior of pultruded GFRP. Compos. Part B Eng. 2020, 200, 108335. [Google Scholar] [CrossRef]
- Schmidt, D.G.; d’Almeida, J.R.M. Effect of temperature exposure on the flexural mechanical behavior of two pultruded composites. Fire Technol. 2018, 54, 1565–1583. [Google Scholar] [CrossRef]
- Michalcová, L.; Kadlec, M. Crack growth monitoring of CFRP composites loaded in different environmental conditions using acoustic emission method. Procedia Eng. 2015, 114, 86–93. [Google Scholar] [CrossRef] [Green Version]
- Kakakasery, J.; Arumugam, V.; Rauf, K.A.; Bull, D.; Chambers, A.R.; Scarponi, C.; Santulli, C. Cure cycle effect on impact resistance under elevated temperatures in carbon prepreg laminates investigated using acoustic emission. Compos. Part B Eng. 2015, 75, 298–306. [Google Scholar] [CrossRef]
- Boominathan, R.; Arumugam, V.; Santulli, C.; Sidharth, A.A.P.; Sankar, R.A.; Sridhar, B.T.N. Acoustic emission characterization of the temperature effect on falling weight impact damage in carbon/epoxy laminates. Compos. Part B Eng. 2014, 56, 591–598. [Google Scholar] [CrossRef]
- Philippidis, T.P.; Assimakopoulou, T.T. Using acoustic emission to assess shear strength degradation in FRP composites due to constant and variable amplitude fatigue loading. Compos. Sci. Technol. 2008, 68, 840–847. [Google Scholar] [CrossRef]
- Fuwa, M.; Bunsell, A.R.; Harris, B. An evaluation of acoustic emission techniques applied to carbon-fibre composites. J. Phys. D Appl. Phys. 1976, 9, 353. [Google Scholar] [CrossRef]
- Saeedifar, M.; Zarouchas, D. Damage characterization of laminated composites using acoustic emission: A review. Compos. Part B Eng. 2020, 195, 108039. [Google Scholar] [CrossRef]
- Qi, G.; Barhorst, A.; Hashemi, J.; Kamala, G. Discrete wavelet decomposition of acoustic emission signals from carbon-fiber-reinforced composites. Compos. Sci. Technol. 1997, 57, 389–403. [Google Scholar] [CrossRef]
- Barile, C.; Casavola, C.; Pappalettera, G.; Kannan, V.P. Laplacian score and k-means data clustering for damage characterization of adhesively bonded CFRP composites by means of acoustic emission technique. Appl. Acoust. 2022, 185, 108425. [Google Scholar] [CrossRef]
- Liu, P.F.; Chu, J.K.; Liu, Y.L.; Zheng, J.Y. A study on the failure mechanisms of carbon fiber/epoxy composite laminates using acoustic emission. Mater. Des. 2012, 37, 228–235. [Google Scholar] [CrossRef]
- Oz, F.E.; Ersoy, N.; Lomov, S.V. Do high frequency acoustic emission events always represent fibre failure in CFRP laminates? Compos. Part A Appl. Sci. Manuf. 2017, 103, 230–235. [Google Scholar] [CrossRef]
- Li, L.; Lomov, S.V.; Yan, X.; Carvelli, V. Cluster analysis of acoustic emission signals for 2D and 3D woven glass/epoxy composites. Compos. Struct. 2014, 116, 286–299. [Google Scholar] [CrossRef]
- Godin, N.; Reynaud, P.; Fantozzi, G. Challenges and limitations in the identification of acoustic emission signature of damage mechanisms in composites materials. Appl. Sci. 2018, 8, 1267. [Google Scholar] [CrossRef] [Green Version]
- Barile, C.; Casavola, C.; Pappalettera, G.; Paramsamy, K.V. Acoustic emission waveforms for damage monitoring in composite materials: Shifting in spectral density, entropy and wavelet packet transform. Struct. Health Monit. 2021, 14759217211044692. [Google Scholar] [CrossRef]
- Saeedifar, M.; Najafabadi, M.A.; Zarouchas, D.; Toudeshky, H.H.; Jalalvand, M. Barely visible impact damage assessment in laminated composites using acoustic emission. Compos. Part B Eng. 2018, 152, 180–192. [Google Scholar] [CrossRef] [Green Version]
- Wickerhauser, M.V. Adapted Wavelet Analysis: From Theory to Software; AK Peters/CRC Press: Boca Raton, FL, USA, 1996; ISBN 042906425X. [Google Scholar]
- Nazmdar Shahri, M.; Yousefi, J.; Fotouhi, M.; Ahmadi Najfabadi, M. Damage evaluation of composite materials using acoustic emission features and hilbert transform. J. Compos. Mater. 2016, 50, 1897–1907. [Google Scholar] [CrossRef]
- WenQin, H.; Ying, L.; AiJun, G.; Yuan, F.-G. Damage modes recognition and hilbert-huang transform analyses of CFRP laminates utilizing acoustic emission technique. Appl. Compos. Mater. 2016, 23, 155–178. [Google Scholar] [CrossRef]
- Lempel, A.; Ziv, J. On the complexity of finite sequences. IEEE Trans. Inf. Theory 1976, 22, 75–81. [Google Scholar] [CrossRef]
- Cui, W.C.; Wisnom, M.R.; Jones, M. Failure mechanisms in three and four point short beam bending tests of unidirectional glass/epoxy. J. Strain Anal. Eng. Des. 1992, 27, 235–243. [Google Scholar] [CrossRef]
- He, H.; Gao, F. Effect of fiber volume fraction on the flexural properties of unidirectional carbon fiber/epoxy composites. Int. J. Polym. Anal. Charact. 2015, 20, 180–189. [Google Scholar] [CrossRef]
- Chung, D.D.L. Processing-structure-property relationships of continuous carbon fiber polymer-matrix composites. Mater. Sci. Eng. R Rep. 2017, 113, 1–29. [Google Scholar] [CrossRef]
- Huang, C.; He, M.; He, Y.; Xiao, J.; Zhang, J.; Ju, S.; Jiang, D. Exploration relation between interlaminar shear properties of thin-ply laminates under short-beam bending and meso-structures. J. Compos. Mater. 2018, 52, 2375–2386. [Google Scholar] [CrossRef]
- Lorenzo, L.; Hahn, H.T. Damage Assessment by Acousto-Ultrasonic Technique in Composites. Compos. Mater. Test. Des. ASTM STP 1988, 972, 380–397. [Google Scholar]
- Konsztowicz, K.; Nowak, M.; Baran, I.; Ziąbka, M.; Chłopek, J. Detection of micro-crack initiation in epoxy matrix material with use of acoustic emission. In Proceedings of the ECCM17—17th European Conference on Composite Materials, Munich, Germany, 26–30 June 2016. [Google Scholar]
- Baran, I.J.; Nowak, M.B.; Chłopek, J.P.; Konsztowicz, K.J. Acoustic emission from microcrack initiation in polymer matrix composites in short beam shear test. J. Nondestruct. Eval. 2018, 37, 7. [Google Scholar] [CrossRef] [Green Version]
- De Groot, P.J.; Wijnen, P.A.M.; Janssen, R.B.F. Real-time frequency determination of acoustic emission for different fracture mechanisms in carbon/epoxy composites. Compos. Sci. Technol. 1995, 55, 405–412. [Google Scholar] [CrossRef]
- Sause, M.G.R. Failure of fiber-reinforced composites. In In Situ Monitoring of Fiber-Reinforced Composites; Springer: Berlin/Heidelberg, Germany, 2016; pp. 5–55. [Google Scholar]
- Barile, C.; Casavola, C.; Pappalettera, G.; Vimalathithan, P.K. Damage propagation analysis in the single lap shear and single lap shear-riveted CFRP joints by acoustic emission and pattern recognition approach. Materials 2020, 13, 3963. [Google Scholar] [CrossRef] [PubMed]


| Specimen Name | Width | Thickness |
|---|---|---|
| mm | mm | |
| Specimens tested at 100 °C | ||
| SBS_100–1 | 12.65 | 3.54 |
| SBS_100–2 | 12.56 | 3.59 |
| SBS_100–3 | 12.52 | 3.54 |
| SBS_100–4 | 12.62 | 3.57 |
| SBS_100–5 | 12.63 | 3.54 |
| SBS_100–6 | 12.63 | 3.51 |
| Specimens tested at 120 °C | ||
| SBS_120–1 | 12.65 | 3.55 |
| SBS_120–2 | 12.57 | 3.54 |
| SBS_120–3 | 12.62 | 3.48 |
| SBS_120–4 | 12.62 | 3.55 |
| SBS_120–5 | 12.58 | 3.59 |
| SBS_120–6 | 12.65 | 3.56 |
| Specimen Name | Max. Shear Load | ILSS |
|---|---|---|
| N | MPa | |
| SBS_100–1 | 3919 | 65.19 |
| SBS_100–2 | 3797 | 64.27 |
| SBS_100–3 | 3821 | 63.62 |
| SBS_100–4 | 3788 | 63.54 |
| SBS_100–5 | 3831 | 64.83 |
| SBS_100–6 | 3574 | 61.91 |
| Average | 3788.33 | 62.82 |
| Std.dev | 114.87 | 3.04 |
| SBS_120–1 | 3986 | 66.58 |
| SBS_120–2 | 3722 | 62.74 |
| SBS_120–3 | 3779 | 64.55 |
| SBS_120–4 | 3708 | 62.08 |
| SBS_120–5 | 3722 | 61.83 |
| SBS_120–6 | 3630 | 60.46 |
| Average | 3757.83 | 63.04 |
| Std.dev | 121.57 | 2.19 |
| Specimen Name | Load at First Delamination | Specimen Name | Load at First Delamination |
|---|---|---|---|
| N | N | ||
| SBS_100–1 | 1889 | SBS_120–1 | 1274 |
| SBS_100–2 | 1089 | SBS_120–2 | 3518 |
| SBS_100–3 | 2206 | SBS_120–3 | 1586 |
| SBS_100–4 | 1681 | SBS_120–4 | 3535 |
| SBS_100–5 | 3444 | SBS_120–5 | 3022 |
| SBS_100–6 | 2153 | SBS_120–6 | 2475 |
Publisher’s Note: MDPI stays neutral with regard to jurisdictional claims in published maps and institutional affiliations. |
© 2022 by the authors. Licensee MDPI, Basel, Switzerland. This article is an open access article distributed under the terms and conditions of the Creative Commons Attribution (CC BY) license (https://creativecommons.org/licenses/by/4.0/).
Share and Cite
Barile, C.; Casavola, C.; Pappalettera, G.; Kannan, V.P.; Renna, G. Investigation of Interlaminar Shear Properties of CFRP Composites at Elevated Temperatures Using the Lempel-Ziv Complexity of Acoustic Emission Signals. Materials 2022, 15, 4252. https://doi.org/10.3390/ma15124252
Barile C, Casavola C, Pappalettera G, Kannan VP, Renna G. Investigation of Interlaminar Shear Properties of CFRP Composites at Elevated Temperatures Using the Lempel-Ziv Complexity of Acoustic Emission Signals. Materials. 2022; 15(12):4252. https://doi.org/10.3390/ma15124252
Chicago/Turabian StyleBarile, Claudia, Caterina Casavola, Giovanni Pappalettera, Vimalathithan Paramsamy Kannan, and Gilda Renna. 2022. "Investigation of Interlaminar Shear Properties of CFRP Composites at Elevated Temperatures Using the Lempel-Ziv Complexity of Acoustic Emission Signals" Materials 15, no. 12: 4252. https://doi.org/10.3390/ma15124252