Article

Sensitivity Analysis of Reinforced Aluminum Based Metal Matrix Composites

by
Fouzia Gillani
*,
Muhammad Zubair Khan
and
Owaisur Rahman Shah
Department of Mechanical Engineering, Institute of Space Technology, Islamabad 44000, Pakistan
*
Author to whom correspondence should be addressed.
Materials 2022, 15(12), 4225; https://doi.org/10.3390/ma15124225
Submission received: 20 May 2022 / Revised: 8 June 2022 / Accepted: 9 June 2022 / Published: 14 June 2022
(This article belongs to the Special Issue Advances in Carbon Fiber Reinforced Composites)

Abstract

:
Metal matrix composites (MMCs) have wide applications due to being lightweight, their high strength, and immense resistance to wear. To explore new generation materials like aluminum-based metal matrix composites (AMCs) for wide engineering applications, the present work aimed at investigating the effect of changes in composition, sintering time, and temperature on the hardness and surface roughness of AMCs containing SiC and ZrSiO4 in wt % of 5, 20, 30, and 40 binary and hybrid sample pallets. The samples have been prepared by powder metallurgy (PM) method under 1000 psi pressure. After compaction, the above pallets sintered at different temperatures ranging from 500 °C to 1100 °C with an increment of 200 °C and 15 min intervals for four levels of temperature and time, respectively. Afterwards, sensitivity analysis has been done by investigating the effect of chemical composition, sintering time, and sintering temperature of the binary and hybrid composites on hardness and surface roughness. Morphological studies on the composites were carried out using field emission scanning electron microscope (FESEM) with energy dispersive spectroscopy (EDS). It has been observed that hardness is increased by increasing the sintering temperature in the case of SiC, whereas surface roughness did not change much by changing the composition. Additionally, a rise in temperature lead to liquid-state sintering. SEM images obtained during the elemental analysis showed that porosity is generated within the samples after sintering due to the higher melting point of reinforcements compared to a base metal, i.e., aluminum. Mathematical equations have also been developed via regression analysis using Minitab and excel for the confirmation and validation of experimental data. Analysis of Variance (ANOVA) has also been done, and its tables are shown and discussed in the paper. Hence, the most optimized findings relating the changes in the composition of reinforcements, sintering temperature, and sintering time (input variables) with porosity, hardness, and surface roughness have been presented in the current study.

1. Introduction

Modern engineering materials, namely superalloys, shape memory alloys, ceramics, and fiber-reinforced composites, possess good thermal, chemical, physical, and mechanical properties, resulting in higher weight-to-volume ratio and better strength profiles. The needful properties of composites mainly depend upon the combined effect of fabrication techniques and reinforced/supplemented particles being added in some proportion. Many fabrication techniques are available and followed in the literature, such as spray stir casting, squeeze casting, compo-casting, powder metallurgy, pressure infiltration, and spray deposition method [1,2,3]. Bhoi et al. [4] concluded that production methods of MMCs can be categorized into two major categories: ex-situ and in-situ. The first synthesis route involves adding nano-reinforcements to the liquid or powdered metal. At the same time, the latter refers to methods that lead to the generation of ceramic nano-compounds by reaction during processing, such as using pressure infiltration/sintering. Among the preparation techniques of MMCs, the pressure infiltration process is one of the best suited for metal matrix syntactic foams. Higher infiltration pressure is preferred for perfect results [5,6,7,8]. Braszczyńska et al. [9] explored negative pressure infiltration methods to prepare AZ91 alloy matrix composites with fly ash cenospheres. Castro et al. [10] made an attractive combination of steel with a low density of foam prepared by pressure infiltration technology. This method utilizes inert gas (nitrogen/argon) pressure [11]. Orbulov [12,13] also prepared metal matrix syntactic foams (MMSFs) by using this method. After going through the exhaustive literature regarding the fabrication techniques and properties of aluminum matrix composites, Li et al. [14] found that the PM method is remarkably more beneficial as compared to other fabrication techniques like stir casting, squeeze casting, and compo casting, etc., due to low wettability produced between the molten aluminum matrix and the ceramic particle. El-Eskandarany [15] found that an additional advantage of PM is the uniform distribution of reinforcements. This uniform distribution not only improves the structural and mechanical properties. Kumar et al. [16] found that the MMCs preparation method and the type of supplements added play a critical role when machining. The conventional reinforcements used previously are SiC, Si3N4, Al-N, Al2O3, TiB2, ZrO2, and Y2O3. Along with the preparation technique, variation in grain structure during and after the preparation of MMCs largely affects the composites’ mechanical performance, which can be revealed by numerical and experimental evaluations [11]. AMCs are the most important and widely demanded composite which can be prepared via liquid and solid phase sintering, as Magabe et al. [17] prepared AMCs containing wt % 5, 10, 15, and 20 of Sn as a supplement to develop a new alloy named Al-Sn alloy into which wt % 5 of SiC was further added. The prepared AMCs were machined on wire electric discharge machining (WEDM), and it was observed that surface roughness increased by increasing the wt % of Sn.
Due to the presence of hard abrasive particles (reinforcements), which leads to high tool wear, the machinability of MMCs is very challenging. The behavior of such prepared MMCs before machining needs to be studied. Changes in wt % of reinforcements, sintering temperature, and compaction pressure may affect the MMCs behavior towards machining of MMCs [18]. A study of AMCs with SiC revealed that the compacting pressure and reinforcements percentage significantly affect the sintering temperature on microhardness and density. It is proven to achieve theoretical density near 95% for 10% reinforcement with 550 MPa sintered at 500 °C for 1 h [19]. Rana et al. [20] declared that Al-SiC has a high strength to weight ratio, which is three times more than mild steel, composites containing SiC as reinforcement have high modulus, strength values, high thermal stability, wear resistance, less weight, and a more effective load carrying capacity. Prasad et al. [21] also confirmed that this composite would exhibit good corrosion properties since SiC forms a preventive coating of silicon oxide at 1200 °C. In the last two decades, studies revealed that the wear behavior of aluminum-based metal matrix composites with different type of reinforcements is significantly affected by volume/weight fraction of reinforcement and particle size [22,23].
Pirkle et al. [24] found that SiC is known for its very high hardness and abrasion resistance. It is commonly meant for wear-intensive applications such as rollers and paper industry retainers. Therefore, Sadasivuni et al. [25] declared modern engineering composite materials as “engineered mechanical properties” incorporated in the form of reinforcements as micro or nano-sized particles.
The literature found that the addition of rigid ceramic reinforcements improves the wear resistance of composites as hard particles can behave like a load-bearing agent for the soft aluminum matrix. El-Kady et al. [26] reported that wear loss is significantly controlled by particle size. In hard micro-sized ceramic reinforcement deteriorates the ductility of composites, which can be controlled by adding nano-sized reinforcements [27]. Therefore, a combo of micro and nanoparticles as reinforcement could be a better option for developing new and advanced metal matrix composites [28].
A broad scope in significant areas of machining behavior and modeling of machining processes for MMCs has been offered. Further, to reduce the exhaustive experimentation for time and cost-effectiveness, some statistical and soft computing techniques are required to predict and optimize the process. There is a huge gap due to the unresolved issues while characterizing machining parameters and the accuracy achievement ratio of advanced materials [29,30]. Additionally, a limited study is present out of various available ceramics; ZrSiO4 is the least used as a supplementary material being added in the aluminum matrix. However, it is a better option, as fracture toughness and wears properties of ZrSiO4 are very high. Abdizadeh et al. [31] found that fabrication of ZrSiO4 reinforced MMCs using different techniques is an excellent option to attain better mechanical properties. Limited literature is available on aluminum composites involving both silicon carbide and ZrSiO4 reinforcements combined to form hybrid AMCs. It is exciting and provides scope to study harsh tribological challenges. Therefore, the current research aims to investigate the mechanical properties of AMCs using SiC and ZrSiO4 as reinforcements. The results obtained showed exciting facts relating to changes in the composition of reinforcements and their sintering temperature and time.

2. Experimental Setup

The composites have been fabricated through the powder metallurgy process, which involves various stages, including measurement of elemental powders, mixing of powders, compaction, and sintering of the compact profiles. Sintering temperature, variation in wt % of supplementary powders and sintering time were the input experimental parameters. The response of these variables was checked for hardness and surface roughness of the sintered samples. Morphological studies on the composites were carried out using FESEM (manufactured by TESCAN, Brno, Czech Republic) which generate ultra-high resolution imaging at low accelerating voltages and small working distances. KeV mentioned in images is electron volt, which is the measure of an amount of kinetic energy gained by a single electron. The first step in preparing the samples was to weigh the required compositions. Powders of metal and reinforcements were blended using a ball mill with each reinforcement. A centrifugal ball mill thoroughly mixed the calculated ratio of soft aluminum powder and ceramic particles. To get uniform mixing, 10:1 ball to powder ratio (BPR) was maintained throughout mixing. The mixing speed and time were 150 rpm and 20 min, respectively.
Uniformly mixed powders were then compacted press into a ‘green form’, thus obtaining approximately 80% dense by using a uniaxial hydraulic pallet press machine to compact the powder by using 1000 psi pressure for two minutes holding time. A prepared sample of 4 mm thickness and 10 mm radius is shown below in Figure 1.
After compaction of powders into pallets, the samples were sintered by heating them to the desired processing temperature in the furnace. After sintering, the samples were furnace cooled. The fabricated samples were then tested for hardness, surface roughness, and morphological studies. Hardness of sintered samples was measured using a Rockwell hardness tester using a load of 100 Kg for 7 s. The surface roughness of the sintered samples was measured using a portable roughness meter known as surftest SJ-210 [mm] with detector measuring force of 0.75 mN and stylus tip (diamond tip) angle of 60°. It can measure the range up to 360 µm. Three samples of each composition were prepared and tested. Theoretical densities of the composite specimens were determined using a high-precision digital electronic weighing balance with an accuracy of 0.01 mg.

2.1. Chemical Compositions of MMCs

The aluminum powder taken for each sample was 3.108 g. The reinforcement percentages are given below in Table 1.

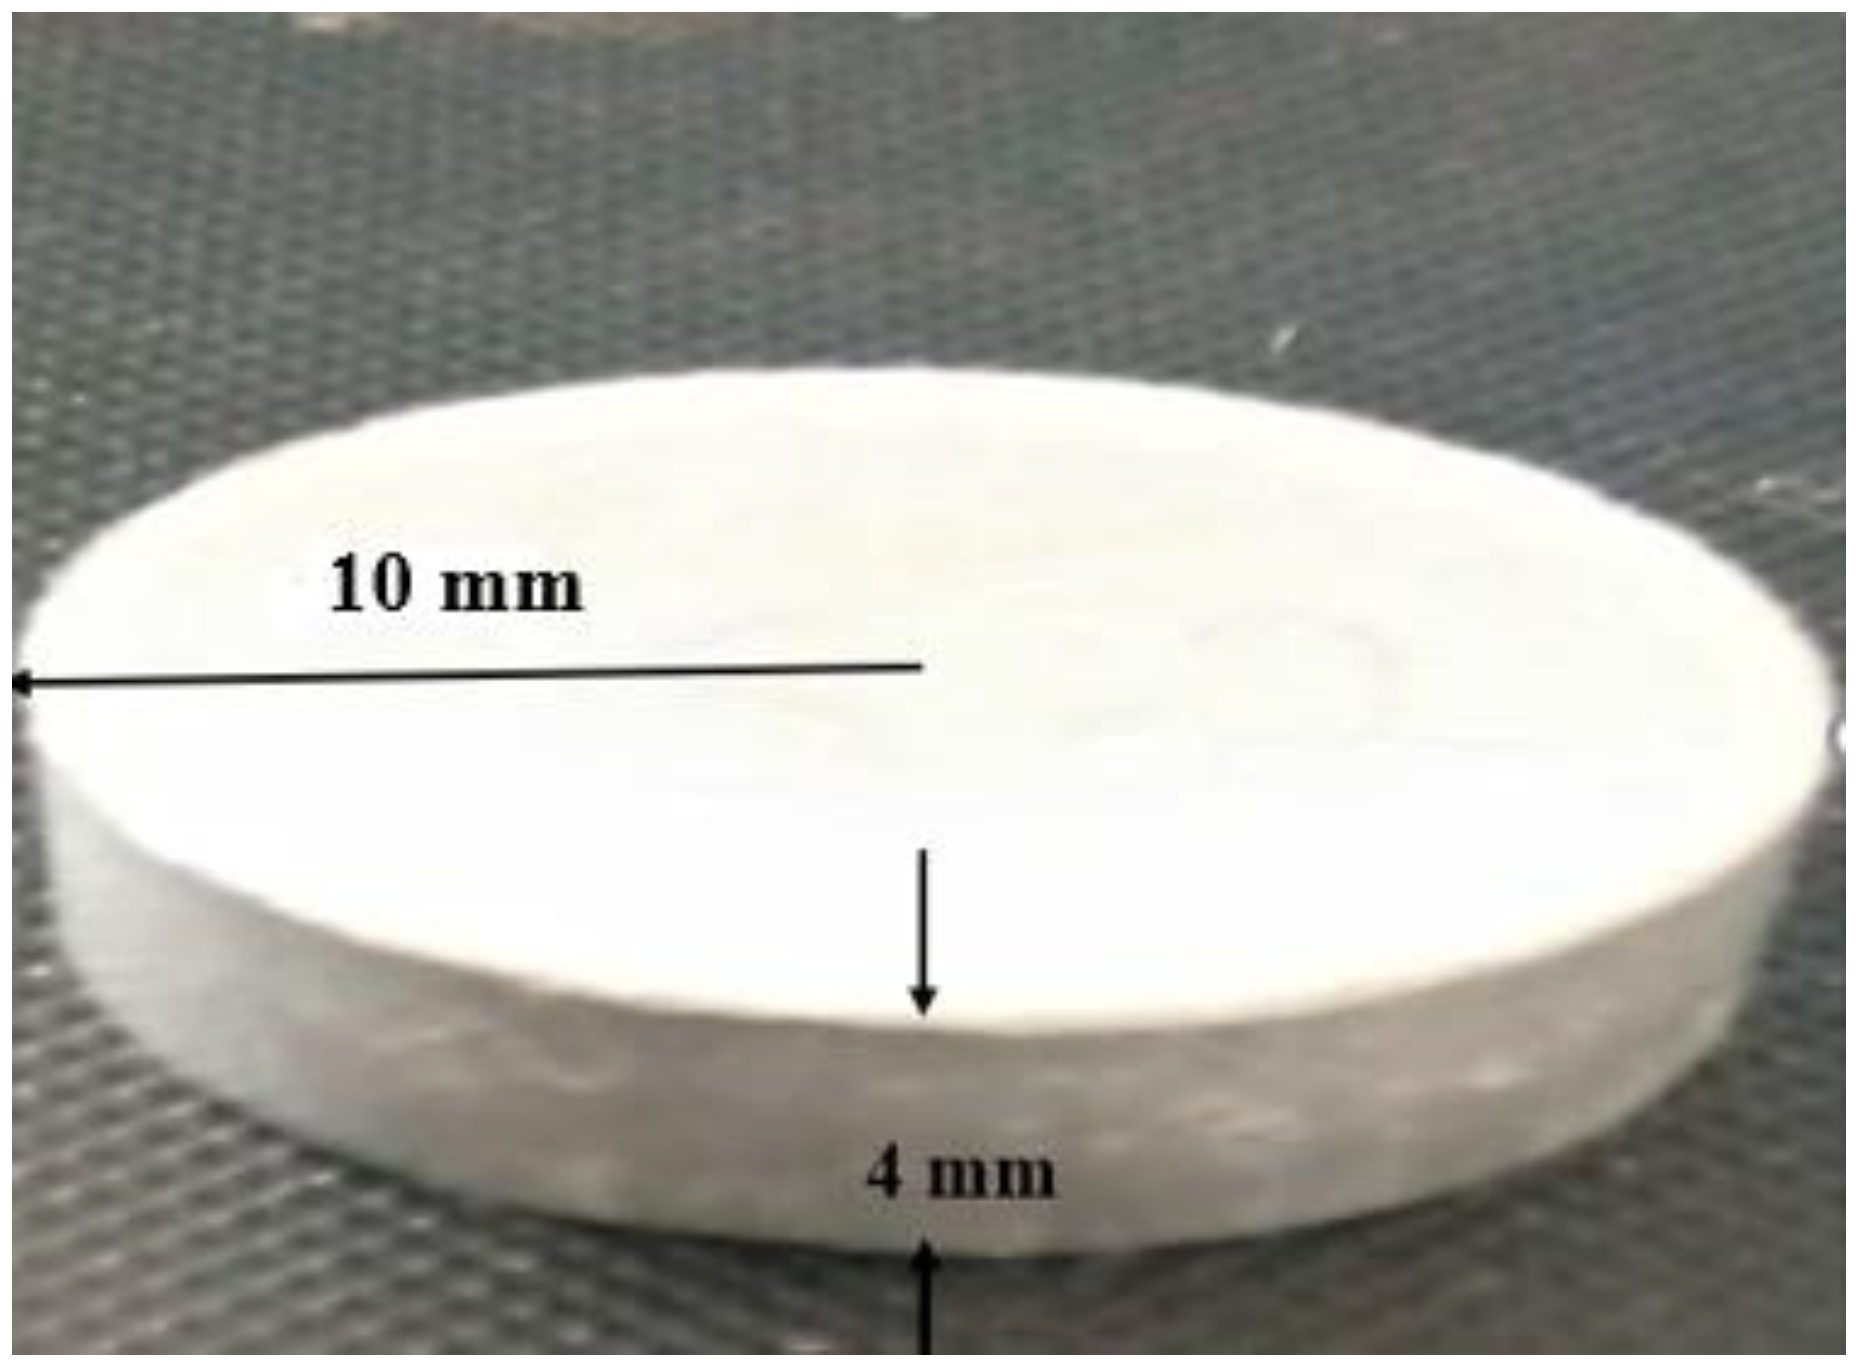
2.2. Mixing and Compaction of Powders

The measured loose powders were mixed according to the proposed composition and ball milled again for proper mixing. Ball milled and measured powders were compacted via a pneumatic, hydraulic press with 1000 psi pressure for 2 min holding time. The sample is of the circular shape of a 1-inch diameter. Twelve binary and hybrid samples of the above-mentioned compositions have been prepared. We identified the samples as S1, S2, and S3 up to S12, as mentioned in Table 2.

2.3. Sintering

Sintering can be done as solid-state sintering and liquid phase sintering. We have implemented solid-phase sintering in a vacuum furnace [4]. Sintering is done by heating the green body of binary and hybrid samples prepared by PM to the desired processing temperature in the furnace. After sintering, the samples were furnace cooled. The sintering temperatures and time for different compositions of MMCs are described below.

3. Experimental Results

It is observed that sintering consolidation is near to 100% during the molten phase and agglomeration started, so it is needed to check at which temperature consolidation happens. Mathematical equations were estimated for each input parameter using regression analysis to validate the experimental results. Here Table 3. Showed the roughness and hardness results against each sample.

3.1. EDS Analysis of Samples

EDS analysis has evaluated the particles’ presence and weight percentage in sintered AMCs [32,33,34]. Peaks in the graph show the wt % of each element [35]. Here, EDS analysis of the samples containing 5% by weight of SiC as shown in Figure 2. estimated that SiC particles are present in the synthesized composites. Table 4. showed the elements along with their wt % and atomic%.
Similarly, EDS analysis of the sample containing 5% by weight of ZrSiO4 in Figure 3. predicted that ZrSiO4 particles are present in the synthesized composite of Al-ZrSiO4. Table 5. showed the elements along with their wt % and atomic%.

3.2. Density and Porosity

Theocratical measurement of density revealed that it is possible to attain 98% of the density (theoretical) for samples of 20% reinforcement compact with 1000 Mpa sintered at 700 °C. It has been observed that compaction pressure and reinforcement wt % have a higher impact on density and porosity than sintering temperature. Figure 4 showed agglomeration and porosity in sample containing 40% SiC sintered at 1100 °C.

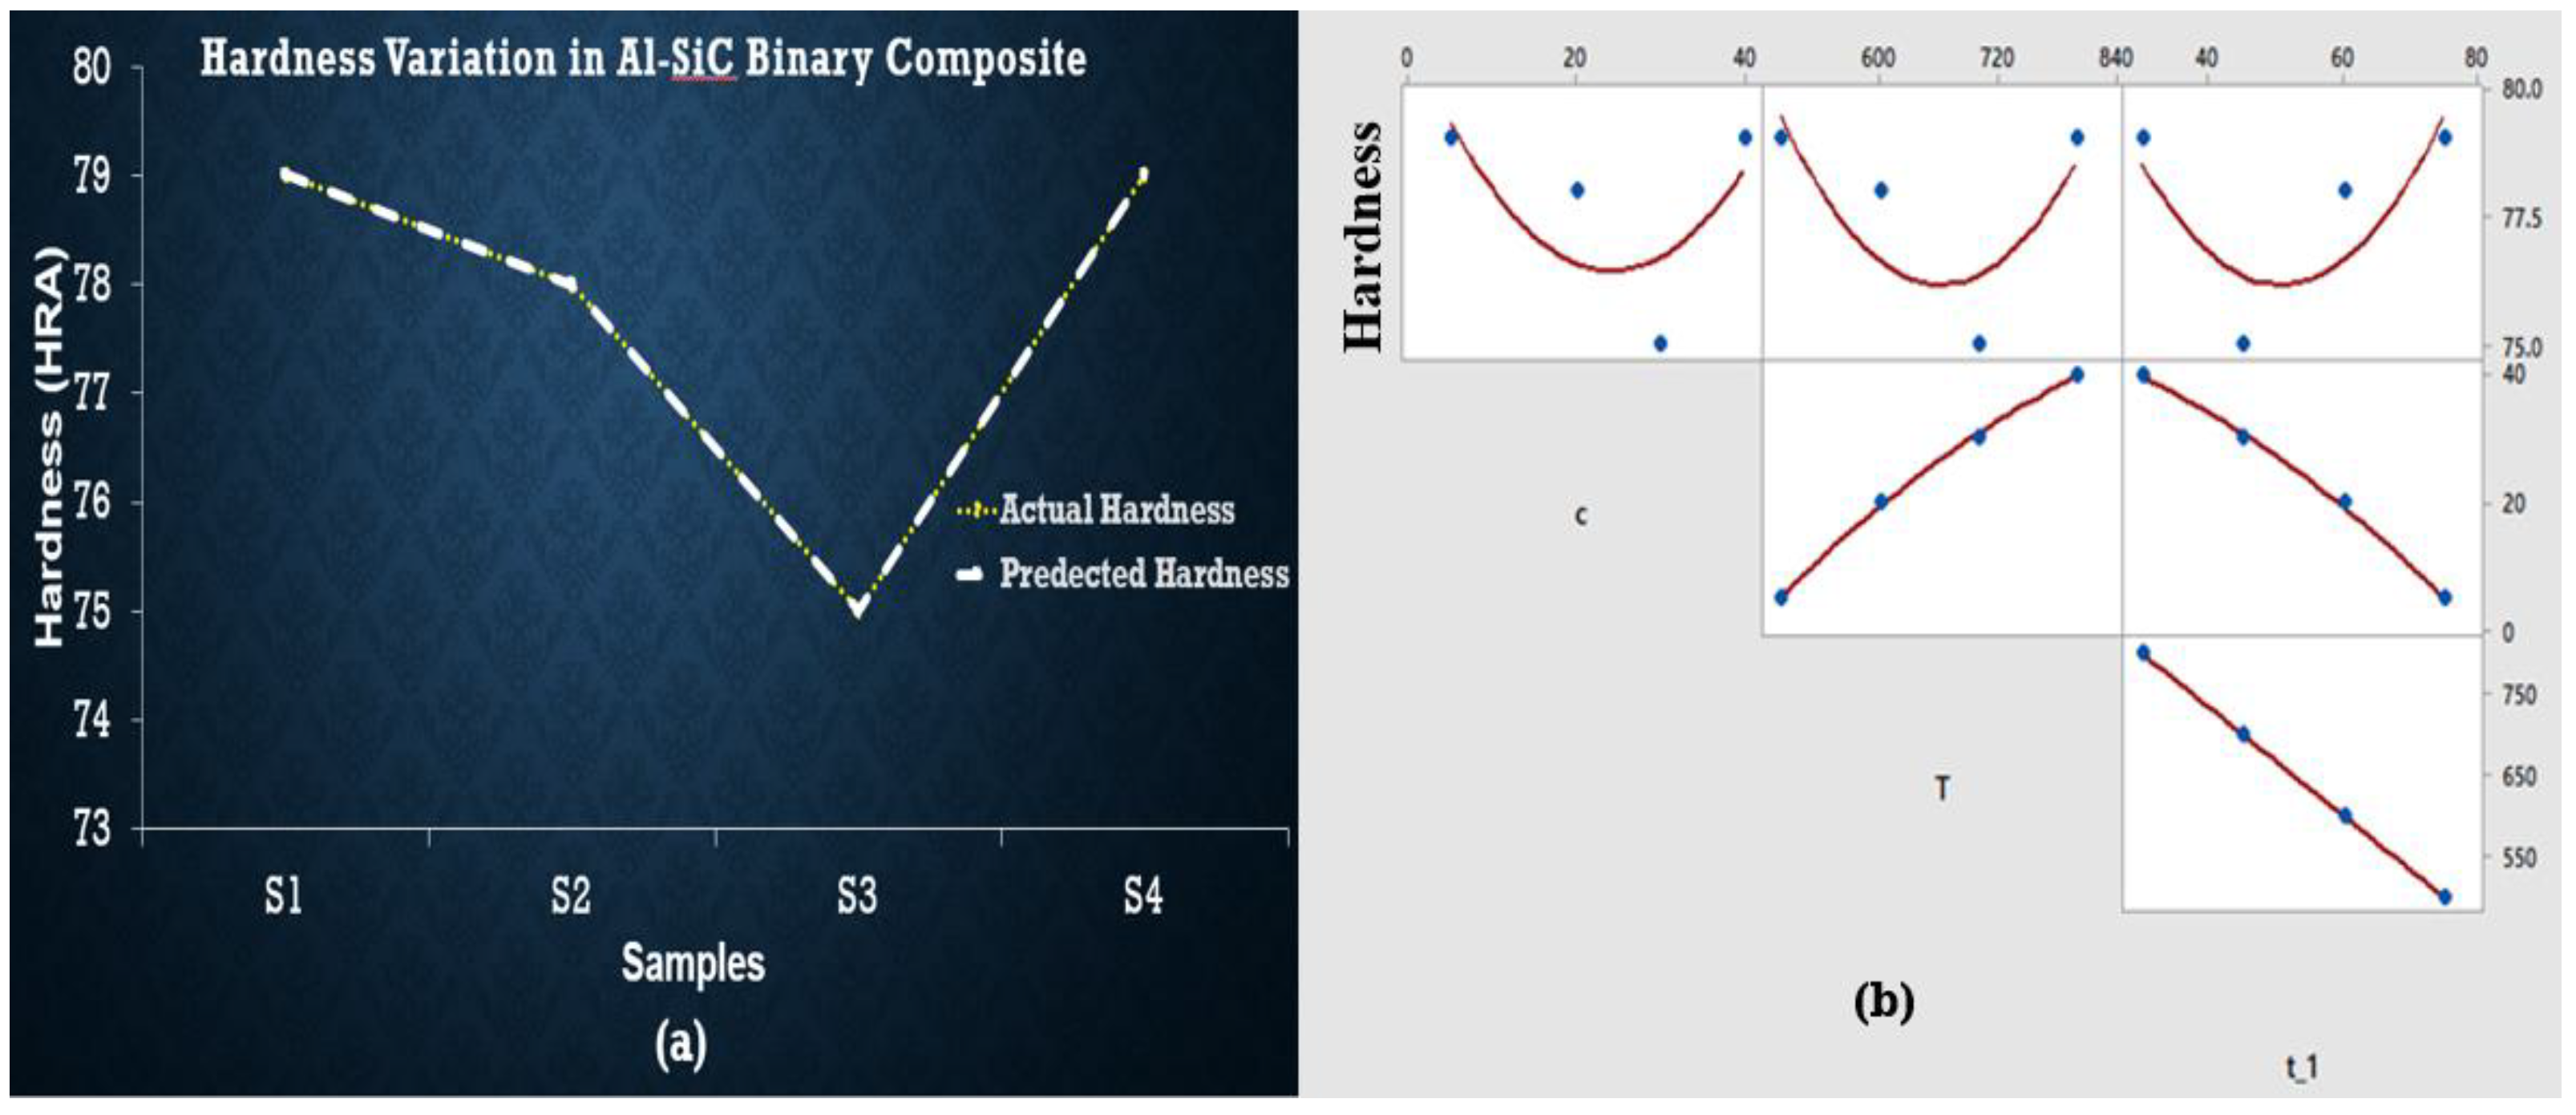
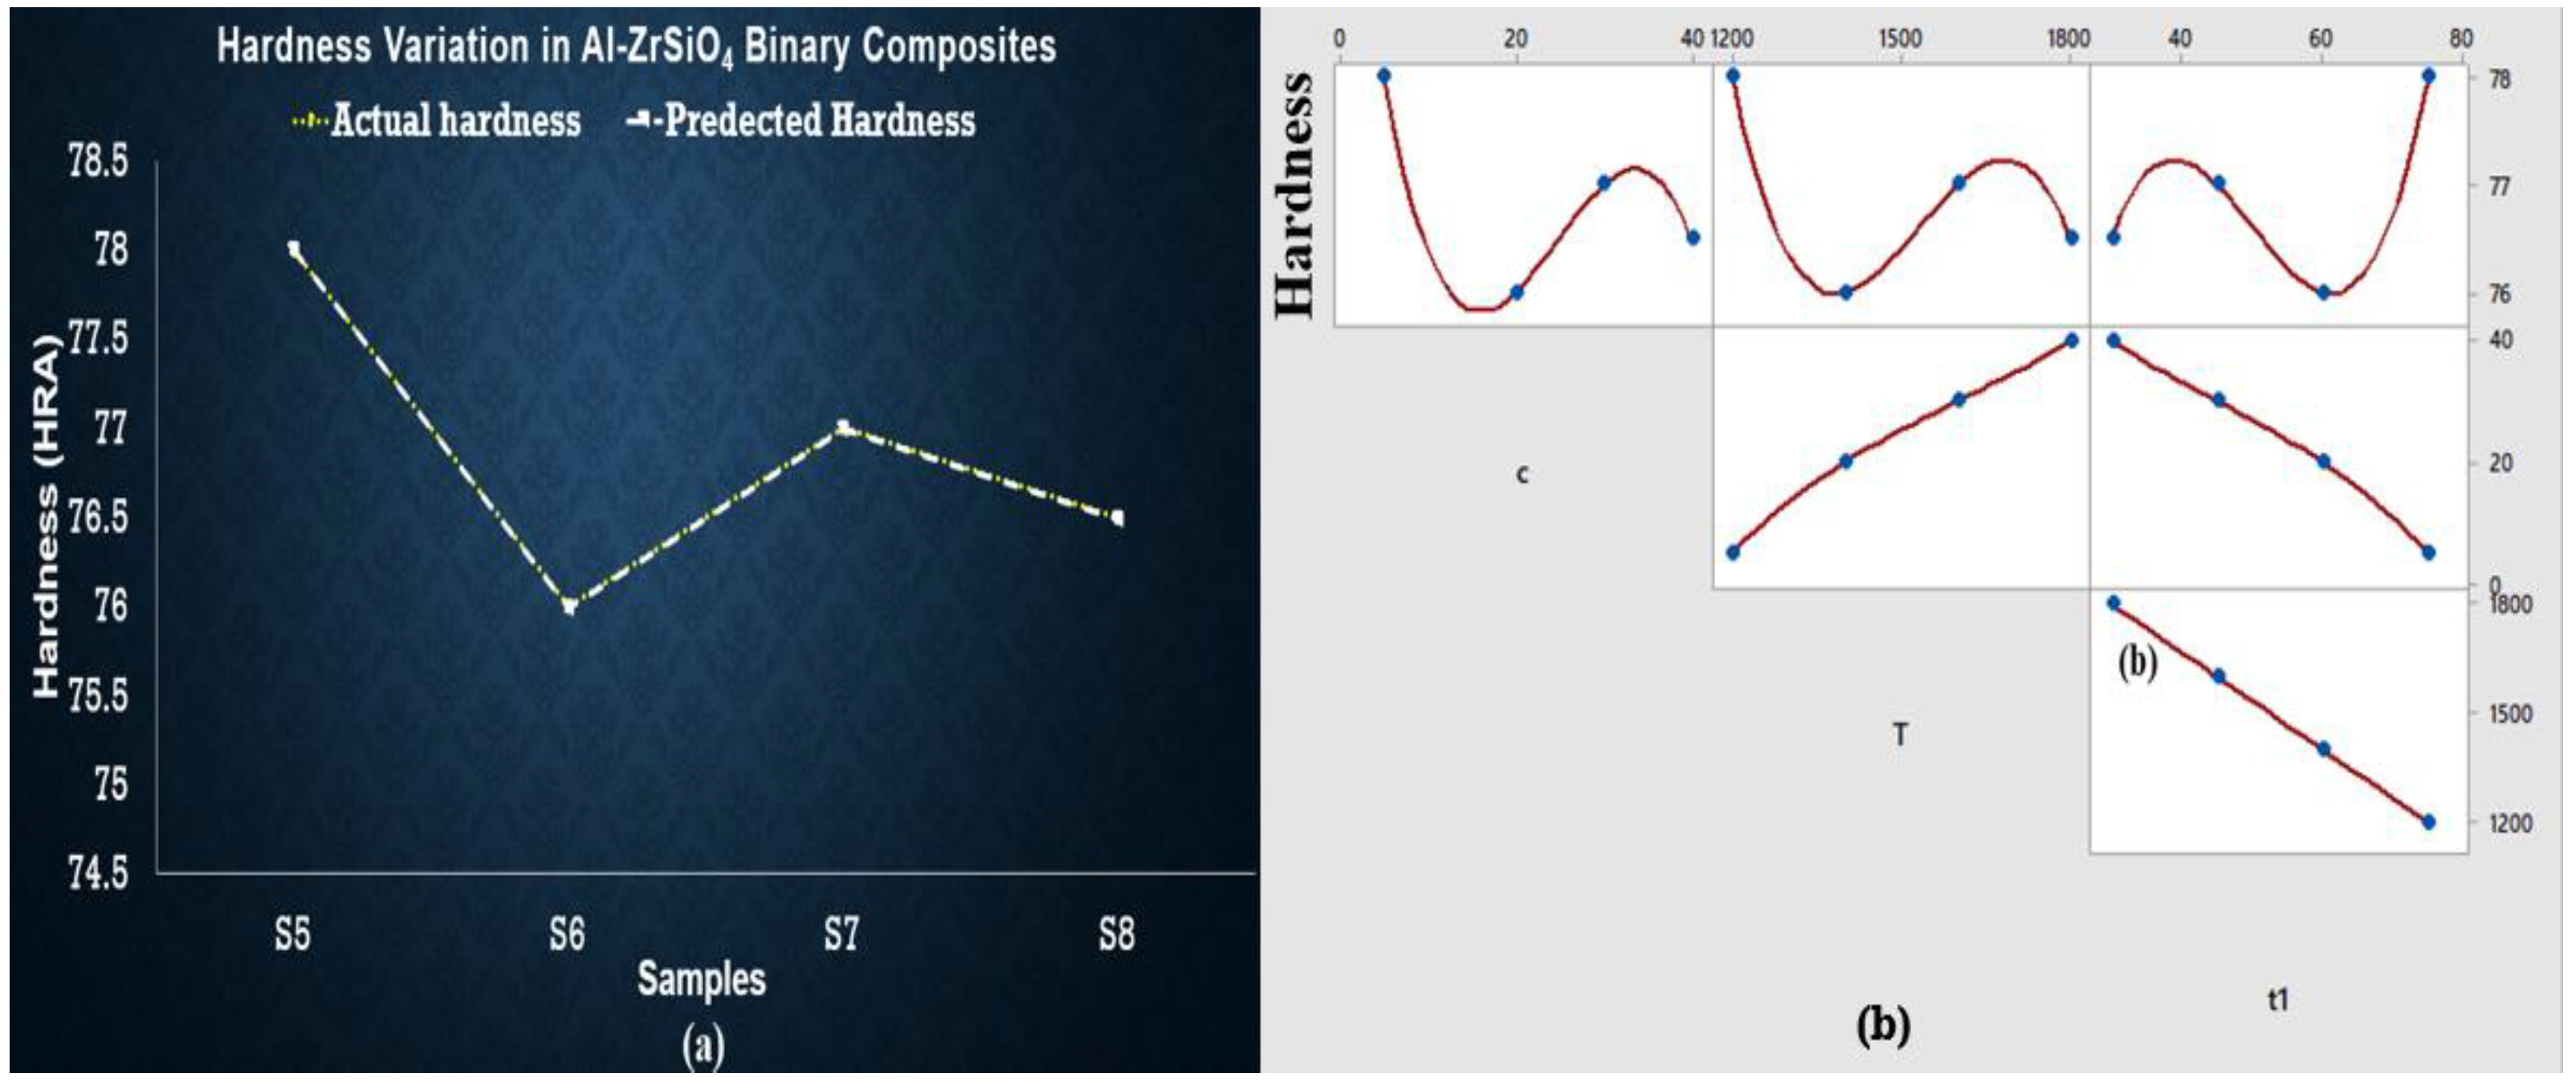
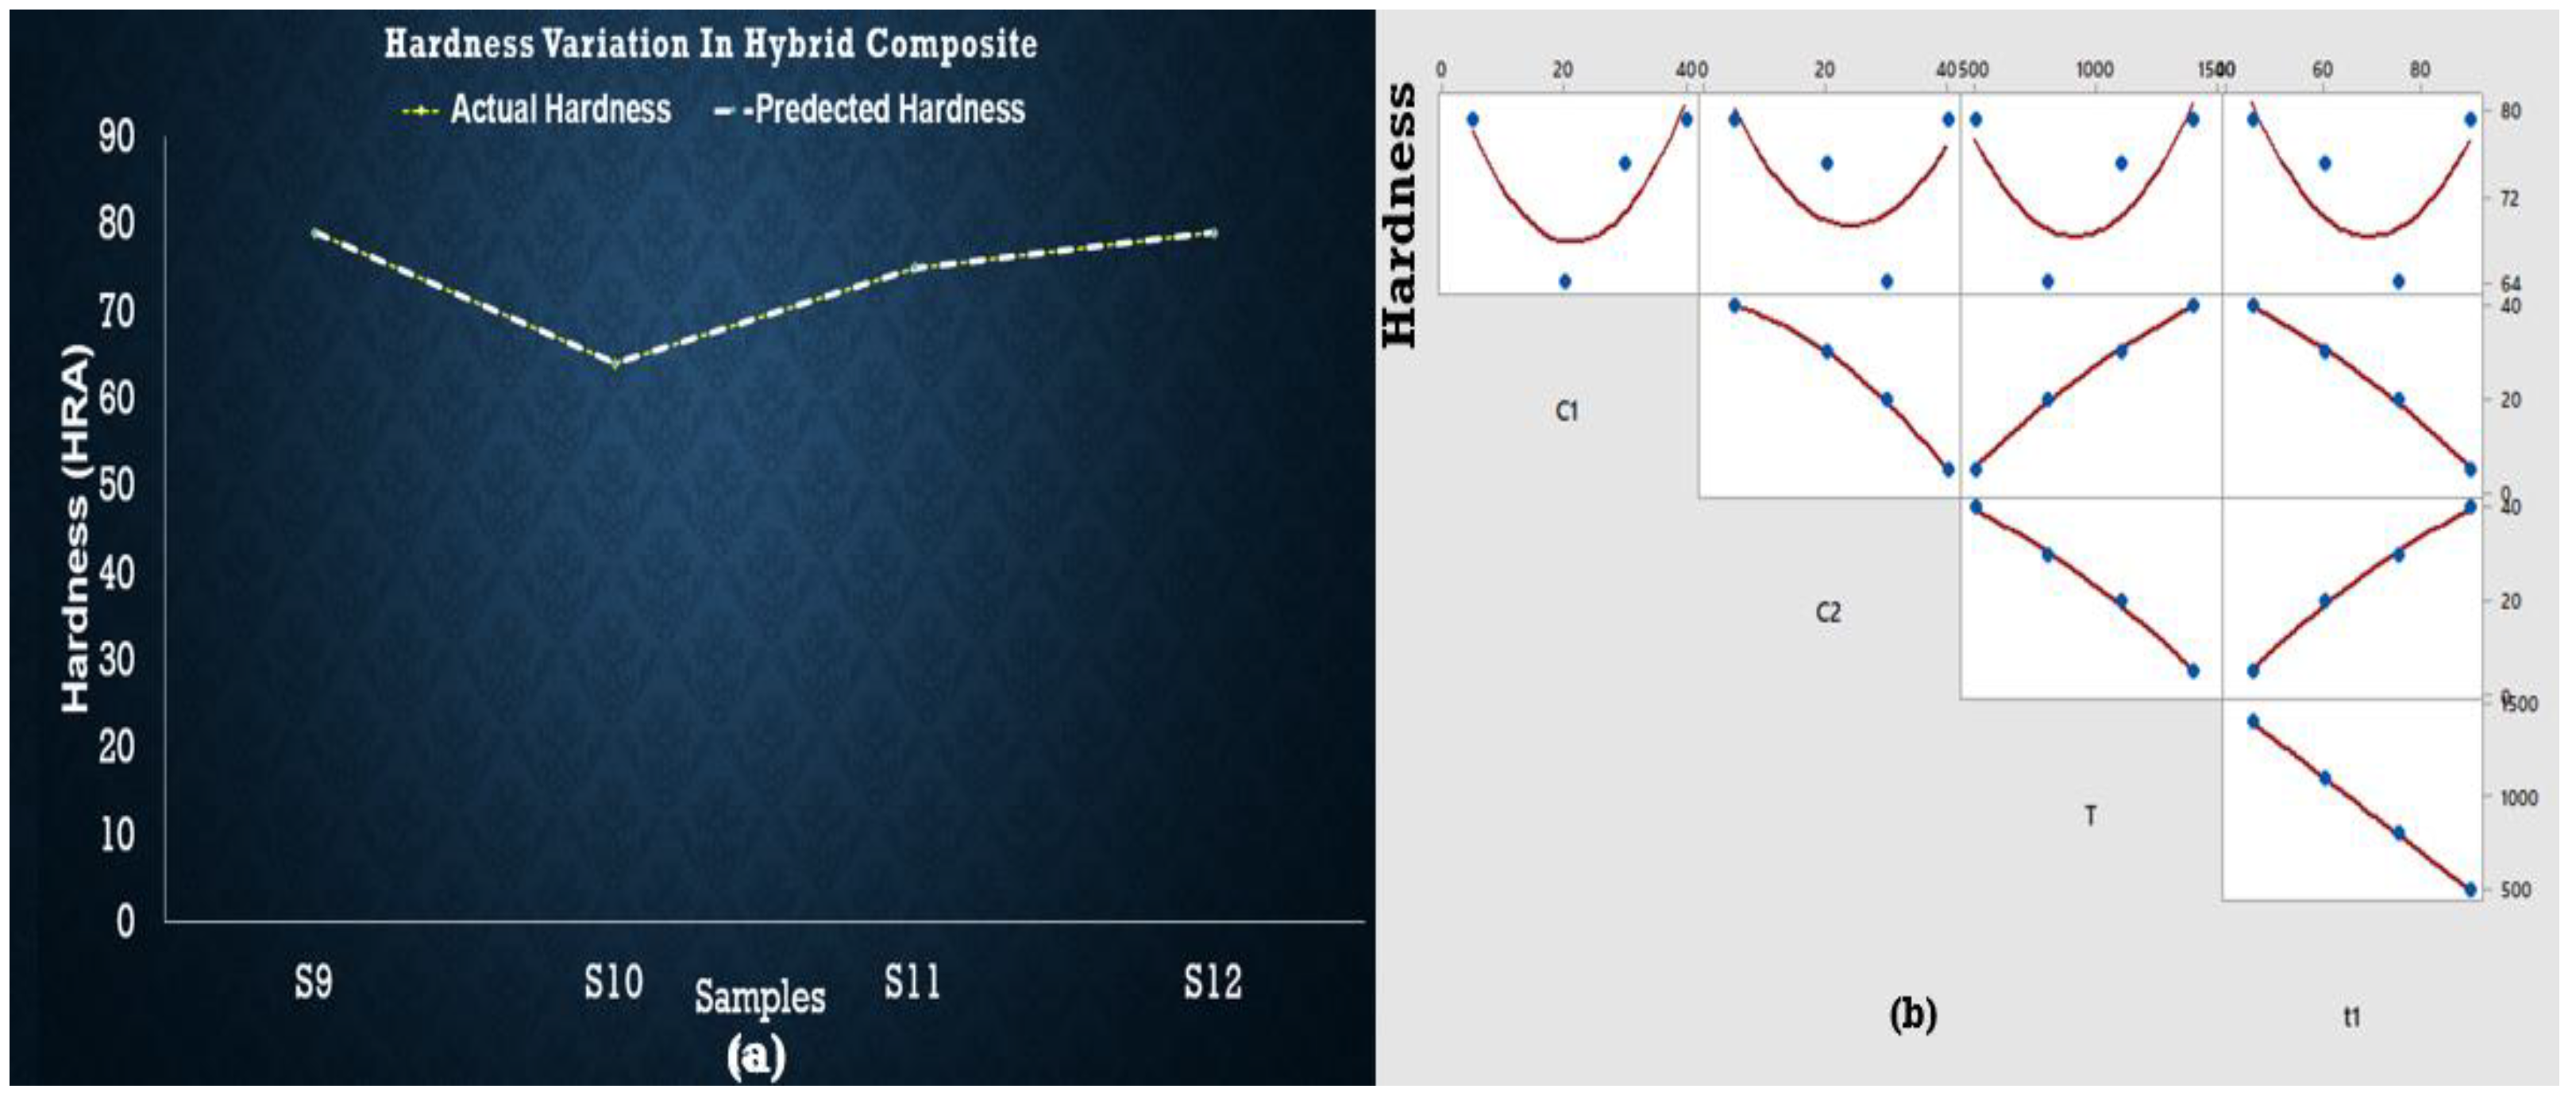
3.3. Hardness of Sintered Samples

The hardness of each composition was measured for three similar samples. It is observed from the above table that the Al-SiC matrix with wt % 5 and 40 have the same and maximum hardness, i.e., 79 HRA out of all other samples of Al-SiC. The results can observe that as temperature increases, the hardness increases, whereas at elevated temperature, concentration does not impart much in the case of Al-SiC samples. However, in the case of ZrSiO4, it is also important to note that maximum concentration of ZrSiO4 imparts greater hardness to AMCs at low temperature and higher sintering time than at high temperature and lower sintering time. Therefore, concentration of reinforcements (wt %) contributes significantly towards hardness in the case of Al-ZrSiO4.

3.4. Regression Analysis for Hardness of Sintered Samples

Experimental results show that from samples S1 to S4, the temperature and concentration of SiC are being increased. At the same time, hardness decreases from S1 to S3 and then increases up to S4; Equation (1) shows the same behavior, but the effect of concentration is negative, and the effect of temperature is favorable. Still, overall hardness is also dependent on intercept terms. No one from an independent variable is changed indecently, and their combined effect shows the same behavior as experimental results shown by the predicted hardness line in Figure 5. Moreover, maximum hardness was observed for S1 and S4. Similarly, for S5 to S8 the predicted and actual hardness overlapped as shown in Figure 6.
Hardness = 52.5 + 0.058 T − 0.53c1
Hardness = 6.375 + 0.7875c1 + 0.06313T − 0.007500c1 × c1
Hardness = −79.33 − 5.200 c1 + 1.400 c2 + 0.2567 T
where c1 is composition of Al-SiC samples, and c2 is the composition of Al-ZrSiO4 samples and T sintering temperature.
Equation (3) was developed to estimate the relations between experimental results, which shows that c1 (composition of SiC) decreases the hardness. In contrast, c2 (composition of ZrSiO4) and sintering temperature tend to increase the hardness when all independent variables are changed. The maximum hardness was observed at S9 (at minimum temperature and concentration) and S12 (at maximum temperature and concentration) as shown in Figure 7. S10 represents the smallest value of hardness, whereas the regression equations do not entirely fulfill the statistical requirements observed in ANOVA results and are presented in a supplementary file. As there is no significant factor (p < 0.05) found in the case of hardness, their behavior is the best representation of experimental data.

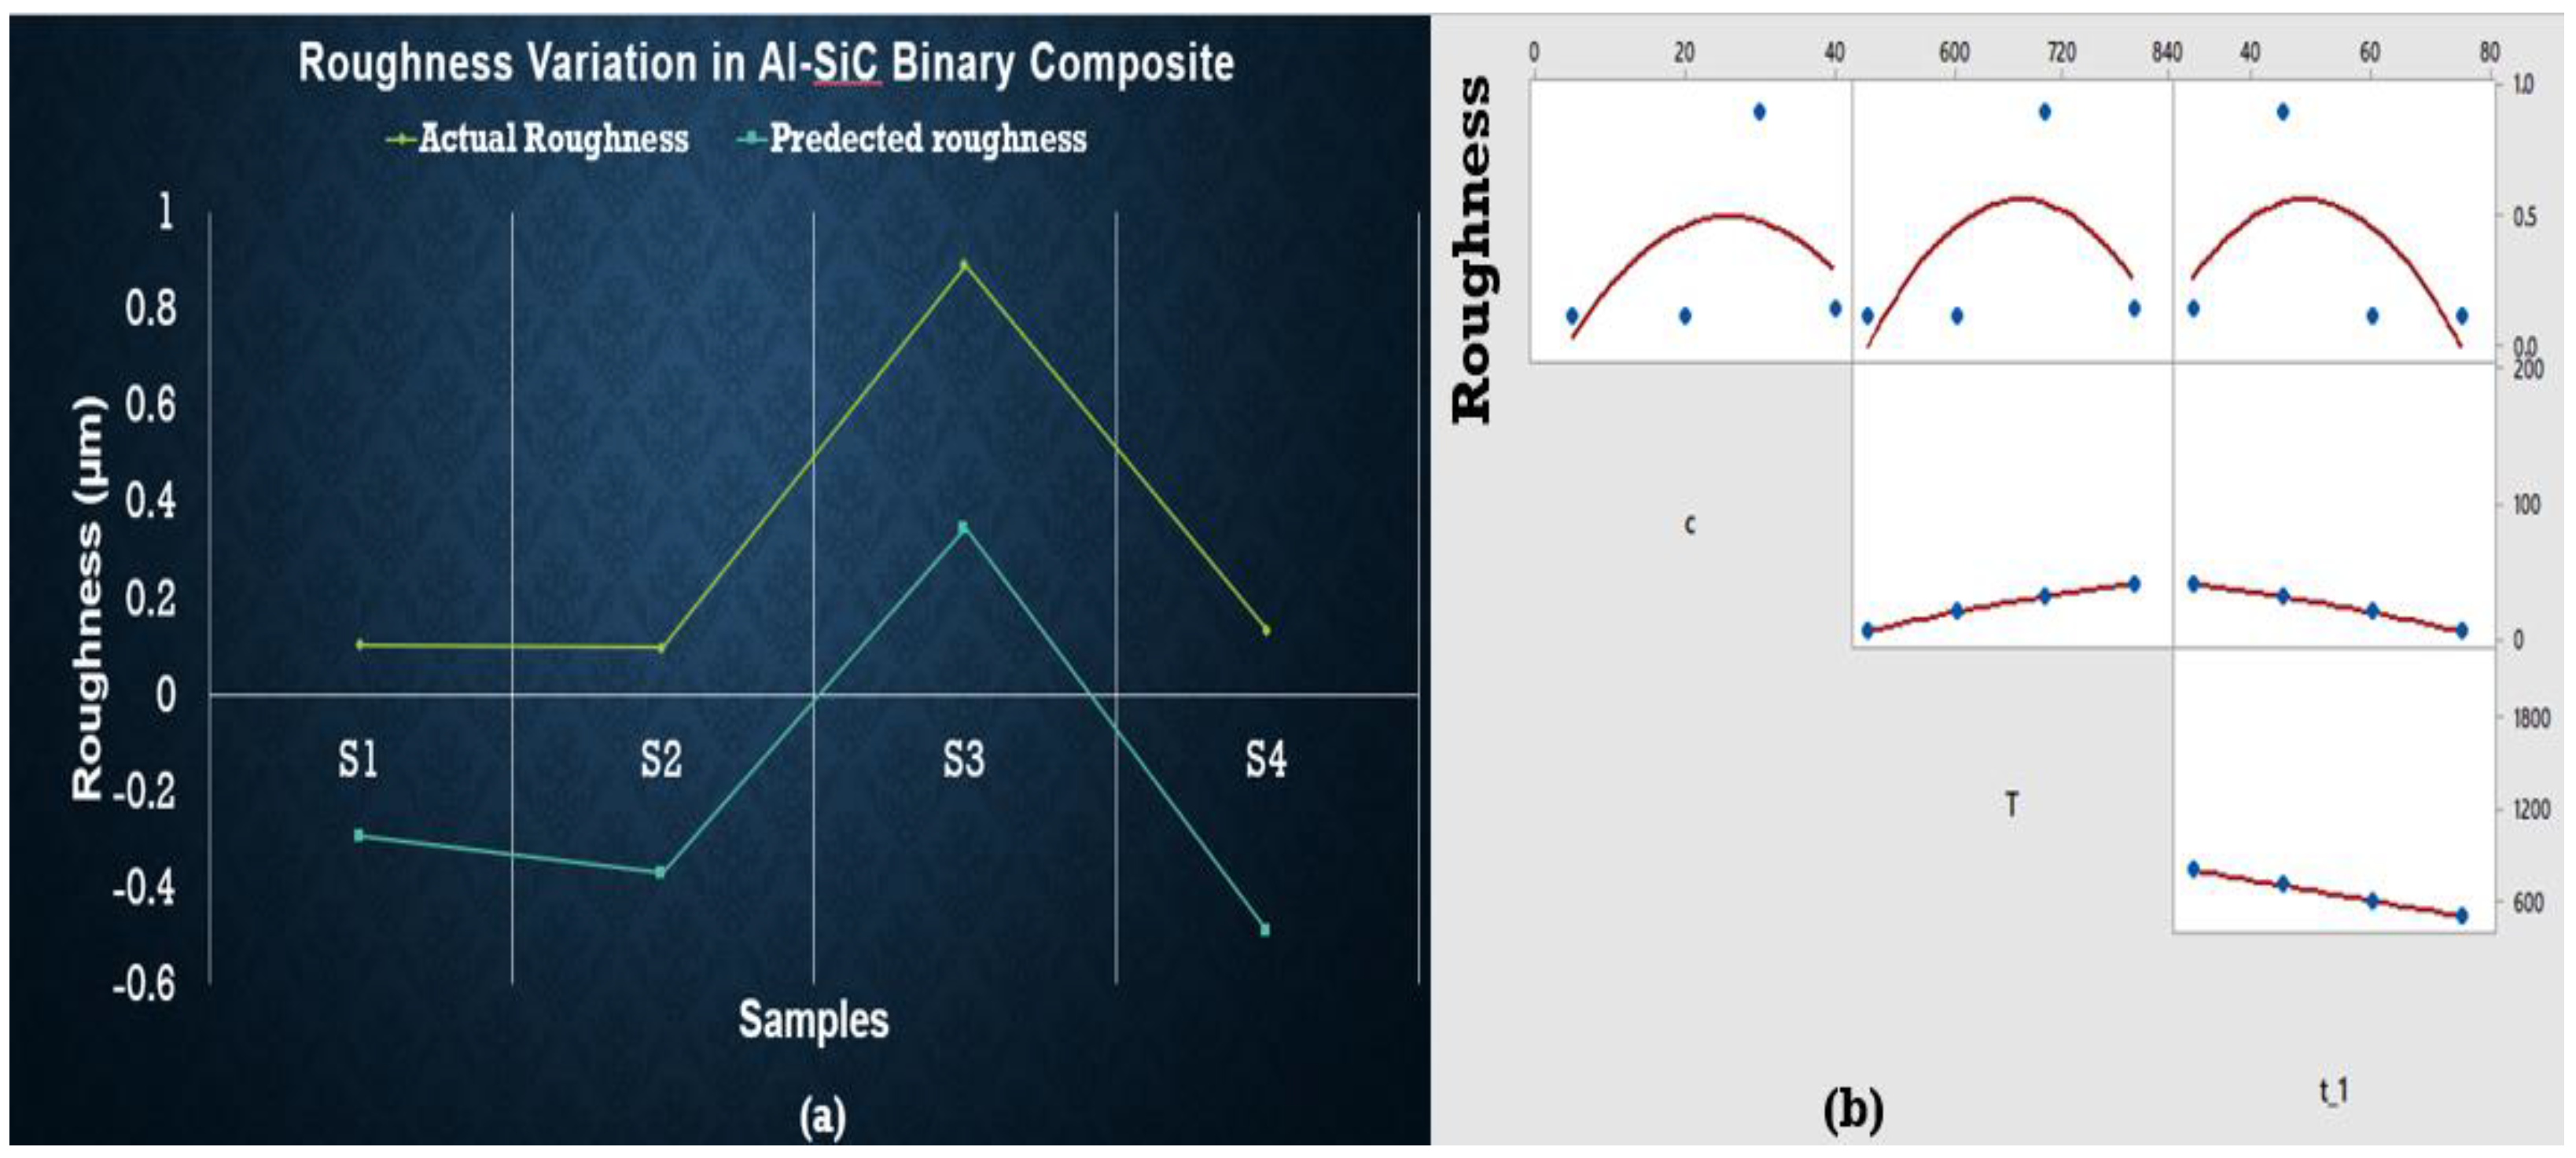
3.5. Roughness of Sintered Samples

Surface Roughness was measured by using a portable roughness meter known as surftest SJ-210 [mm] with detector measuring force of 0.75 mN and stylus tip (diamond tip) angle of 60°. It can measure the range up to 360 µm. The result for Al-SiC AMCs shows that composition is not significantly affecting the surface roughness at elevated temperatures. Still, temperature and composition do have a combined negative effect on it. Additionally, there is another parameter for the behavior shown in Figure 8. for surface roughness. This is verified by the regression equations given below. Only S3 shows the maximum value of roughness.

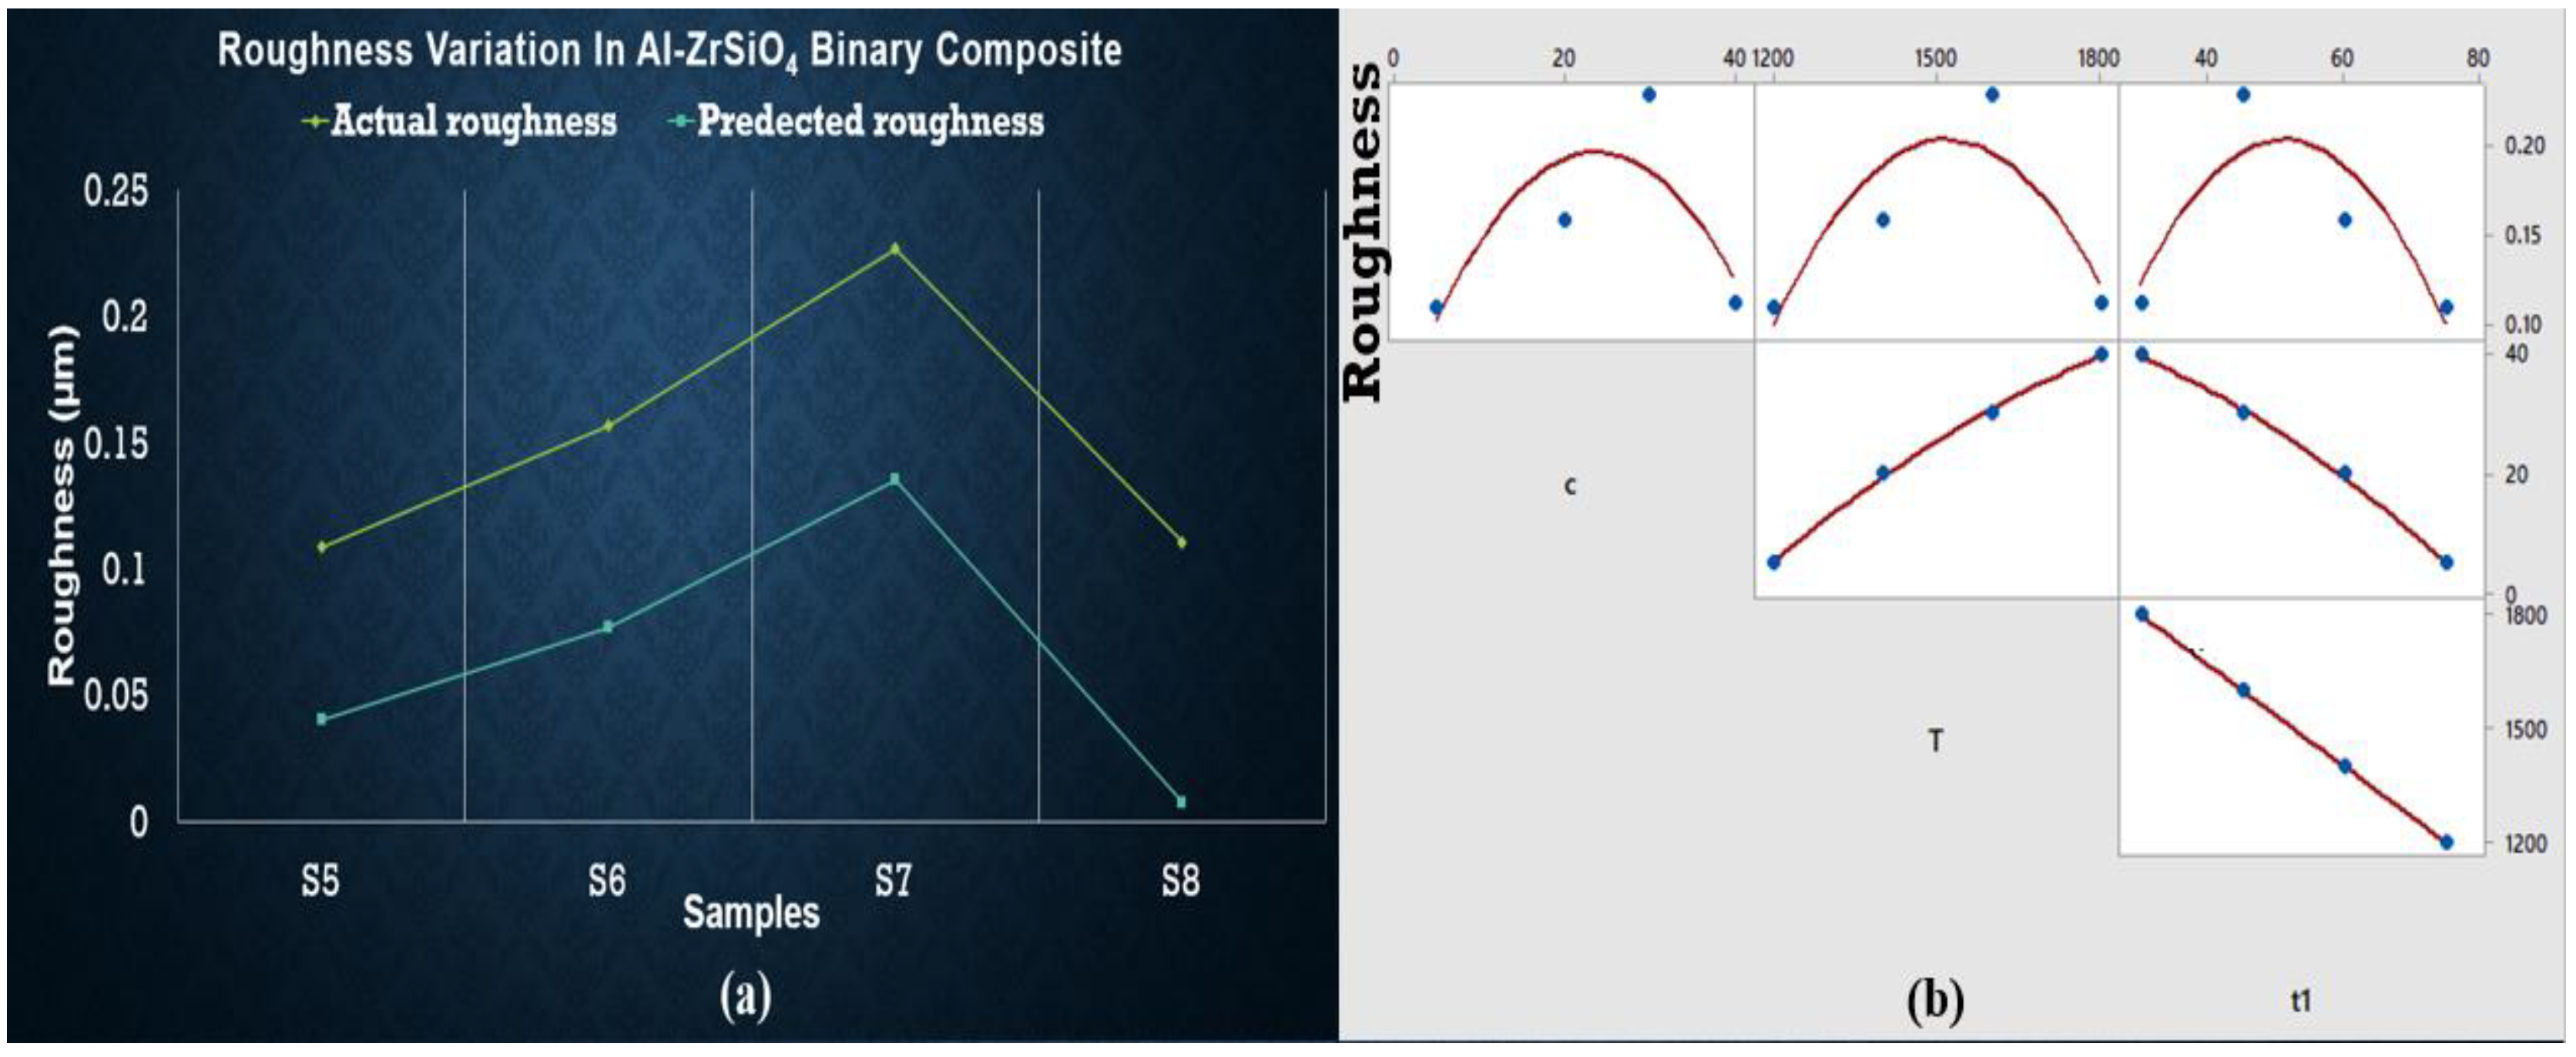
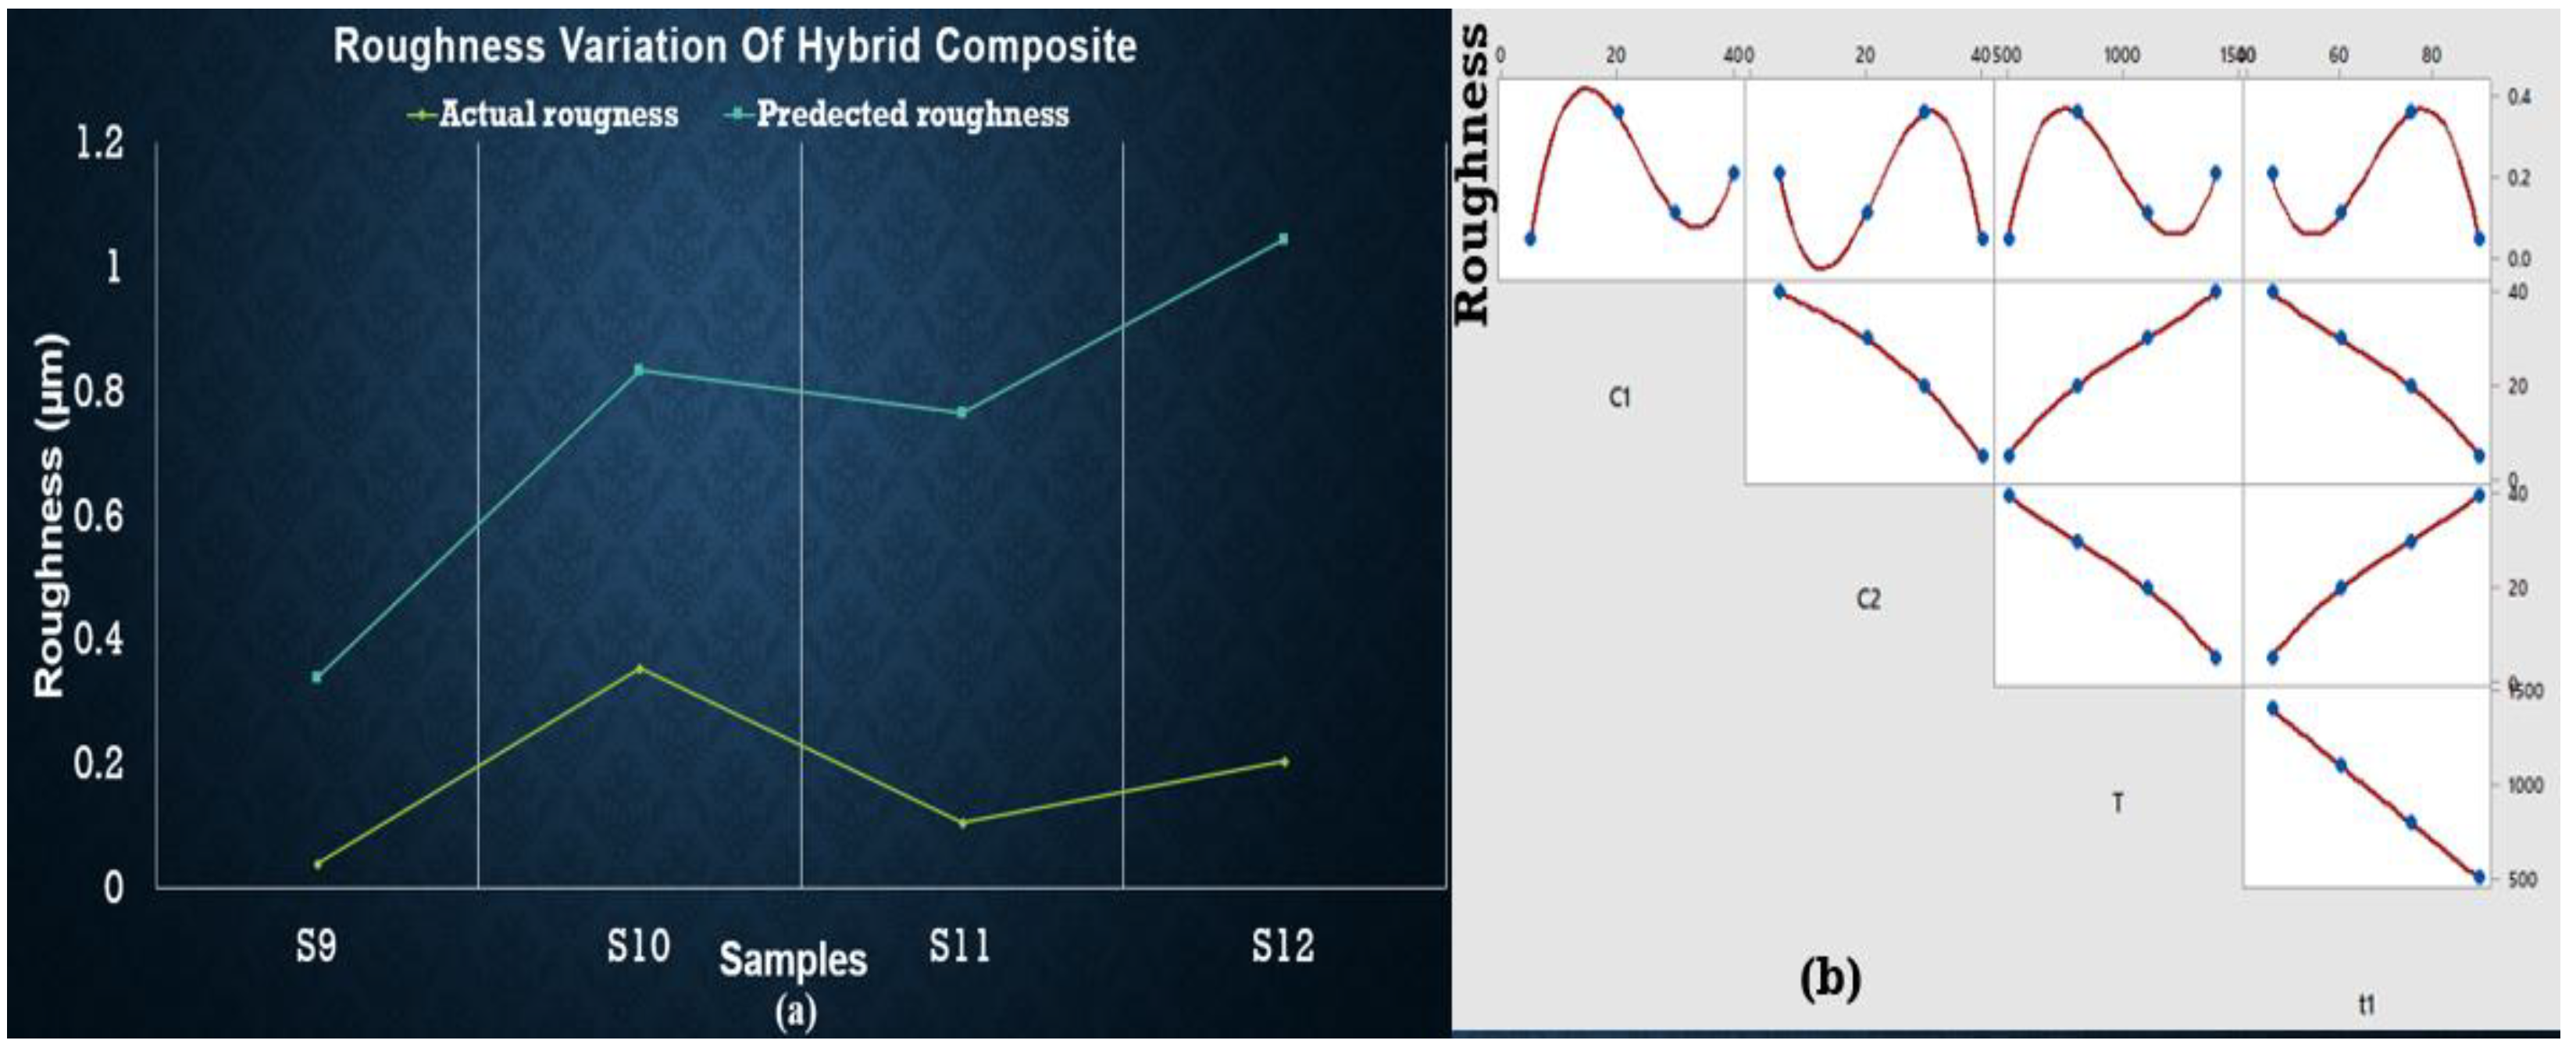
3.6. Regression Analysis for Roughness of Sintered Samples

The intercept value is high in Equation (4), which shows that some other parameter is involved while deciding the surface roughness of said samples. The c1*T term also has a minor influence on reducing roughness. In comparison, ANOVA results observed no significant factor. Equation (5) presents the effect of change in composition with the sintering temperature, which can be observed in the graphical representation in Figure 9. The roughness of ZrSiO4 samples is minimum for S5 (at minimum temperature and concentration) and S8 (at maximum temperature and concentration). S7 shows maximum roughness, which is undesirable. Surface roughness is increased by c1 while c2 and sintering temperature tends to decrease it.
Roughness = −40.45 − 0.08175 c1 + 0.08579 T − 0.000775 c1 × T
Roughness = −4.598 − 0.02765 c1 + 0.004057 T − 0.000930 c2 × c2
Roughness = 5.714 + 0.1128 c1 − 0.06960 c2 − 0.006910
where c1 is the composition of Al-SiC samples and c2 is the composition of Al-ZrSiO4 samples and T is the sintering temperature.
The maximum value for roughness was observed for S12 based on experimental data, while predicted data based on the regression equation shows the maximum roughness value for S10. It can be concluded that S9 (at the lowest concentration and temperature) has minimum roughness value as shown in Figure 10. Again, ANOVA results are presented in a supplementary file that shows no variable being significantly affecting the roughness.

4. Discussion

Porosity originated in the samples due to the difference between melting points of base metal and reinforcements. As soon as the difference increases, porosity increases. This is also justified in the previous studies—that increment of reinforcements drastically grows the porosity because of the clustering and agglomeration at high concentration of particles, dense, random distribution, and a high melting point of reinforcement particles hinders the effective sintering operation [26,36,37]. Hence, reinforcement particles act as a barrier to the rearrangement and diffusion of particles, leading to higher porosity irrespective of the sintering temperature [38,39]. As far as hardness is concerned, it is clear from graphical representation that S5 to S8 temperature and concentration are increased but maximum hardness is observed at S5, then it decreases up to S6, increases for S7, and finally decreases for S8 as well. So, S5 shows the best results for hardness. Hybrid AMCs showed similar hardness at two different concentrations: temperature and time. AMCs with SiC wt % 5, ZrSiO4 wt % 40 and SiC with wt % 40, ZrSiO4 having wt % 5 shows the same hardness sintered at 500 °C (60 min) and 1100 °C (15 min) respectively. Therefore, all the above results showed that hardness is greatly influenced by sintering time, temperature, and concentration of reinforcements. It is evident from the above plots that the predicted and actual hardness lies on one another. The addition of SiC in the aluminum matrix increases the porosity of the composite. The increase in the porosity can be attributed to the high hardness of SiC, which hinders the proper compaction of composite powders [40]. The increased porosity of Al-SiC composites has also been reported by other researchers [41,42,43]. In the case of ZrSiO4, maximum hardness was observed at low sintering temperature and the least reinforcement concentration for maximum time. This is due to the reason that ZrSiO4 has a very high melting temperature, nearly 2550 °C. The regression Equation (2) did not wholly satisfy the statistical requirements obtained in ANOVA results (shown in supplementary file), as there is no significant factor (p < 0.05) found in the case of hardness, but their behavior is the best representation of experimental data, especially in the case of predicted hardness values by these equations which give us some points similar to those of experimental values. The enhanced hardness of the composites may be due to the uniform distribution of SiC and ZrSiO4 in the composites and the high density of ZrSiO4. Actual values of roughness in the case of SiC and ZrSiO4 samples are the same as the predicted roughness. Predicted and actual values follow the same behavior but did not lie on one another, whereas actual roughness behavior of hybrid samples deviates from the predicted values. In the future, this study can be extended by making a comparison between morphology of the initial powders and processed ones, and machining of the prepared samples (in the current study) using non-conventional machining operations. Optimization of machining parameters of machining such composites also covers the currently needed area to explore.

5. Conclusions

In the experimental work, Al-SiC, Al-ZrSiO4, and hybrid metal matrix composites of Al-SiC-ZrSiO4 were prepared with four different compositions sintered at four different sintering temperatures together with four different time frames using the powder metallurgy method. The important conclusions are:
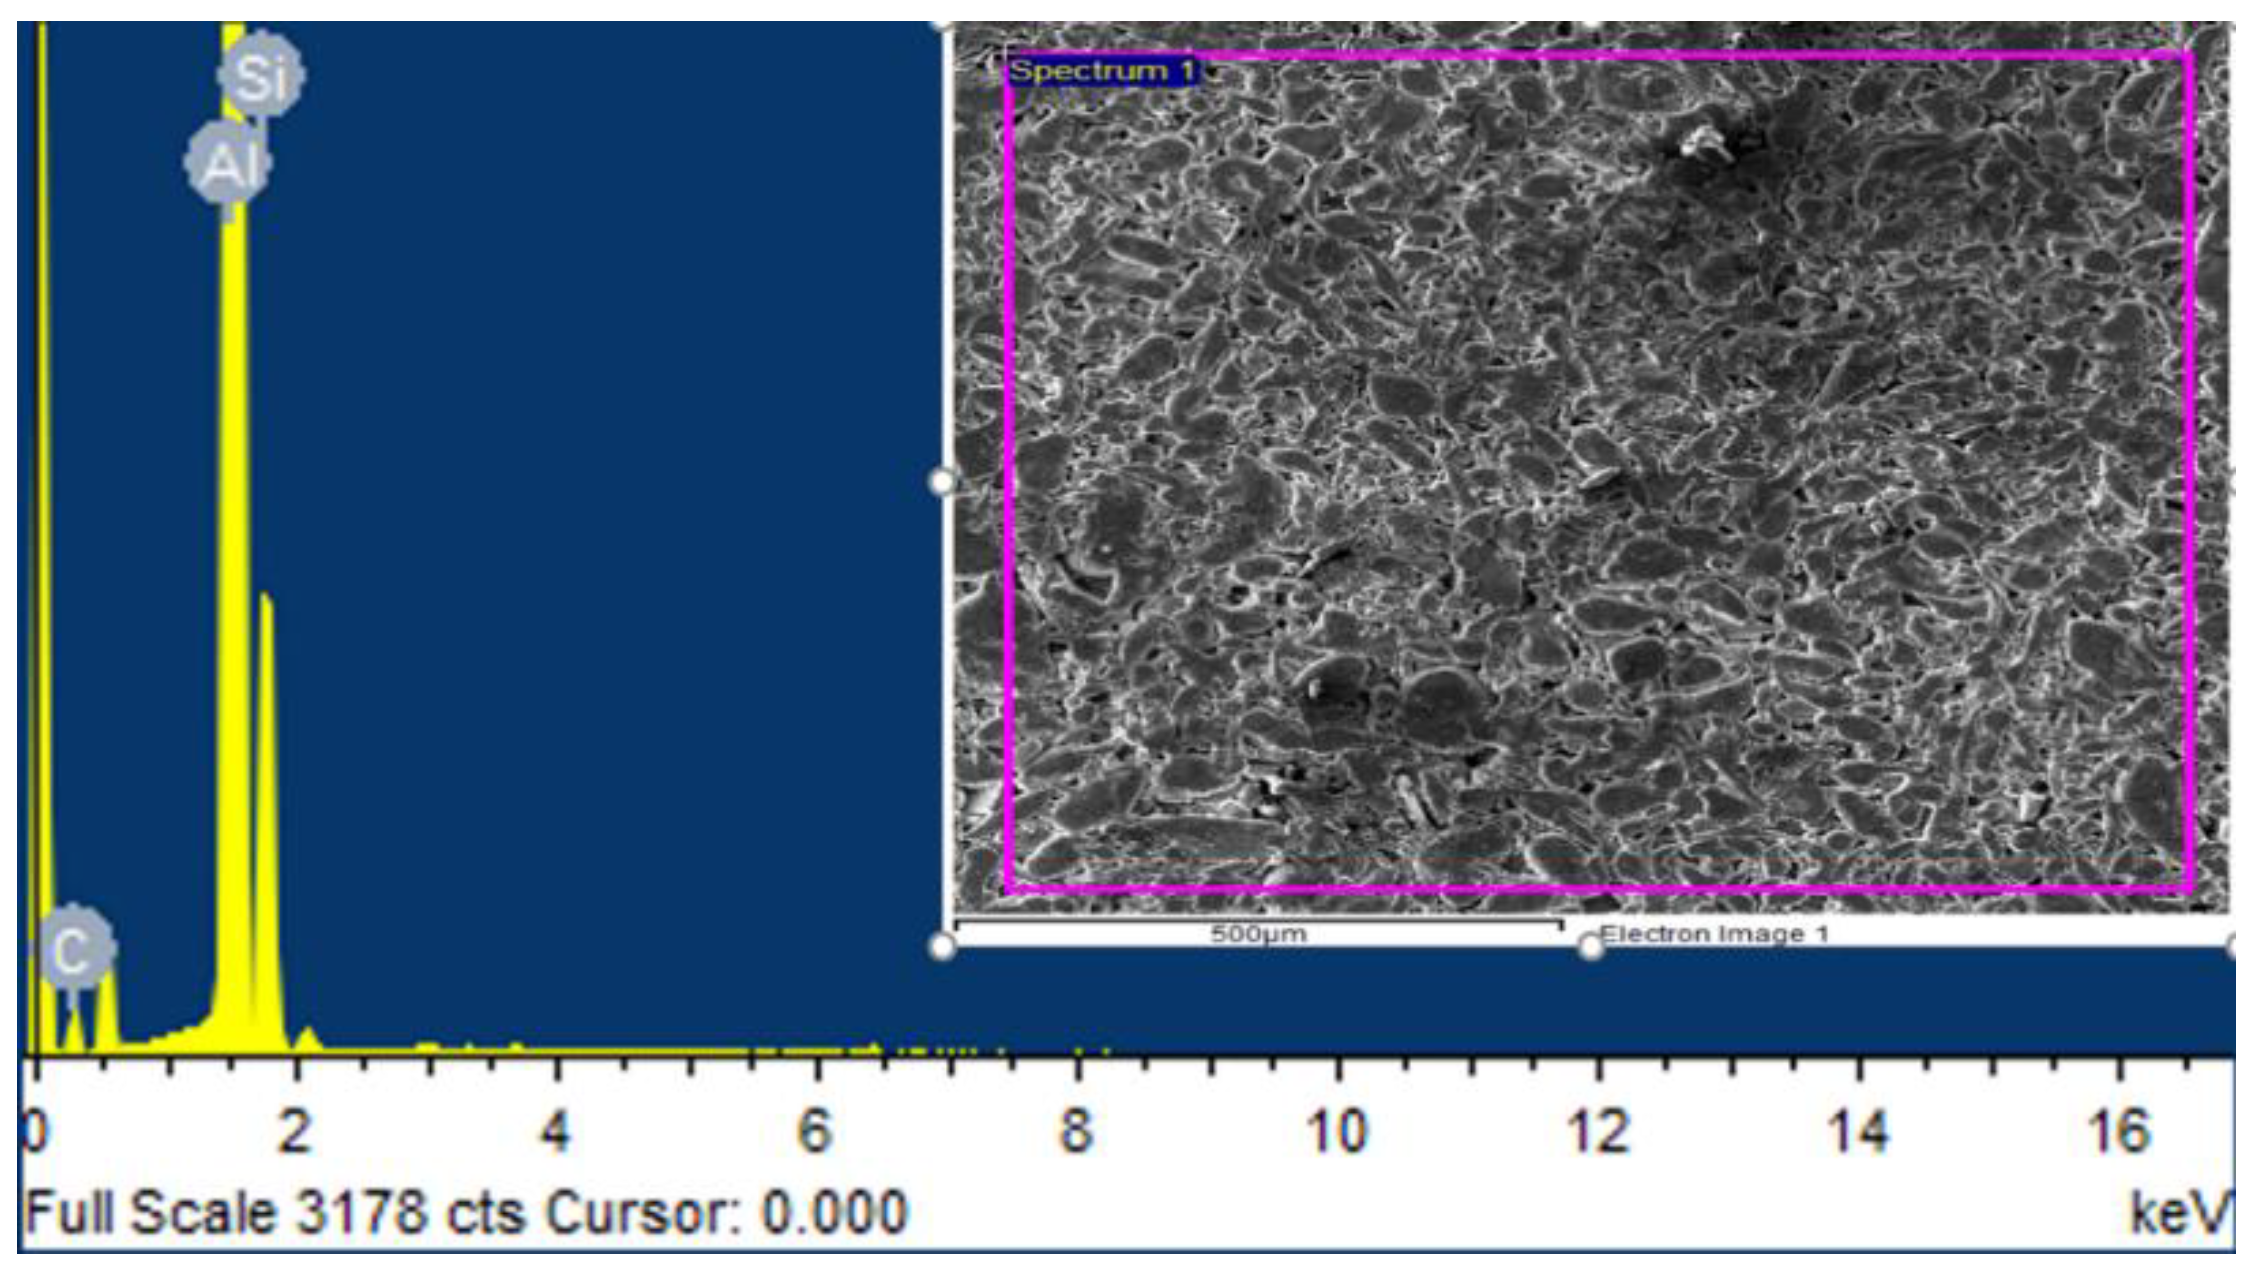
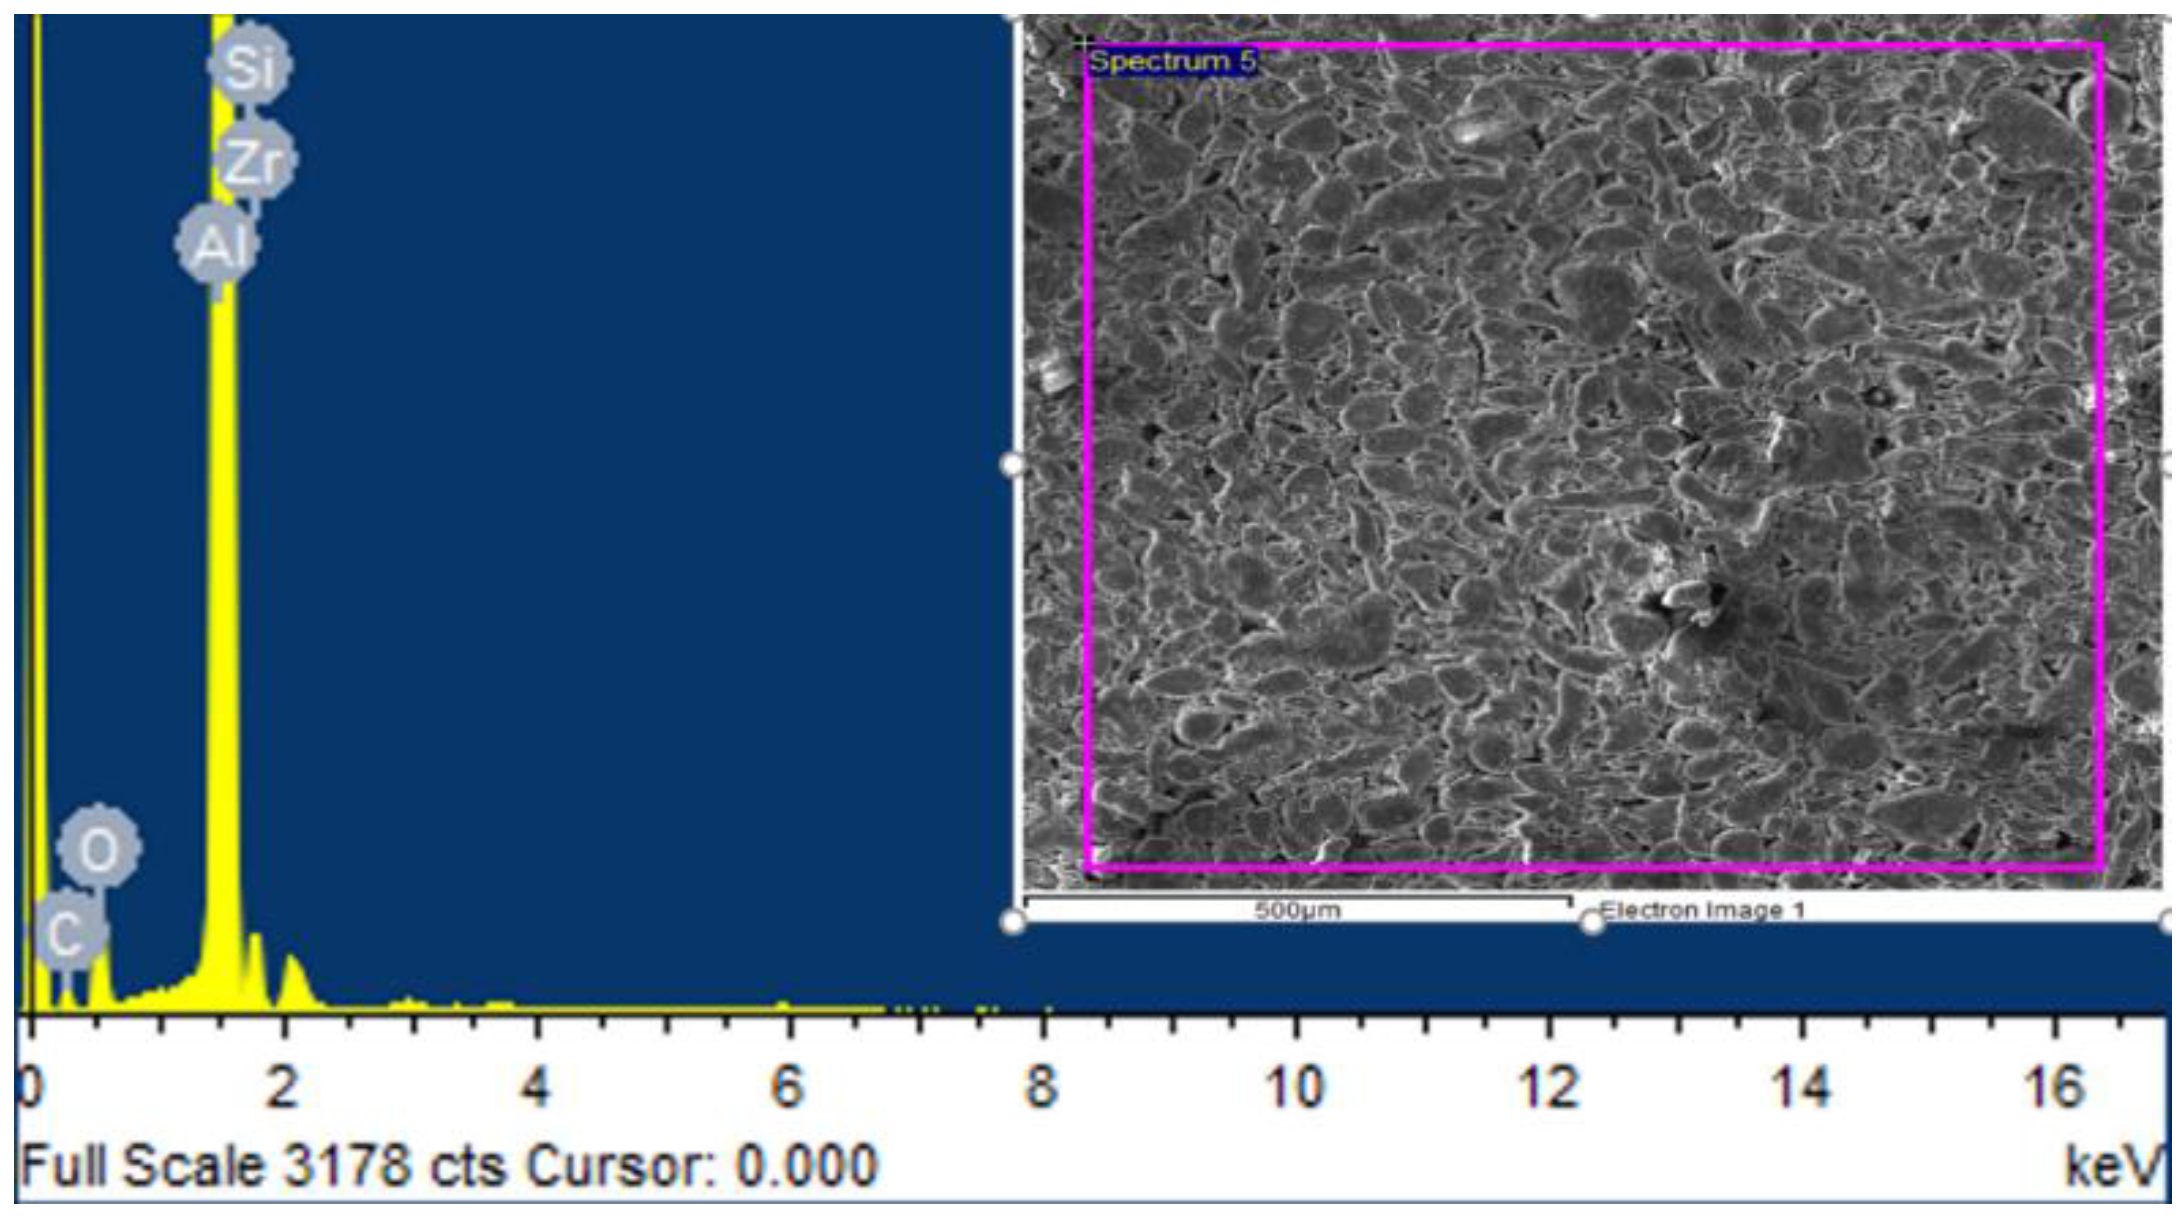
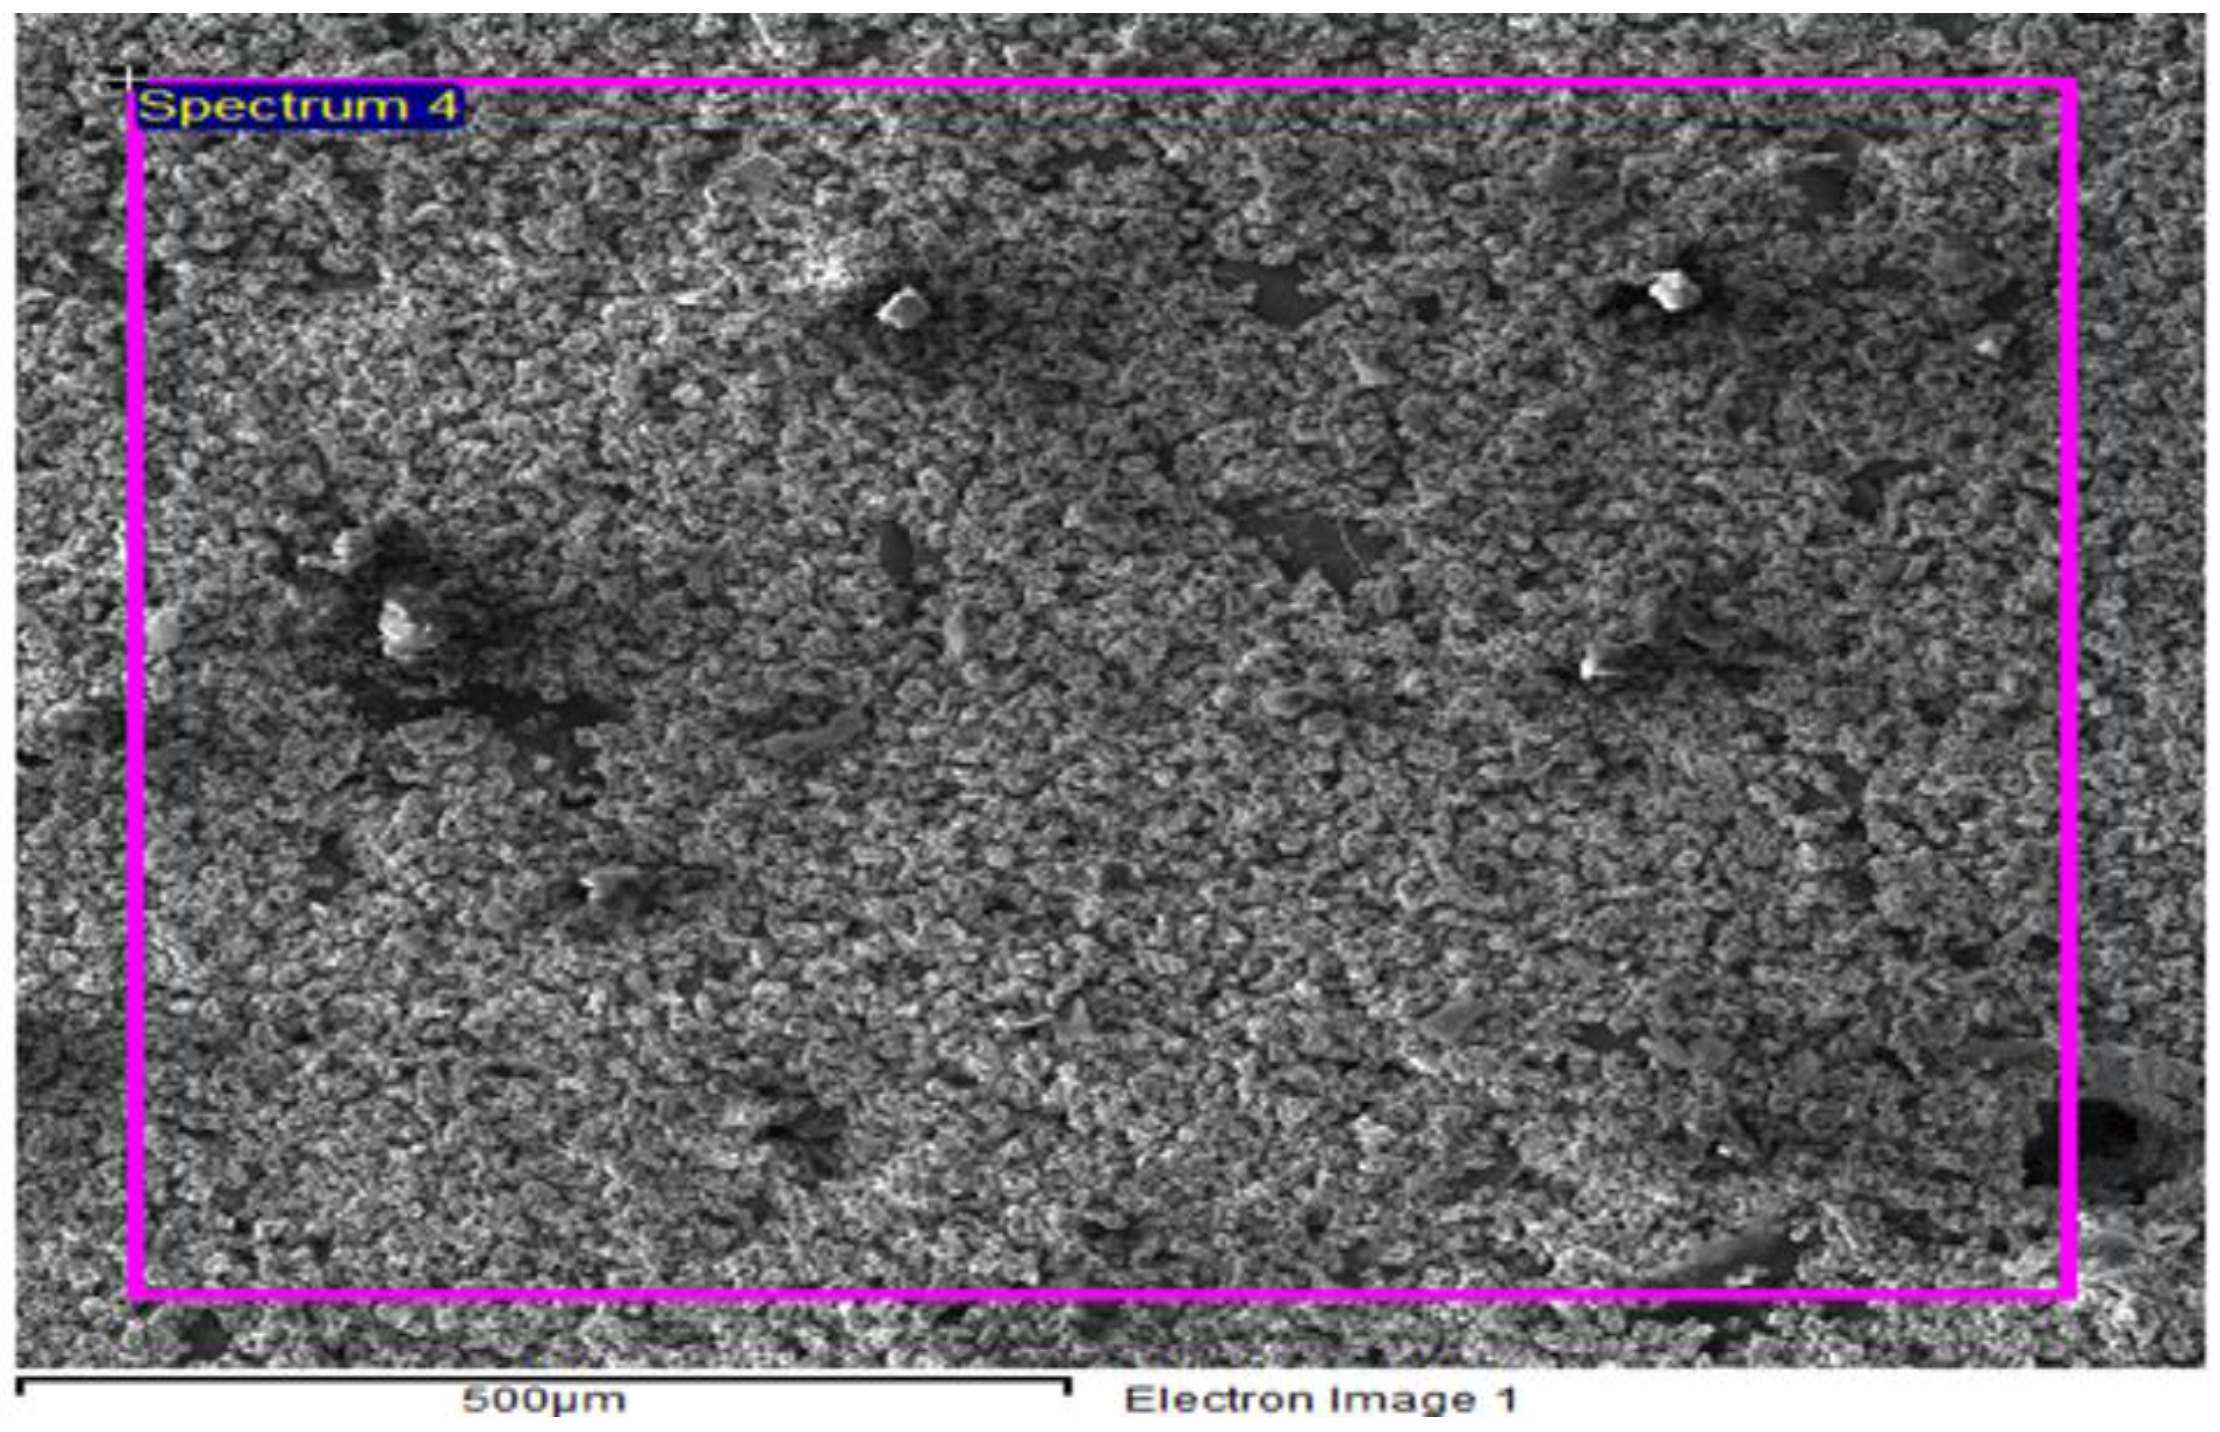
  • EDS analysis validate the presence of SiC and ZrSiO4 in the fabricated composites, as the distribution of reinforced particles in the aluminum matrix is estimated from elemental analysis.
  • It is concluded from the current study that the hardness of aluminum is enhanced the most with the addition of maximum wt % of SiC, i.e., wt % 40 at elevated temperature in the case of binary and hybrid MMCs.
  • Enhancement of roughness is low in the case of less wt % of SiC but higher wt % of ZrSiO4.
  • It has also been observed that the intercept values are higher in the case of hardness and roughness of Al-SiC binary samples. However, for hybrid samples, some parameters other than after composition, temperature, and time are also responsible for this behavior, which must be studied in further detail.
  • It is concluded from the current study that the sintering time did not impart significant hardness and roughness in all the materials that were studied.
  • Future studies may focus on investigating machining parameters adopted for the non-conventional machining of these samples. Effects of machining on the hardness and surface roughness of these samples and their parametric comparison before and after machining must be an exciting area to explore.

Supplementary Materials

The following supporting information can be downloaded at: https://www.mdpi.com/article/10.3390/ma15124225/s1.

Author Contributions

Conceptualization, Formal analysis, Investigation, Writing—original draft; F.G.; Resources, Investigation, Methodology, O.R.S.; Validation, Supervision, Editing—final draft, M.Z.K. All authors have read and agreed to the published version of the manuscript.

Funding

This research received no external funding.

Institutional Review Board Statement

Not applicable.

Informed Consent Statement

Not applicable.

Data Availability Statement

Not applicable.

Conflicts of Interest

The authors declare no conflict of interest.

References

  1. Vani, V.V.; Chak, S.K. The Effect of Process Parameters in Aluminum Metal Matrix Composites with Powder Metallurgy. Manuf. Rev. 2018, 5, 7. [Google Scholar] [CrossRef] [Green Version]
  2. Ravindran, S.; Mani, N.; Balaji, S.; Abhijith, M.; Surendaran, K. Mechanical Behaviour of Aluminium Hybrid Metal Matrix Composites–a Review. Mater. Today Proc. 2019, 16, 1020–1033. [Google Scholar] [CrossRef]
  3. Singh, L.; Singh, B.; Saxena, K.K. Manufacturing Techniques for Metal Matrix Composites (MMC): An Overview. Adv. Mater. Process. Technol. 2020, 6, 441–457. [Google Scholar] [CrossRef]
  4. Bhoi, N.K.; Singh, H.; Pratap, S. Developments in the Aluminum Metal Matrix Composites Reinforced by Micro/Nano Particles–a Review. J. Compos. Mater. 2020, 54, 813–833. [Google Scholar] [CrossRef]
  5. Orbulov, I.N.; Dobránszky, J. Producing Metal Matrix Syntactic Foams by Pressure Infiltration. Period. Polytechnica. Eng. Mech. Eng. 2008, 52, 35. [Google Scholar] [CrossRef] [Green Version]
  6. Kaptay, G. The Threshold Pressure of Infiltration into Fibrous Preforms Normal to the Fibers’ Axes. Compos. Sci. Technol. 2008, 68, 228–237. [Google Scholar] [CrossRef] [Green Version]
  7. Orbulov, I.N.; Németh, Á.; Dobránszky, J. Infiltration Characteristics of Carbon Fiber Reinforced MMCs. Mater. Sci. Forum 2008, 659, 229–234. [Google Scholar] [CrossRef]
  8. Garcia-Cordovilla, C.; Louis, E.; Narciso, J. Pressure Infiltration of Packed Ceramic Particulates by Liquid Metals. Acta Mater. 1999, 47, 4461–4479. [Google Scholar] [CrossRef]
  9. Braszczyńska-Malik, K.N.; Kamieniak, J. AZ91 Magnesium Matrix Foam Composites with Fly Ash Cenospheres Fabricated by Negative Pressure Infiltration Technique. Mater. Charact. 2017, 128, 209–216. [Google Scholar] [CrossRef]
  10. Castro, G.; Nutt, S.R. Synthesis of Syntactic Steel Foam Using Mechanical Pressure Infiltration. Mater. Sci. Eng. A 2012, 535, 274–280. [Google Scholar] [CrossRef]
  11. Borkowski, L.B.; Liu, K.C.; Chattopadhyay, A. From Ordered to Disordered: The Effect of Microstructure on Composite Mechanical Performance. CMC 2013, 34, 161–193. [Google Scholar]
  12. Composite Production by Pressure Infiltration|Scientific.Net. Available online: https://www.scientific.net/msf.589.137 (accessed on 28 April 2022).
  13. Orbulov, I.N.; Németh, Á.; Dobránszky, J. Composite Production by Pressure Infiltration. Mater. Sci. Forum 2008, 589, 137–142. [Google Scholar] [CrossRef]
  14. Li, X.; Yang, Y.; Cheng, X. Ultrasonic-Assisted Fabrication of Metal Matrix Nanocomposites. J. Mater. Sci. 2004, 39, 3211–3212. [Google Scholar] [CrossRef]
  15. El-Eskandarany, M.S. Mechanical Solid State Mixing for Synthesizing of SiCp/Al Nanocomposites. J. Alloys Compd. 1998, 279, 263–271. [Google Scholar] [CrossRef]
  16. Kumar, A.; Vichare, O.; Debnath, K.; Paswan, M. Fabrication Methods of Metal Matrix Composites (MMCs). Mater. Today Proc. 2021, 46, 6840–6846. [Google Scholar] [CrossRef]
  17. Magabe, R.; Sharma, N.; Gupta, K.; Davim, J.P. Modeling and Optimization of Wire-EDM Parameters for Machining of Ni 55.8 Ti Shape Memory Alloy Using Hybrid Approach of Taguchi and NSGA-II. Int. J. Adv. Manuf. Technol. 2019, 102, 1703–1717. [Google Scholar] [CrossRef]
  18. Bains, P.S.; Sidhu, S.S.; Payal, H.S. Fabrication and Machining of Metal Matrix Composites: A Review. Mater. Manuf. Processes 2016, 31, 553–573. [Google Scholar] [CrossRef]
  19. Torralba, J.D.; Da Costa, C.E.; Velasco, F. P/M Aluminum Matrix Composites: An Overview. J. Mater. Process. Technol. 2003, 133, 203–206. [Google Scholar] [CrossRef]
  20. Rana, R.S.; Purohit, R.; Soni, V.K.; Das, S. Characterization of Mechanical Properties and Microstructure of Aluminium Alloy-SiC Composites. Mater. Today Proc. 2015, 2, 1149–1156. [Google Scholar] [CrossRef]
  21. Prasad, S.V.; Rohatgi, P.K. Tribological Properties of Al Alloy Particle Composites. JOM 1987, 39, 22–26. [Google Scholar] [CrossRef]
  22. Garg, P.; Jamwal, A.; Kumar, D.; Sadasivuni, K.K.; Hussain, C.M.; Gupta, P. Advance Research Progresses in Aluminium Matrix Composites: Manufacturing & Applications. J. Mater. Res. Technol. 2019, 8, 4924–4939. [Google Scholar]
  23. Ramnath, B.V.; Elanchezhian, C.; Annamalai, R.; Aravind, S.; Atreya, T.S.A.; Vignesh, V.; Subramanian, C. Aluminium Metal Matrix Composites—A Review. Rev. Adv. Mater. Sci. 2014, 6, 55–60. [Google Scholar]
  24. Pirkle, F.L.; Podmeyer, D.A. Zircon: Origin and Uses. AIME Trans. 1992, 292, 1–20. [Google Scholar]
  25. Sadasivuni, K.K.; Ponnamma, D.; Ko, H.-U.; Kim, H.C.; Zhai, L.; Kim, J. Flexible NO2 Sensors from Renewable Cellulose Nanocrystals/Iron Oxide Composites. Sens. Actuators B Chem. 2016, 233, 633–638. [Google Scholar] [CrossRef]
  26. El-Kady, O.; Fathy, A. Effect of SiC Particle Size on the Physical and Mechanical Properties of Extruded Al Matrix Nanocomposites. Mater. Des. 2014, 54, 348–353. [Google Scholar] [CrossRef]
  27. Zhou, D.; Qiu, F.; Wang, H.; Jiang, Q. Manufacture of Nano-Sized Particle-Reinforced Metal Matrix Composites: A Review. Acta Metall. Sin. 2014, 27, 798–805. [Google Scholar] [CrossRef] [Green Version]
  28. Pani, B.; Routray, S.R.; Panda, R.R.; Singh, S. A Critical Review on Hybrid Aluminum Metal Matrix Composite. In Proceedings of the Journal of Physics: Conference Series; IOP Publishing: Bristol, UK, 2020; Volume 1706, p. 012195. [Google Scholar]
  29. Totten, G.E.; MacKenzie, D.S. Handbook of Aluminum: Volume 2: Alloy Production and Materials Manufacturing; CRC Press: Boca Raton, FL, USA, 2003. [Google Scholar]
  30. Rahman, M.H.; Al Rashed, H.M. Characterization of Silicon Carbide Reinforced Aluminum Matrix Composites. Procedia Eng. 2014, 90, 103–109. [Google Scholar] [CrossRef] [Green Version]
  31. Abdizadeh, H.; Ashuri, M.; Moghadam, P.T.; Nouribahadory, A.; Baharvandi, H.R. Improvement in Physical and Mechanical Properties of Aluminum/Zircon Composites Fabricated by Powder Metallurgy Method. Mater. Des. 2011, 32, 4417–4423. [Google Scholar] [CrossRef]
  32. Kumar, J.; Singh, D.; Kalsi, N.S.; Sharma, S.; Mia, M.; Singh, J.; Rahman, M.A.; Khan, A.M.; Rao, K.V. Investigation on the Mechanical, Tribological, Morphological and Machinability Behavior of Stir-Casted Al/SiC/Mo Reinforced MMCs. J. Mater. Res. Technol. 2021, 12, 930–946. [Google Scholar] [CrossRef]
  33. Mohanavel, V.; Ravichandran, M. Experimental Investigation on Mechanical Properties of AA7075-AlN Composites. Mater. Test. 2019, 61, 554–558. [Google Scholar] [CrossRef]
  34. Das, S.; Behera, R.; Datta, A.; Majumdar, G.; Oraon, B.; Sutradhar, G. Experimental Investigation on the Effect of Reinforcement Particles on the Forgeability and the Mechanical Properties of Aluminum Metal Matrix Composites. Mater. Sci. Appl. 2010, 1, 310. [Google Scholar] [CrossRef] [Green Version]
  35. Singh, J.; Jawalkar, C.S.; Belokar, R.M. Analysis of Mechanical Properties of AMC Fabricated by Vacuum Stir Casting Process. Silicon 2020, 12, 2433–2443. [Google Scholar] [CrossRef]
  36. Kok, M. Production and Mechanical Properties of Al2O3 Particle-Reinforced 2024 Aluminium Alloy Composites. J. Mater. Process. Technol. 2005, 161, 381–387. [Google Scholar] [CrossRef]
  37. Yılmaz, O.; Buytoz, S. Abrasive Wear of Al2O3-Reinforced Aluminium-Based MMCs. Compos. Sci. Technol. 2001, 61, 2381–2392. [Google Scholar] [CrossRef]
  38. Aslan, A.; Güneş, A.; Salur, E.; Şahin, Ö.S.; Karadağ, H.B.; Akdemir, A. Mechanical Properties and Microstructure of Composites Produced by Recycling Metal Chips. Int. J. Miner. Metall. Mater. 2018, 25, 1070–1079. [Google Scholar] [CrossRef]
  39. On Porosity Formation in Metal Matrix Composites Made with Dual-Scale Fiber Reinforcements Using Pressure Infiltration Process|SpringerLink. Available online: https://link.springer.com/article/10.1007/s11661-015-2792-9 (accessed on 19 May 2022).
  40. Patel, M.; Sahu, S.K.; Singh, M.K. Fabrication and Investigation of Mechanical Properties of SiC Particulate Reinforced AA5052 Metal Matrix Composite. J. Mod. Mater. 2020, 7, 26–36. [Google Scholar] [CrossRef]
  41. Sharma, D.K.; Mahant, D.; Upadhyay, G. Manufacturing of Metal Matrix Composites: A State of Review. Mater. Today Proc. 2020, 26, 506–519. [Google Scholar] [CrossRef]
  42. Nirala, A.; Soren, S.; Kumar, N.; Dwivedi, V.K.; Kaushal, D.R. A Comprehensive Review on Stir Cast Al-SiC Composite. Mater. Today Proc. 2020, 21, 1610–1614. [Google Scholar] [CrossRef]
  43. Kumaraswamy, H.S.; Vishnu, P.; Bharath, V.; Rao, T.K. Microstructure and Mechanical Properties of Sintered Al 2024 Hybrid MMCs. J. Phys. Conf. Ser. 2020, 1455, 012024. [Google Scholar] [CrossRef]
Figure 1. Sample pallets.
Materials 15 04225 g001
Figure 2. EDS spectrum of Al + 5%SiC reinforced composites.
Materials 15 04225 g002
Figure 3. EDS spectrum of Al + 5%ZrSiO4 reinforced composites.
Materials 15 04225 g003
Figure 4. SEM image of Al + 40% SiC sintered at 1100 °C showing agglomeration of particles and porosity.
Materials 15 04225 g004
Figure 5. (a) Regression plot for Al-SiC showing overlapping of actual and predicted hardness values points (yellow dotted line presents actual value of hardness and white line shows predicted values). (b) Matrix plot showing the individual relationship between hardness and input variables for Al-SiC.
Materials 15 04225 g005
Figure 6. (a) Regression plot for Al-ZrSiO4 showing overlapping of actual and predicted hardness values points (yellow dotted line presents actual value of hardness and white line shows predicted values). (b) Matrix plot showing the individual relationship between hardness and input variables for Al-ZrSiO4.
Materials 15 04225 g006
Figure 7. (a) Regression plot for Al-SiC-ZrSiO4 showing overlapping of actual and predicted hardness values points (yellow dotted line presents actual value of hardness and white line shows predicted values). (b) Matrix plot showing the individual relationship between hardness and input variables for Al-SiC-ZrSiO4.
Materials 15 04225 g007
Figure 8. (a) Regression plot for Al-SiC showing overlapping of actual and predicted roughness values points (yellow line presents actual value of hardness and blue line shows predicted values). (b) Matrix plot showing the individual relationship between roughness and input variables for Al-SiC.
Materials 15 04225 g008
Figure 9. (a) Regression plot for Al-ZrSiO4 showing overlapping of actual and predicted roughness values points (yellow line presents actual value of hardness and blue line shows predicted values). (b) Matrix plot showing the individual relationship between roughness and input variables for Al-ZrSiO4.
Materials 15 04225 g009
Figure 10. (a) Regression plot for Al-SiC-ZrSiO4 showing overlapping of actual and predicted roughness values points (yellow line presents actual value of hardness and blue line shows predicted values). (b) Matrix plot showing the individual relationship between roughness and input variables for Al-SiC-ZrSiO4.
Materials 15 04225 g010
Table 1. Designed ratio of wt % of Al-powder and reinforcements in MMCs.
SampleTypeSiC (37–45 µm)
(wt %)
ZrSiO4 (<50 nm)
(wt %)
SiC + ZrSiO4
(wt %)
Al-SiCBinary5--
20--
30--
40--
Al-ZrSiO4Binary-5-
-20-
-30-
-40-
Al-SiC-ZrSiO4Hybrid5405 + 40
203020 + 30
302030 + 20
40540 + 5
Table 2. Sintering temperature and sintering time for the samples.
SampleTypeSampleSiC (37–45 µm) (wt %)ZrSiO4 (<50 nm) (wt %)SiC + ZrSiO4 (wt %)Sintering Temperature (°C)Sintering Time (min)
Al-SiCBinaryS15--50060
S220--70045
S330--90030
S440--110015
Al-ZrSiO4BinaryS5-5-50060
S6-20-70045
S7-30-90030
S8-40-110015
Al-SiC-ZrSiO4HybridS95405 + 4050060
S10203020 + 3070045
S11302030 + 2090030
S1240540 + 5110015
Table 3. Results of hardness and roughness.
SampleTypeSampleMean Hardness (HRA) ± StdRoughness (µm)
Al-SiCBinaryS179.0 ± 3.60.104
S278.0 ± 3.30.099
S375.0 ± 4.10.89
S479.0 ± 3.60.132
Al-ZrSiO4BinaryS578.0 ± 3.30.109
S676.0 ± 4.20.157
S777.0 ± 3.50.227
S877.0 ± 3.50.111
Al-SiC-ZrSiO4HybridS979.0 ± 3.60.039
S1064.0 ± 2.50.354
S1175.0 ± 4.10.105
S1279.0 ± 3.60.204
Table 4. List of elements found in the Al + 5%SiC reinforced composites.
ElementsWeight%Atomic%
Al75.361.7
Si6.85.3
C17.933.0
Table 5. List of elements found in the Al + 5%ZrSiO4 reinforced composites.
ElementsWeight%Atomic%
Al71.761.6
Si2.52.0
C9.819.0
O11.216.3
Zr4.81.2
Publisher’s Note: MDPI stays neutral with regard to jurisdictional claims in published maps and institutional affiliations.

