3.1. GO and GOS Nanohybrids Characterization
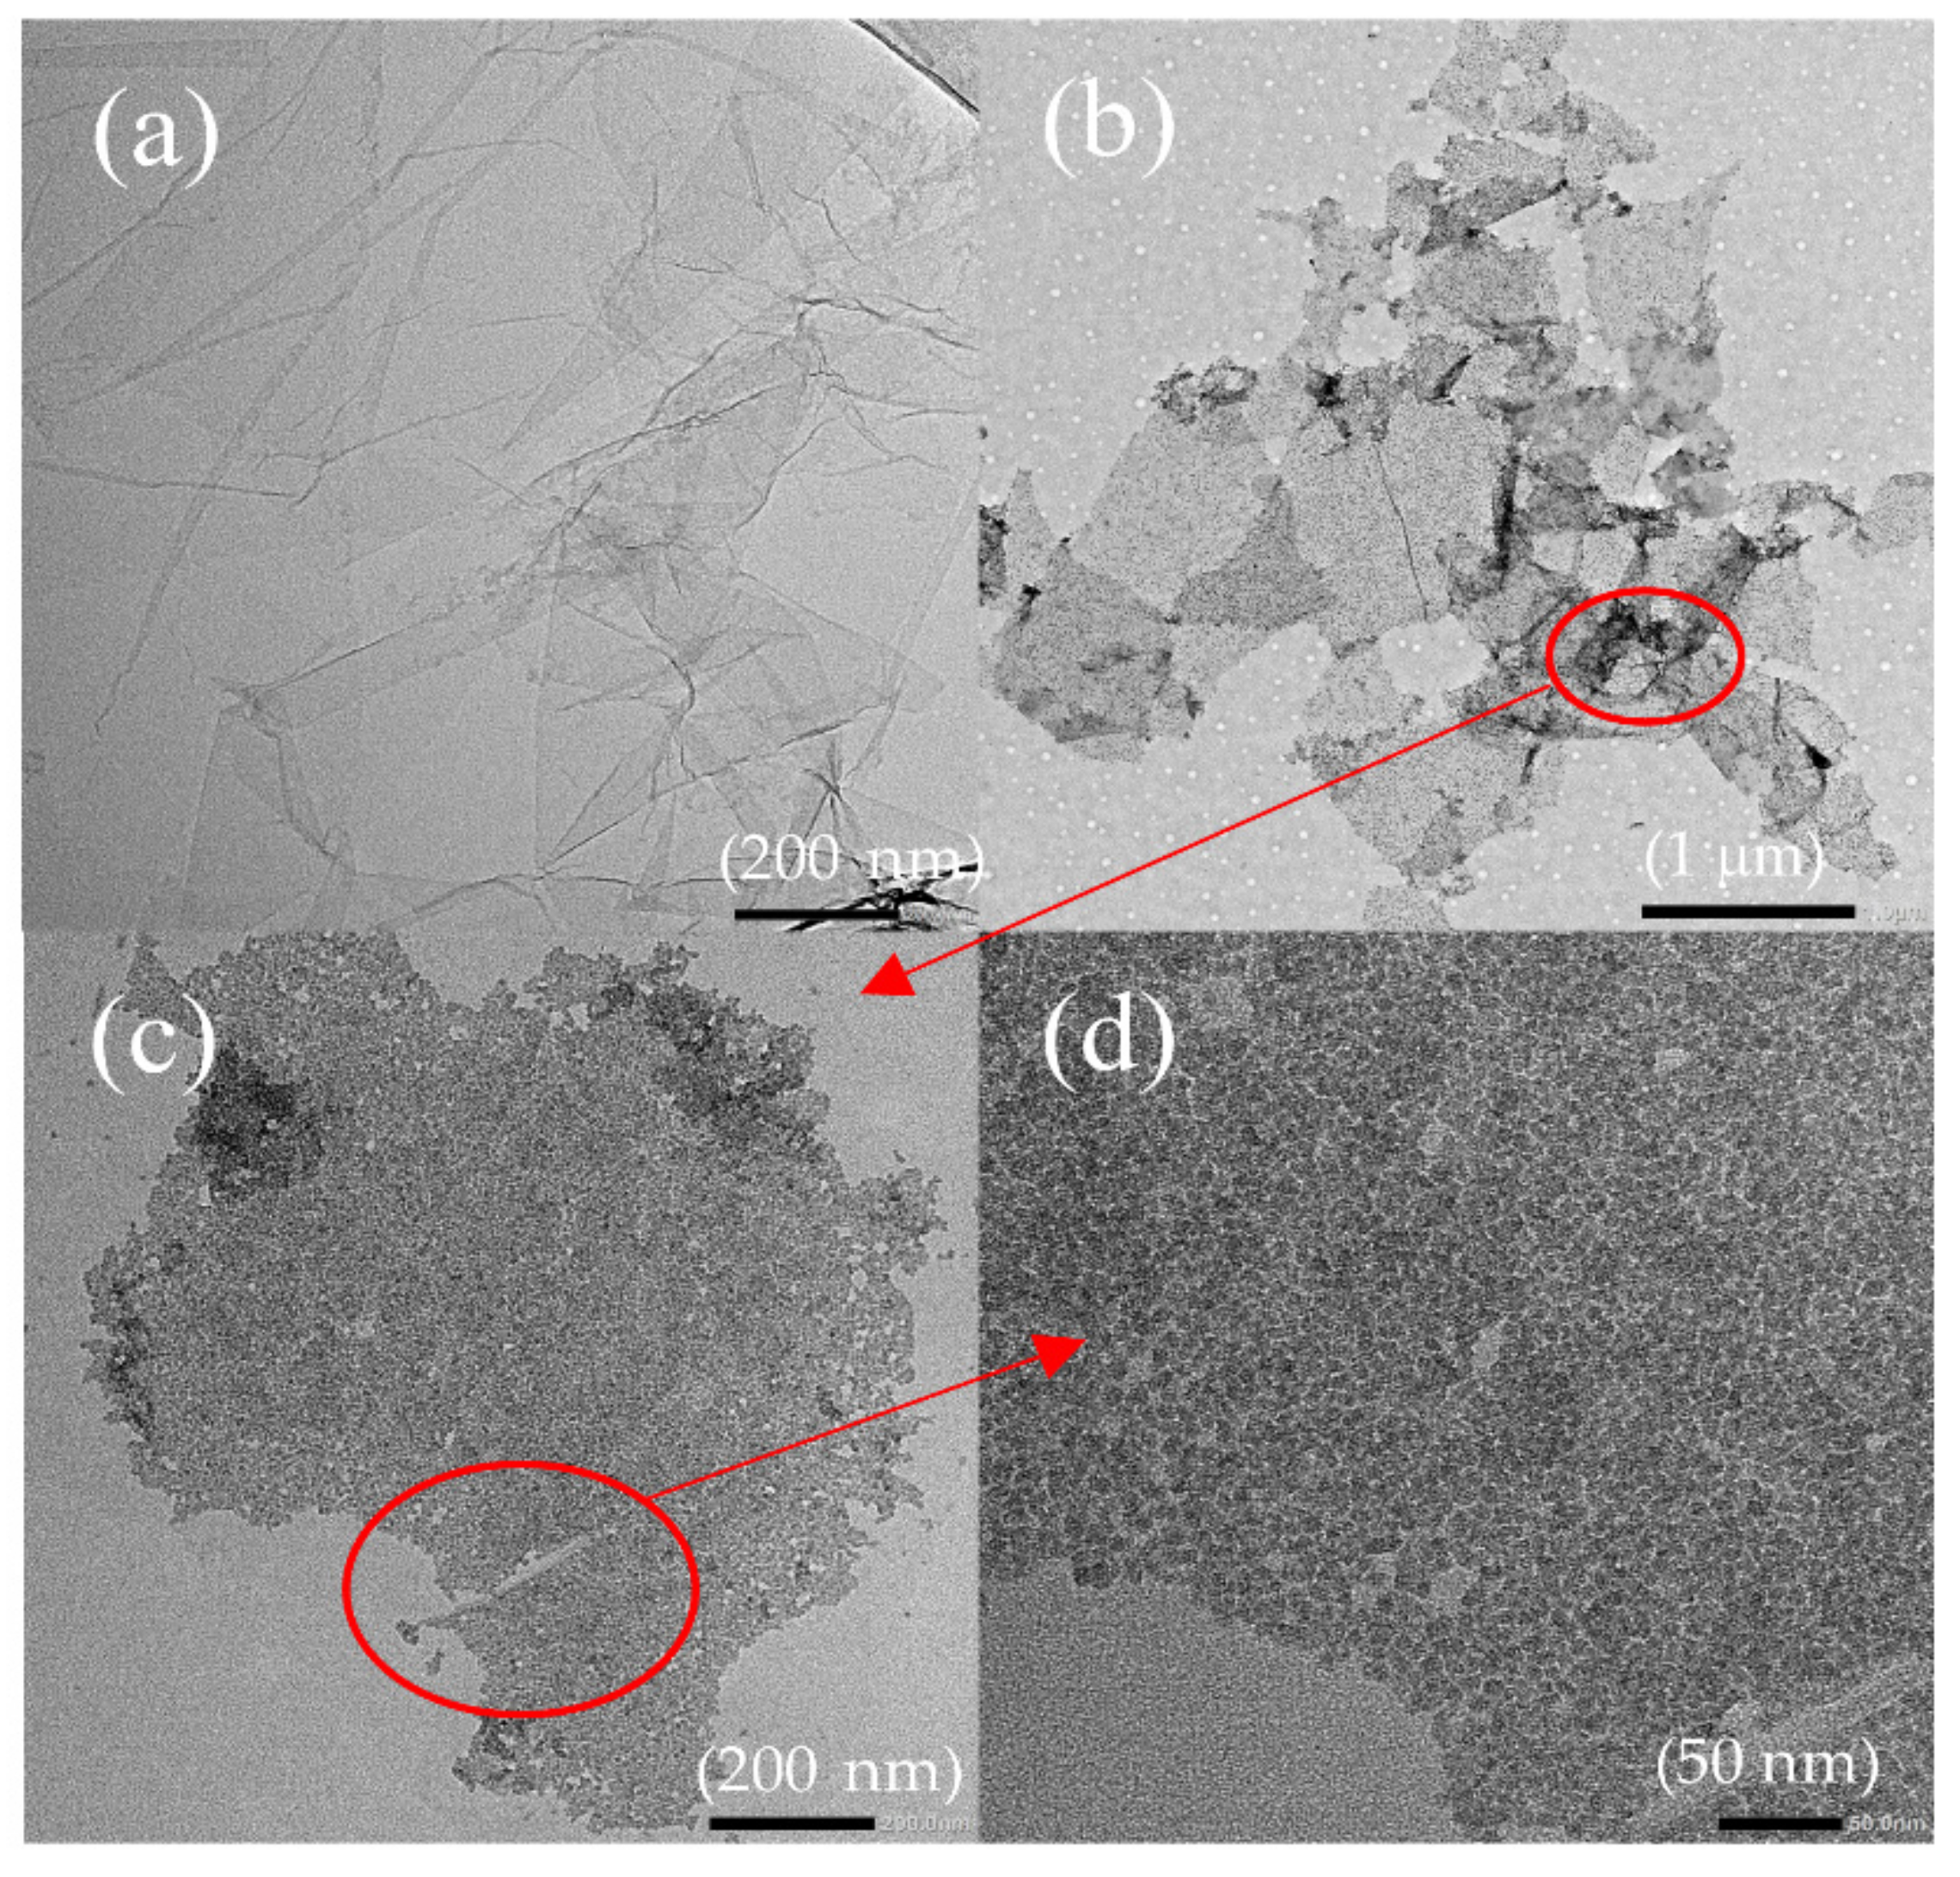
Figure 2a shows the TEM image of GO lamella in the GO aqueous solution of 0.05 mg/mL. It offers a vast plane, and the two-dimension structure of GO makes the visual effect visible. The prepared GO is semitransparent with distinct folds.
Figure 2b displays the TEM image of GOS lamella in the GOS ethanol solution of 0.05 mg/mL.
Figure 2b–d shows the attachment of SiO
2 on GO, where the GO substrate containing fold features is clearly visible in
Figure 2b, and
Figure 2c,d is enlarged images of
Figure 2b. The black dots in
Figure 2c represent silicon dioxide. As can be seen, they are evenly overlapped on the GO lamella. In addition, the sol-gel reaction between the TEOS and the GO shows no impact on the two-dimension structure of GO, which is of great significance to the application of GO in cement-based materials.
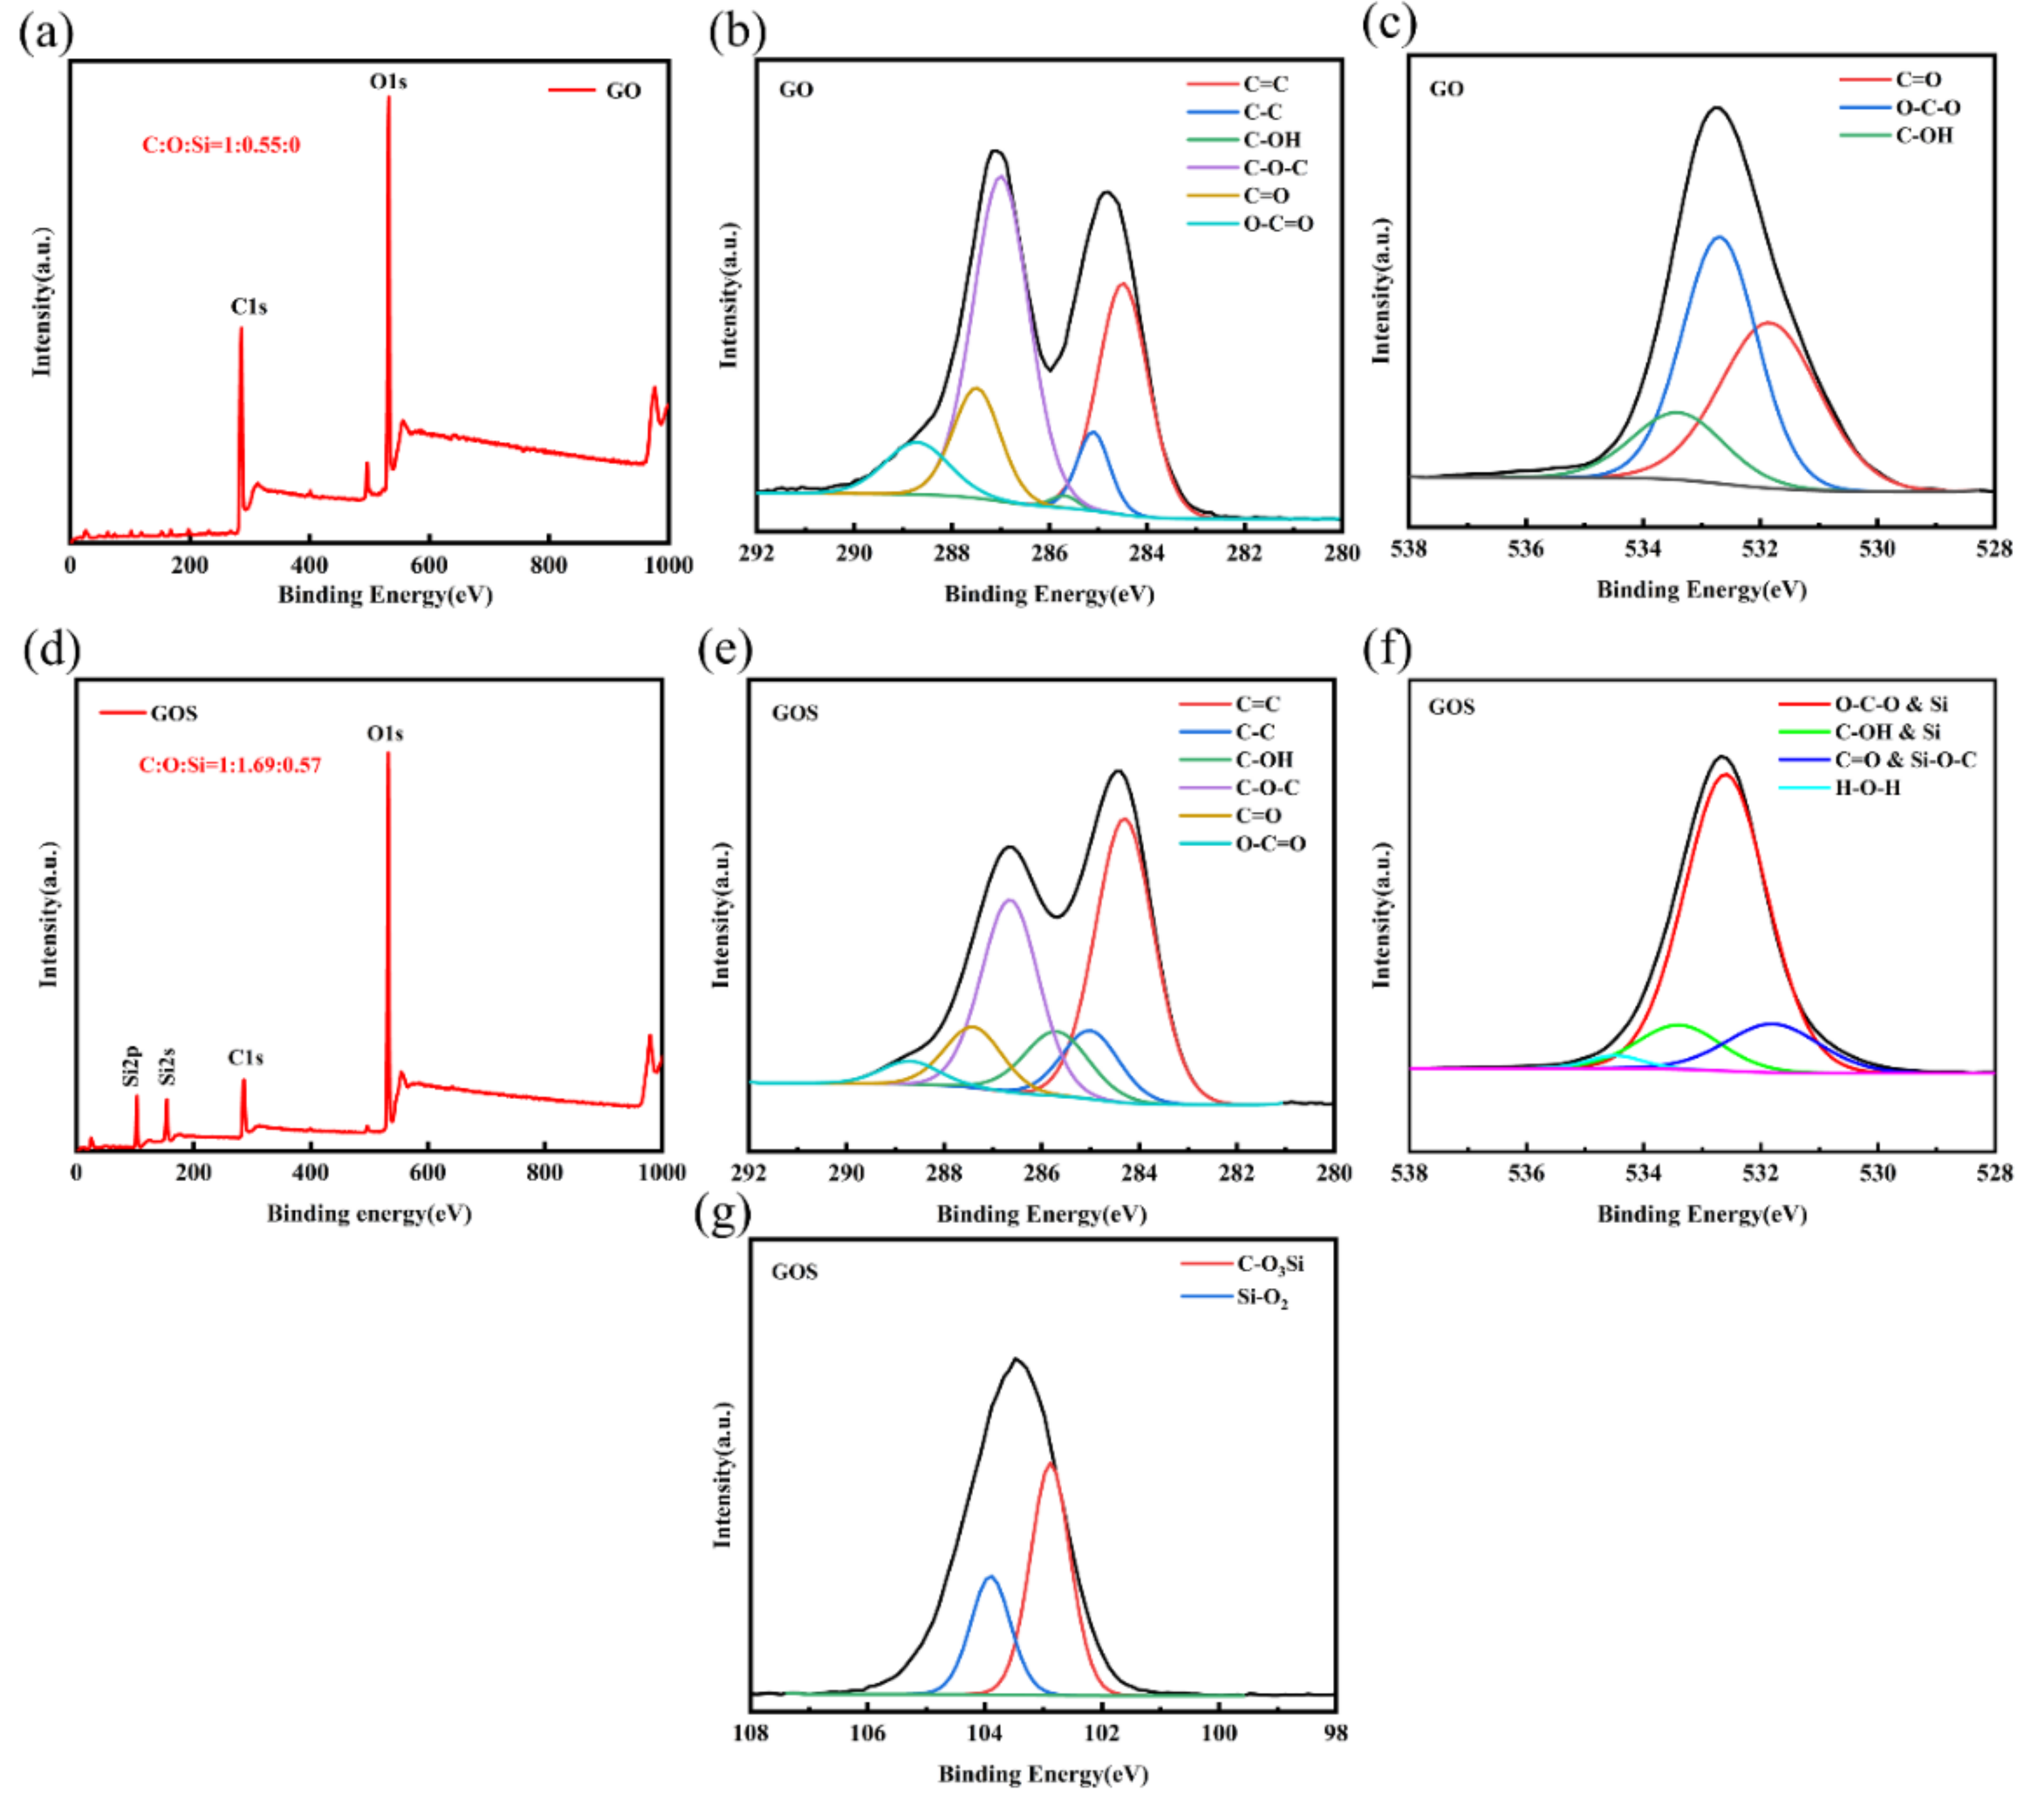
XPS characterization can be used to determine the adhesion of SiO
2 to GO. According to the XPS spectral characteristics in
Figure 3, the C/O ratio of GO is 1.81, which indicates that the oxidation degree of GO is very high. The deconvolution of the C1s and O1s spectra of GO shows that the peaks of the oxygen-containing functional groups 284.1, 285.4, 285.9, 286.5, 287.2, and 288.6 eV correspond to C=C, C-C, hydroxyl (C-OH), epoxy ether (C-O-C), carbonyl(C=O), and carboxylate (O-C=O), respectively. According to
Figure 3d–g, the C/O ratio of GOS is 0.59. This is because the attachment of SiO
2 increases the content of oxygen atoms. The oxygen atom of GO in GOS is subtracted, and its O/Si ratio is 2, which confirms that the attachment on GO is SiO
2. According to
Figure 3f,g, the peaks at about 531.8, 533.4, and 103.9 eV indicate the formation of SiO
2, while the peaks at 531.8 and 102.8 eV are evidence of covalent bond formation between GO and SiO
2. In addition, compared with the C1s peaks of GO and GOS, the intensity of the GOS peak related to the oxygen-containing functional groups on the right side decreases, which proves that the oxygen-containing functional groups on the surfaces of SiO
2 and GO are bonded. Thus the peak strengths of C-OH, C-O-C, C=O, and O-C=O in
Figure 3e are reduced [
24].
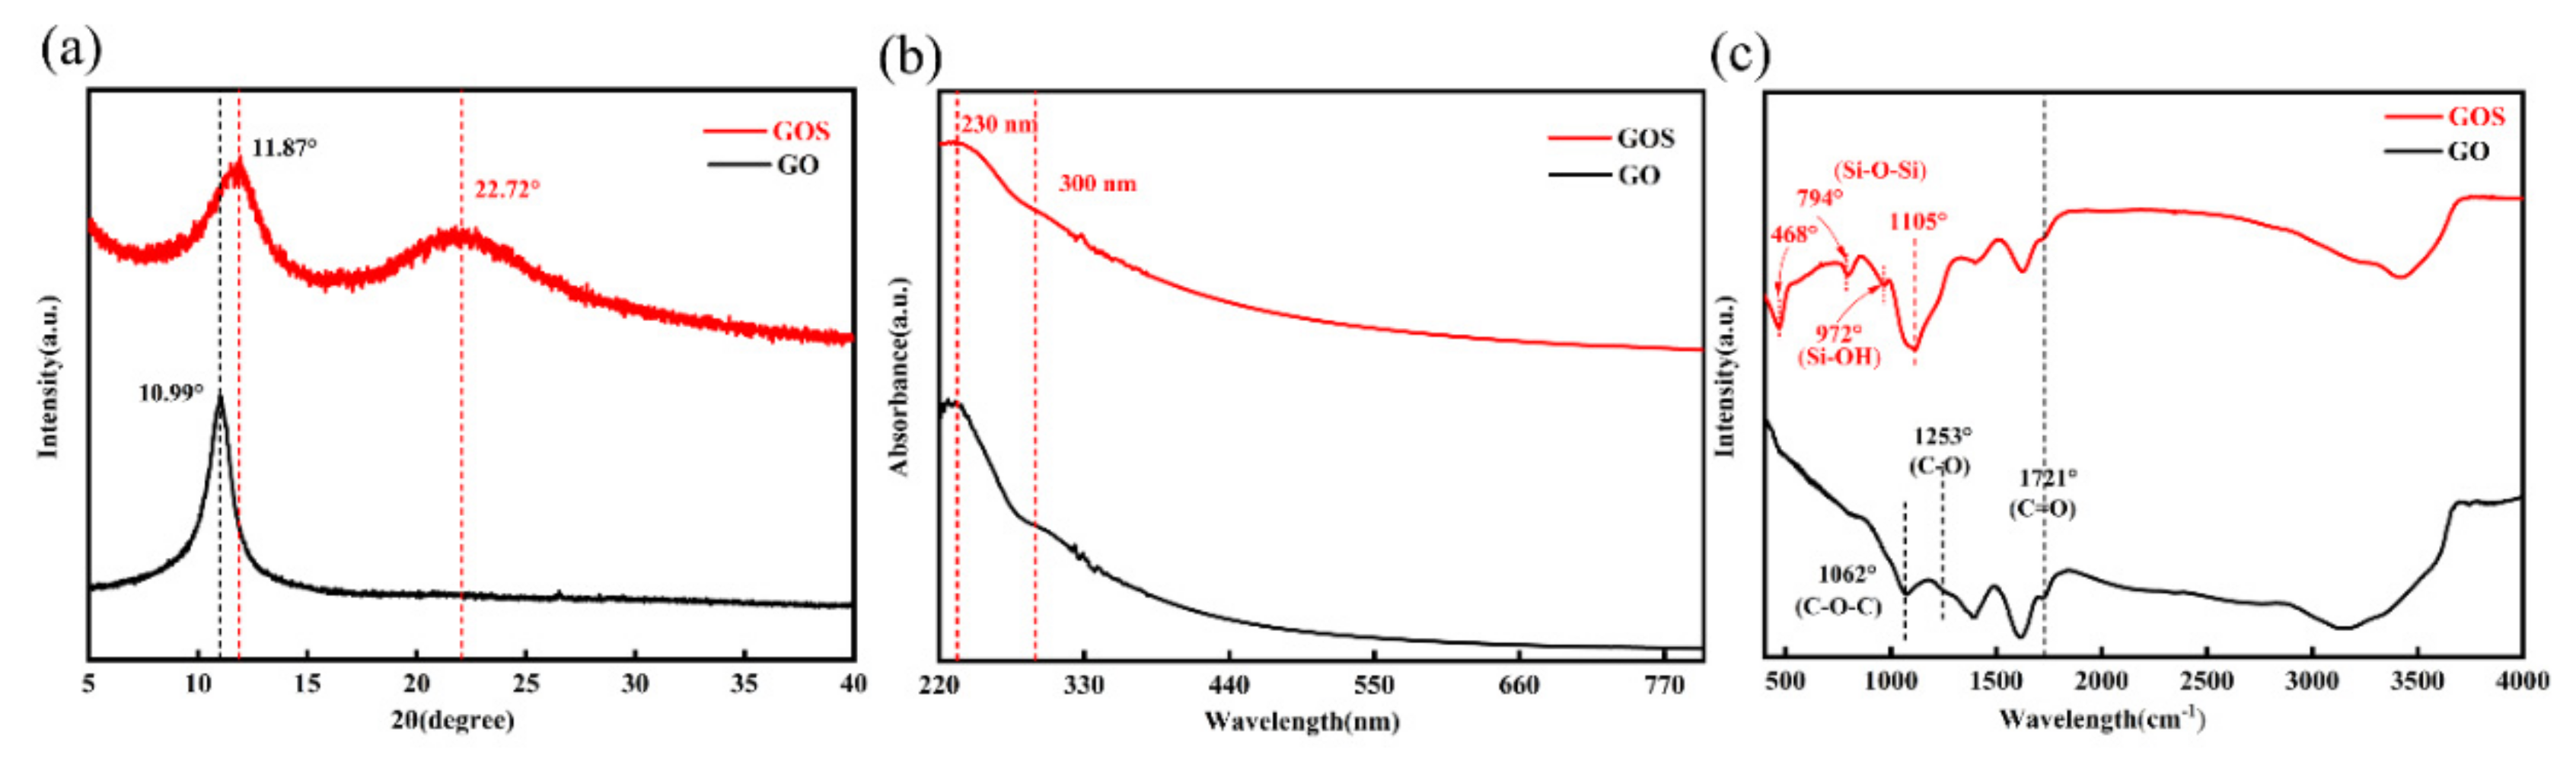
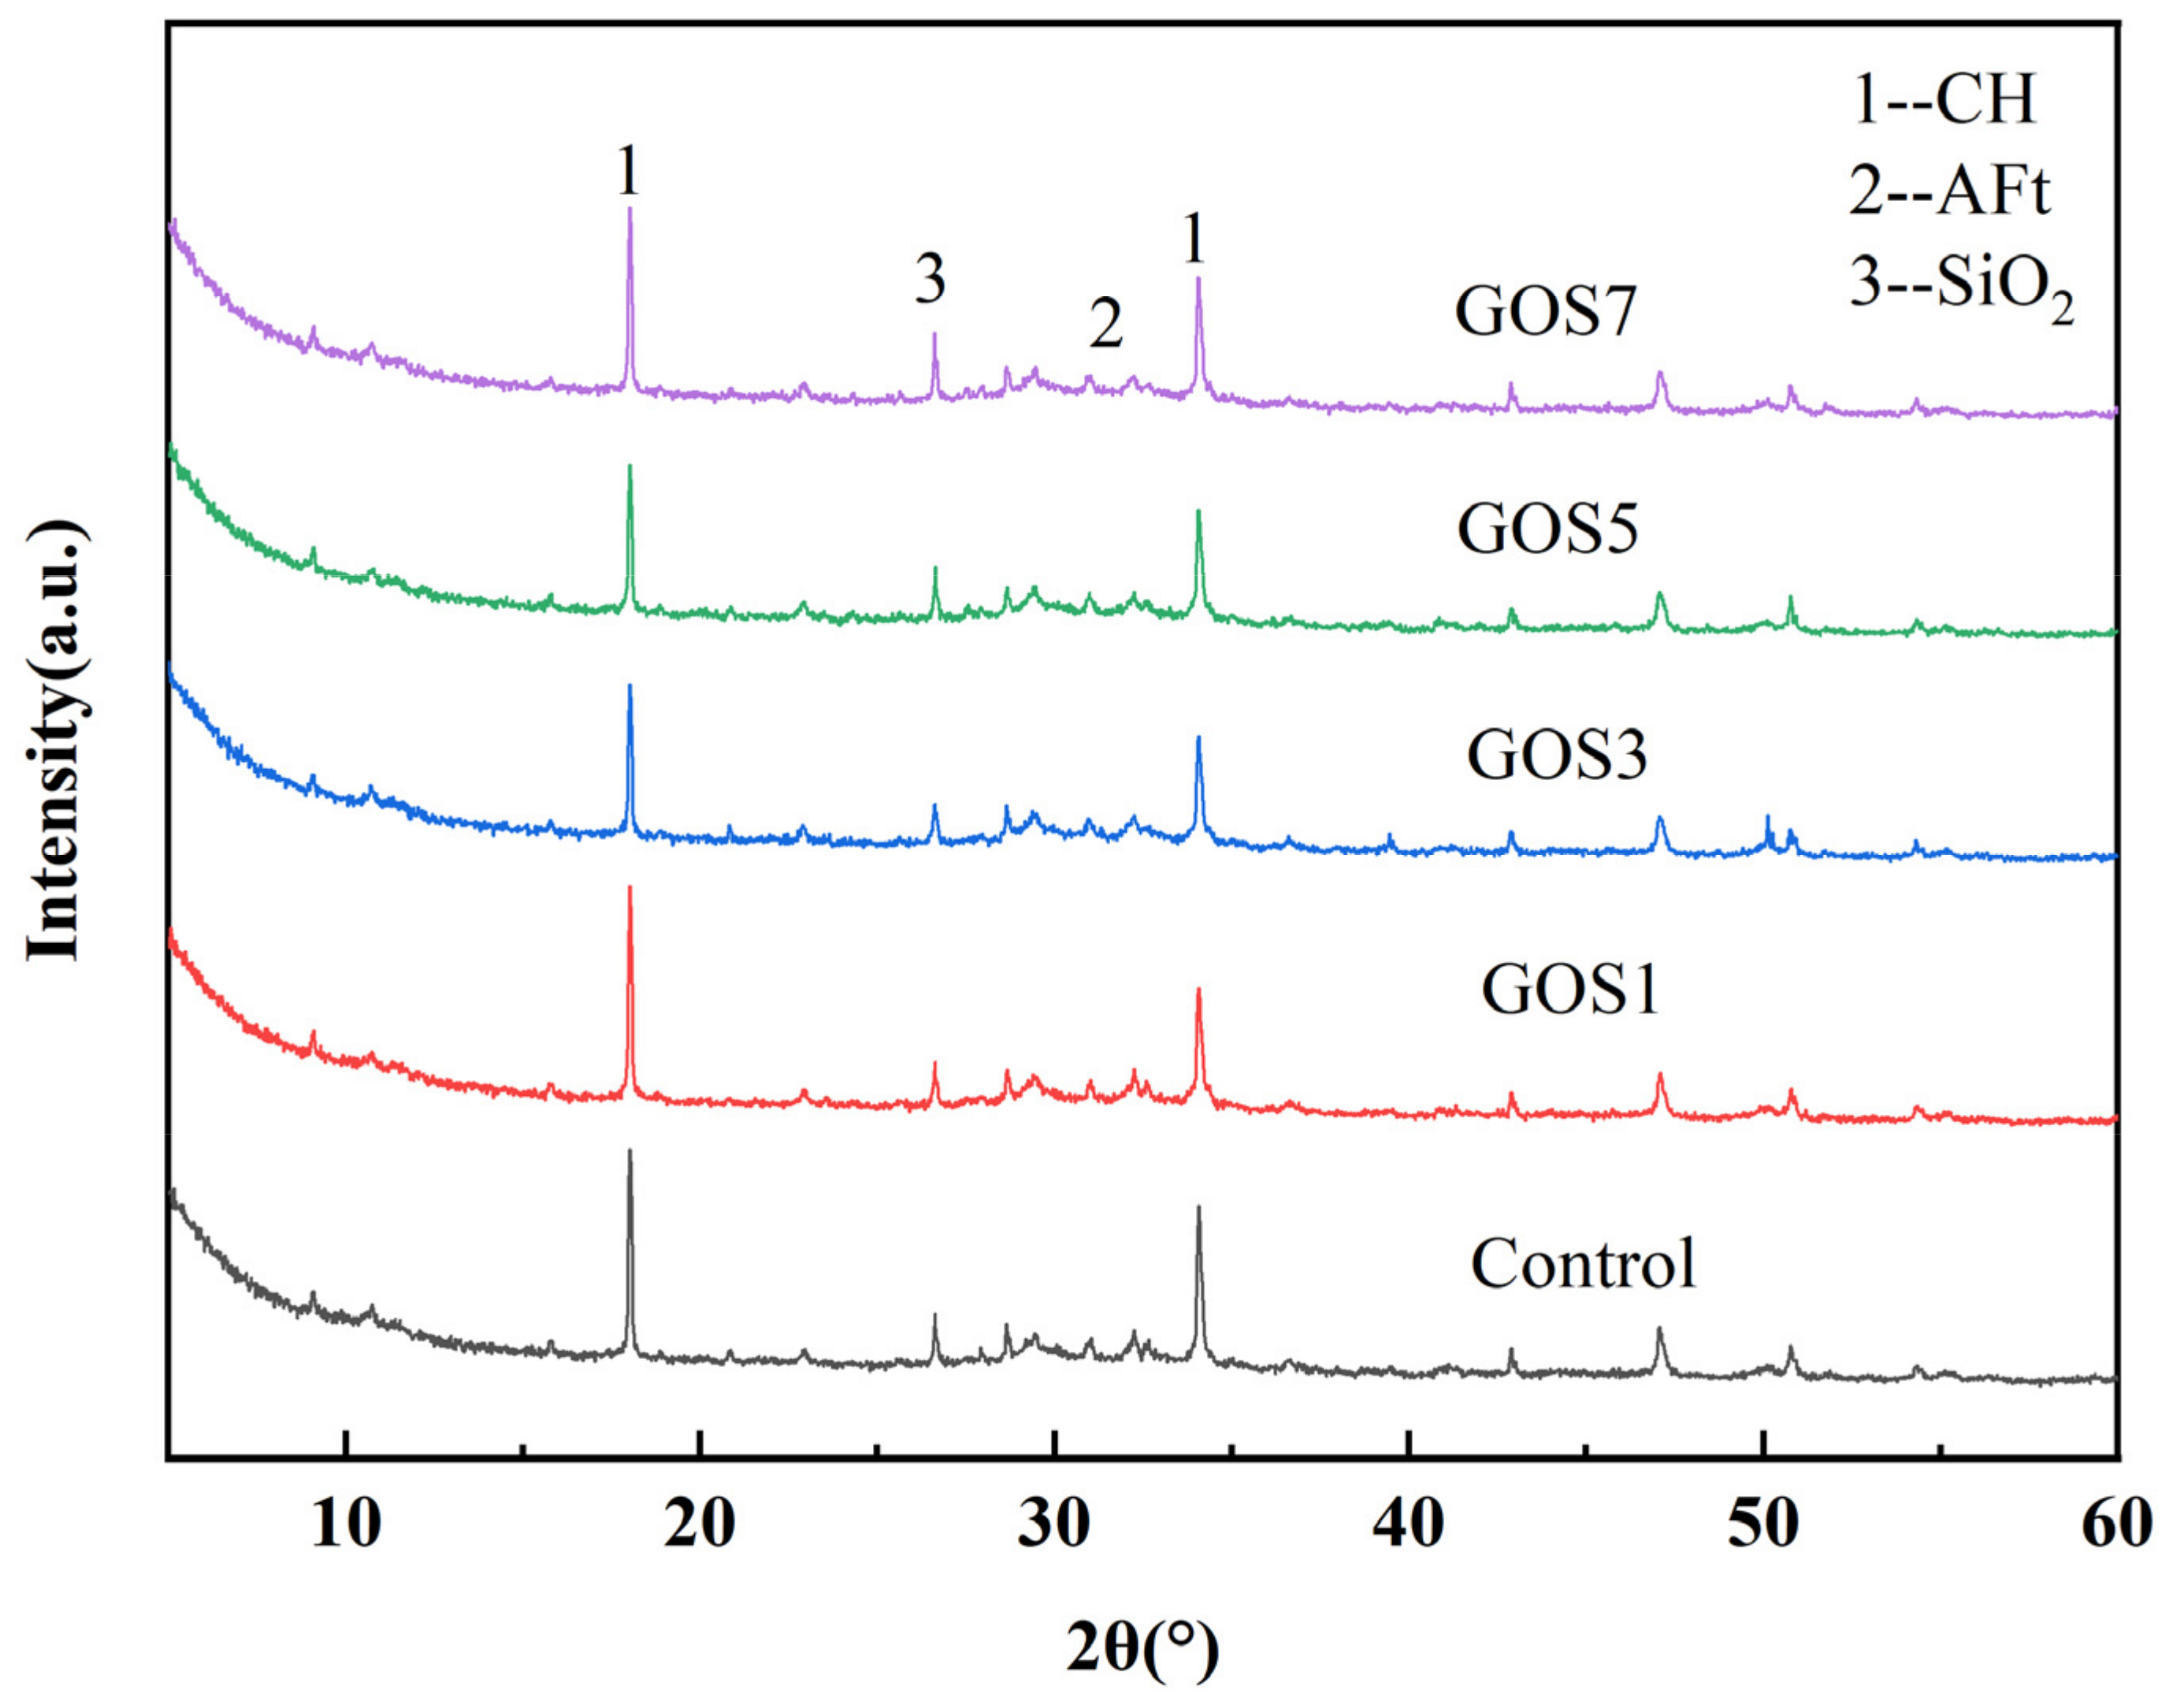
The XRD diffraction diagram of GO and GOS is shown in
Figure 4a. GO has a significant diffraction peak when 2θ is 10.99°, corresponding to the (001) graphite oxide phase, consistent with the literature [
25]. The synthesized interlayer spacing of GO is 0.804 nm, indicating that many oxygen-containing functional groups have been inserted into the interlayer of graphite with severe oxidization. In the XRD diffraction diagram of GOS, the angle of the characteristic diffraction peak for GO has shifted from 10.99° to 11.89°. This shift is because the dehydrating condensation of the hydroxyl and carboxyl groups on the TEOS with GO prevented GOS from re-stacking. Furthermore, due to a load of amorphous silica particles, a wide peak appeared when 2θ = 22.72° for the GOS image in
Figure 3c.
Figure 4b shows the ultraviolet and near-infrared absorbance curves for the GO with 0.05 mg/mL concentration and the GOS aqueous solution. As the figure shows, GO shows a typical UV-Vis characteristic curve. There are two characteristic peaks in the ultraviolet area (wavelength less than 400 mm): the peak at 230 nm and the shoulder peak at 300 nm, respectively corresponding to the π-π* transition and
n-π* transition C-C bone [
13,
26]. The UV-Vis spectra of GOS were similar to those of GO, the same as the results of XRD characterization; due to a load of silicon dioxide, the regular stacking of GO was compromised, thus reducing the intensity of the characteristic peak of the graphite oxide phase for GOS.
The infrared spectrogram of GO in
Figure 4c displays the characteristic peak that appeared at 1721 cm
−1, 1253 cm
−1, and 1062 cm
−1 for the GO prepared in the experiment. It proves that C=O, C-O, and C-O-C functional groups were successfully inserted into the GO lamella through oxidization [
25,
27,
28]. A wider and stronger absorption band appeared within 3600–3100 cm
−1, related to the stretching vibrations of the hydroxyl and water molecules in the GO [
29]. The existence of oxygen-containing functional groups made the water molecules enter the interlayer or bond with the oxygen-containing group at the edge in the form of hydrogen bonds, allowing the GO to be more hydrophilic; that is, the GO has better dispersity in water [
30]. GOS had more new absorption peaks (
Figure 4c). Strong peaks appeared in the vicinity of 1105 cm
−1 and 794 cm
−1 related to the asymmetric and symmetric oscillations of Si-O-Si. Furthermore, due to Si-OH stretching, a peak appeared near around 972 cm
−1, indicating that GO successfully loaded silica dioxide [
18,
31]. The above results demonstrate the successful synthesis of GO and GOS. In addition, despite the compromise of the characteristic structure of GO after the thin layer of SiO
2 was loaded, its structure is unspoiled. Thus, it still has potential for applications of two-dimension nanomaterial.
3.2. The Dispersed States of GO and GOS in Cement Environment
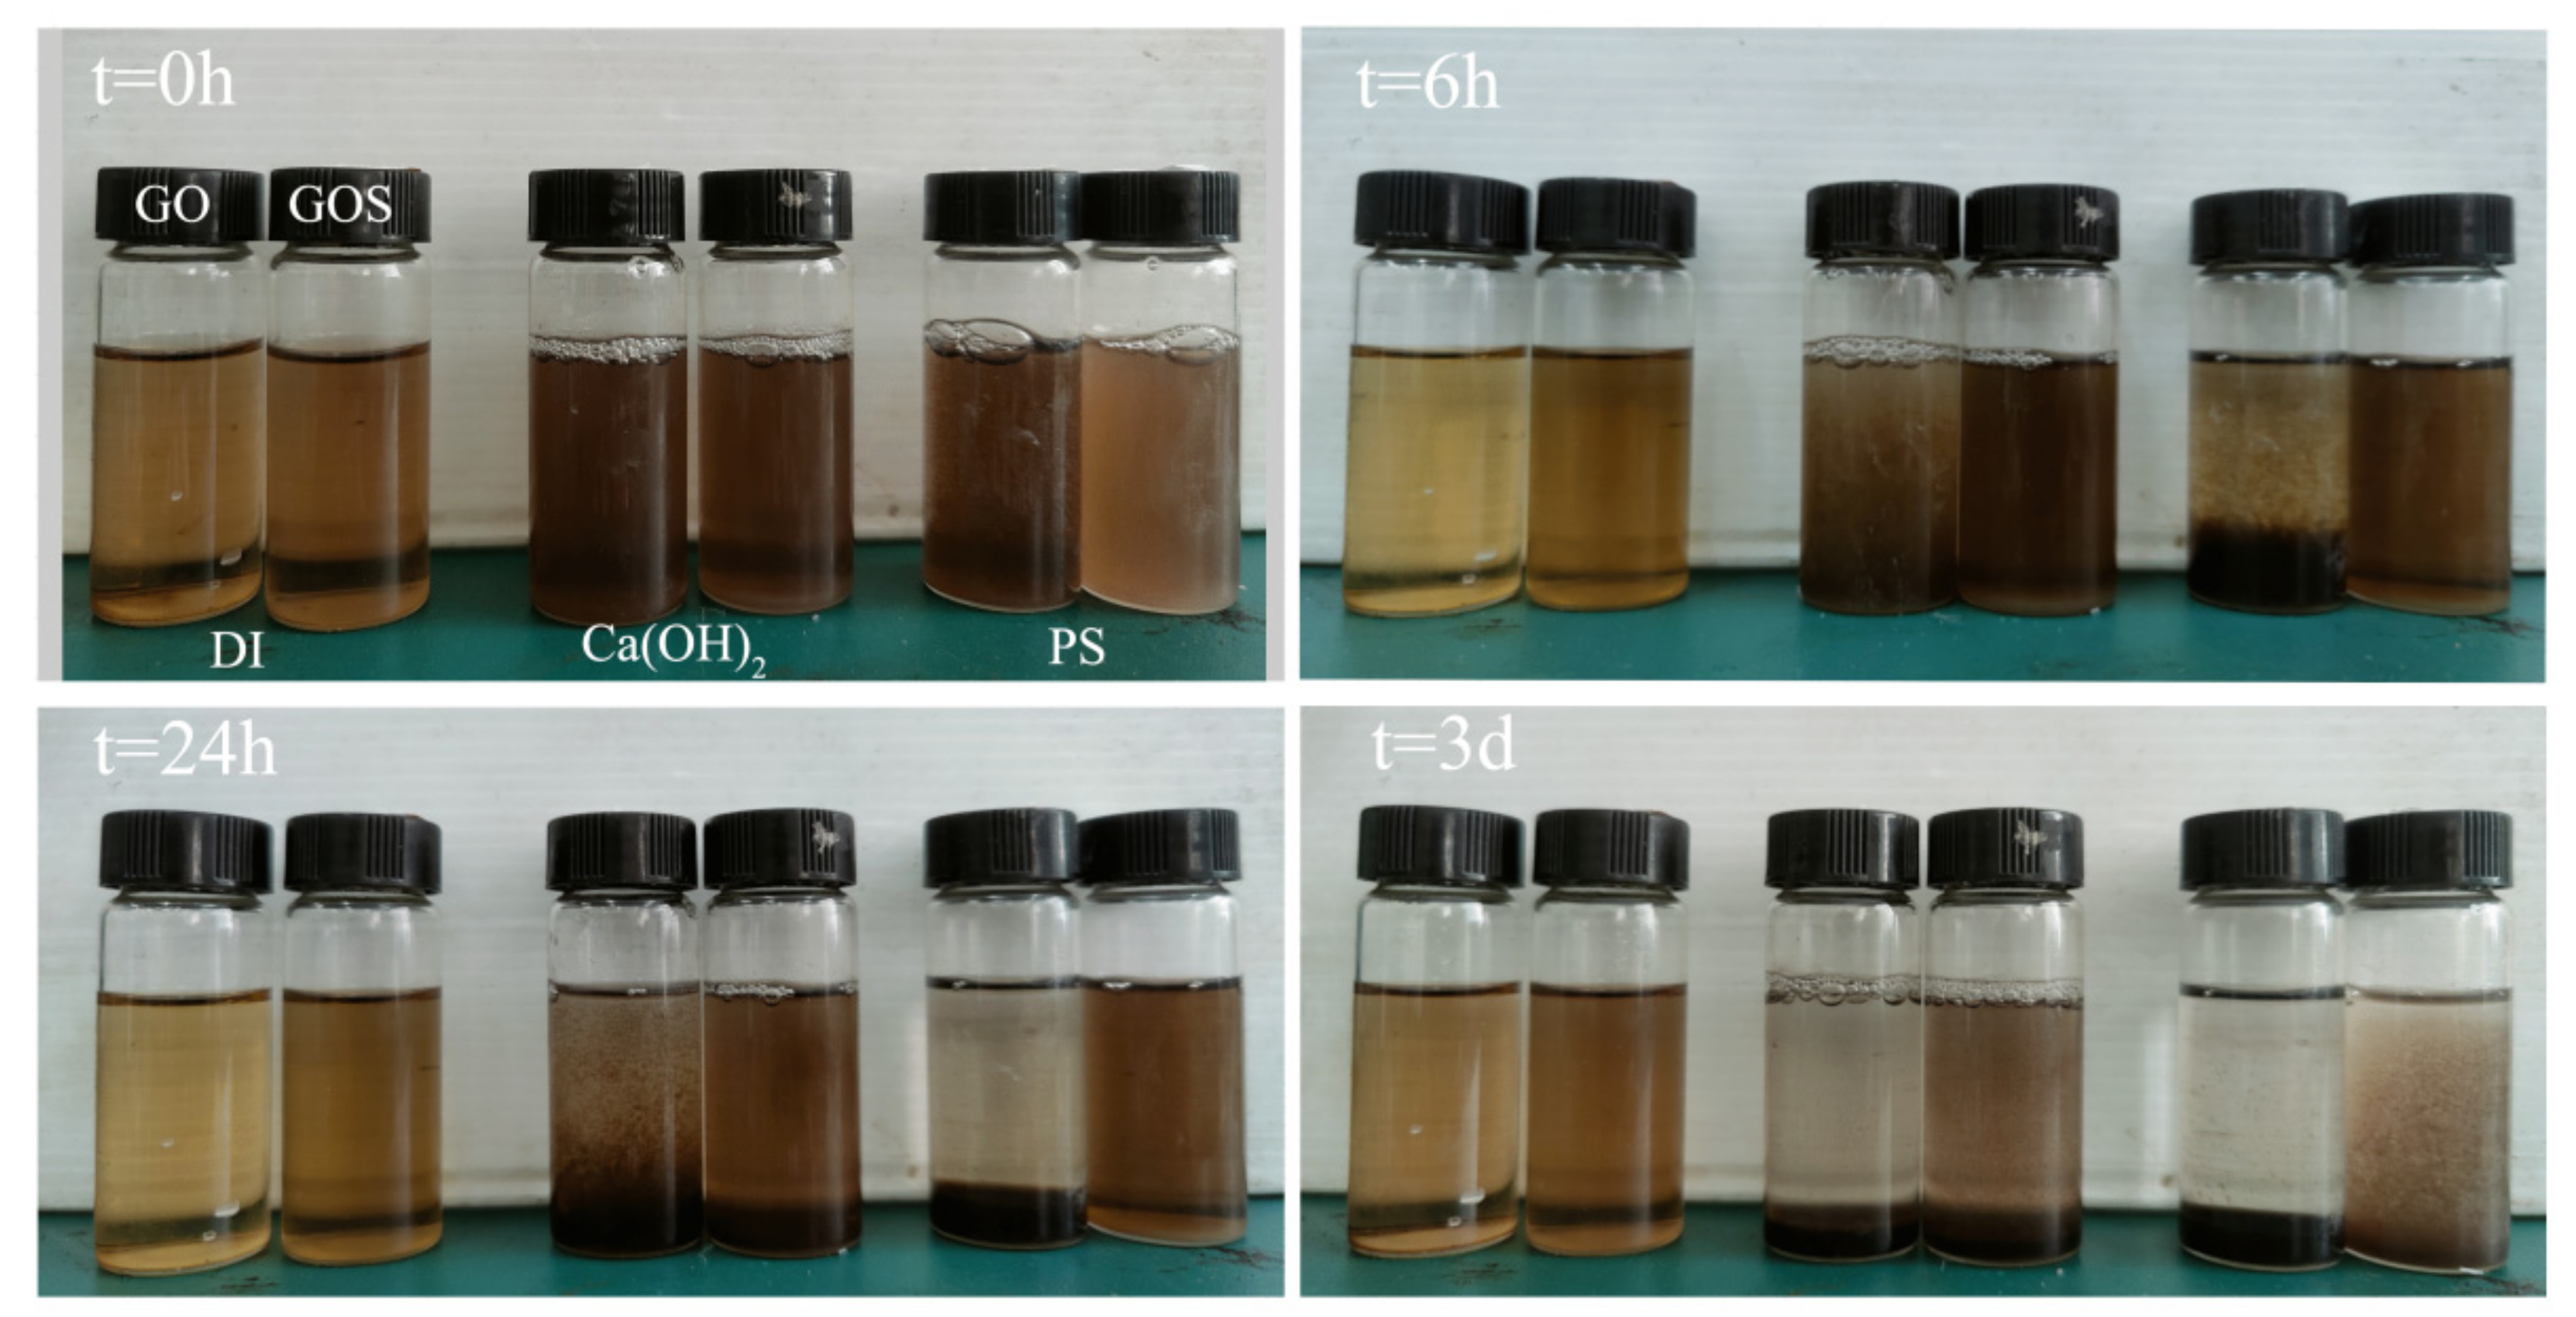
The dispersed states of GO and GOS in aqueous solution, saturated calcium hydroxide solution, and simulated pore solution underwent macro-observation; the dispersed states are shown in
Figure 5. In an aqueous solution, GO and GOS showed better dispersion, and no coagulation occurred after three days; however, GO showed a certain coagulation after being soaked in saturated calcium hydroxide solution containing large amounts of calcium ions and hydroxide ions for 6 h, and a certain degree of stratification was seen at 24 h; after 3 d, it was fully stratified. In terms of GOS, after being soaked in calcium hydroxide saturated solution for 6 h, 24 h, and 3 d, it showed better dispersal than GO. Compared with the dispersed states of GO and GOS in simulated pore solution at different stages, GO stratified before 24 h, and the liquid supernatant became transparent after 3 d. In contrast, distinct coagulation can only be seen after 3 d for GOS.
According to the above test results, GOS has better dispersity in the saturated calcium hydroxide solution and simulated pore solution than GO. Lin et al. [
18] attributed the better dispersity to the protection of SiO
2 on the surface of GO from being crosslinked by divalent calcium ions for the carboxyl on its surface. Furthermore, the SiO
2 on the surface of GO can undermine the Van der Waals forces of the GO interlamellar layer for its obstructing function, preventing the GOS interlamellar layer from agglomerating due to the inter-attraction of the Van der Waals forces. Comparing the dispersed states of GO and GOS in the saturated calcium hydroxide solution and simulated pore solution revealed that both show better dispersity in the former solution, related to the complicated electrolytes and high alkalinity in the simulated pore solution. According to the study by Zhao et al. [
32], the interaction between the complex electrolytes and the PC of the cement pastes enabled the peeling off of the PC attached to the GO and exposed the GO to the environment of Ca
2+, accelerating the agglomeration of the GO. Through different agglomerations of GO with varying values of pH, Samuel et al. [
26] revealed that when such value exceeds 13, the reducing action of GO by sodium and potassium ions and a high alkaline environment will lead to the rapid agglomeration of GO.
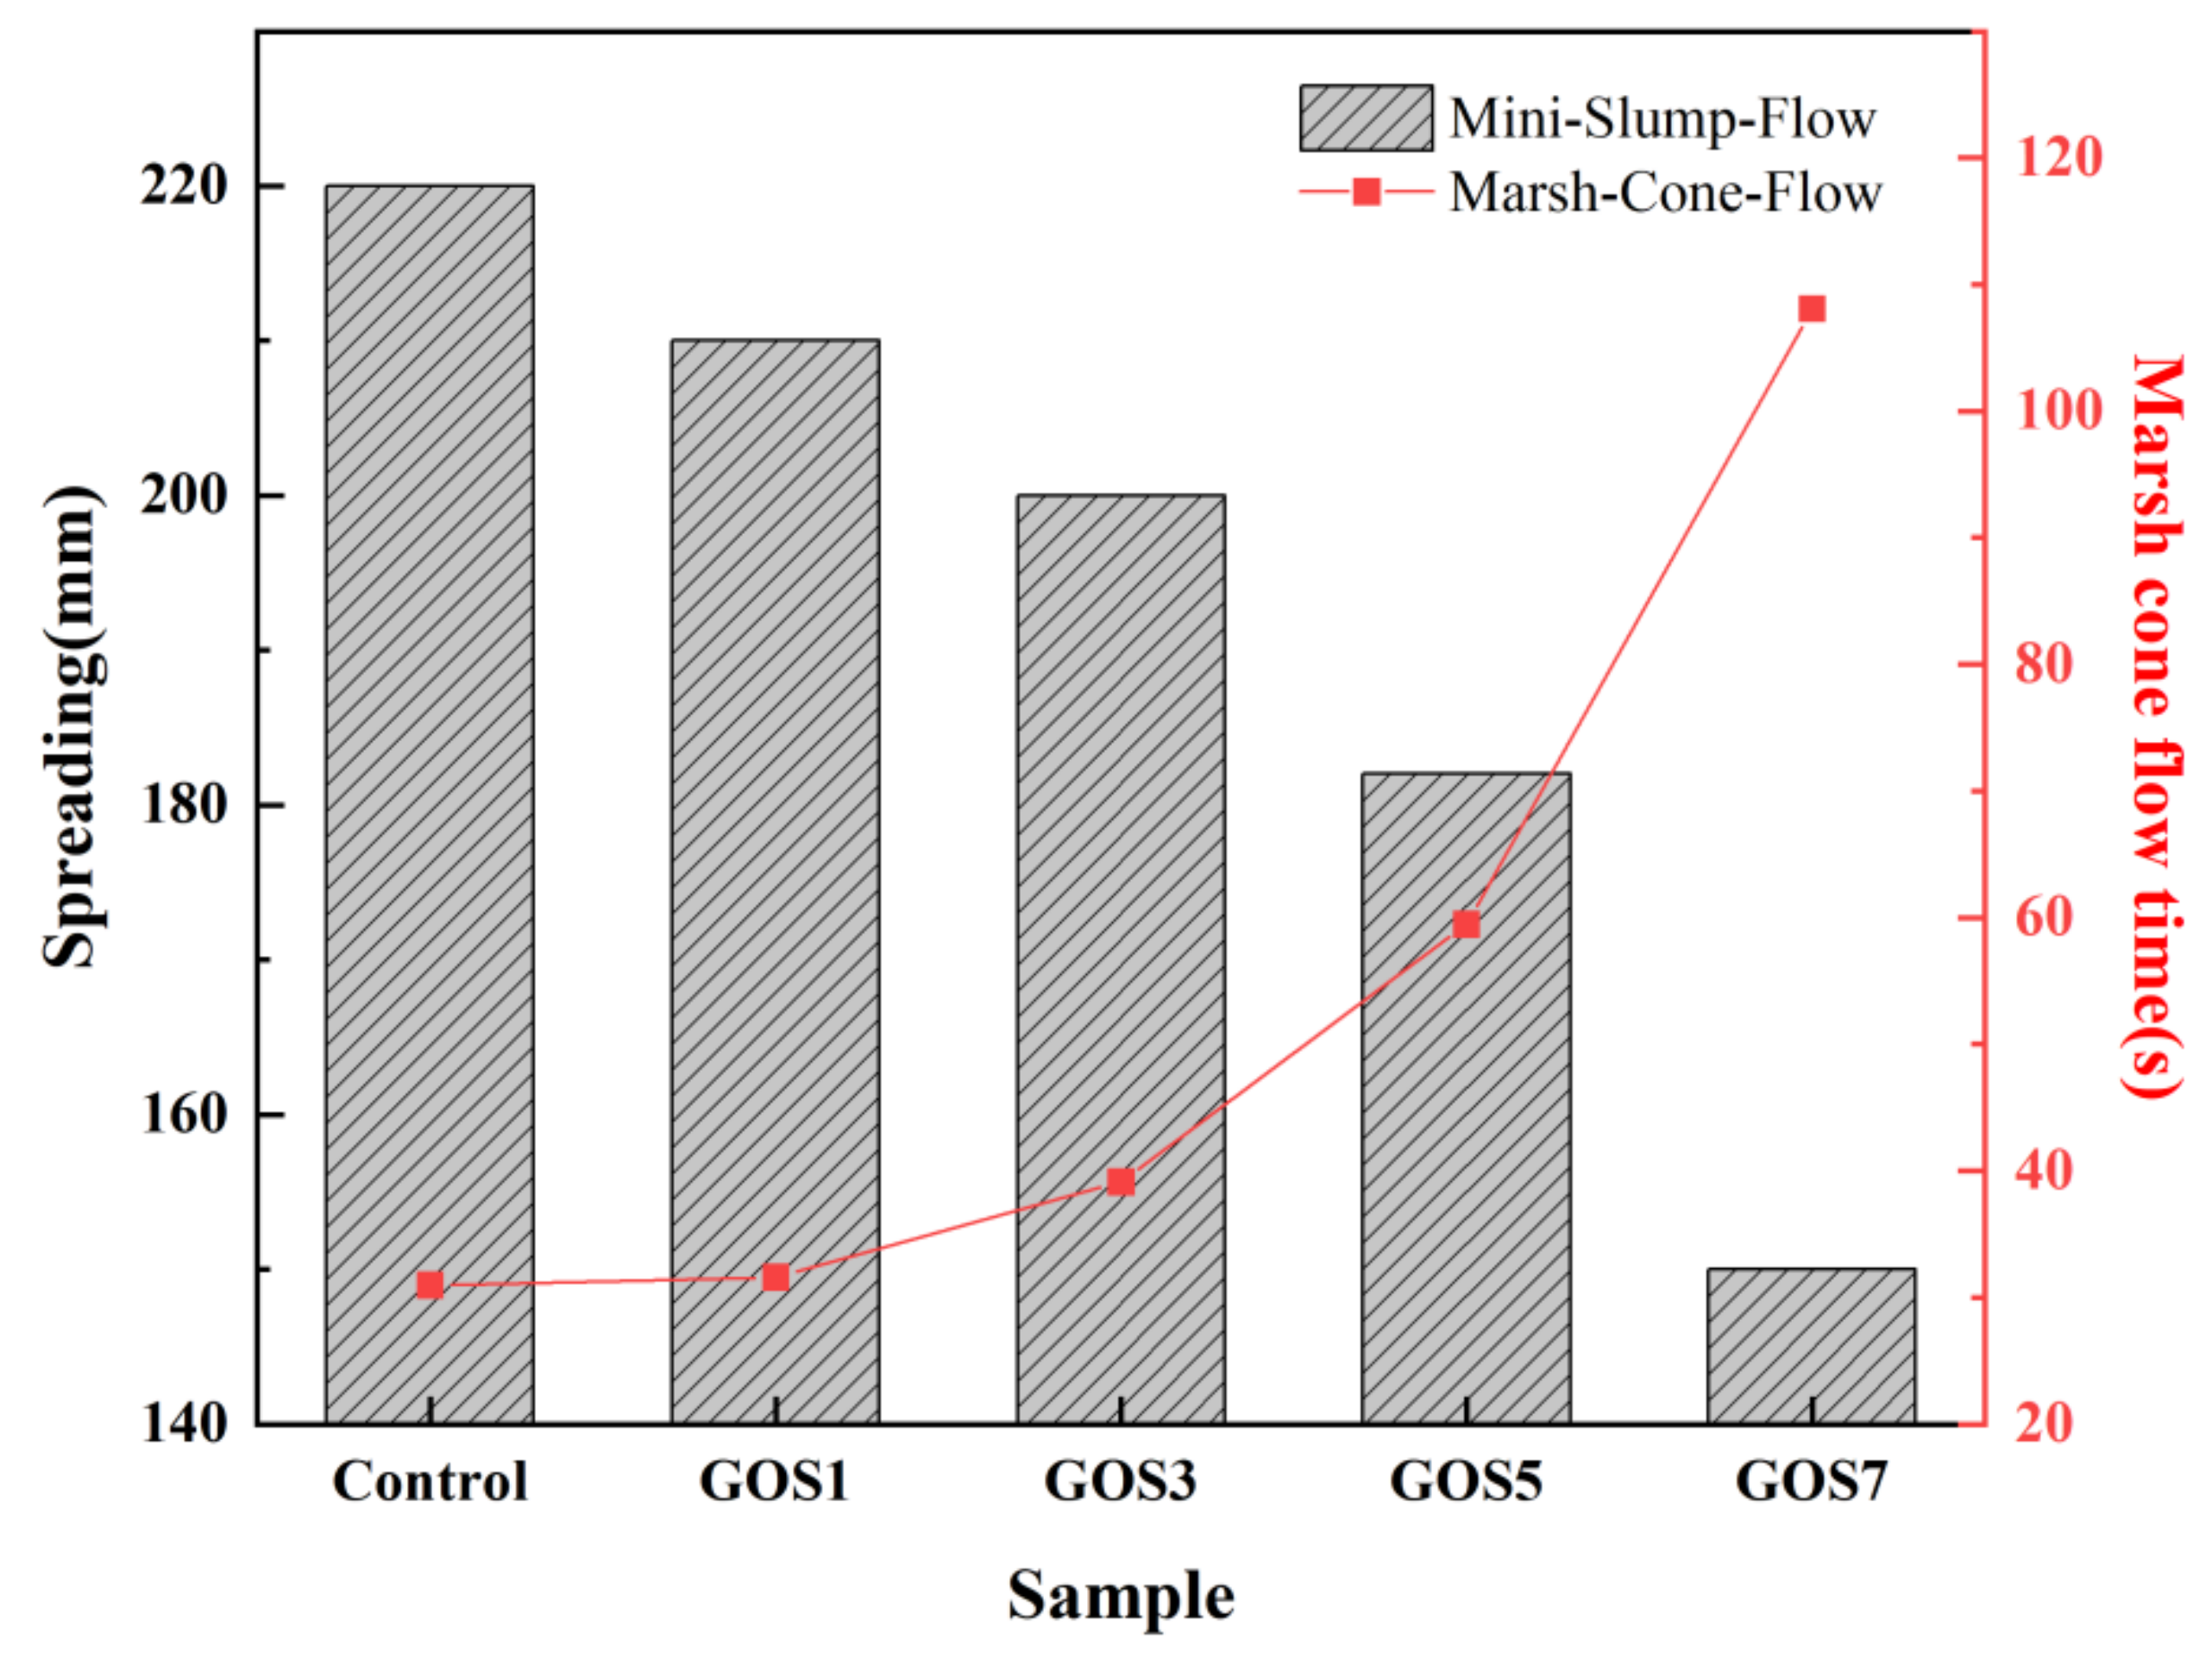
3.3. The Spreading and Marsh Cone Flow Time with Different Concentrations of GOS
The addition of nanomaterials to cement-based materials can significantly impact the fluidity of cement pastes. Two simple test methods, spreading and Marsh cone flow time, were adopted to test the fluidity of cement neat pastes in the experiment to explore this phenomenon.
Figure 6 shows the spreading and Marsh cone flow time for the reference sample and the samples with different mixing quantities of GOS.
With the increase of GOS, the spreading of cement pastes gradually decreased; however, the Marsh cone flow time gradually increased, which is consistent with the literature [
33,
34]. When the GOS increased from 0 to 0.07%, the spreading reduced from 220 mm to 150 mm, a decrease of 31.82%. Marsh cone flow time increased by 249.25%, from 30.95 s to 108.09 s; when GOS was increased from 0% to 0.01%, the spreading decreased by 4.54%, while the Marsh cone flow time increased by 2.1%; when it was increased from 0.01% to 0.03%, the former parameter decreased by 4.76% and the latter parameter increased by 23.9%; when it was increased from 0.03% to 0.05%, the former parameter decreased by 9% and the latter bound water parameter increased by 51.97%; when it was increased from 0.05% to 0.07%, the former parameter decreased by 17.58% and the latter parameter raised by 81.7%. In general, with the increase of GOS, the magnitude of spreading gradually grew more extensive, as did the Marsh cone flow time. This tendency may be caused by more water required for the surface moisture due to the increase in the GOS with its high specific surface area. Moreover, the incomplete coverage of SiO
2 on GO may cause the GOS to be absorbed into the cement particles through the electrostatic interaction. The Van der Waals force between GOS makes the distance between cement particles closer, thus increasing the force of friction between and lowering the fluid performance of the cement pastes [
8,
35].
3.4. The Impacts on the Rheological Properties of Cement Pastes of Different Concentrations of GOS
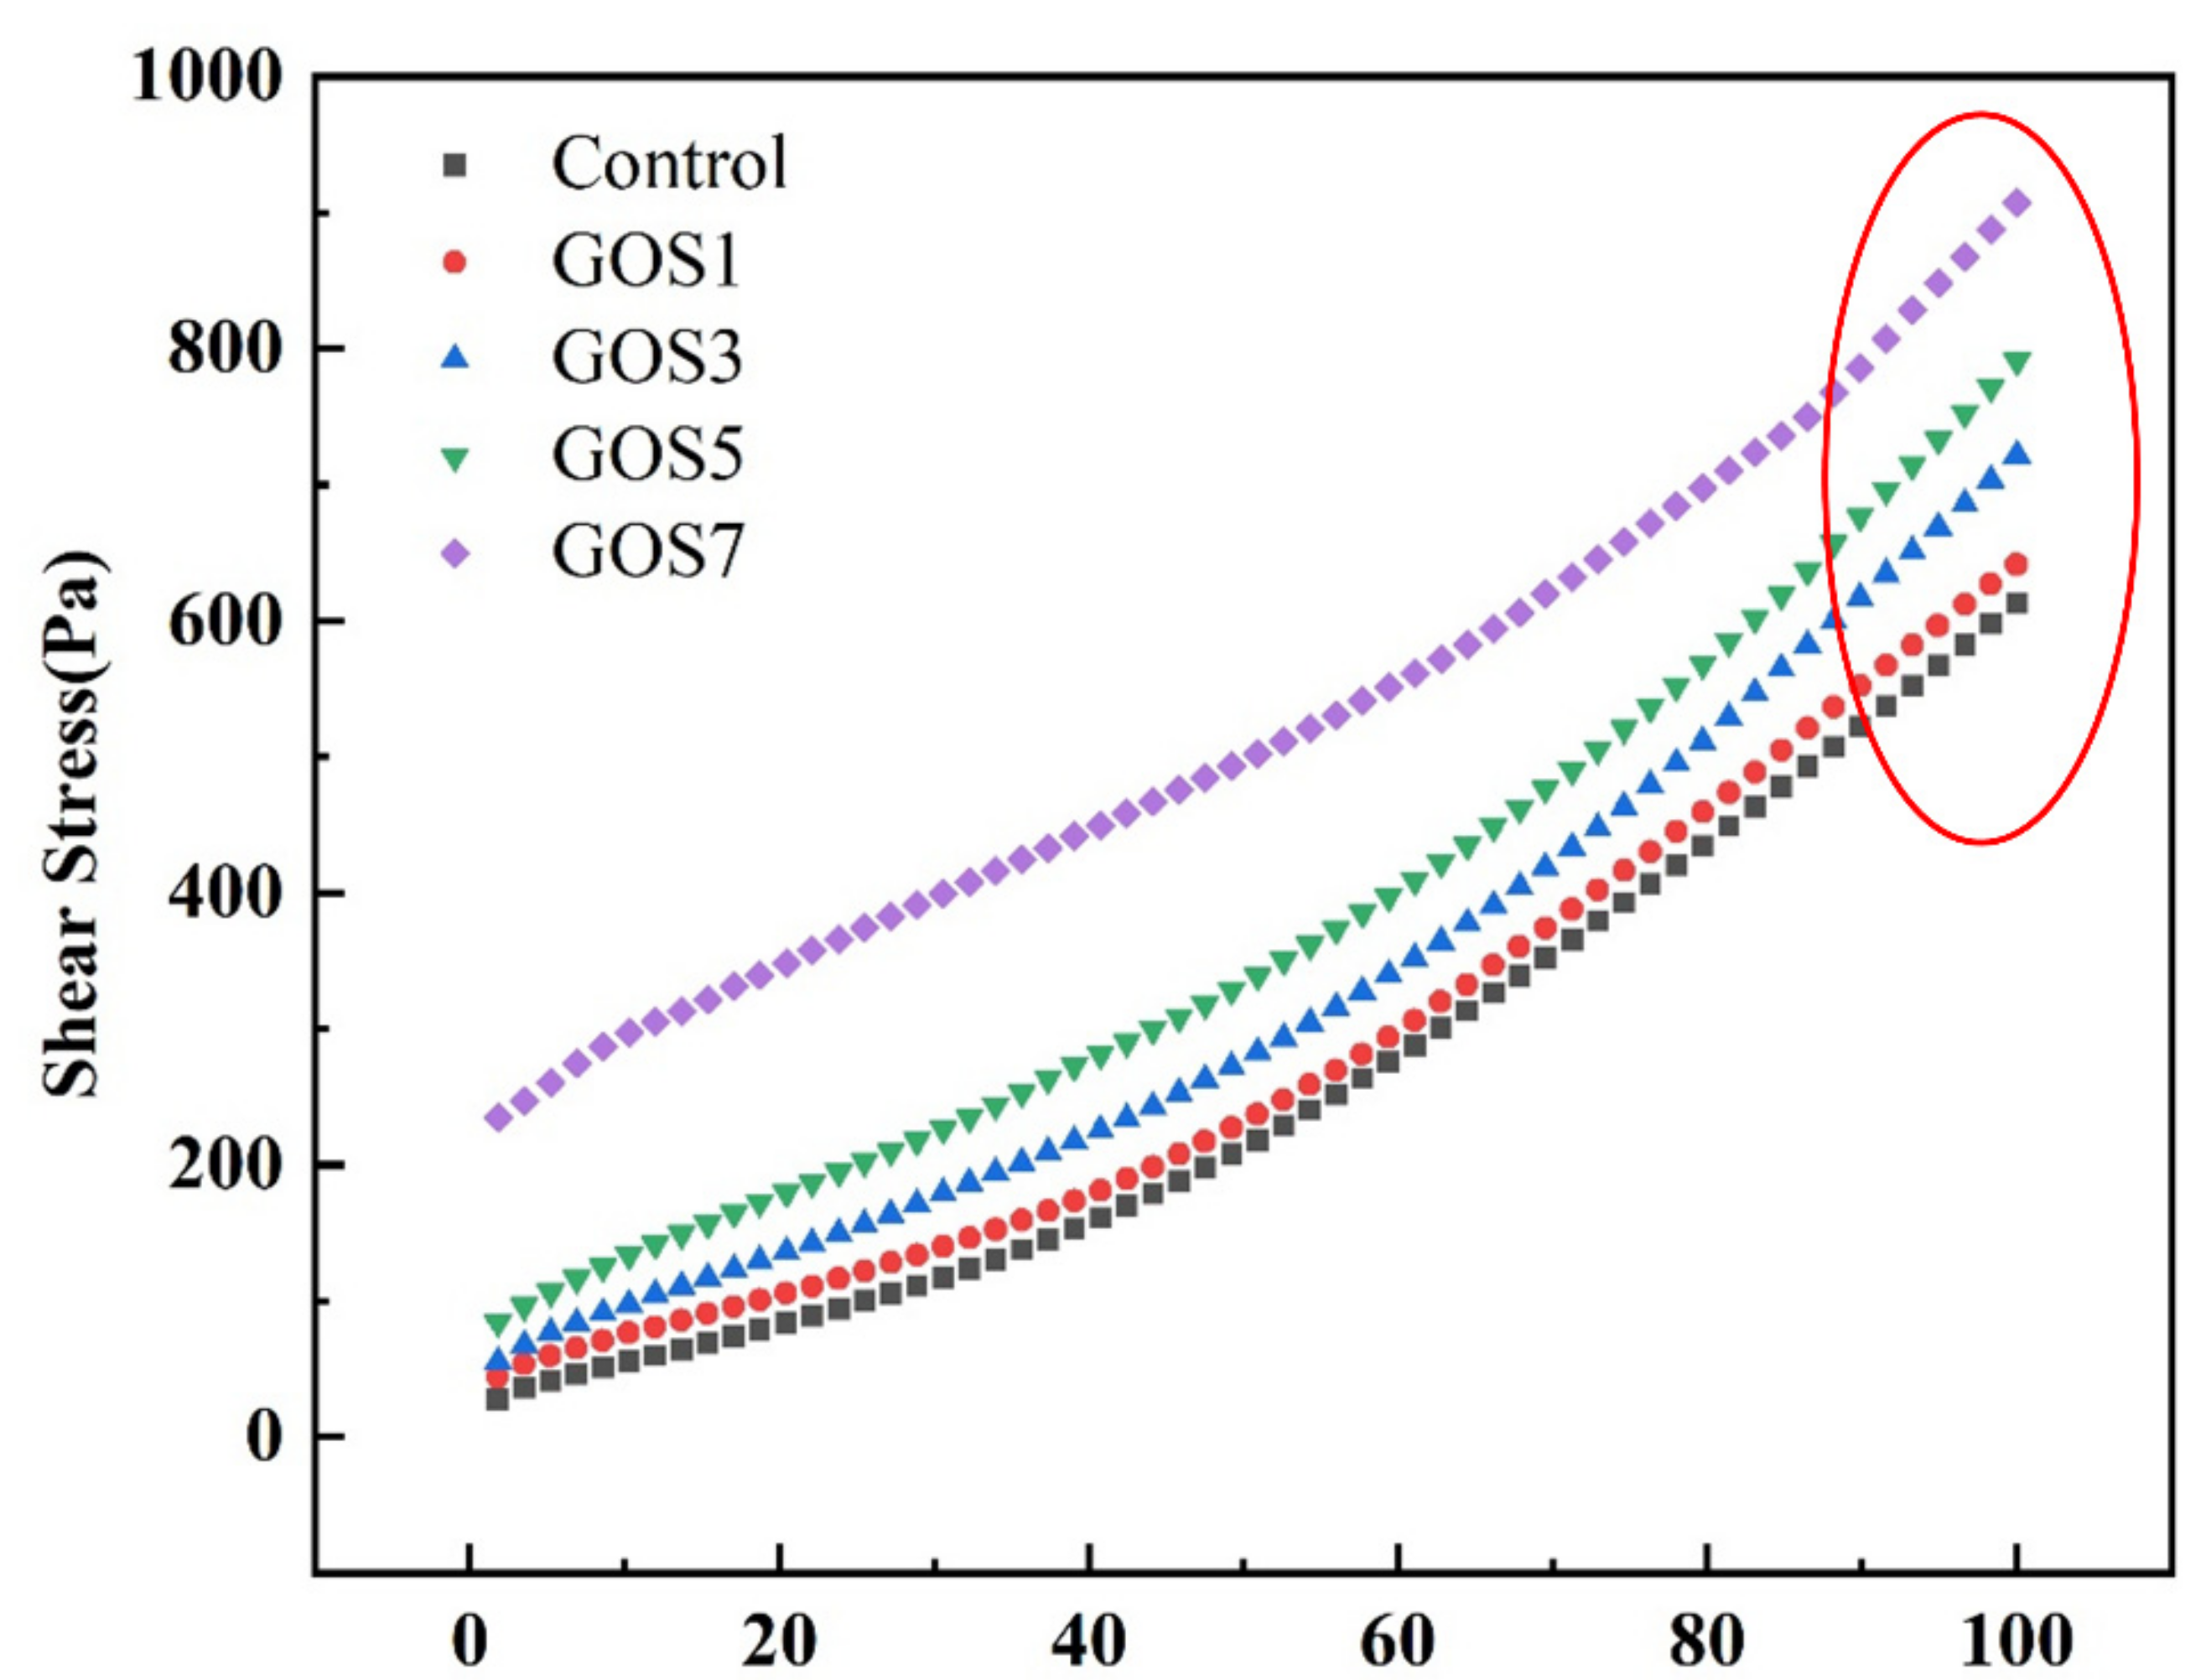
Figure 7 shows the shear rate-shear stress curves of fresh cement paste with different GOS concentrations, and the fitting equation is summarized in
Table 4. It can be seen from the diagram that the shear stress of fresh cement paste increases with the increase in shear rate. When the shear rate is 100 s
−1, the shear stress values of the cement pastes with different GOS concentrations are 650, 721, 791, and, 907 Pa. The shear rates of the cement pastes with different GOS concentrations in the reference group are 6.05%, 17.68%, 29.06%, and 48.04%, indicating that the shear stress of the paste increases with the increase in GOS concentration at the same shear rate. This is attributed to the hydrophilicity of GOS, which absorbs part of the free water [
36], and when the concentration of GOS increases, it will agglomerate and wrap the free water [
11]. These two cases consume the free water in the cement paste, increasing the friction between the cement particles and increasing the shear stress of the cement paste.
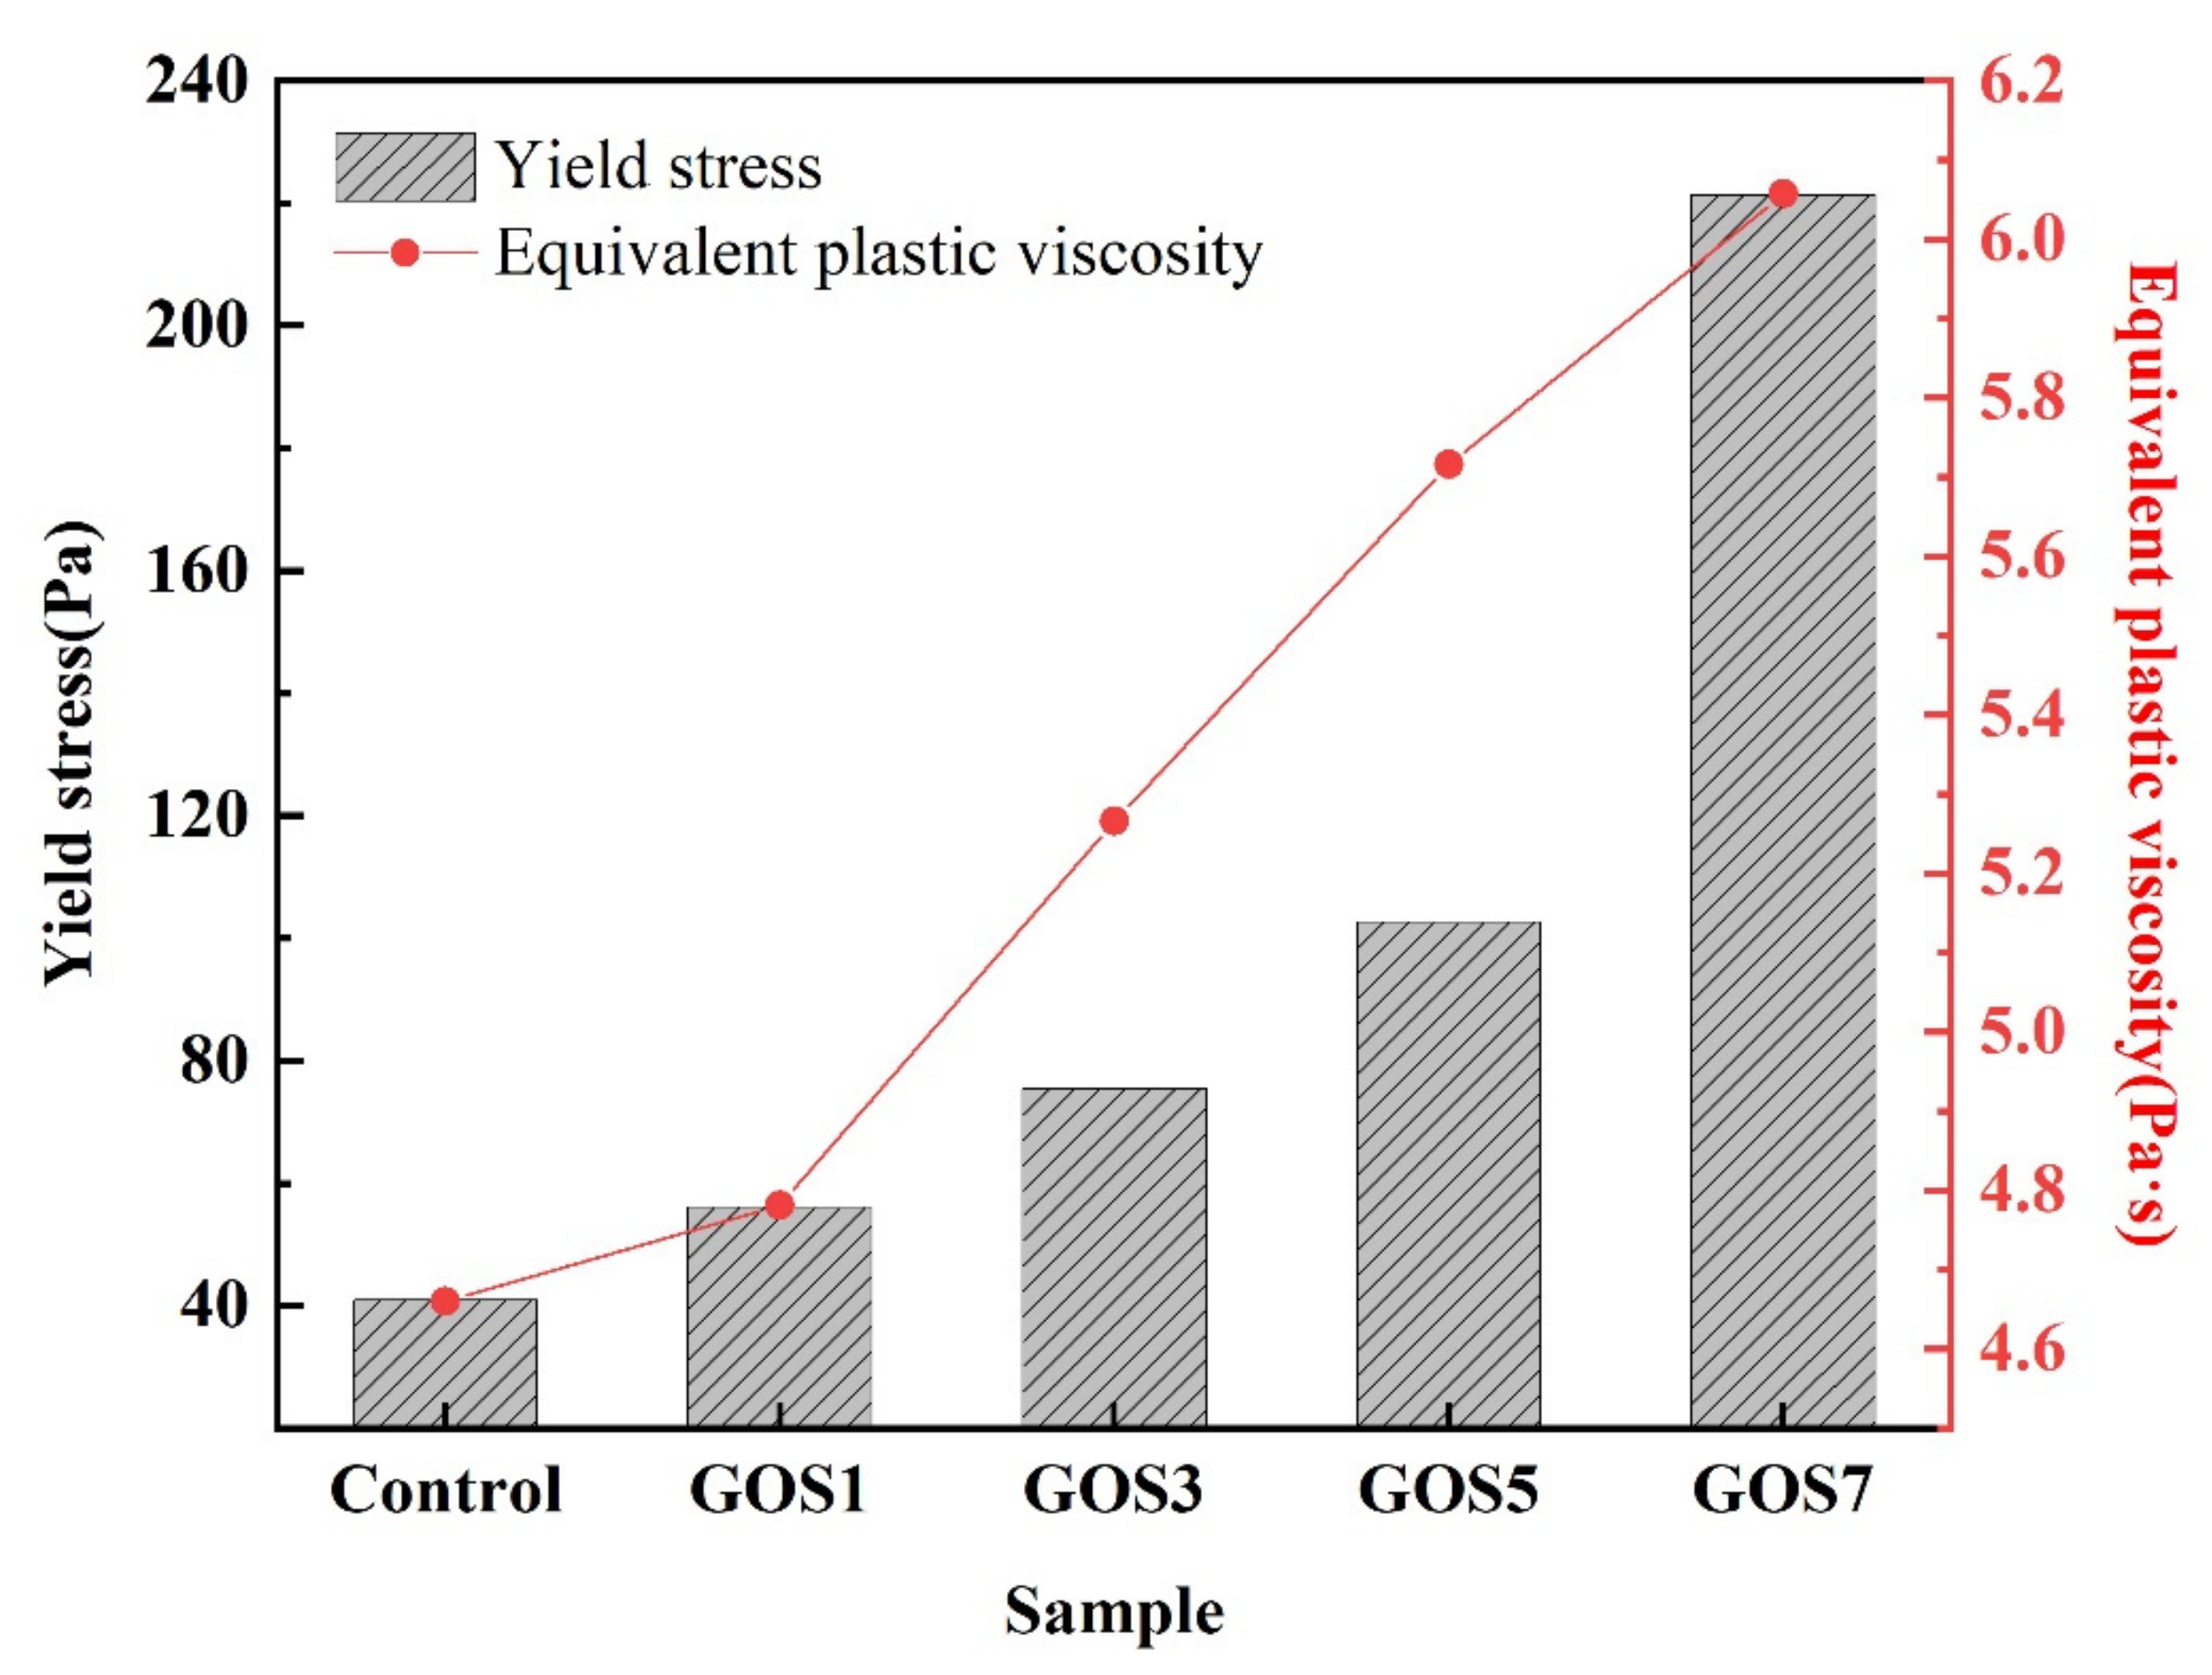
It is well-known that yield stress and equivalent plastic viscosity are the main parameters that affect the rheological properties of cement paste. The paste will deform only when the external force exceeds the yield stress of the cement paste, and the plastic viscosity reflects the speed of the paste deformation. Plastic viscosity is an index to measure the difficulty of material flow. Once the external force on the slurry exceeds the yield stress, it will control the diffusion speed of the paste. The yield stress and plastic viscosity parameters obtained from Equations (1) and (2) are shown in
Figure 8. As can be seen from the figure, when the GOS concentration increases from 0 to 0.07%, the yield stress of the corresponding cement paste increases by 37.43%, 84.43%, 151.07%, and 441.54%, indicating that with the rise of GOS concentration, the flow of cement paste becomes more difficult; especially when the GOS concentration is more than 0.05%, the yield stress of cement paste increases more rapidly. In cement paste, segregation is mainly caused by uneven flow and gravity settlement between the components of the fresh mixture, and viscosity is the main parameter for evaluating the segregation of cement paste [
37]. According to
Figure 8, with the increase of GOS concentration, the equivalent plastic viscosity of cement paste increases by 2.62%, 13.00%, 22.65%, and 29.97%. On the whole, the addition of GOS will increase the plastic viscosity of cement paste, slow down the flow speed of cement paste, and reduce the probability of cement paste segregation.
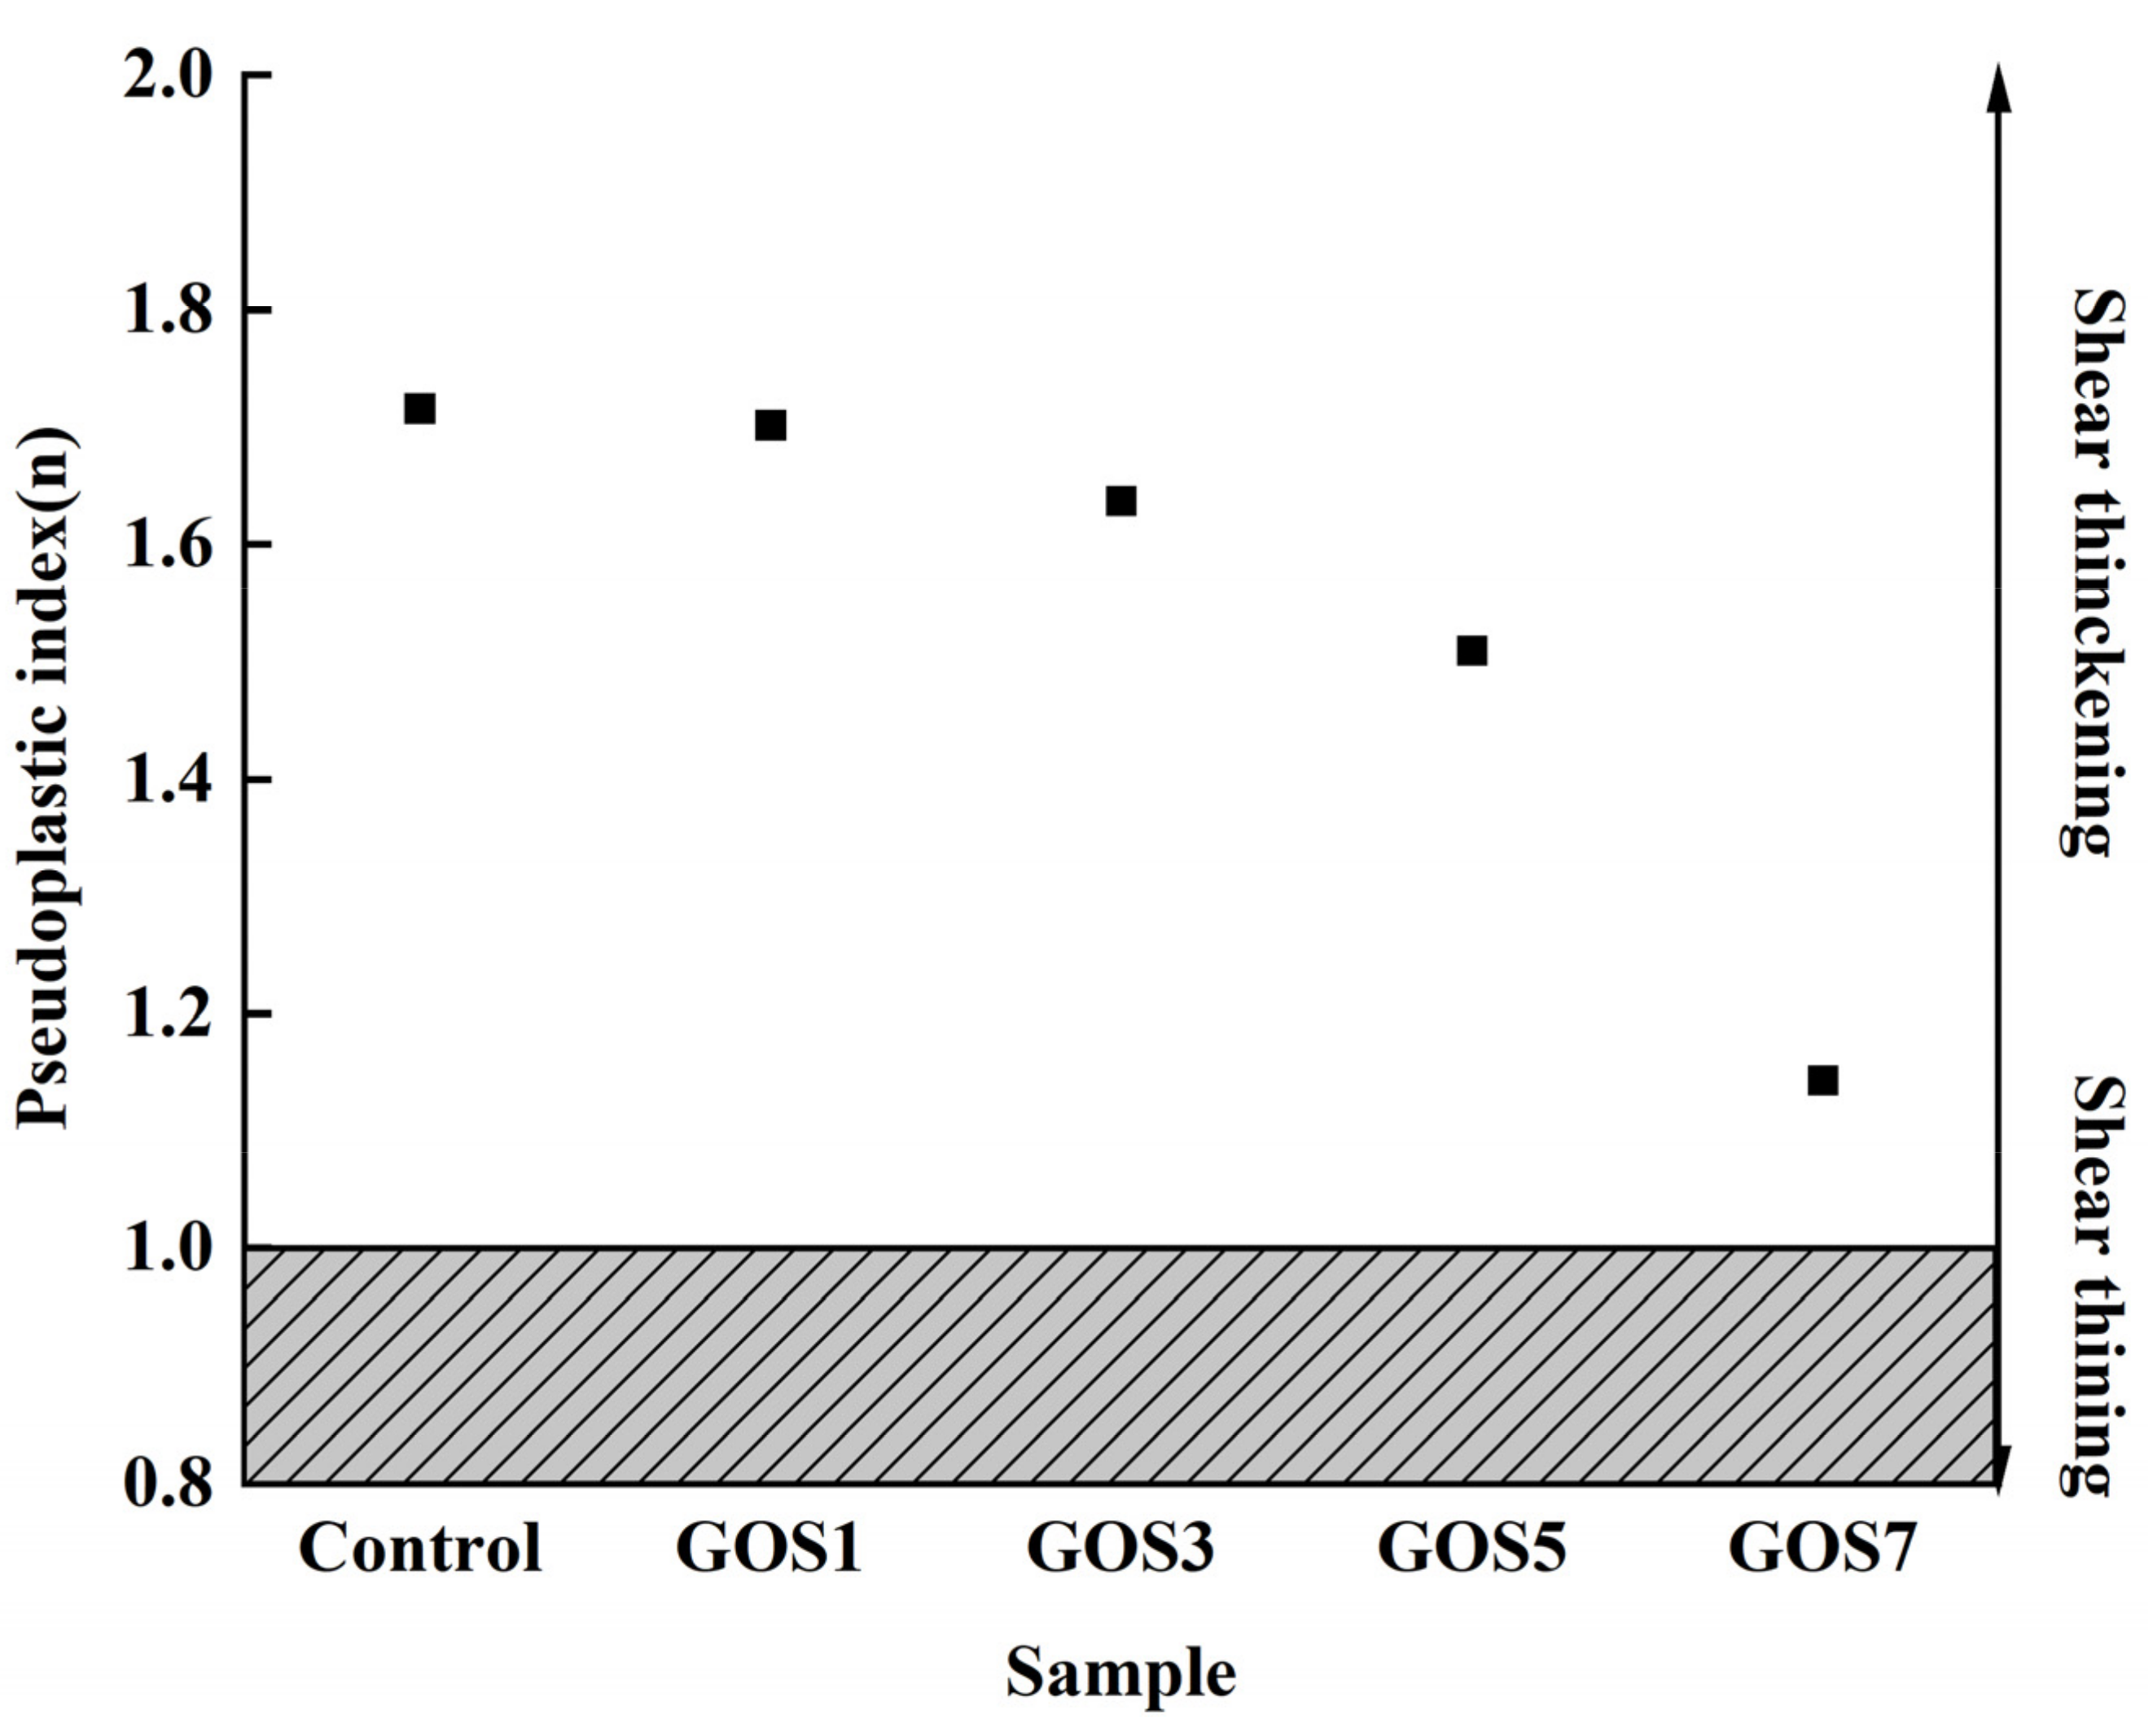
Figure 9 shows the effects of different GOS concentrations on the pseudoplasticity index (
n) of fresh cement paste. As shown in
Figure 9, the rheological index
n of fresh cement paste fitted by H-B is greater than 1, indicating that the fresh cement paste mixed with superplasticizer shows shear thickening under shear action, but the addition of GOS will not change this property. With the increase of GOS concentration, the
n value of fresh cement decreased gradually, and the decreasing rates were 0.82%, 4.56%, 12.00%, and 33.35%. The results show that the
n of fresh cement decreases and increases with the increase of GOS concentration. This is related to the interaction between GOS, PC, and cement particles. Previous studies have shown that PC will produce chemical and physical adsorption to cement particles, and the long side chain of PC will cause steric hindrance between cement particles, thus increasing the distance between cement particles, while the increase of distance will reduce the electrostatic repulsion between cement particles. There is also a certain interaction between GOS and PC that will reduce the adsorption of PC to cement particles, reduce the distance between cement particles, and increase the electrostatic repulsion between cement particles. With increasing GOS concentration, the steric hindrance between cement particles decreases, and the repulsive force between cement particles increases gradually. According to the cluster theory, when the hydrodynamic force is greater than the repulsive force between the particles, the cement particles will form a cluster structure, which leads to the shear thickening of the cement paste. Therefore, the higher the concentration of GOS, the greater the repulsive force between cement particles, and the more difficult it is for cement paste to form shear thickening, so the pseudoplasticity index of cement paste will decrease with the increase of GOS concentration [
35,
38,
39].
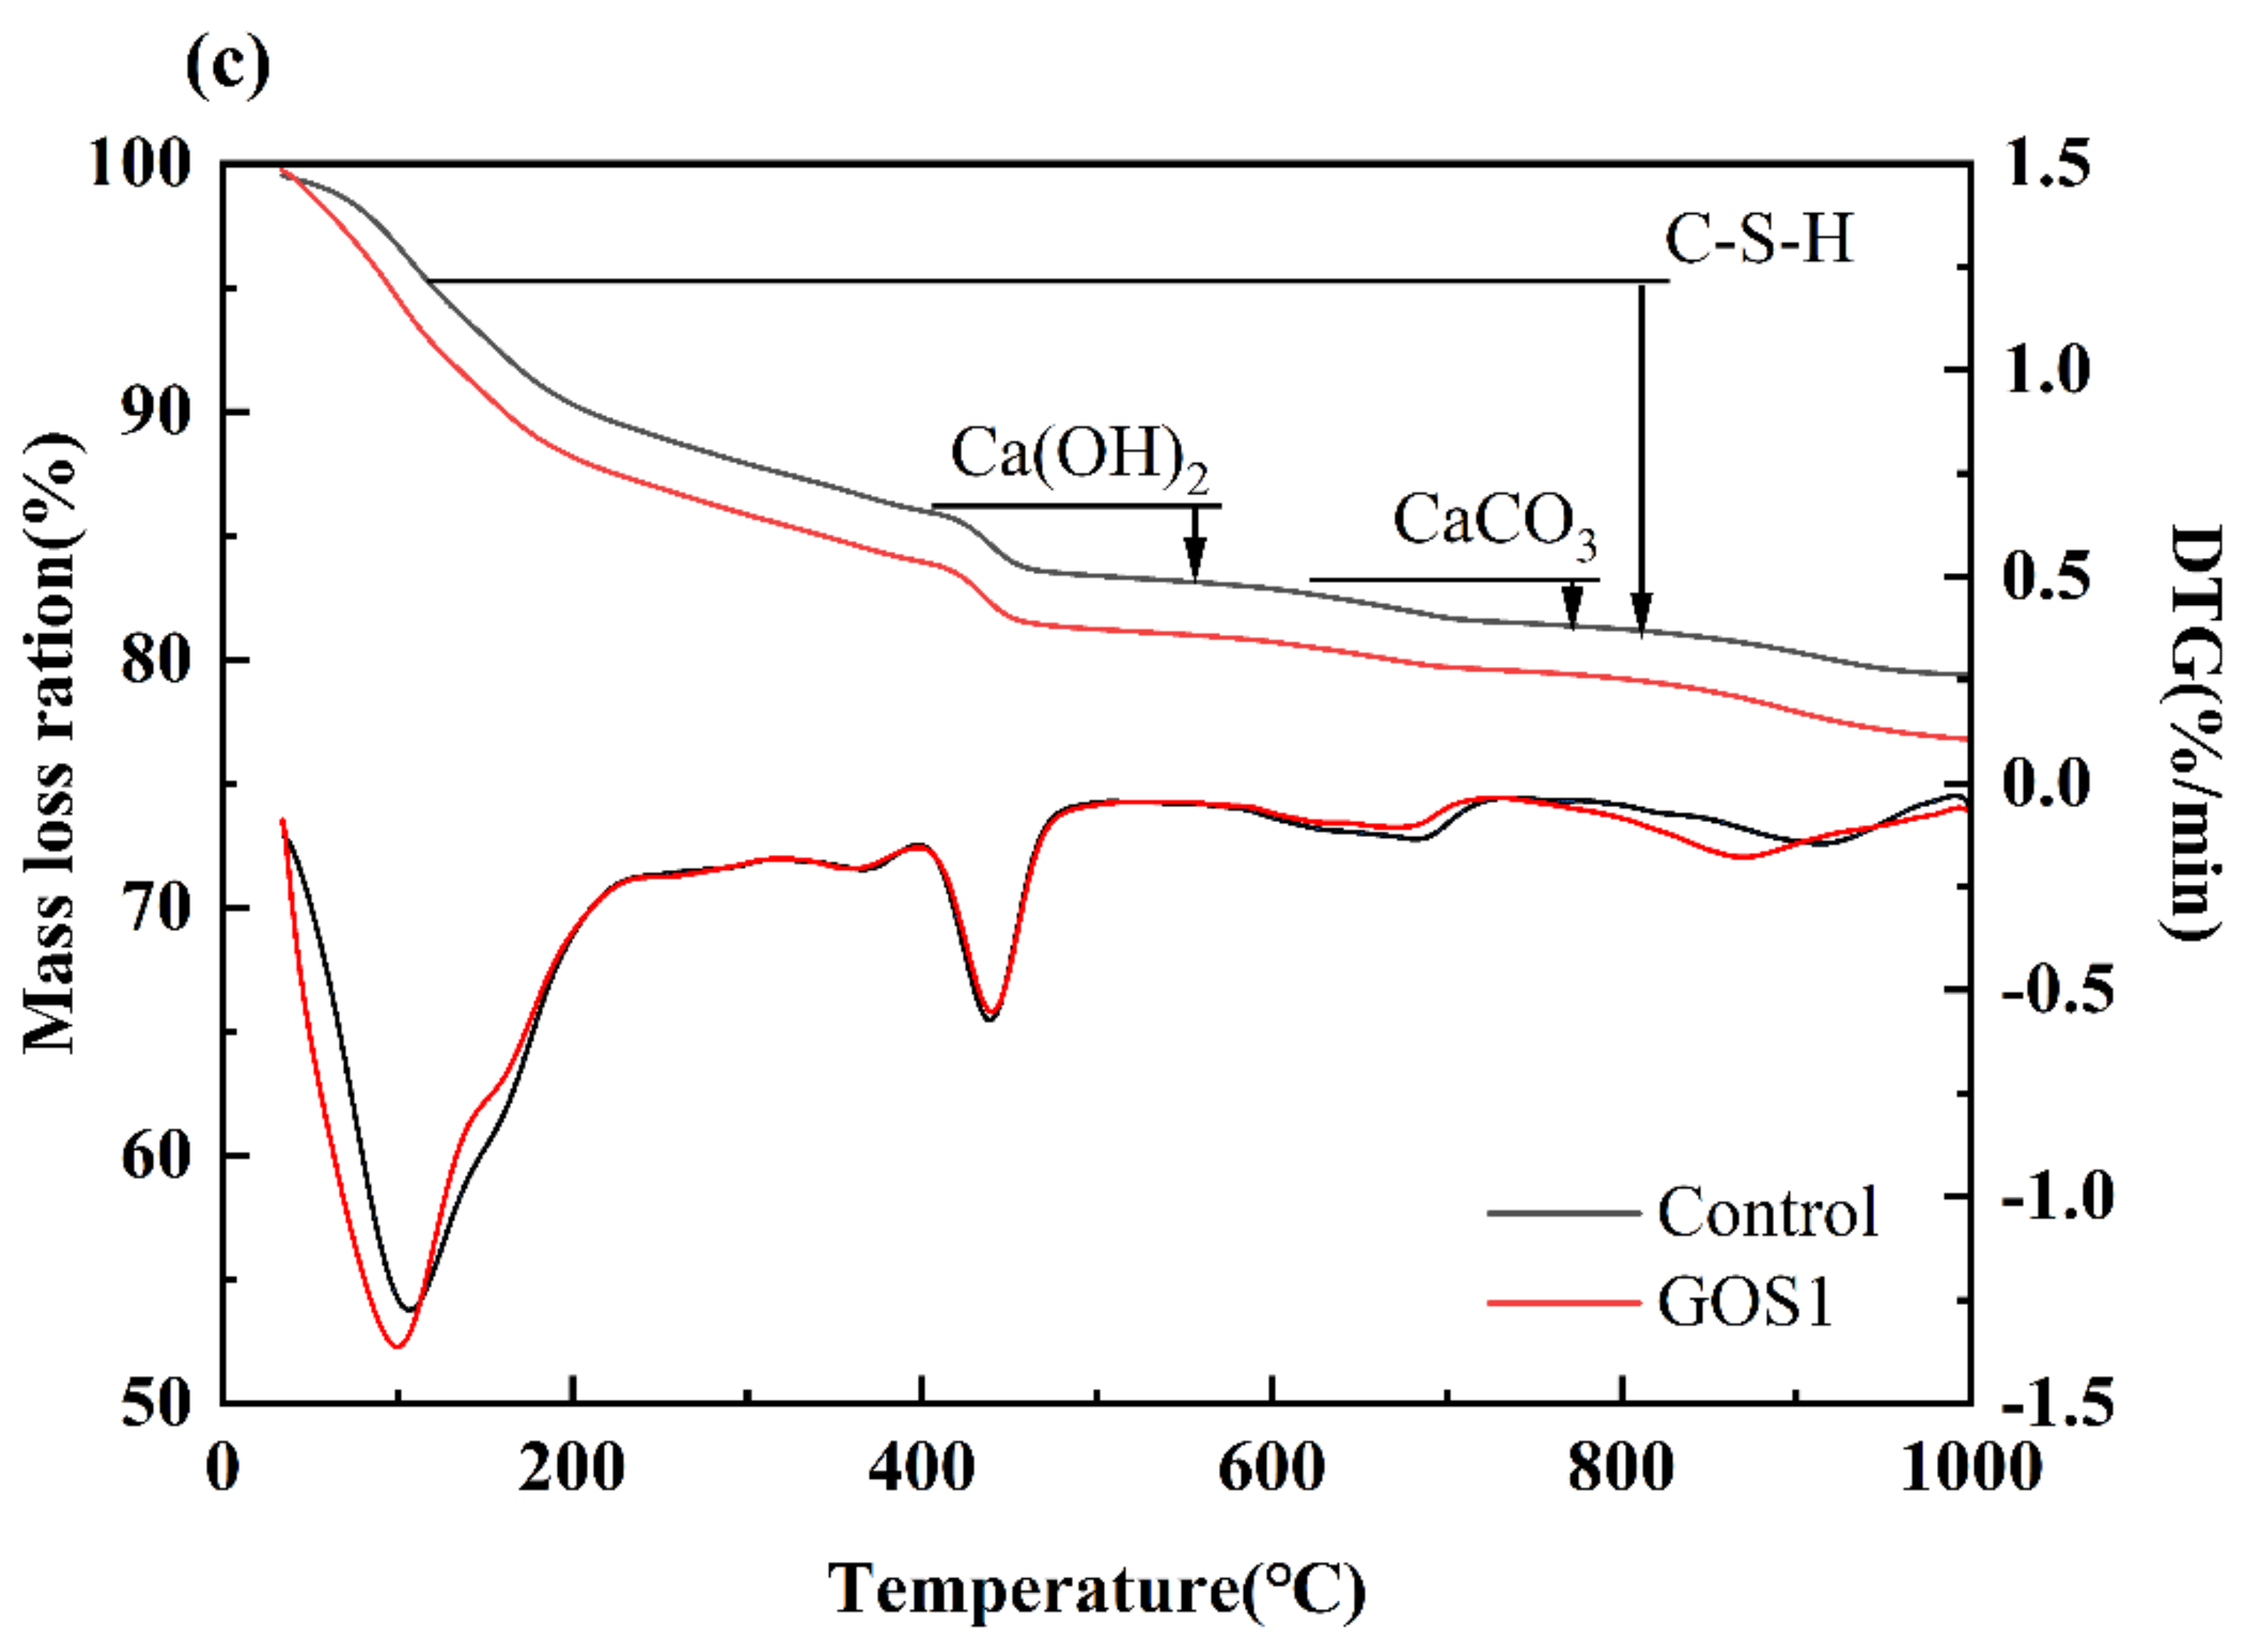
3.5. The Impacts on the Mechanical Properties of Cement-Based Materials with Different Concentrations of GOS
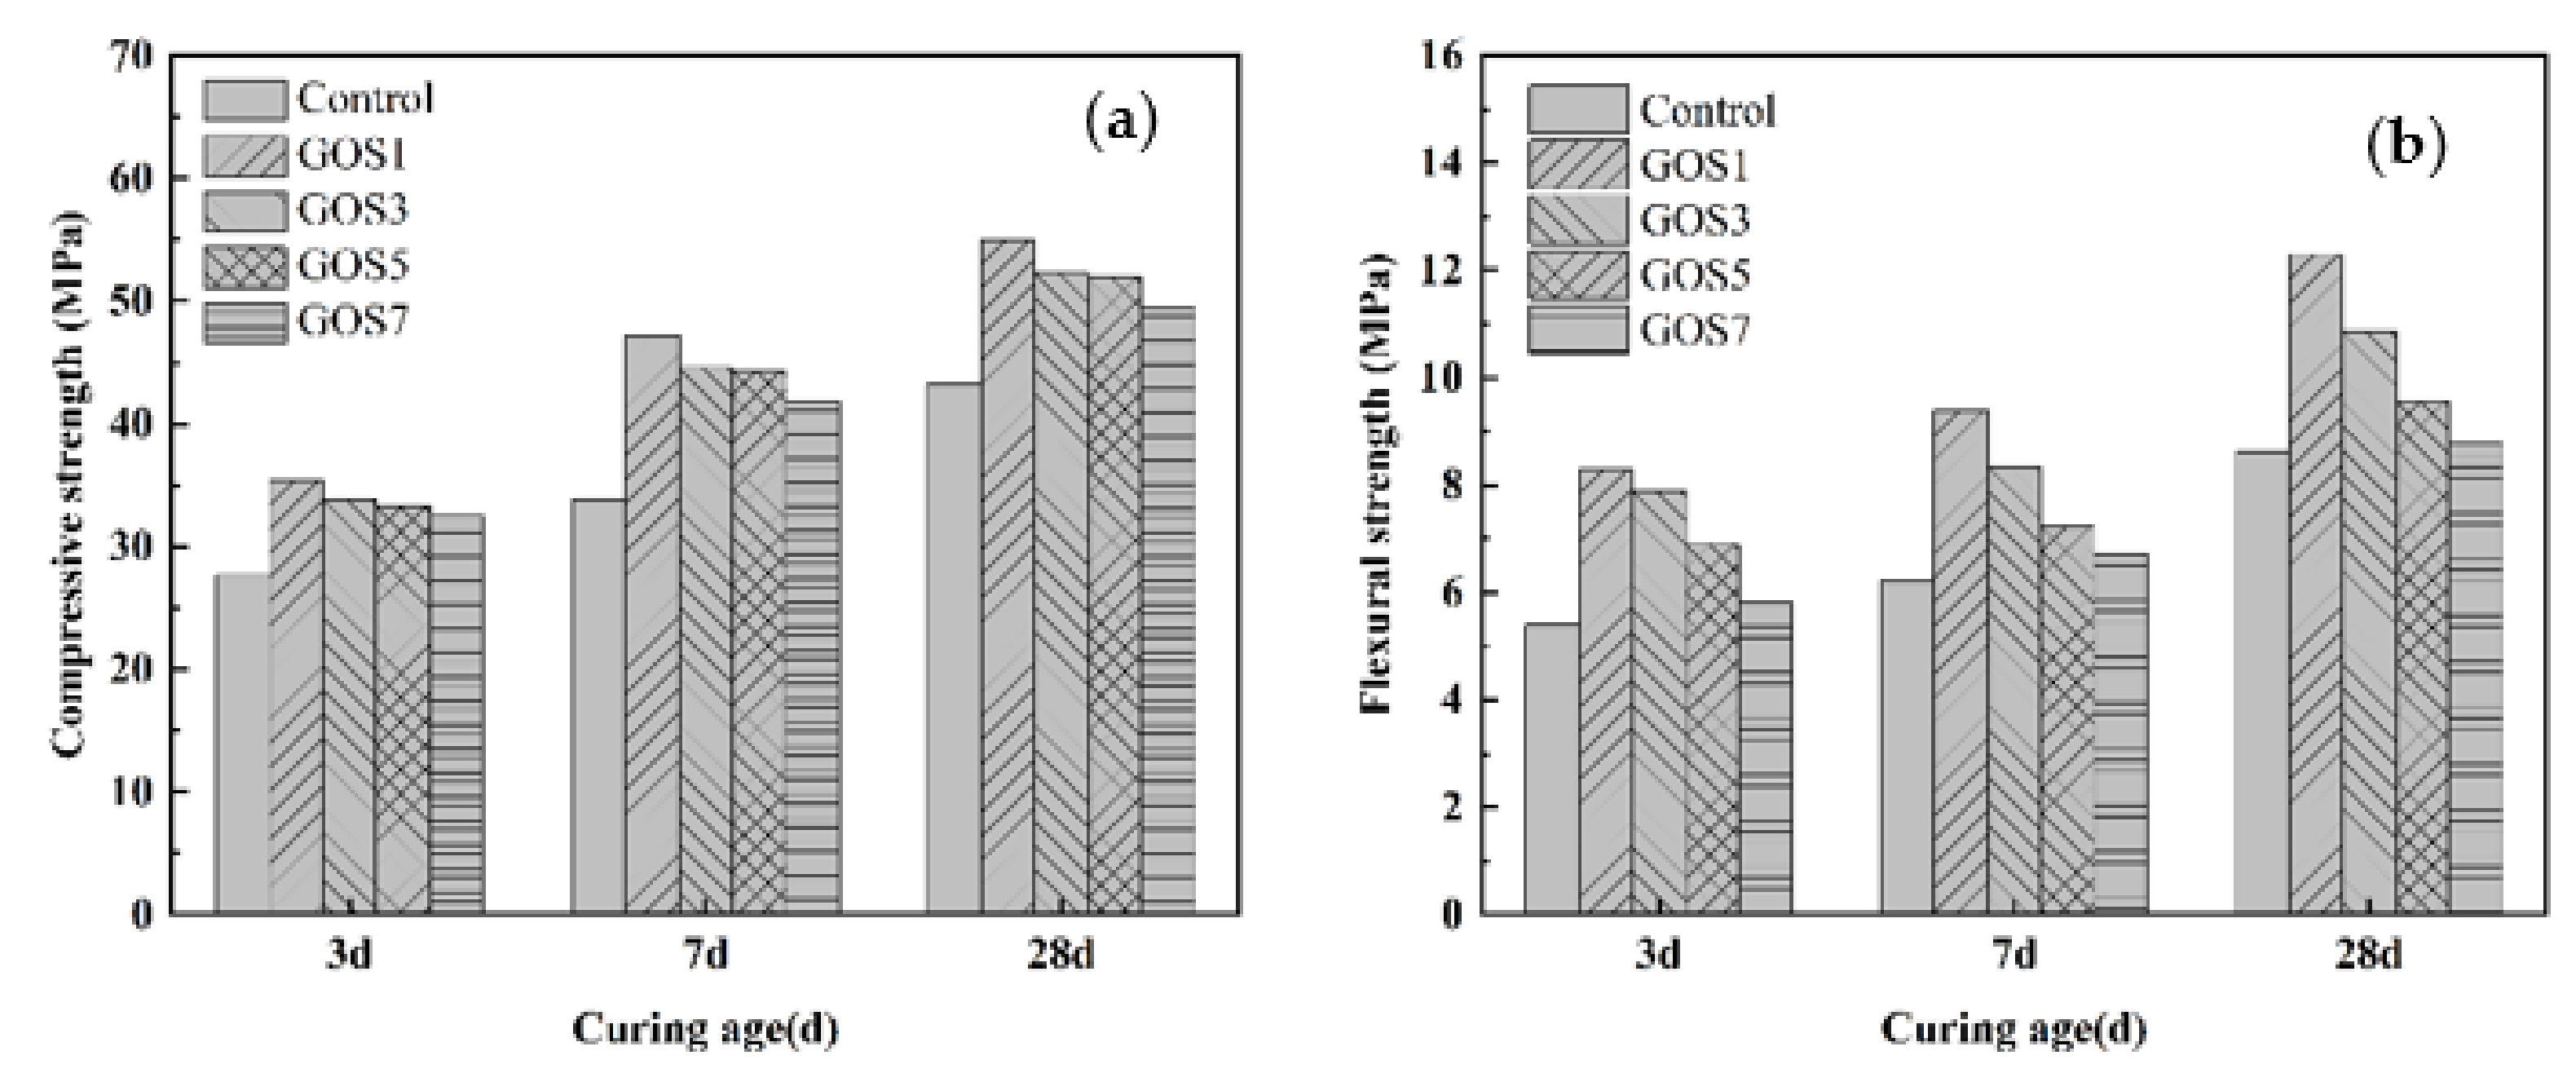
Figure 10a,b displays the compressive and flexural strengths of cement samples with different concentrations of GOS at the maintenance periods of 3 d, 7 d, and 28 d. According to
Figure 10a, at different maintenance periods, the compressive strength of cement samples varies with the addition of GOS. In contrast to the reference group, the compressive strength for the cement sample at 3 d increased by 27.73%, 22.38%, 20.07%, and 17.35%; at 7 d of curing, the number increased by 39.26%, 31.67%, 31.02%, and 23.40%; and at 28 d of curing, it increased by 27.17%, 20.74%, 19.95%, and 14.31%. According to
Figure 10b, in comparison with the reference group, the flexural strength of cement samples with different concentrations of GOS increased by 53.70%, 46.11%, 27.59%, and 7.41% at 3 d of curing; the number increased by 50.72%, 33.71%, 15.89%, and 7.87% at 7 d of curing, and it increased by 42.86%, 26.13%, 11.15%, and 1.86% at 28 d of curing. All of the results indicate that the strengthening effect of GOS on the mechanical properties of cement-based composites will not show a linear tendency along with increasing concentrations of GOS; instead, there is an optimal concentration, and beyond the optimal range, the strength has a downward trend. The template action and accelerated hydration of GOS in the cement-based materials allow more and tighter hydration products in such materials, thus improving their compressive strength [
40,
41]. However, with the additional increase of GOS, aggregation occurs; as a result, cracks will be seen due to the failure of the original effect of nanomaterials, and the strength will decrease because of the concentrated stress [
42]. Moreover, it can be determined that the increasing magnitudes at 7 d and 3 d are greater than that of 28 d by comparing the compressive strength of GOS cement-based materials on 3 d, 7 d, and 28 d. The evenly distributed GO in the early stage will promote the generation of hydration products because more nucleation sites and the generated C-S-H gel from the pozzolanic reaction of SiO
2 with Ca (OH)
2 will accelerate the hydration [
18,
43].
3.7. The Comparison of Macro Performance for Cement-Based GOS and GO Materials
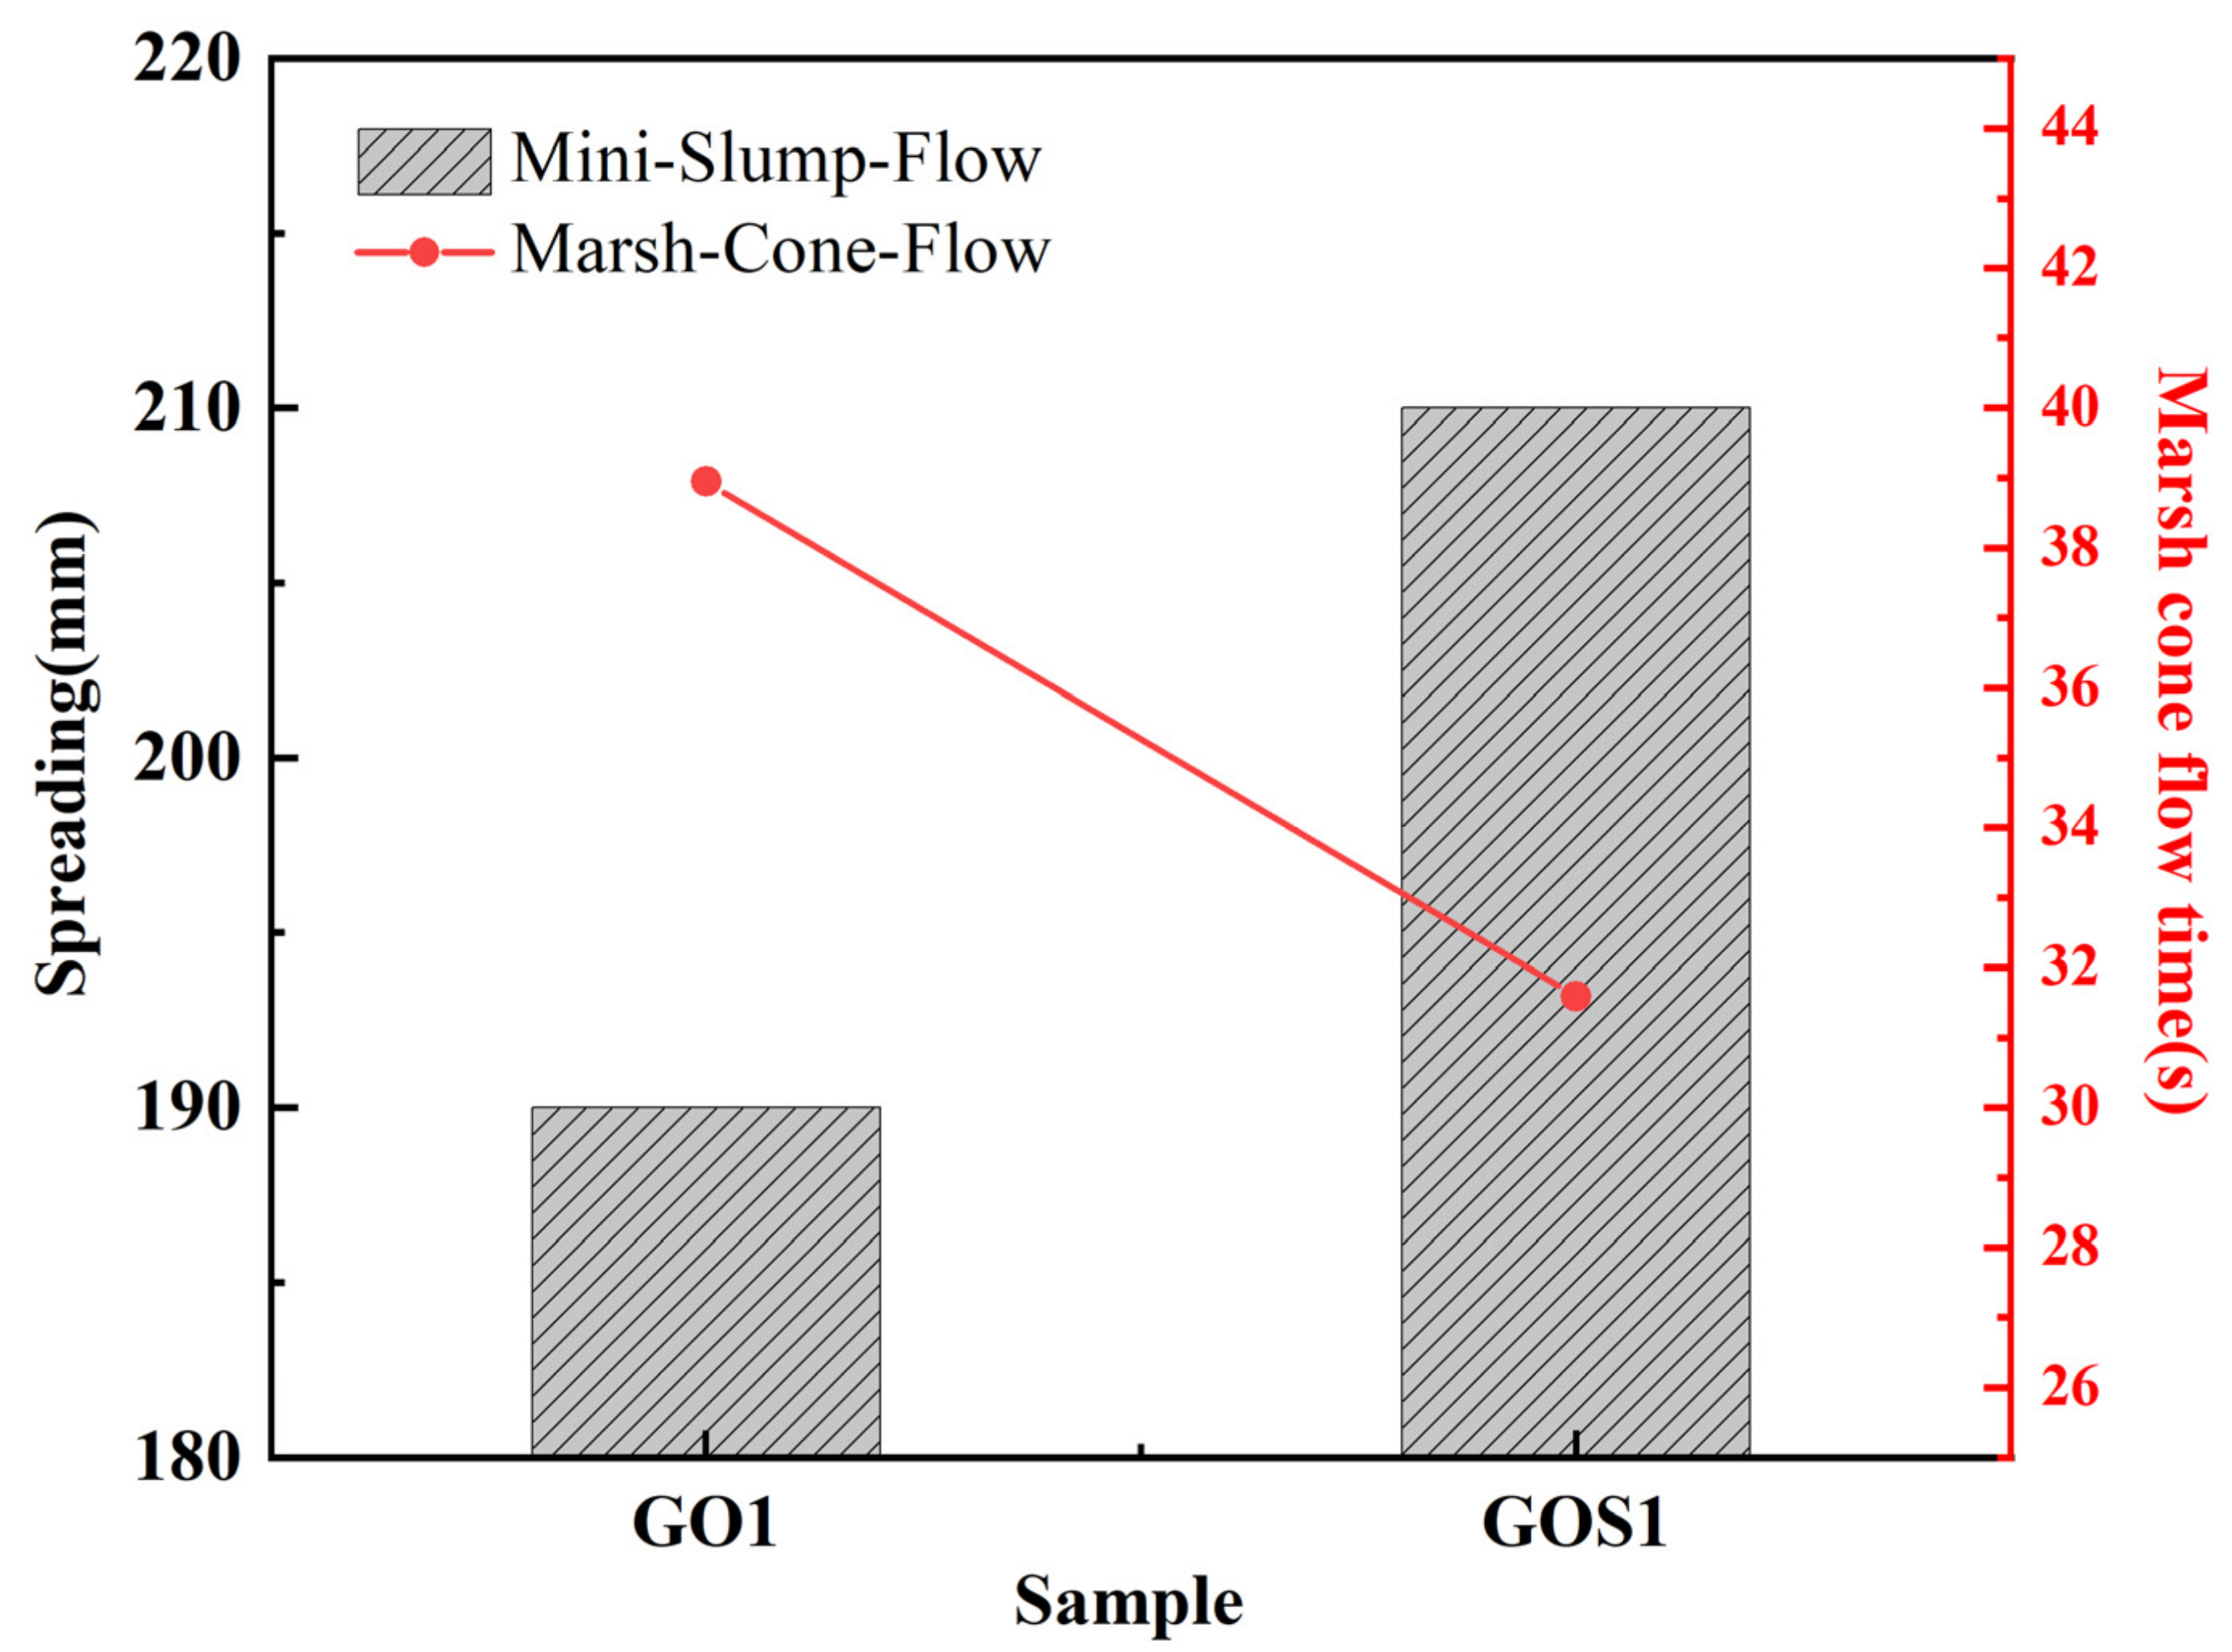
To determine the improvement of GOS to GO, the flow property, rheological parameters, and mechanical properties of GO and GOS with the same addition (0.01%) were compared.
Figure 14 illustrates the comparison of spreading and Marsh cone flow times between GOS1 and GO1. According to the test results, compared with samples with the addition of GO, the spreading of cement pastes containing GOS increased by 10.53%, and the Marsh cone flow time decreased by 18.9%.
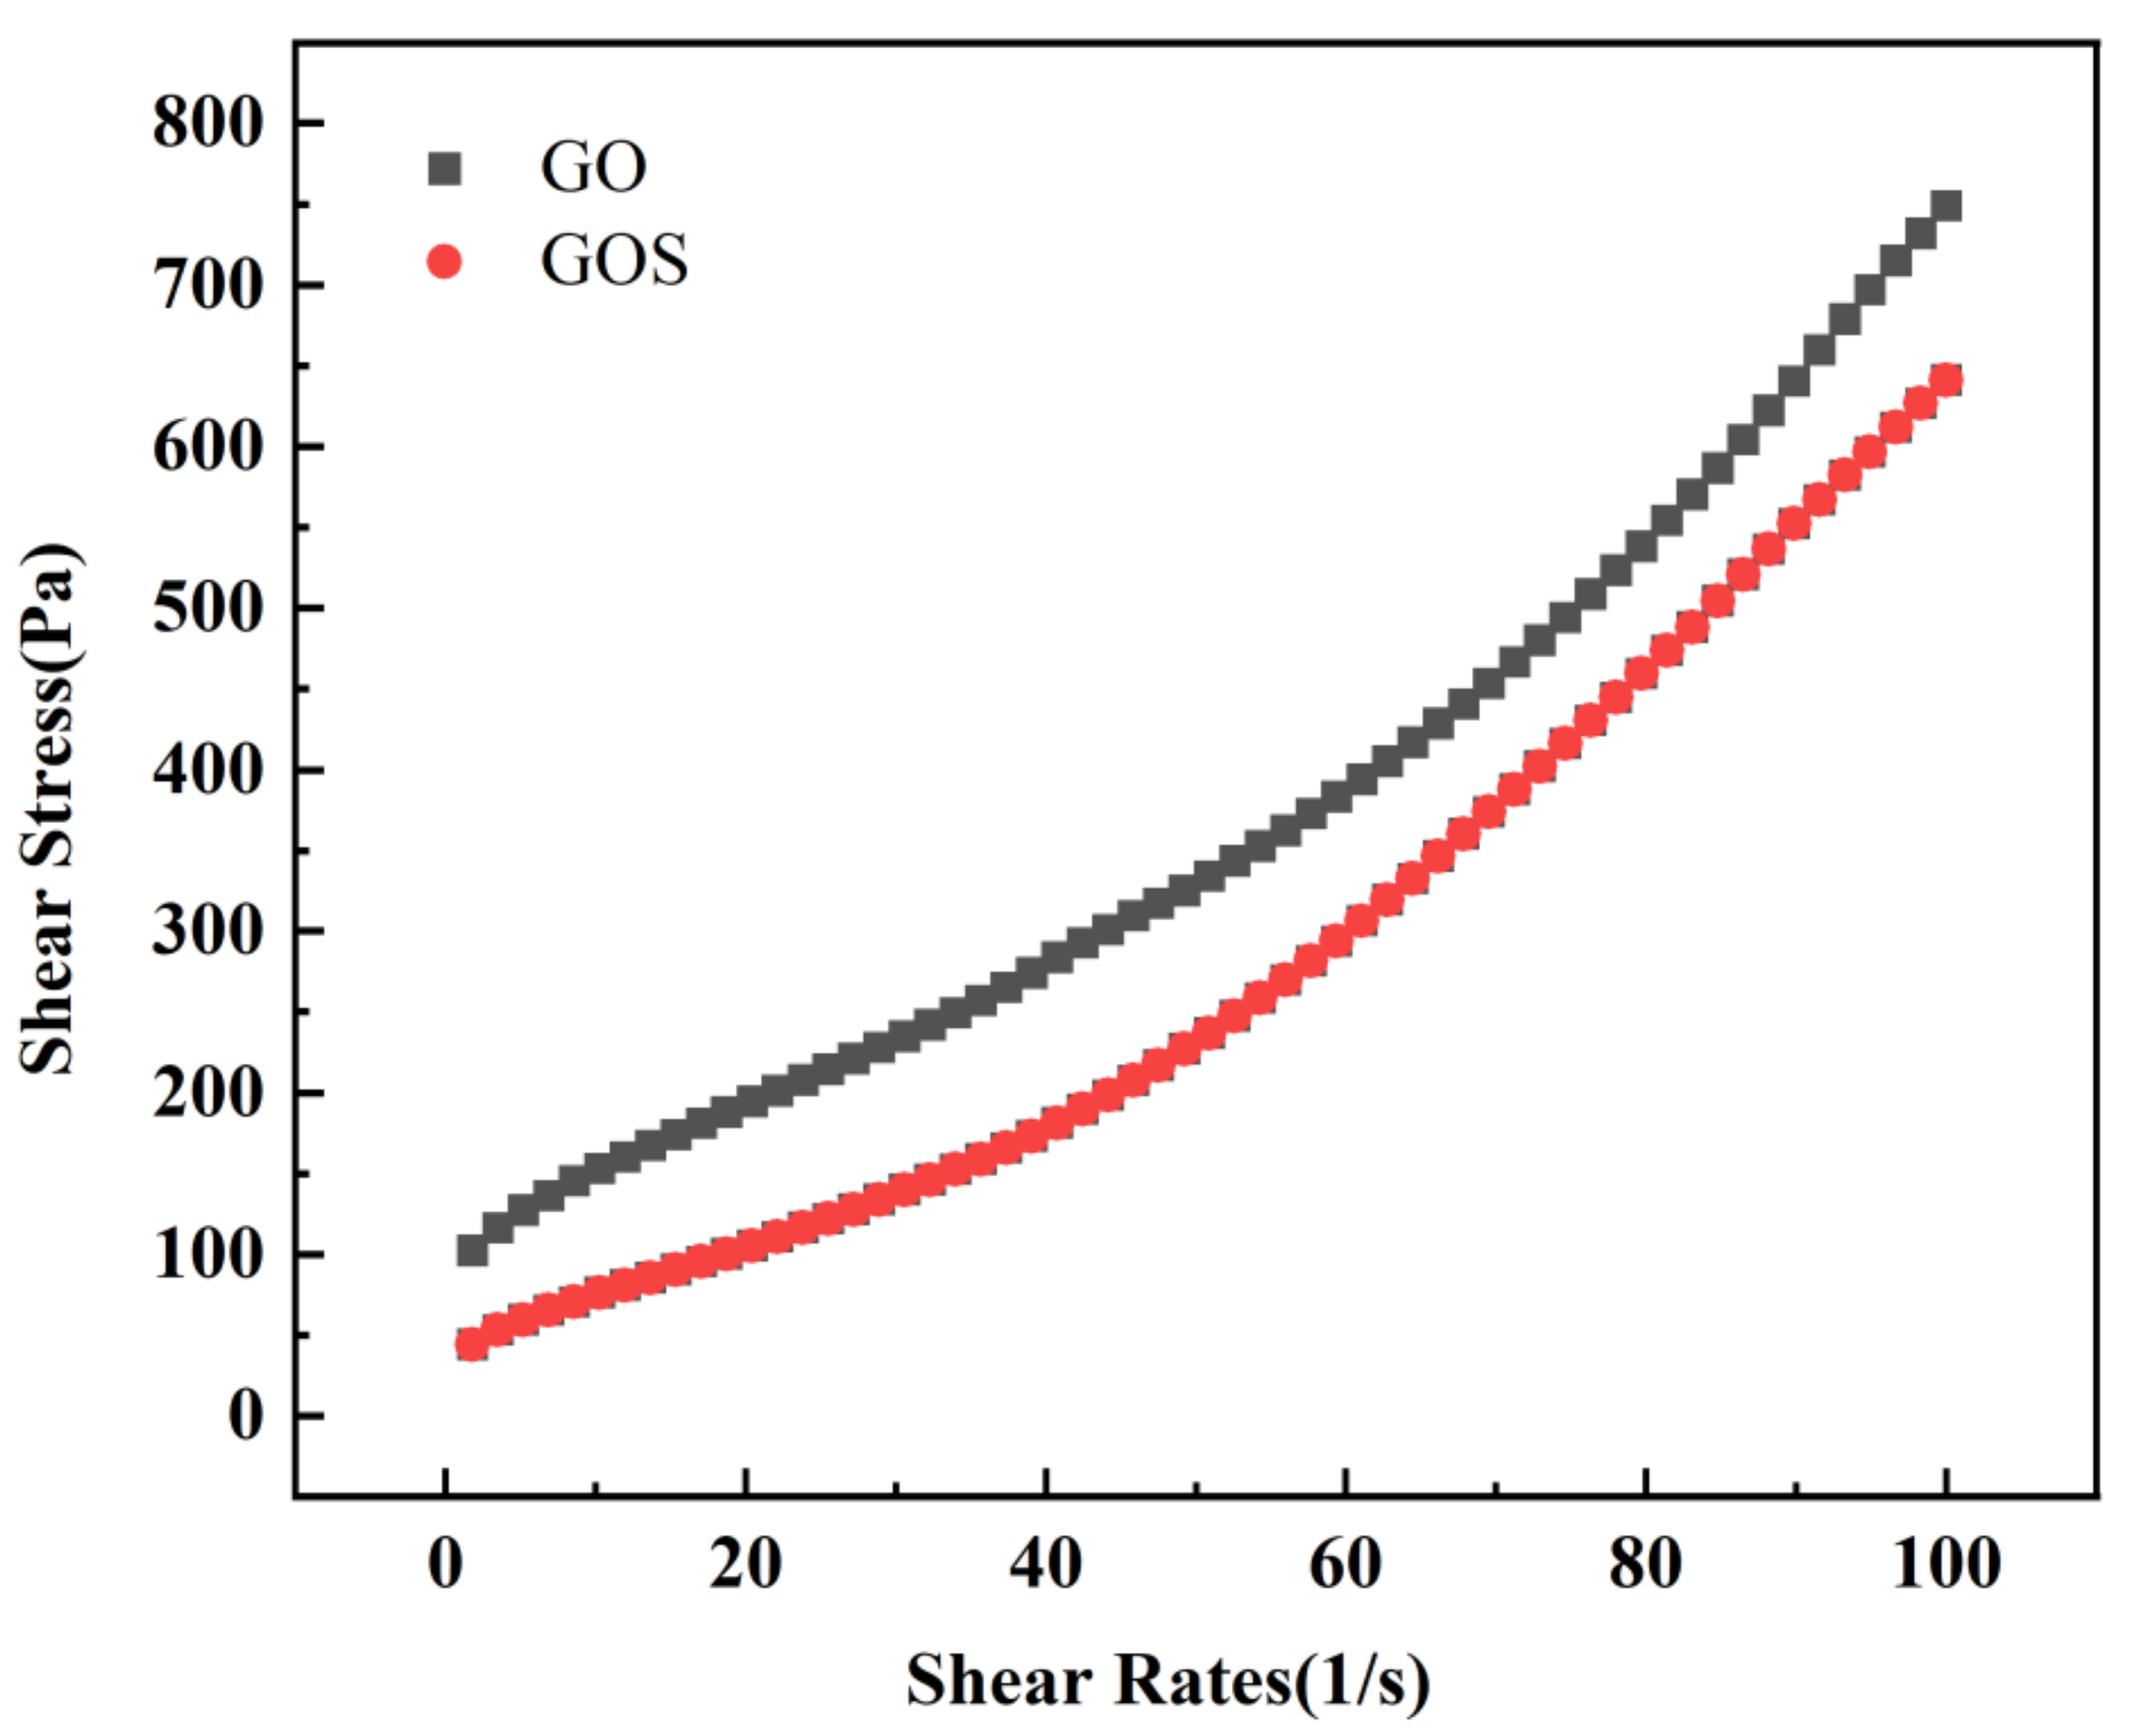
Figure 15 shows the shear rate-shear stress curves of GO1 and GOS1, with GO1 above GOS1. The figure indicates that the shear stress to drive the cement-based materials of GO1 is higher with the same shear rate.
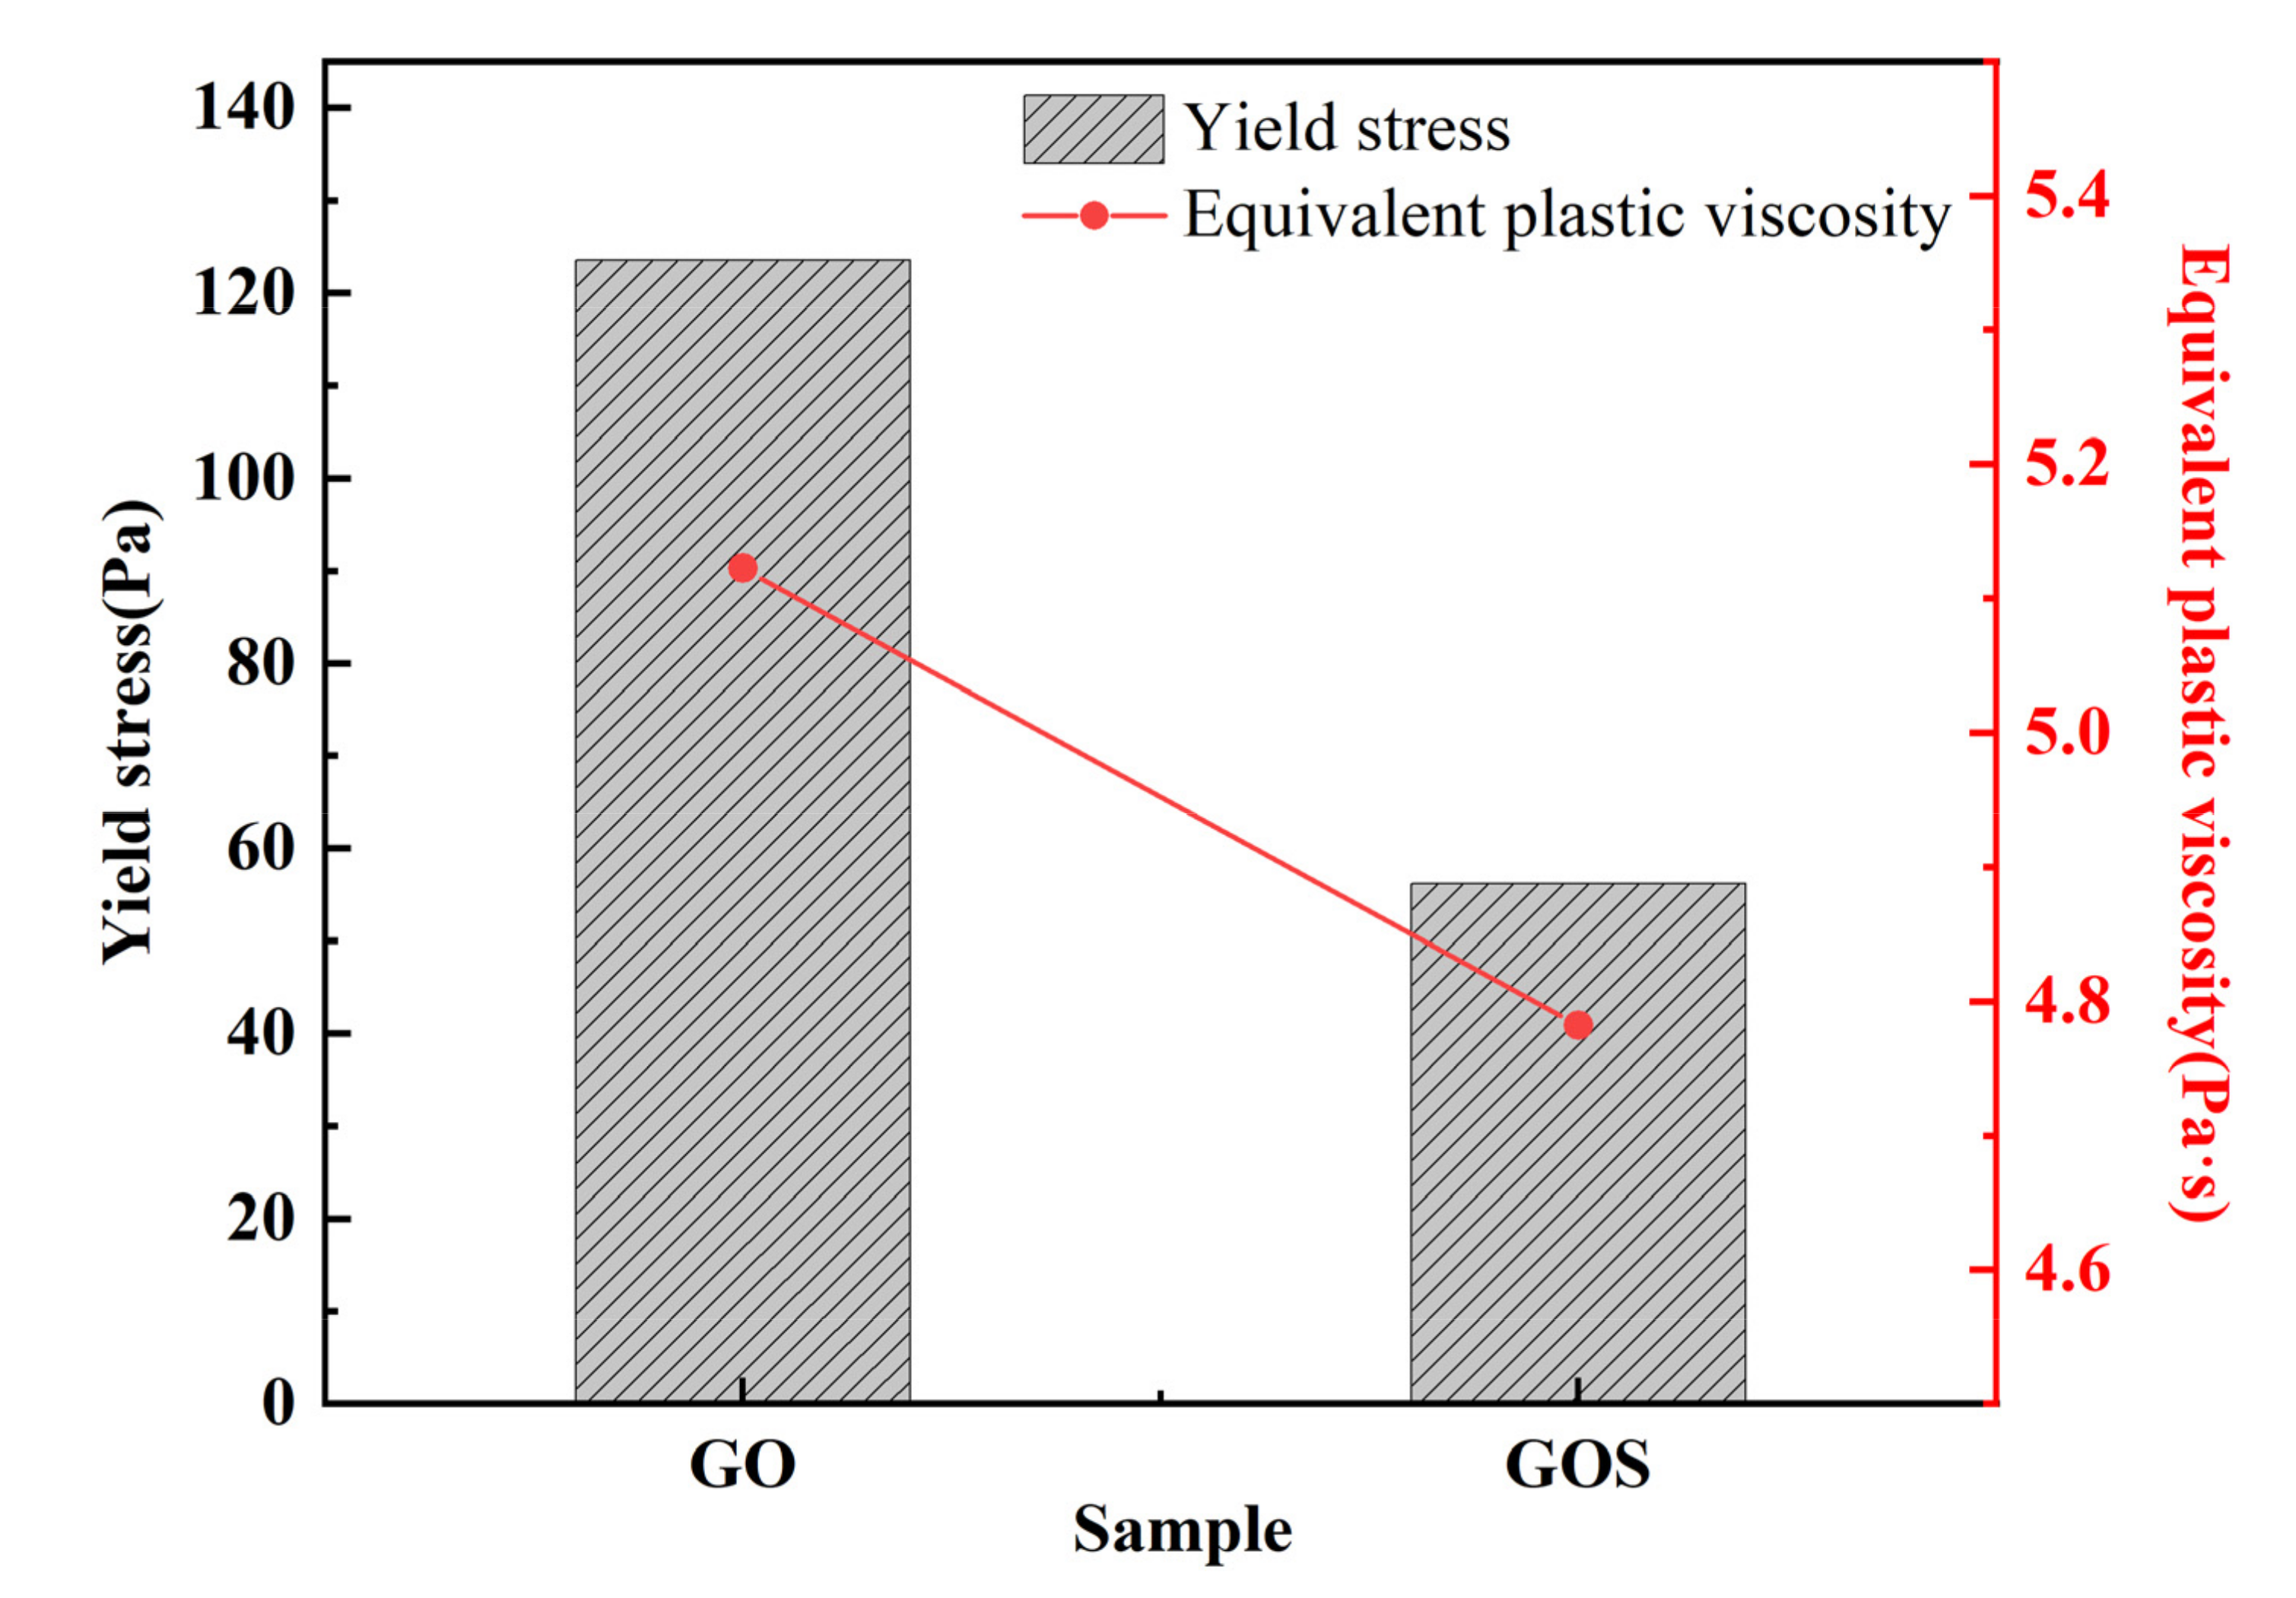
Figure 16 and
Table 6 present the rheological parameters of the GO1 and GOS1 cement pastes. Compared with GO, the shear yield stress of GOS decreased by 54.54%. The equivalent plastic viscosity decreased by 6.65%, indicating that the SiO
2 covering the GO improved the fluidity of the GO cement pastes, thus, lowering the rheological parameters of the cement pastes, which was consistent with the study results of Lin et al. [
18]. The hydrophilic SiO
2 covering the GO effectively prevented the complexation of GO and Ca
2+. Meanwhile, the obstructing function of SiO
2 reduced the physical absorption between GOS and cement particles because of the electrostatic interaction. As a result, the force of friction among cement particles reduced, the flow properties of the cement pastes improved, and its rheological parameters decreased [
8,
9]. According to
Table 6, the pseudoplasticity index of GOS cement paste is higher than that of GO, which indicates that the flocculation structure formed in GO cement paste is relatively loose, which is easy to be dispersed under the action of shear force, which leads to the decrease of pseudoplasticity index, while the flocculation structure formed in GOS cement paste is closely related and not easy to break, so the pseudoplasticity index is relatively high [
48].
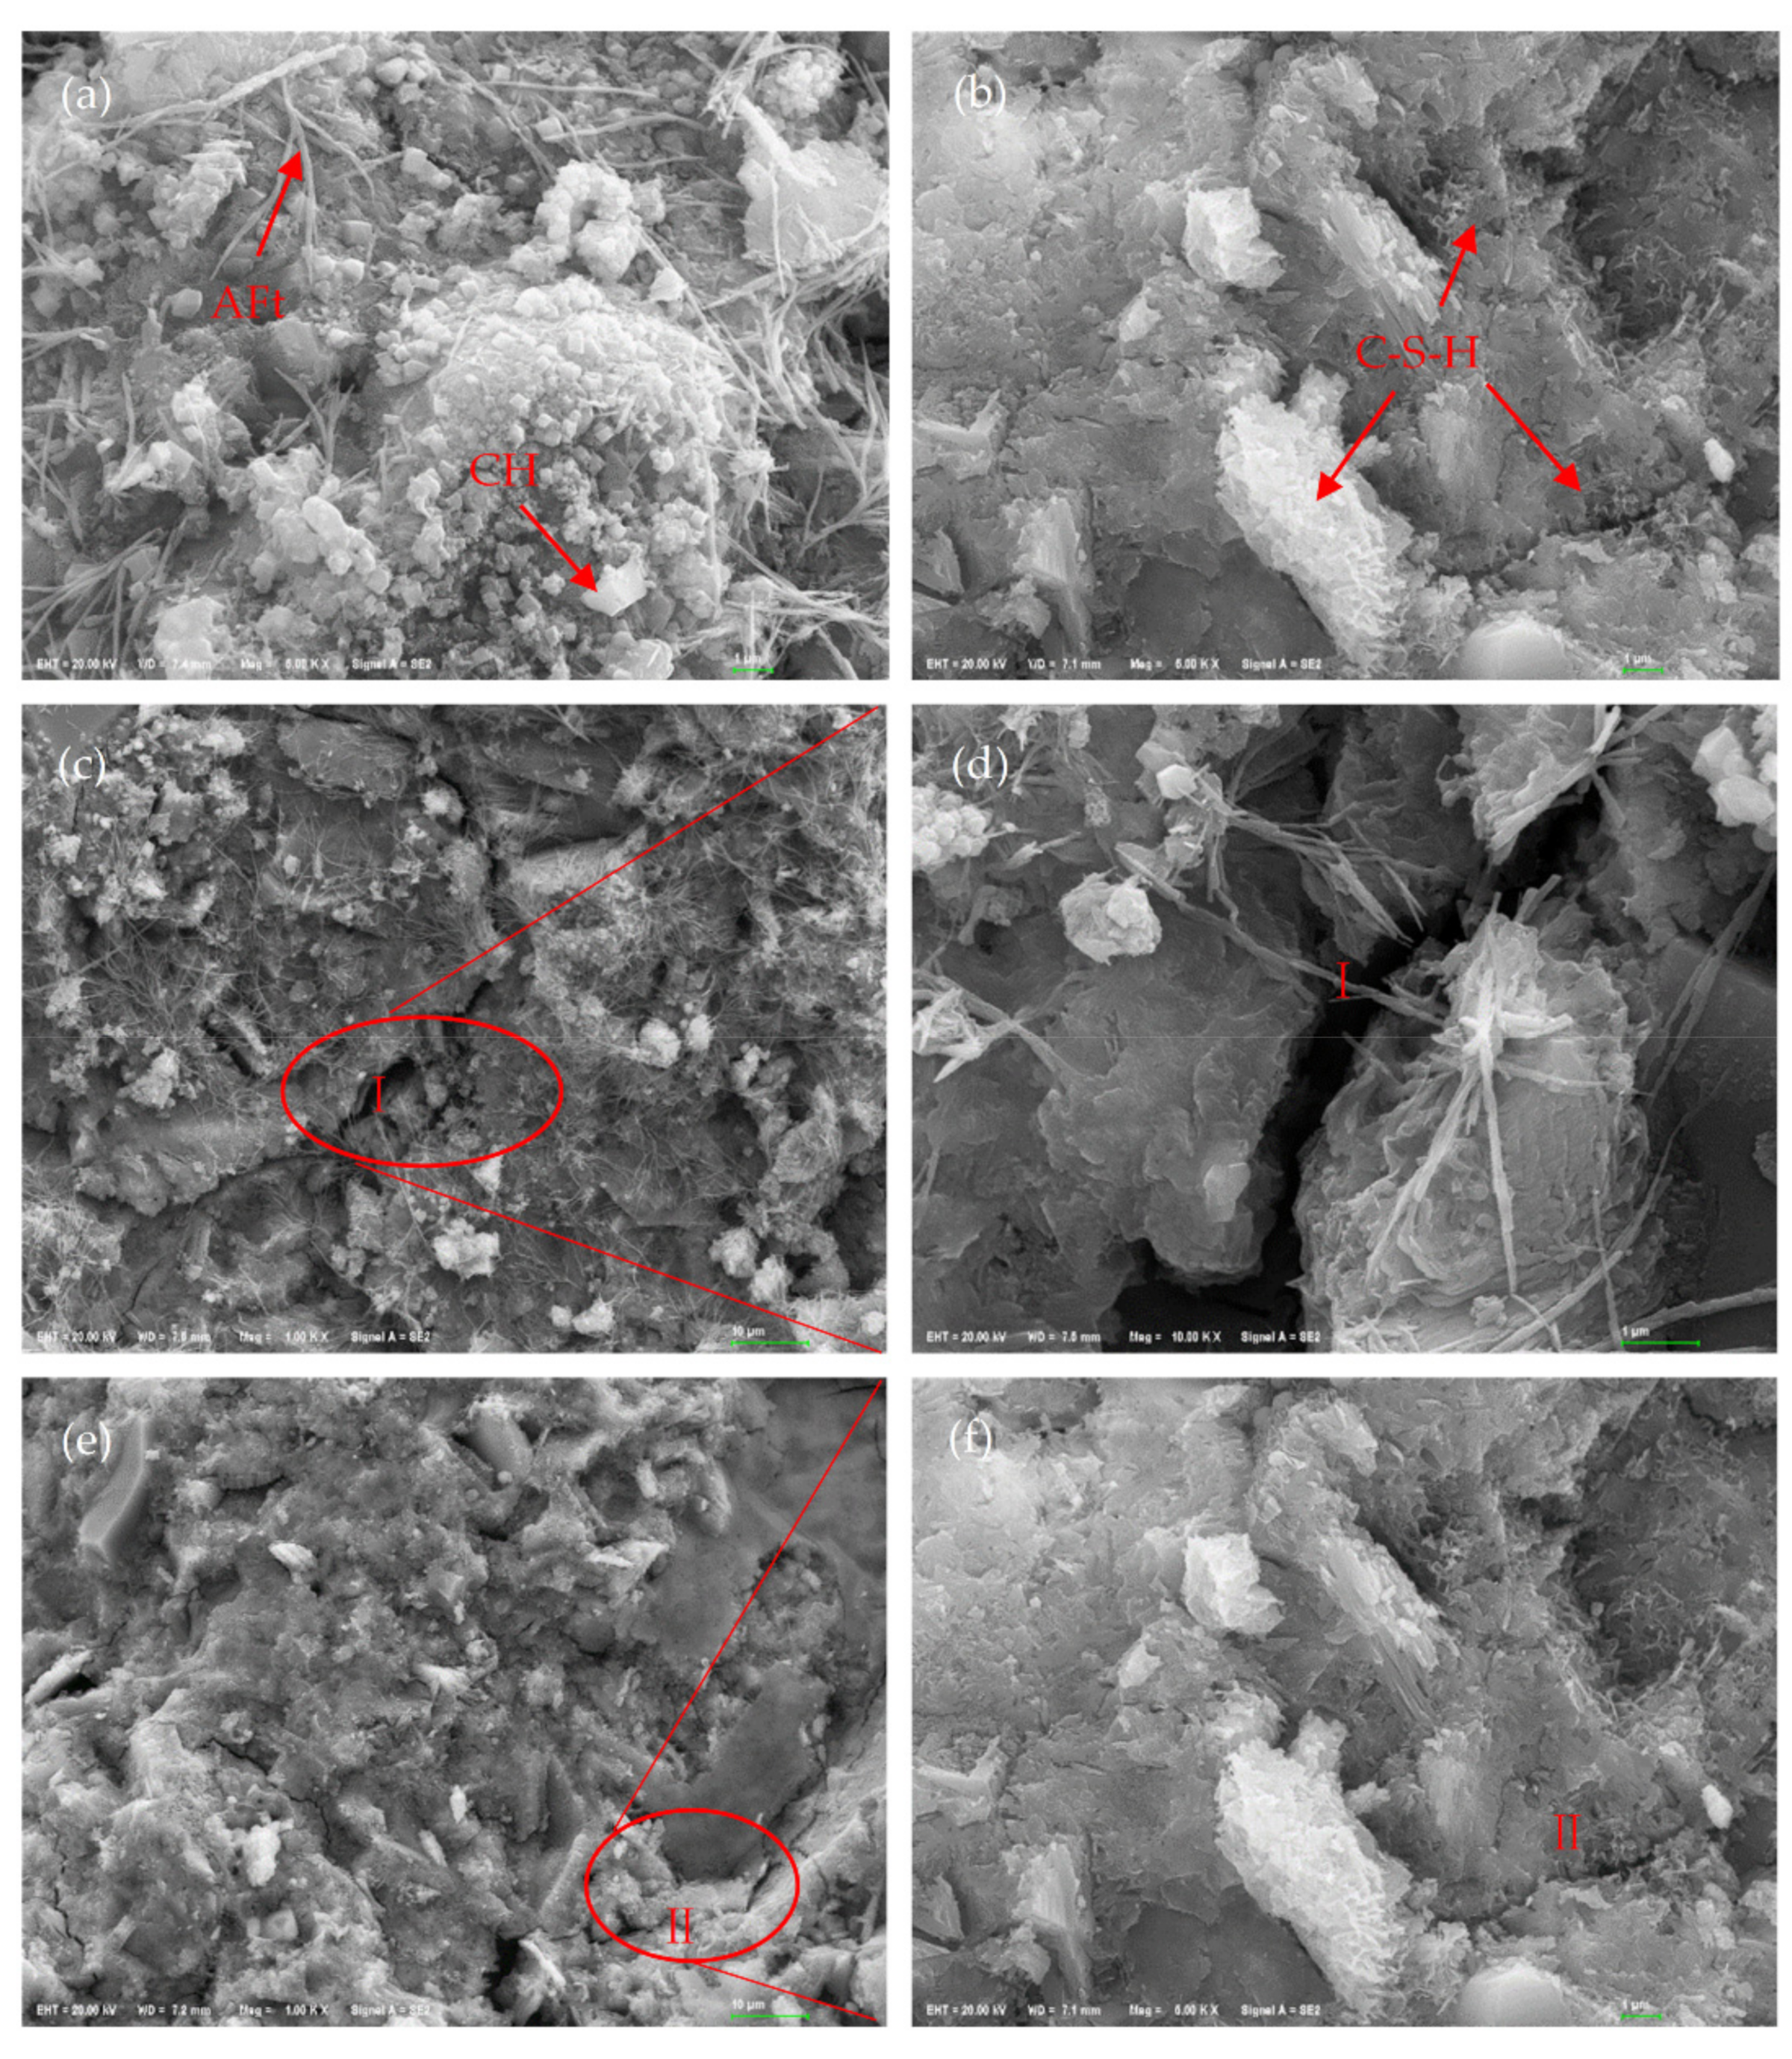
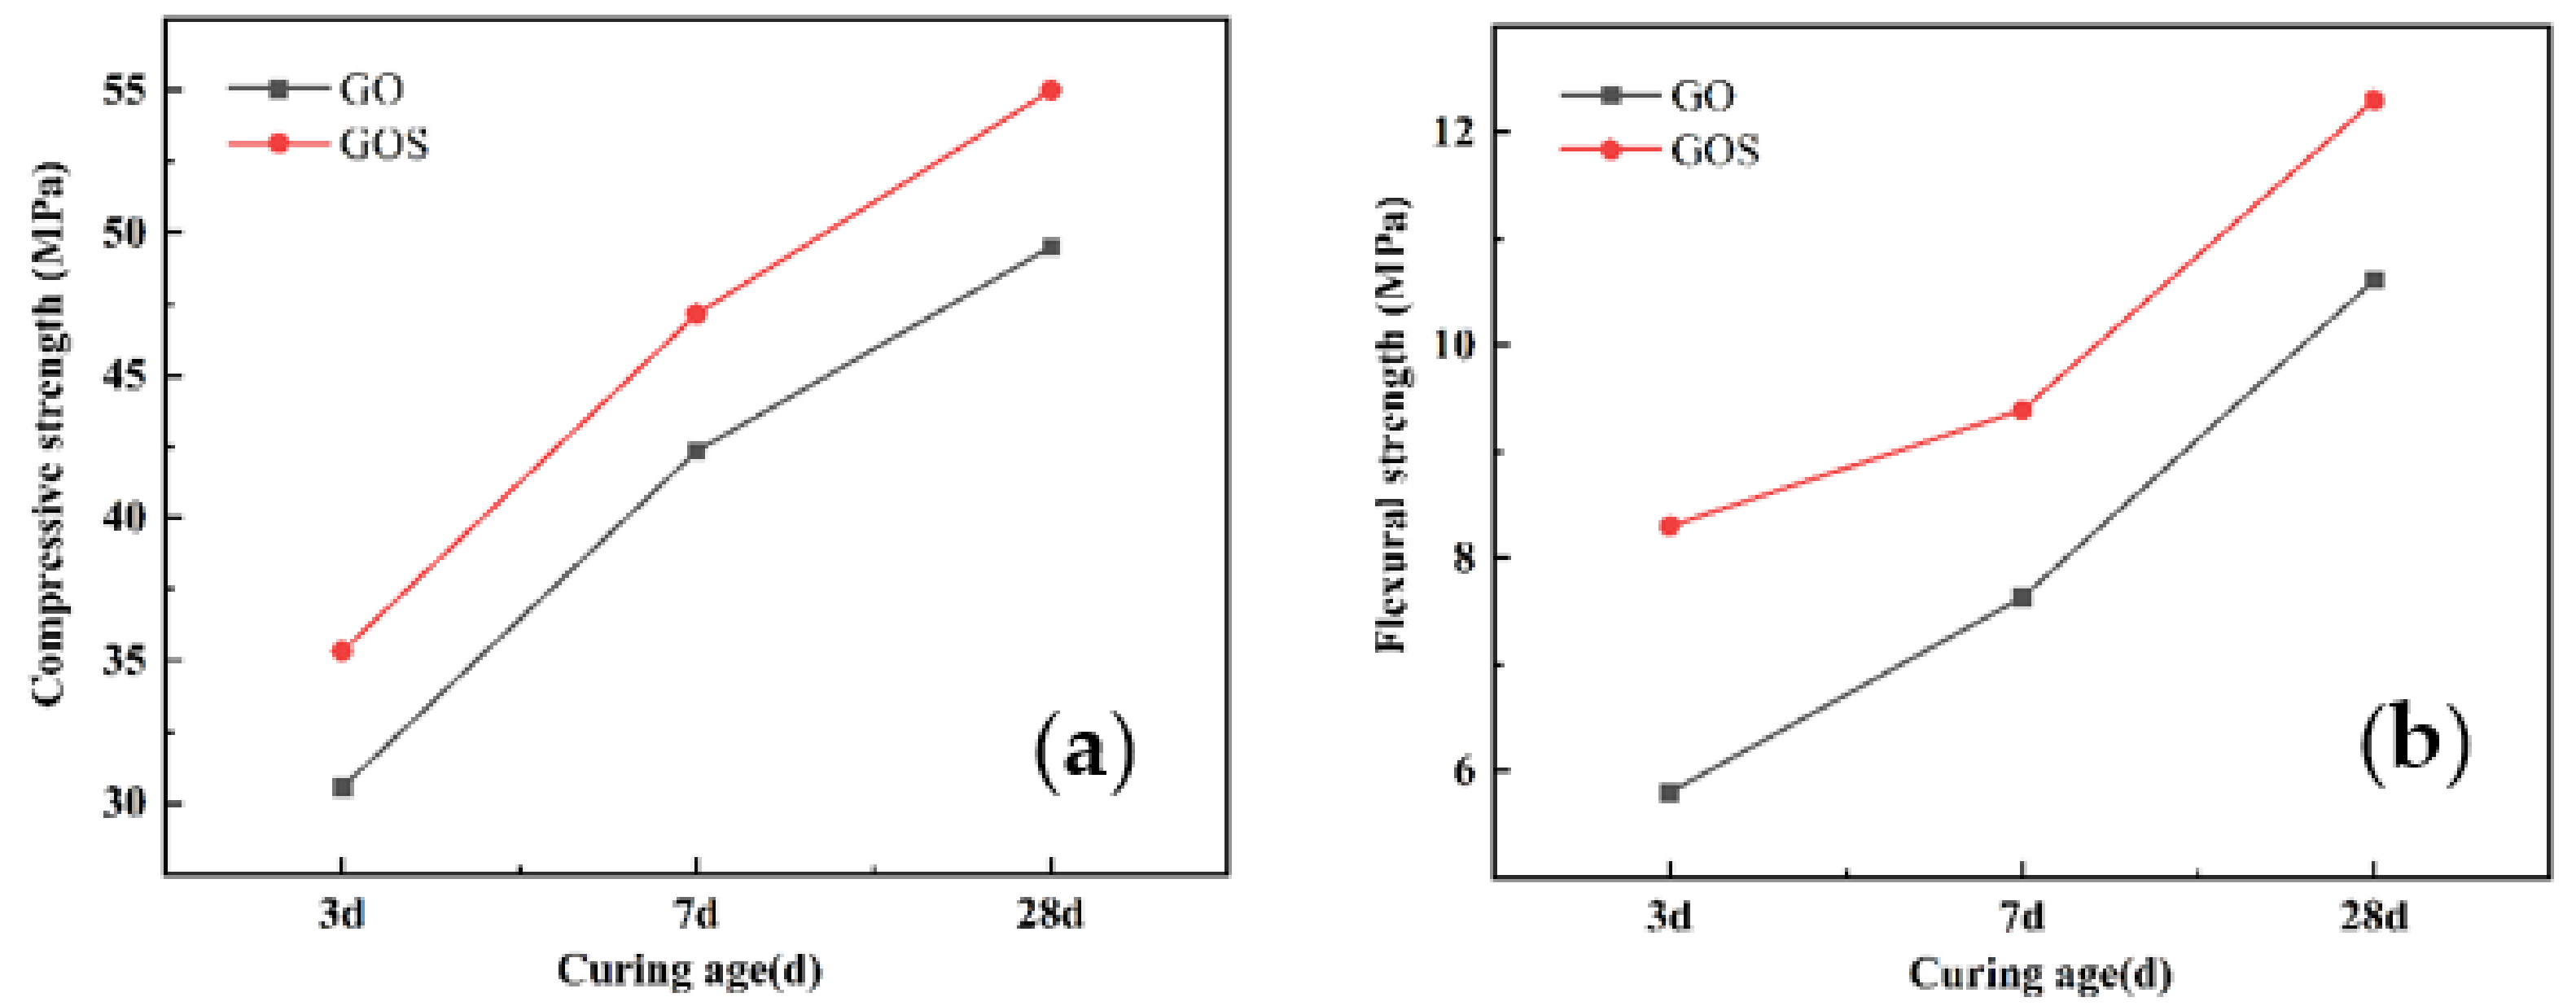
According to
Figure 17, compared with GO1 specimens, the compressive strength of GOS1 cement-based materials increased by 15.68%, 11.31%, and 11.11% after 3 d, 7 d, and 28 d, respectively; flexural strength increased by 43.1%, 23.07%, and 15.93%, respectively. This shows that the GOS can improve the flexural properties of GO cement-based materials. According to the previous discussion, the formation of GOS on the surface of GO coated with SiO
2 can effectively improve the dispersion of GO in cement-based materials, and the excellent dispersion can give full play to the nano-filling effect of GOS. Therefore, in the middle and later stages of hydration, the GOS that fills in the pores will consume CH to produce a secondary hydration reaction, resulting in more C-S-H gel. On the other hand, the C-S-H gel grown on the GOS layer is tightly connected, which can effectively prevent the propagation of microcracks and effectively improve the bending strength of cement-based materials [
33].
3.8. The Comprehensive Evaluation of the Impacts of GO and GOS on Cement-Based Materials through the Fuzzy Matrix
The fuzzy mathematical matrix was adopted to compare further and analyze the impact of GO and GOS to cement and its comprehensive performance [
49]; the main steps are shown below:
The matrix evaluation factors should be determined, F = {F1, F2, F3, F4, F5} = {F1(spreading), F2 (yield stress), F3 (equivalent plastic viscosity), F4 (compressive strength of 28 d), F5 (flexural strength of 28 d)}.
The evaluation matrix should be determined, U = {u
1, u
2, u
3, u
4} = {u
1 (very good), u
2 (good), u
3 (general), u
4 (poor)}, and the corresponding grade should be given respectively: α
1 = 4, α
2 = 3, α
3 = 2, α
4 = 1. The maximum and minimum values can be determined by the above performance tests. The set of evaluation factors and the standard evaluation value of the evaluation collection of fuzzy evaluation can be determined in an arithmetic sequence, as shown in
Table 7.
The comprehensive evaluation matrix R
5×4 was determined based on the grade of membership of comments assemble to the performance indexes of cement-based materials with different contents GO and GOS, the corresponding compressive evaluation matrix can be obtained as
The weight is highly crucial in fuzzy evaluation. It refers to the relative importance of the performance index in the comprehensive evaluation. In this paper, cement-based materials’ rheological properties, compressive strength, and flexural strength are the important performance indexes. Therefore, the weighing matrix will be w = {0.1, 0.2, 0.2, 0.25, 0.25}.
The evaluation results matrix B = w × R can be obtained from the comprehensive evaluation matrix and the weighing matrix; then, the comprehensive evaluation results can be obtained through the equation;
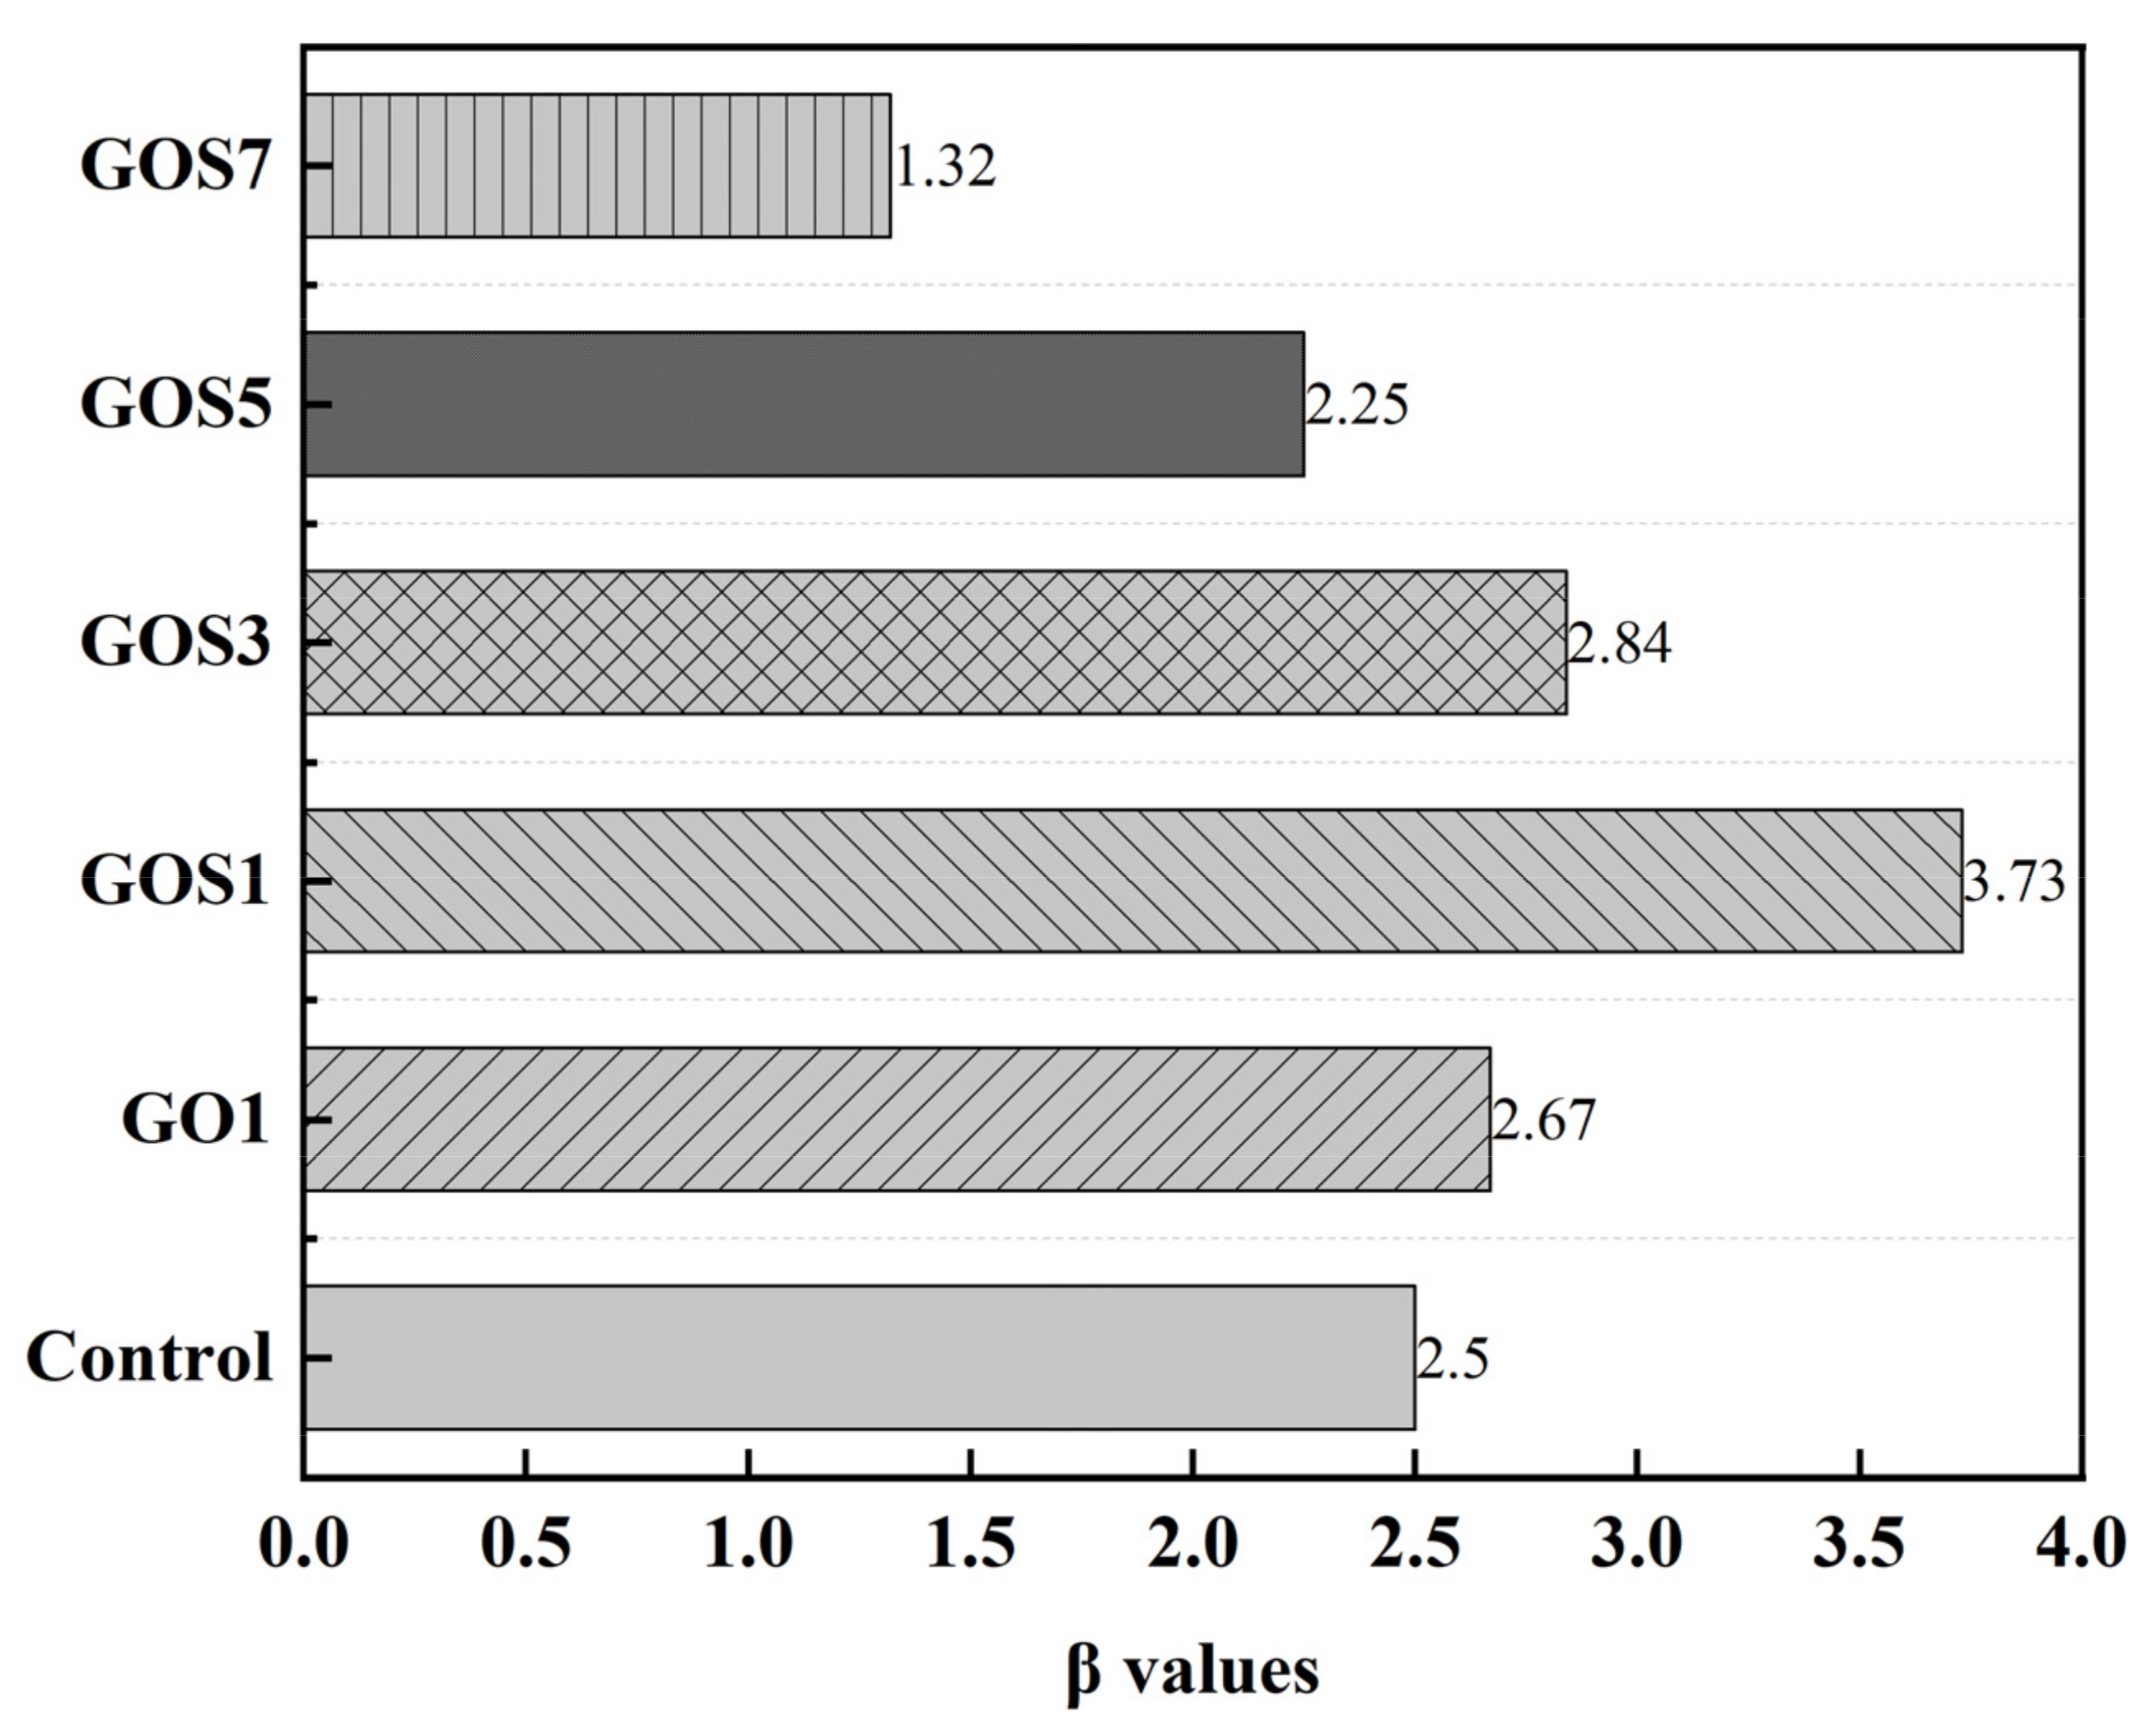
Figure 18 shows the scores.
The properties of GO and GOS cement-based materials were evaluated comprehensively by the fuzzy matrix method. Compared with GO1 cement-based materials, GOS1 cement-based materials have larger spreading, lower yield stress, and equivalent plastic viscosity; in addition, GOS1 cement-based materials also have a certain improvement in mechanical properties, especially the greatest increase in flexural strength. The comprehensive properties of GOS cement-based materials did not increase with the increase of GOS content. With the increase of GOS content, the spreading degree of cement-based materials decreased, the yield stress and equivalent plastic viscosity increased, and the improvement of mechanical properties also decreased. The final scores of the comprehensive evaluation are GOS1 > GOS3 > GO1 > Control > GOS5 > GOS7, indicating that the cement-based material with GOS1 added has better comprehensive performance.


