
A Comparison of Machine Learning Tools That Model the Splitting Tensile Strength of Self-Compacting Recycled Aggregate Concrete


Abstract
:
1. Introduction
Research Significance
2. Theoretical Background
2.1. Machine Learning Methods
2.1.1. EXtreme Gradient Boosting (XGBoost)
2.1.2. Gradient Boosting (GB)
2.1.3. Cat Boosting (CB)
2.1.4. Extra Trees Regressor (ETR)
3. Materials and Methods
3.1. Experimental Database
3.2. Data Pre-Processing
3.3. Data Visualization
3.4. Data Split
3.5. Model Evaluation
4. Results and Discussions
4.1. Comparison of the Predictive Performance of ML Models
4.2. Comparison of the Results of the ML Models
4.3. Sensitivity Analysis
5. Conclusions
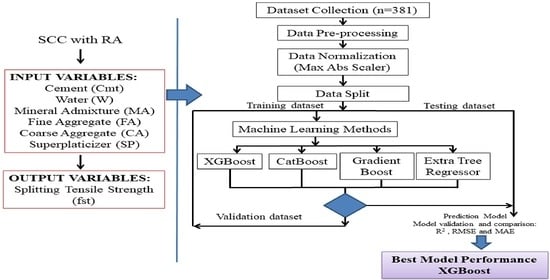
- For the development of the ML models: XG Boost, GB, CB, and ETR, a database of 381 samples from literature published in scientific journals was used. The samples were randomly divided into three data sets: training, validation, and test, each with 267 (70%), 57 (15%), and 57 (15%) samples, respectively.
- The four ML methods predicted the splitting tensile strength of SCC made with RA with satisfactory accuracy; the R2 values from the training data for XG Boost, GB, CB, and ETR were 0.9421; 0.9292; 0.9382, and 0.9484, respectively, with all models achieving a value greater than 0.75.
- XG Boost was the best performing model with the highest value of R2 (= 0.8423) from the test data set and the lowest values of RMSE (= 0.0581) and MAE (= 0.0443) in comparison with the GB, CB, and ETR models.
- The developed XG Boost model is therefore considered the best for predicting the 28-day splitting tensile strength of SCC made with RA.
- Sensitivity analysis revealed that cement is the input variable that contributes the most (30.07%) to predicting the splitting tensile strength of 28-day-old SCC made with RA. In contrast, water is the parameter that contributes the least (2.39%) towards the same prediction.
Author Contributions
Funding
Institutional Review Board Statement
Informed Consent Statement
Data Availability Statement
Conflicts of Interest
References
- Ahmad, A.; Ostrowski, K.A.; Maślak, M.; Farooq, F.; Mehmood, I.; Nafees, A. Comparative study of supervised machine learning algorithms for predicting the compressive strength of concrete at high temperature. Materials 2021, 14, 4222. [Google Scholar] [CrossRef] [PubMed]
- Silva, P.F.S.; Moita, G.F.; Arruda, V.F. Machine learning techniques to predict the compressive strength of concrete. Rev. Int. Metod. Numer. Para Calc. Y Diseño Ing. 2020, 36, 48. [Google Scholar] [CrossRef]
- Koya, B.P. Comparison of Different Machine Learning Algorithms to Predict Mechanical Properties of Concrete. Master’s Thesis, University of Victoria, Victoria, CA, Canada, 2021. Available online: http://hdl.handle.net/1828/12574 (accessed on 15 December 2021).
- Carro-López, D.; González-Fonteboa, B.; Martínez-Abella, F.; González-Taboada, I.; de Brito, J.; Varela-Puga, F. Proportioning, fresh-state properties and rheology of self-compacting concrete with fine recycled aggregates. Hormigón Y Acero 2018, 69, 213–221. [Google Scholar] [CrossRef]
- Ghalehnovi, M.; Roshan, N.; Hakak, E.; Shamsabadi, E.A.; de Brito, J. Effect of red mud (bauxite residue) as cement replacement on the properties of self-compacting concrete incorporating various fillers. J. Clean. Prod. 2019, 240, 118213. [Google Scholar] [CrossRef]
- Santos, S.A.; da Silva, P.R.; de Brito, J. Mechanical performance evaluation of self-compacting concrete with fine and coarse recycled aggregates from the precast industry. Materials 2017, 10, 904. [Google Scholar] [CrossRef] [PubMed]
- Santos, S.; da Silva, P.R.; de Brito, J. Self-compacting concrete with recycled aggregates—A literature review. J. Build. Eng. 2019, 22, 349–371. [Google Scholar] [CrossRef]
- Nieto Alcolea, D. Estudio de Hormigón Autocompactante con árido Reciclado. Escuela Técnica Superior de Ingeniería Civil Universidad Politécnica de Madrid, Madrid, España. 2015. Available online: https://dialnet.unirioja.es/servlet/tesis?codigo=115881 (accessed on 22 October 2021).
- Babajanzadeh, M.; Azizifar, V. Compressive strength prediction of self-compacting concrete incorporating silica fume using artificial intelligence methods. Civ. Eng. J. 2018, 4, 1542. [Google Scholar] [CrossRef]
- Belalia Douma, O.; Boukhatem, B.; Ghrici, M.; Tagnit-Hamou, A. Prediction of properties of self-compacting concrete containing fly ash using artificial neural network. Neural Comput. Appl. 2017, 28, 707–718. [Google Scholar] [CrossRef]
- Xu, J.; Zhao, X.; Yu, Y.; Xie, T.; Yang, G.; Xue, J. Parametric sensitivity analysis and modelling of mechanical properties of normal- and high-strength recycled aggregate concrete using grey theory, multiple nonlinear regression and artificial neural networks. Constr. Build. Mater. 2019, 211, 479–491. [Google Scholar] [CrossRef]
- Pacheco, J.; de Brito, J.; Chastre, C.; Evangelista, L. Uncertainty models of reinforced concrete beams in bending: Code comparison and recycled aggregate incorporation. J. Struct. Eng. 2019, 145, 04019013. [Google Scholar] [CrossRef]
- Martínez-García, R. Evaluación del uso de áridos reciclados de hormigón en la fabricación de hormigones autocompactantes y morteros de cemento. Ph.D. Thesis, Universidad de Leon, León, España, 2021. Available online: http://hdl.handle.net/10612/13363 (accessed on 5 September 2021).
- Farooq, F.; Czarnecki, S.; Niewiadomski, P.; Aslam, F.; Alabduljabbar, H.; Ostrowski, K.A.; Śliwa-Wieczorek, K.; Nowobilski, T.; Malazdrewicz, S. A comparative study for the prediction of the compressive strength of self-compacting concrete modified with fly ash. Materials 2021, 14, 4934. [Google Scholar] [CrossRef] [PubMed]
- Kaloop, M.R.; Samui, P.; Shafeek, M.; Hu, J.W. Estimating slump flow and compressive strength of self-compacting concrete using emotional neural networks. Appl. Sci. 2020, 10, 8543. [Google Scholar] [CrossRef]
- Koya, B.P.; Aneja, S.; Gupta, R.; Valeo, C. Comparative analysis of different machine learning algorithms to predict mechanical properties of concrete. Mech. Adv. Mater. Struct. 2021, 28, 1–18. [Google Scholar] [CrossRef]
- Bai, S.; Li, M.; Kong, R.; Han, S.; Li, H.; Qin, L. Data mining approach to construction productivity prediction for cutter suction dredgers. Autom. Constr. 2019, 105, 102833. [Google Scholar] [CrossRef]
- Ayhan, B.U.; Tokdemir, O.B. Safety assessment in megaprojects using artificial intelligence. Saf. Sci. 2019, 118, 273–287. [Google Scholar] [CrossRef]
- Lyngdoh, G.A.; Zaki, M.; Krishnan, N.M.A.; Das, S. Prediction of concrete strengths enabled by missing data imputation and interpretable machine learning. Cem. Concr. Compos. 2022, 128, 104414. [Google Scholar] [CrossRef]
- Behnood, A.; Golafshani, E.M. Machine learning study of the mechanical properties of concretes containing waste foundry sand. Constr. Build. Mater. 2020, 243, 118152. [Google Scholar] [CrossRef]
- Kovačević, M.; Lozančić, S.; Nyarko, E.K.; Hadzima-nyarko, M. Modeling of compressive strength of self-compacting rubberized concrete using machine learning. Materials 2021, 14, 4346. [Google Scholar] [CrossRef]
- Ahmad, A.; Farooq, F.; Niewiadomski, P.; Ostrowski, K.; Akbar, A.; Aslam, F.; Alyousef, R. Prediction of compressive strength of fly ash based concrete using individual and ensemble algorithm. Materials 2021, 14, 794. [Google Scholar] [CrossRef]
- Kumar, A.; Arora, H.C.; Kapoor, N.R.; Mohammed, M.A.; Kumar, K.; Majumdar, A.; Thinnukool, O. Compressive strength prediction of lightweight concrete: Machine learning models. Sustainability 2022, 14, 2404. [Google Scholar] [CrossRef]
- Zhang, X.; Akber, M.Z.; Zheng, W. Prediction of seven-day compressive strength of field concrete. Constr. Build. Mater. 2021, 305, 124604. [Google Scholar] [CrossRef]
- Song, Y.; Zhao, J.; Ostrowski, K.A.; Javed, M.F.; Ahmad, A.; Khan, M.I.; Aslam, F.; Kinasz, R. Prediction of compressive strength of fly-ash-based concrete using ensemble and non-ensemble supervised machine-learning approaches. Appl. Sci. 2022, 12, 361. [Google Scholar] [CrossRef]
- Sharafati, A.; Haji Seyed Asadollah, S.B.; Al-Ansari, N. Application of bagging ensemble model for predicting compressive strength of hollow concrete masonry prism. Ain Shams Eng. J. 2021, 12, 3521–3530. [Google Scholar] [CrossRef]
- Shang, M.; Li, H.; Ahmad, A.; Ahmad, W.; Ostrowski, K.A.; Aslam, F.; Joyklad, P.; Majka, T.M. Predicting the mechanical properties of RCA-based concrete using supervised machine learning algorithms. Materials 2022, 15, 647. [Google Scholar] [CrossRef] [PubMed]
- Shaqadan, A. Prediction of concrete mix strength using random forest model. Int. J. Appl. Eng. Res. 2016, 11, 11024–11029. Available online: https://www.researchgate.net/publication/311797168_Prediction_of_concrete_mix_strength_using_random_forest_model (accessed on 10 July 2021).
- Nguyen, K.T.; Nguyen, Q.; Le, A.-T.; Shin, J.; Lee, K. Analyzing the compressive strength of green fly ash based geopolymer concrete using experiment and machine learning approaches. Constr. Build. Mater. 2020, 247, 118581. [Google Scholar] [CrossRef]
- Nguyen, S.T.; Wakim, J.; Dong, Q.; Minh Vu, N.; Nguyen, T.-D.; Nguyen, T.-T. Predicting the compressive strength of concrete from its compositions and age using the extreme gradient boosting method. Constr. Build. Mater. 2020, 260, 119757. [Google Scholar] [CrossRef]
- Kapoor, K.; Singh, S.P.; Singh, B. Water permeation properties of self compacting concrete made with coarse and fine recycled concrete aggregates. Int. J. Civ. Eng. 2016, 16, 47–56. [Google Scholar] [CrossRef]
- Awoyera, P.O.; Kirgiz, M.S.; Viloria, A.; Ovallos-Gazabon, D. Estimating strength properties of geopolymer self-compacting concrete using machine learning techniques. J. Mater. Res. Technol 2020, 9, 9016–9028. [Google Scholar] [CrossRef]
- Golafshani, E.; Pazouki, G. Predicting the compressive strength of self-compacting concrete containing fly ash using a hybrid artificial intelligence method. Comput. Concr. 2018, 22, 419–437. [Google Scholar] [CrossRef]
- Nguyen, T.T.; Pham Duy, H.; Pham Thanh, T.; Hiep Vu, H. Compressive strength evaluation of fiber-reinforced high-strength self-compacting concrete with artificial intelligence. Adv. Civ. Eng. 2020, 2020, 12. [Google Scholar] [CrossRef]
- Mazloom, M.; Yoosefi, M.M. Predicting the indirect tensile strength of self-compacting concrete using artificial neural networks. Comput. Concr. 2013, 12, 285–301. [Google Scholar] [CrossRef]
- Bui, D.K.; Nguyen, T.; Chou, J.S.; Nguyen-Xuan, H.; Ngo, T.D. A modified firefly algorithm-artificial neural network expert system for predicting compressive and tensile strength of high-performance concrete. Constr. Build. Mater. 2018, 180, 320–333. [Google Scholar] [CrossRef]
- Nguyen, H.; Vu, T.; Vo, T.P.; Thai, H.T. Efficient machine learning models for prediction of concrete strength. Constr. Build. Mater. 2021, 266, 120950. [Google Scholar] [CrossRef]
- Yan, K.; Xu, H.; Shen, G.; Liu, P. Prediction of splitting tensile strength from cylinder compressive strength of concrete by support vector machine. Adv. Mater. Sci. Eng. 2013, 2013, 597257. [Google Scholar] [CrossRef]
- Eluozo, S. Model prediction on split tensile strength of concrete from course aggregate and granite modified with metakaolin substance. Mater. Sci. Eng. J. 2019, 2, 1009. Available online: https://www.remedypublications.com/material-science-engineering-journal-abstract.php?aid=5374 (accessed on 11 August 2021).
- Druta, C. Tensile Strength and Bonding Characteristics of Self Compacting Concrete. Master’s Thesis, Luisiana State University and Agricultural and Mechanical College, Baton Rouge, LA, USA, 2013. Available online: https://digitalcommons.lsu.edu/gradschool_theses (accessed on 2 June 2021).
- Nazari, A.; Riahi, S. Computer-aided design of the effects of Fe2O3 nanoparticles on split tensile strength and water permeability of high strength concrete. Mater. Des. 2011, 32, 3966–3979. [Google Scholar] [CrossRef]
- Behnood, A.; Verian, K.P.; Modiri Gharehveran, M. Evaluation of the splitting tensile strength in plain and steel fiber-reinforced concrete based on the compressive strength. Constr. Build. Mater. 2015, 98, 519–529. [Google Scholar] [CrossRef]
- Nagarajan, D.; Rajagopal, T.; Meyappan, N. A Comparative Study on Prediction Models for Strength Properties of LWA Concrete Using Artificial Neural Network. Rev. Constr. 2020, 19, 103–111. [Google Scholar] [CrossRef]
- Guo, P.; Meng, W.; Xu, M.; Li, V.C.; Bao, Y. Predicting mechanical properties of high-performance fiber-reinforced cementitious composites by integrating micromechanics and machine learning. Materials 2021, 14, 3143. [Google Scholar] [CrossRef]
- Shivaraj, M.; Ravi Kumar, H.; Prema Kumar, W.P.; Preetham, S. Prediction of compressive, flexural and splitting tensile strengths of concrete using machine learning tools. Int. J. Eng. Res. 2015, 4, 893–897. [Google Scholar] [CrossRef]
- Ray, S.; Haque, M.; Ahmed, T.; Nahin, T.T. Comparison of artificial neural network (ANN) and response surface methodology (RSM) in predicting the compressive and splitting tensile strength of concrete prepared with glass waste and tin (Sn) can fiber. J. King Saud Univ. Eng. Sci. 2021; in press. [Google Scholar] [CrossRef]
- Ray, S.; Haque, M.; Rahman, M.M.; Sakib, M.N.; Al Rakib, K. Experimental investigation and SVM-based prediction of compressive and splitting tensile strength of ceramic waste aggregate concrete. J. King Saud Univ. Eng. Sci. 2021, in press. [Google Scholar] [CrossRef]
- Guo, Z.; Jiang, T.; Zhang, J.; Kong, X.; Chen, C.; Lehman, D. Mechanical and durability properties of sustainable self-compacting concrete with recycled concrete aggregate and fly ash, slag and silica fume. Constr. Build. Mater. 2020, 231, 117115. [Google Scholar] [CrossRef]
- Zhang, Q.; Habibi, H. Comparison of data mining methods to Ppedict mechanical properties of concrete with fly ash and alccofine. J. Mater. Res. Technol. 2021, 15, 2188–2201. [Google Scholar] [CrossRef]
- Chen, T.; Guestrin, C. XGBoost: A scalable Tree Boosting system. In Proceedings of the 22nd ACM SIGKDD International Conference on Knowledge Discovery and Data Mining—KDD’16, San Francisco, CA, USA, 13–17 August 2016; pp. 785–794. [Google Scholar] [CrossRef]
- Guelman, L. Gradient boosting trees for auto insurance loss cost modeling and prediction. Expert Syst. Appl. 2012, 39, 3659–3667. [Google Scholar] [CrossRef]
- Chang, Y.-C.; Chang, K.-H.; Wu, G.-J. Application of eXtreme gradient boosting trees in the construction of credit risk assessment models for financial institutions. Appl. Soft. Comput. 2018, 73, 914–920. [Google Scholar] [CrossRef]
- Kang, M.C.; Yoo, D.Y.; Gupta, R. Machine learning-based prediction for compressive and flexural strengths of steel fiber-reinforced concrete. Constr. Build. Mater. 2021, 266, 121117. [Google Scholar] [CrossRef]
- Marani, A.; Nehdi, M. Machine learning prediction of compressive strength for phase change materials integrated cementitious composites. Constr. Build. Mater. 2020, 265, 120286. [Google Scholar] [CrossRef]
- Olu-Ajayi, R.; Alaka, H.; Sulaimon, I.; Sunmola, F.; Ajayi, S. Building energy consumption prediction for residential buildings using deep learning and other machine learning techniques. J. Build. Eng. 2022, 45, 103406. [Google Scholar] [CrossRef]
- Friedman, J.H. Greedy function approximation: A gradient boosting machine. Ann. Stat. 2001, 29, 1189–1232. [Google Scholar] [CrossRef]
- Ben Jabeur, S.; Gharib, C.; Mefteh-Wali, S.; Ben Arfi, W. CatBoost model and artificial intelligence techniques for corporate failure prediction. Technol. Forecast. Soc. Chang. 2021, 166, 120658. [Google Scholar] [CrossRef]
- Friedman, J.H. Stochastic gradient boosting. Comput. Stat. Data Anal. 2002, 38, 367–378. [Google Scholar] [CrossRef]
- Prokhorenkova, L.; Gusev, G.; Vorobev, A.; Dorogush, A.V.; Gulin, A. Catboost: Unbiased boosting with categorical features. In Proceedings of the NIPS’18 Proceedings of the 32nd International Conference on Neural Information Processing Systems, Montréal, QC, Canada, 3 December 2018; pp. 6638–6648. [Google Scholar] [CrossRef]
- Dorogush, A.V.; Ershov, V.; Gulin, A. CatBoost: Gradient boosting with categorical features support. arXiv 2018. [Google Scholar] [CrossRef]
- Al Daoud, E. Comparison-between-xgboost-lightgbm-and-catboost-using-a-home-credit-dataset. Int. J. Comput. Inf. Eng. 2019, 13, 6–10. [Google Scholar] [CrossRef]
- Geurts, P.; Ernst, D.; Wehenkel, L. Extremely randomized trees. Mach. Learn. 2006, 63, 3–42. [Google Scholar] [CrossRef]
- Ahmad, M.W.; Mourshed, M.; Rezgui, Y. Tree-based ensemble methods for predicting PV power generation and their comparison with support vector regression. Energy 2018, 164, 465–474. [Google Scholar] [CrossRef]
- Ahmad, M.W.; Reynolds, J.; Rezgui, Y. Predictive modelling for solar thermal energy systems: A comparison of support vector regression, random forest, extra trees and regression trees. J. Clean. Prod. 2018, 203, 810–821. [Google Scholar] [CrossRef]
- Ali, E.E.; Al-Tersawy, S.H. Recycled glass as a partial replacement for fine aggregate in self compacting concrete. Constr. Build. Mater. 2012, 35, 785–791. [Google Scholar] [CrossRef]
- Nieto, D.; Dapena, E.; Alejos, P.; Olmedo, J.; Pérez, D. Properties of self-compacting concrete prepared with coarse recycled concrete aggregates and different water: Cement ratios. J. Mater. Civ. Eng. 2019, 31, 04018376. [Google Scholar] [CrossRef]
- Aslani, F.; Ma, G.; Yim Wan, D.L.; Muselin, G. Development of high-performance self-compacting concrete using waste recycled concrete aggregates and rubber granules. J. Clean. Prod. 2018, 182, 553–566. [Google Scholar] [CrossRef]
- Nili, M.; Sasanipour, H.; Aslani, F. The effect of fine and coarse recycled aggregates on fresh and mechanical properties of self-compacting concrete. Materials 2019, 12, 1120. [Google Scholar] [CrossRef]
- Babalola, O.E.; Awoyera, P.O.; Tran, M.T.; Le, D.H.; Olalusi, O.B.; Viloria, A.; Ovallos-Gazabon, D. Mechanical and durability properties of recycled aggregate concrete with ternary binder system and optimized mix proportion. J. Mater. Res. Technol. 2020, 9, 6521–6532. [Google Scholar] [CrossRef]
- Pan, Z.; Zhou, J.; Jiang, X.; Xu, Y.; Jin, R.; Ma, J.; Zhuang, Y.; Diao, Z.; Zhang, S.; Si, Q.; et al. Investigating the effects of steel slag powder on the properties of self-compacting concrete with recycled aggregates. Constr. Build. Mater. 2019, 200, 570–577. [Google Scholar] [CrossRef]
- Bahrami, N.; Zohrabi, M.; Mahmoudy, S.A.; Akbari, M. Optimum recycled concrete aggregate and micro-silica content in self-compacting concrete: Rheological, mechanical and microstructural properties. J. Build. Eng. 2020, 31, 101361. [Google Scholar] [CrossRef]
- Revathi, P.; Selvi, R.S.; Velin, S.S. Investigations on fresh and hardened properties of recycled aggregate self compacting concrete. J. Inst. Eng. Ser. A 2013, 94, 179–185. [Google Scholar] [CrossRef]
- Behera, M.; Minocha, A.K.; Bhattacharyya, S.K. Flow behavior, microstructure, strength and shrinkage properties of self-compacting concrete incorporating recycled fine aggregate. Constr. Build. Mater. 2019, 228, 116819. [Google Scholar] [CrossRef]
- Revilla-Cuesta, V.; Ortega-López, V.; Skaf, M.; Manso, J. Effect of fine recycled concrete aggregate on the mechanical behavior of self-compacting concrete. Constr. Build. Mater. 2020, 263, 120671. [Google Scholar] [CrossRef]
- Chakkamalayath, J.; Joseph, A.; Al-Baghli, H.; Hamadah, O.; Dashti; Abdulmalek, N. Performance evaluation of self-compacting concrete containing volcanic ash and recycled coarse aggregates. Asian J. Civ. Eng. 2020, 21, 815–827. [Google Scholar] [CrossRef]
- Sadeghi-Nik, A.; Berenjian, J.; Alimohammadi, S.; Lotfi-Omran, O.; Sadeghi-Nik, A.; Karimaei, M. The effect of recycled concrete aggregates and metakaolin on the mechanical properties of self-compacting concrete containing nanoparticles, Iran. J. Sci. Technol. Trans. Civ. Eng. 2019, 45, 503–515. [Google Scholar] [CrossRef]
- Duan, Z.; Singh, A.; Xiao, J.; Hou, S. Combined use of recycled powder and recycled coarse aggregate derived from construction and demolition waste in self-compacting concrete. Constr. Build. Mater. 2020, 254, 119323. [Google Scholar] [CrossRef]
- Señas, L.; Priano, C.; Marfil, S. Influence of recycled aggregates on properties of self-consolidating concretes. Constr. Build. Mater. 2016, 113, 498–505. [Google Scholar] [CrossRef]
- Fiol, F.; Thomas, C.; Muñoz, C.; Ortega-López, V.; Manso, J.M. The influence of recycled aggregates from precast elements on the mechanical properties of structural self-compacting concrete. Constr. Build. Mater. 2018, 182, 309–323. [Google Scholar] [CrossRef]
- Gesoglu, M.; Güneyisi, E.; Öz, H.Ö.; Taha, I.; Yasemin, M.T. Failure characteristics of self-compacting concretes made with recycled aggregates. Constr. Build. Mater. 2015, 98, 334–344. [Google Scholar] [CrossRef]
- Grdic, Z.J.; Toplicic-Curcic, G.A.; Despotovic, I.M.; Ristic, N.S. Properties of self-compacting concrete prepared with coarse recycled concrete aggregate. Constr. Build. Mater. 2010, 24, 1129–1133. [Google Scholar] [CrossRef]
- Güneyisi, E.; Gesoǧlu, M.; Algin, Z.; Yazici, H. Effect of surface treatment methods on the properties of self-compacting concrete with recycled aggregate. Constr. Build. Mater. 2014, 64, 172–183. [Google Scholar] [CrossRef]
- Katar, I.; Ibrahim, Y.; Malik, M.; Khahro, S. Mechanical properties of concrete with recycled concrete aggregate and fly ash. Recycling 2021, 6, 23. [Google Scholar] [CrossRef]
- Khodair, Y.; Luqman. Self-compacting concrete using recycled asphalt pavement and recycled concrete aggregate. J. Build. Eng. 2017, 12, 282–287. [Google Scholar] [CrossRef]
- Kou, S.C.; Poon, C.S. Properties of self-compacting concrete prepared with coarse and fine recycled concrete aggregates. Cem. Concr. Compos. 2009, 31, 622–627. [Google Scholar] [CrossRef]
- Krishna, S.S.R.; Vani, V.S.; Baba, S.K.V. Studies on mechanical properties of ternary blended self compacting concrete using different percentages of recycled aggregate. Int. J. Civ. Eng. Technol. 2018, 9, 1672–1680. [Google Scholar] [CrossRef]
- Singh, P.; Usman, M.; Chandramauli, A.; Kumar, D. Brief experimental study on self compacting concrete. Int. J. Civ. Eng. Technol. 2018, 9, 77–82. [Google Scholar] [CrossRef]
- Long, W.; Shi, J.; Wang, W.; Fang, X. Shrinkage of hybrid fiber reinforced self-consolidating concrete with recycled aggregate. In Proceedings of the SCC-2016 8th International RILEM Symposium on Self-Compacting Concete, Flowing Towad Sustainability, Washington, DC, USA, 15–18 May 2016; pp. 751–762. Available online: https://cies.mst.edu/media/research/cies/documents/SCC2016%20NPR%20Conference%20Proceedings.pdf (accessed on 2 June 2021).
- Mahakavi, P.; Chithra, R. Effect of recycled coarse aggregate and manufactured sand in self compacting concrete. Aust. J. Struct. Eng. 2020, 21, 33–43. [Google Scholar] [CrossRef]
- Manzi, S.; Mazzotti, C.; Bignozzi, M.C. Self-compacting concrete with recycled concrete aggregate: Study of the long-term properties. Constr. Build. Mater. 2017, 157, 582–590. [Google Scholar] [CrossRef]
- Martínez-García, R.; Guerra-Romero, M.I.; Morán-Del Pozo, J.M.; de Brito, J.; Juan-Valdés, A. Recycling aggregates for self-compacting concrete production-a feasible option. Materials 2020, 13, 868. [Google Scholar] [CrossRef] [PubMed]
- Liu, Y.; Chen, H.; Jia Wang, X.; Wu, X. Energy consumption prediction and diagnosis of public buildings based on support vector machine learning: A case study in China. J. Clean. Prod. 2020, 272, 122542. [Google Scholar] [CrossRef]
- Alshdaifat, E.; Alshdaifat, D.; Alsarhan, A.; Hussein, F.; El-Salhi, S.M.F.S. The effect of preprocessing techniques, applied to numeric features, on classification algorithms’ performance. Data 2021, 6, 11. [Google Scholar] [CrossRef]
- Özkan, Y.; Demirarslan, M.; Suner, A. Effect of data preprocessing on ensemble learning for classification in disease diagnosis. Commun. Stat. Simul. Comput. 2022, 51, 1–21. [Google Scholar] [CrossRef]
- Rathakrishnan, V.; Beddu, S.; Ahmed, A.N. Comparison studies between machine learning optimisation technique on predicting concrete compressive strength. Res. Sq. 2021, 54. [Google Scholar] [CrossRef]
- Hassan, A.N.; El-Hag, A. Two-layer ensemble-based soft voting classifier for transformer oil interfacial tension prediction. Energies 2020, 13, 1735. [Google Scholar] [CrossRef]
- Nafees, A.; Javed, M.F.; Khan, S.; Nazir, K.; Farooq, F.; Aslam, F.; Musarat, M.A.; Vatin, N.I. Predictive modeling of mechanical properties of silica fume-based green concrete using artificial intelligence approaches: MLPNN, ANFIS and GEP. Materials 2021, 14, 7531. [Google Scholar] [CrossRef]
- Nafees, A.; Amin, M.N.; Khan, K.; Nazir, K.; Ali, M.; Javed, M.F.; Aslam, F.; Musarat, M.A.; Vatin, N.I. Modeling of mechanical properties of silica fume-based green concrete using machine learning techniques. Polymers 2022, 14, 30. [Google Scholar] [CrossRef]
- Ray, S.; Rahman, M.M.; Haque, M.; Hasan, M.W.; Alam, M.M. Performance evaluation of SVM and GBM in predicting compressive and splitting tensile strength of concrete prepared with ceramic waste and nylon fiber. J. King Saud Univ. Eng. Sci. 2021, in press. [CrossRef]
- Song, H.; Ahmad, A.; Farooq, F.; Ostrowski, K.A.; Maślak, M.; Czarnecki, S.; Aslam, F. Predicting the compressive strength of concrete with fly ash admixture using machine learning algorithms. Constr. Build. Mater. 2021, 308, 125021. [Google Scholar] [CrossRef]
- Schermelleh-Engel, K.; Moosbrugger, H.; Müller, H. Evaluating the fit of structural equation models: Tests of significance and descriptive goodness-of-fit measures. MPR-Online 2003, 8, 23–74. Available online: https://www.researchgate.net/publication/251060246_Evaluating_the_Fit_of_Structural_Equation_Models_Tests_of_Significance_and_Descriptive_Goodness-of-Fit_Measures (accessed on 12 February 2022).


| No | Reference | # Mix | % Data | No | Reference | # Mix | % Data |
|---|---|---|---|---|---|---|---|
| 1 | Ali et al., 2012 [65] | 18 | 4.73 | 22 | Nieto et al., 2019 [66] | 22 | 5.78 |
| 2 | Aslani et al., 2018 [67] | 15 | 3.94 | 23 | Nili et al., 2019 [68] | 10 | 2.63 |
| 3 | Babalola et al., 2020 [69] | 14 | 3.68 | 24 | Pan et al., 2019 [70] | 6 | 1.57 |
| 4 | Bahrami et al., 2020 [71] | 10 | 2.63 | 25 | Revathi et al., 2013 [72] | 5 | 1.31 |
| 5 | Behera et al., 2019 [73] | 6 | 1.57 | 26 | Revilla Cuesta et al., 2020 [74] | 5 | 1.31 |
| 6 | Chakkamalayath et al., 2020 [75] | 6 | 1.57 | 27 | Sadeghi-Nik et al., 2019 [76] | 12 | 3.15 |
| 7 | Duan et al., 2020 [77] | 10 | 2.63 | 28 | Señas et al., 2016 [78] | 6 | 1.57 |
| 8 | Fiol et al., 2018 [79] | 12 | 2.33 | 29 | Sharifi et al., 2013 | 6 | 1.57 |
| 9 | Gesoglu et al., 2015 [80] | 24 | 6.3 | 30 | Sherif and Ali, 2014 | 15 | 3.94 |
| 10 | Grdic et al., 2010 [81] | 3 | 0.79 | 31 | Silva et al., 2016 | 5 | 1.31 |
| 11 | Guneyisi et al., 2014 [82] | 5 | 1.31 | 32 | Singh et al., 2019 | 12 | 3.15 |
| 12 | Guo et al., 2020 [48] | 11 | 2.89 | 33 | Sun et al., 2020 | 10 | 2.63 |
| 13 | Katar et al., 2021 [83] | 4 | 1.05 | 34 | Surendar et al., 2021 | 7 | 1.84 |
| 14 | Khodair et al., 2017 [84] | 20 | 5.25 | 35 | Tang et al., 2016 | 5 | 1.31 |
| 15 | Kou et al., 2009 [85] | 13 | 3.41 | 36 | Thomas et al., 2016 | 4 | 1.05 |
| 16 | Krishna et al., 2018 [86] | 5 | 1.31 | 37 | Tuyan et al., 2014 | 12 | 3.15 |
| 17 | Kumar et al., 2018 [87] | 4 | 1.05 | 38 | Uygunoglu et al., 2014 | 8 | 2.10 |
| 18 | Long et al., 2016 [88] | 4 | 1.05 | 39 | Wang et al., 2020 | 5 | 1.31 |
| 19 | Mahakavi and Chitra, 2019 [89] | 25 | 6.56 | 40 | Yu et al., 2014 | 3 | 0.79 |
| 20 | Manzi et al., 2017 [90] | 4 | 1.05 | 41 | Zhou et al., 2013 | 6 | 1.57 |
| 21 | Martínez-García et al., 2020 [91] | 4 | 1.05 | Total | 381 | 100 |
| Parameter | Cmt (kg/m3) | MA (kg/m3) | W (kg/m3) | FA (kg/m3) | CA (kg/m3) | SP (kg/m3) | Fst (MPa) |
|---|---|---|---|---|---|---|---|
| Min 1 | 78.00 | 0.00 | 45.50 | 532.20 | 328.00 | 0.00 | 0.96 |
| Max 2 | 550.00 | 515.00 | 246.00 | 1200.00 | 1170.00 | 16.00 | 7.20 |
| Mean | 368.73 | 138.26 | 167.29 | 844.71 | 796.05 | 5.07 | 3.52 |
| SD 3 | 98.38 | 94.94 | 31.01 | 130.52 | 154.06 | 3.12 | 1.00 |
| As 4 | −0.849 | 0.396 | −0.365 | 0.593 | −0.292 | 0.852 | 0.896 |
| K 5 | 0.252 | −0.280 | 1.696 | 0.728 | 1.173 | 1.047 | 1.477 |
| Data Set | Parameter | Cmt | MA | W | FA | CA | SP | fst |
|---|---|---|---|---|---|---|---|---|
| Training | Unit | kg/m3 | kg/m3 | kg/m3 | kg/m3 | kg/m3 | kg/m3 | MPa |
| Min 1 | 94.00 | 0.00 | 45.50 | 581.00 | 328.00 | 0.00 | 1.40 | |
| Max 2 | 520.00 | 390.00 | 246.00 | 1200.00 | 1170.00 | 16.00 | 7.10 | |
| Mean | 371.83 | 135.10 | 168.03 | 846.72 | 790.32 | 4.83 | 3.51 | |
| SD 3 | 93.32 | 92.02 | 31.63 | 129.38 | 154.51 | 2.91 | 0.99 | |
| As 4 | −0.91 | 0.30 | −0.20 | 0.695 | −0.53 | 0.62 | 0.91 | |
| K 5 | 0.52 | −0.68 | 1.60 | 0.79 | 1.35 | 0.53 | 0.15 | |
| Validation | Min 1 | 78.00 | 0.00 | 45.50 | 532.50 | 335.00 | 0.00 | 0.96 |
| Max 2 | 520.00 | 515.00 | 246.00 | 1200.00 | 1170.00 | 16.00 | 6.40 | |
| Mean | 375.55 | 143.57 | 167.53 | 851.13 | 789.75 | 5.86 | 3.45 | |
| SD 3 | 95.29 | 107.03 | 32.34 | 142.14 | 151.80 | 3.40 | 0.13 | |
| As 4 | −1.01 | 0.92 | −1.13 | 0.25 | 0.01 | 1.07 | 0.76 | |
| K 5 | 1.50 | 1.32 | 3.21 | 0.17 | 1.06 | 1.50 | 0.32 | |
| Testing | Min 1 | 111.00 | 0.00 | 104.30 | 532.20 | 530.00 | 0.00 | 1.45 |
| Max 2 | 550.00 | 320.00 | 203.40 | 1200.00 | 1150.00 | 16.00 | 7.20 | |
| Mean | 347.36 | 147.79 | 163.56 | 828.85 | 829.21 | 5.41 | 3.61 | |
| SD 3 | 121.12 | 69.60 | 26.69 | 127.79 | 152.64 | 3.62 | 1.06 | |
| As 4 | −0.43 | 0.05 | −0.57 | 0.53 | 0.57 | 1.07 | 0.96 | |
| K 5 | −1.02 | −1.14 | −0.40 | 1.55 | −0.02 | 0.89 | 1.70 |
| R2 | Performance Rating | Forecasting Power |
|---|---|---|
| ≥0.95 | Excellent | Very accurate prediction |
| 0.75–0.95 | Very good | Prediction good |
| 0.65–0.75 | Satisfactory | Predicción acceptable |
| <0.65 | Unsatisfactory | Poor prediction accuracy |
| Parameters | XGBoost | GB | CB | ETR | |
|---|---|---|---|---|---|
| R2 | Testing | 0.8423 | 0.7709 | 0.7736 | 0.8143 |
| Training | 0.9421 | 0.9292 | 0.9382 | 0.9484 | |
| Overall | 0.8428 | 0.7717 | 0.7744 | 0.8149 | |
| RMSE | Testing | 0.0581 | 0.0700 | 0.0696 | 0.0636 |
| Training | 0.0329 | 0.0365 | 0.0341 | 0.0311 | |
| Overall | 0.0225 | 0.0270 | 0.0269 | 0.0244 | |
| MAE | Testing | 0.0443 | 0.0525 | 0.0516 | 0.0451 |
| Training | 0.0188 | 0.0239 | 0.0217 | 0.0127 | |
| Overall | 0.0066 | 0.0078 | 0.0077 | 0.0067 |
Publisher’s Note: MDPI stays neutral with regard to jurisdictional claims in published maps and institutional affiliations. |
© 2022 by the authors. Licensee MDPI, Basel, Switzerland. This article is an open access article distributed under the terms and conditions of the Creative Commons Attribution (CC BY) license (https://creativecommons.org/licenses/by/4.0/).
Share and Cite
de-Prado-Gil, J.; Palencia, C.; Jagadesh, P.; Martínez-García, R. A Comparison of Machine Learning Tools That Model the Splitting Tensile Strength of Self-Compacting Recycled Aggregate Concrete. Materials 2022, 15, 4164. https://doi.org/10.3390/ma15124164
de-Prado-Gil J, Palencia C, Jagadesh P, Martínez-García R. A Comparison of Machine Learning Tools That Model the Splitting Tensile Strength of Self-Compacting Recycled Aggregate Concrete. Materials. 2022; 15(12):4164. https://doi.org/10.3390/ma15124164
Chicago/Turabian Stylede-Prado-Gil, Jesús, Covadonga Palencia, P. Jagadesh, and Rebeca Martínez-García. 2022. "A Comparison of Machine Learning Tools That Model the Splitting Tensile Strength of Self-Compacting Recycled Aggregate Concrete" Materials 15, no. 12: 4164. https://doi.org/10.3390/ma15124164